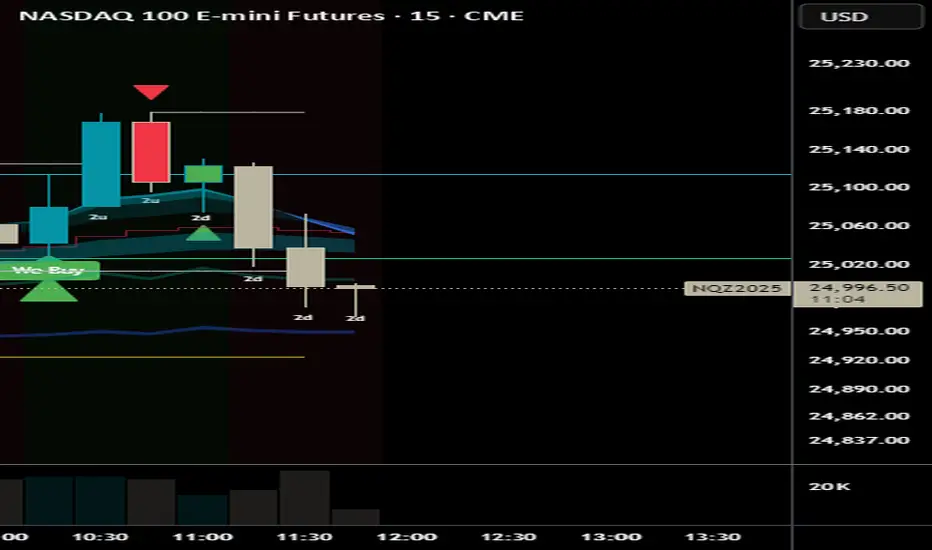
We Buy / We Sell - #TheStrat SignalsWe Buy / We Sell - #TheStrat SignalsDescription
This indicator is inspired by the #TheStrat methodology from Rob Smith, designed to identify high-probability "We Buy" (bullish) and "We Sell" (bearish) signals for trading stocks, ETFs, or futures like AMEX:SPY or $VSAT. It combines price action reversal patterns, higher timeframe continuity (HTFC), and optional broadening formation (BF) breaks to time entries with market momentum. Key Features: We Buy Signals: Triggered on a 2d-2u reversal (bearish to bullish candle) when the higher timeframe (HTF) is bullish (green) and optionally at a BF bottom (pivot low break). Labeled as "We Buy" at the candle’s low with a green triangle.
We Sell Signals: Triggered on a 2u-2d reversal (bullish to bearish candle) when the HTF is bearish (red) and optionally at a BF top (pivot high break). Labeled as "We Sell" at the candle’s high with a red triangle.
Candle Numbering: Displays #TheStrat candle types (1=Inside, 2u=Up, 2d=Down, 3=Outside) for context.
Debug Labels: Enabled by default, showing why signals don’t fire (e.g., "No HTFC Buy" if HTF isn’t bullish).
Partial Signals: Optional faint circles for 2d-2u or 2u-2d reversals (without HTFC/BF), disabled by default.
HTFC Background: Green (HTF bullish) or red (HTF bearish) background for timeframe alignment.
How It Works
Based on #TheStrat, the indicator seeks evidence of aggressive buying ("We Buy") or selling ("We Sell") by analyzing: Reversal Patterns: 2d-2u (We Buy): A bearish directional candle (2d) followed by a bullish directional candle (2u), signaling a potential bullish reversal.
2u-2d (We Sell): A bullish directional candle (2u) followed by a bearish directional candle (2d), signaling a potential bearish reversal.
Higher Timeframe Continuity (HTFC): We Buy requires the HTF (e.g., 1H or Daily) to close above its open (bullish).
We Sell requires the HTF to close below its open (bearish).
Broadening Formation (BF): Optional pivot high/low breaks approximate BF extremes (tops for We Sell, bottoms for We Buy).
Can be disabled (use_bf=false) for more frequent signals.
How to Use Setup: Apply to a 5min chart of a liquid asset (e.g., AMEX:SPY , NASDAQ:VSAT ) for intraday trading, or higher timeframes for swing trading.
Ensure sufficient chart history (TradingView > Chart Settings > Max Bars > 1000+).
Settings: Higher Timeframe (htf): Default "60" (1H). Try "15" (15min) for faster signals or "D" (Daily) for swing trades.
Pivot Lookback Length (pivot_len): Default 3. Lower to 1 for more signals, higher for stricter BF breaks.
Require Broadening Formation (use_bf): Default true. Set to false to skip BF checks, increasing signal frequency.
Show We Buy/We Sell Labels: Default true. Shows "We Buy" or "We Sell" on signal candles.
Show Candle Numbers: Default true. Displays 1/2u/2d/3 for #TheStrat context.
Show Debug Labels: Default true. Shows "No HTFC Buy", "No BF Buy", etc., to diagnose missing signals.
Show Partial Signals: Default false. Enable to show faint circles for 2d-2u/2u-2d reversals without HTFC/BF.
Trading: We Buy: Enter long on a green "We Buy" label (with triangle). Set stops below the signal candle’s low. Target BF highs or resistance.
We Sell: Enter short on a red "We Sell" label (with triangle). Set stops above the signal candle’s high. Target BF lows or support.
Use debug labels to understand why signals don’t fire (e.g., "No HTFC Buy" means HTF isn’t bullish).
Partial signals (faint circles) indicate reversals without full conditions, useful for discretionary setups.
Alerts: Right-click the indicator > "Add Alert" on we_buy or we_sell for real-time notifications.
Tips Best Assets: Use on liquid tickers like AMEX:SPY , NASDAQ:QQQ , or NASDAQ:VSAT , as seen in @AlexsOptions
’ examples.
Volatility: Signals are more frequent in trending or volatile markets. Check historical periods (e.g., September 2025) for testing.
Risk Management: Always use stops (e.g., 1-2% risk per trade) and validate signals with market context (e.g., sector/index alignment).
Learning #TheStrat: Study Rob Smith’s #TheStrat for deeper understanding of candle types and FTFC.
Troubleshooting No Signals? Check debug labels (e.g., "No HTFC Buy" means HTF isn’t bullish). Adjust htf (e.g., "15" or "D").
Set use_bf=false or lower pivot_len to 1 for more signals.
Ensure reversals (2d-2u or 2u-2d) are present (check candle numbers).
Test on volatile periods or liquid tickers.
No Partial Signals? Enable show_partial in settings to see faint circles for 2d-2u/2u-2d reversals.
Confirm reversal patterns exist (e.g., "2d" → "2u" in candle numbers).
Search in scripts for "参天公司+2025年股票走势"
TwistedHWAY Oracle - Intelligent Level Detection System═════════════════════════════════════════════════════════════════════════
🎯 TwistedHWAY Oracle™ - Intelligent Level Detection System
═════════════════════════════════════════════════════════════════════════
OVERVIEW
TwistedHWAY Oracle™ combines six independent calculation engines to identify high-probability support and resistance levels. The indicator uses adaptive market regime detection and confluence analysis to automatically rank levels by confidence score, helping traders identify key reaction zones where price is likely to find support or resistance.
KEY FEATURES
The indicator provides comprehensive level detection through:
Six Detection Engines — Each engine operates independently with its own alert system
Confluence Analysis — Automatically awards bonus confidence when multiple engines identify the same level
Adaptive Intelligence — Market volatility detection adjusts parameters in real-time
Confidence Scoring — Every level is ranked and displayed with a numerical confidence score
Individual Alerts — Separate alert controls for each detection method
DETECTION ENGINES
1 — Pivot Points Engine
Calculates daily pivot levels including PP, R1-R3, and S1-S3 using previous day's high, low, and close.
2 — Swing Detector
Identifies significant swing highs and lows using prominence filtering to eliminate noise.
3 — Psychological Matrix
Detects round number levels at three configurable increments (default: 10, 25, 50).
4 — Fibonacci Engine
Calculates retracement levels (23.6%, 38.2%, 50%, 61.8%, 78.6%) from major swings.
5 — VWAP System
Generates volume-weighted average price levels at three different periods.
6 — Confluence Analyzer
Awards bonus confidence points when multiple engines identify the same level.
HOW TO USE
Reading the Levels
Levels above current price = Resistance (red by default)
Levels below current price = Support (green by default)
Numbers in brackets show confidence score
Higher confidence = stronger level
Levels with score > 2.0 indicate extreme confluences
Trading Strategies
Bounce Trading — Enter positions when price approaches high-confidence levels expecting reversal
Breakout Trading — Trade breakouts through levels, using broken level as stop-loss
Confluence Zones — Focus on areas where multiple engines agree
SETTINGS GUIDE
Oracle Settings
Validation Mode — Conservative parameters for more reliable signals
Max Levels — Number of levels to display (10-50)
Level Extension — Line extension direction (None/Left/Right/Both)
Individual Engine Controls
Each engine can be toggled on/off with separate alert controls:
Pivot Engine (daily pivots)
Swing Detector (historical swings)
Psychological Matrix (round numbers)
Fibonacci Engine (retracements)
VWAP System (volume-weighted levels)
Visual Settings
Individual color selection for each level type
Label display toggle with size options
Line style preferences (Solid/Dashed/Dotted)
Alert Configuration
Alert Distance % — Proximity threshold (default: 0.5%)
Alert Cooldown — Minimum bars between alerts (default: 60)
Individual alert toggles for each engine
ADAPTIVE PARAMETERS
The indicator automatically adjusts to market conditions:
High Volatility Mode — Wider swing detection, stricter prominence filters
Normal Mode — Balanced parameters for typical market conditions
Validation Mode — Most conservative settings for reliable signals
Market regime is detected using 100-period volatility measurement with automatic threshold adjustment.
ALERTS
Five alert types plus special confluence alerts:
🎯 Pivot Alerts — Daily pivot level approaches
🌊 Swing Alerts — Historical swing level tests
🧠 Psychological Alerts — Round number approaches
🌀 Fibonacci Alerts — Retracement level tests
📉 VWAP Alerts — Volume-weighted level approaches
⚡ Critical Alerts — Ultra-high confidence levels (score ≥ 2.0)
Alerts include price level, confidence score, and source information.
BEST PRACTICES
Timeframe Selection
Works on all timeframes (optimized for 5min to Daily)
Higher timeframes = more reliable levels
Use multi-timeframe analysis for confirmation
Optimization by Instrument
Forex:
Psychological increments: 0.0010, 0.0050, 0.0100
Stocks (Low-priced):
Psychological increments: 1, 5, 10
Stocks (High-priced):
Psychological increments: 10, 25, 50
Crypto:
Adjust based on price range and volatility
LIMITATIONS
Calculation intensive on last bar (may cause slight delays)
Maximum 50 levels can be displayed simultaneously
Swing detection requires minimum 25 bars of history
VWAP calculations use price range as volume proxy when volume unavailable
NOTES
Levels are recalculated on each bar close
Confidence scores update dynamically with market conditions
Colors automatically adjust based on price position
All settings are saved with chart layout
═════════════════════════════════════════════════════════════════════════
Version: 3.0 | Build 2025.10
License: GNU GPL v3.0
© 2025 TwistedHWAY
═════════════════════════════════════════════════════════════════════════
Squeeze Momentum with ADX Filter and Multi-Cycle WavesTitle:
Squeeze Momentum with ADX Filter and Multi-Cycle Waves
Description:
This indicator integrates three well-established technical analysis methodologies into a single oscillator to help traders assess volatility compression, trend strength, and cyclical momentum alignment:
Squeeze Momentum (TTM-style) – Based on Bollinger Bands and Keltner Channels, it identifies periods of low volatility ("the squeeze") followed by directional breakouts. The histogram reflects momentum using linear regression relative to a dynamic centerline. Positive values indicate upward momentum; negative values indicate downward momentum.
ADX with DI+/DI- (Welles Wilder, 1978) – The Average Directional Index is dynamically scaled to match the visual range of the Squeeze histogram. A user-defined Key Level (default: 32) serves as a reference threshold: when ADX rises above this level, it suggests a strong trend is present. DI+ (green) and DI- (red) show directional bias.
Multi-Cycle Waves (55/144/233) – Inspired by adaptive cycle analysis and MACD-style oscillators, these smoothed momentum waves help identify confluence across multiple timeframes. They are optional and appear as shaded areas when enabled.
Key Features:
The Squeeze Momentum Line appears as black/gray crosses at the zero level, indicating momentum polarity without visual clutter.
The Key Level is shown as a thick gray horizontal line, representing the ADX threshold in the scaled oscillator space.
ADX is plotted with increased line width (3) for better visibility.
All components are dynamically scaled to share the same vertical axis, enabling direct visual comparison.
Attribution:
Bollinger Bands: John Bollinger
Keltner Channels: Chester Keltner
Squeeze concept popularized by Linda Raschke and John Carter
ADX/DI system: J. Welles Wilder Jr.
Multi-cycle wave logic: inspired by John Ehlers’ work on market cycles
Integration, scaling logic, and visualization: © Carlos Mauricio Vizcarra (2025)
This script is published under the Mozilla Public License v2.0. It is open-source, non-promotional, and designed for educational and analytical use only. No investment advice is provided.
CB Charts - GEX NQ/MNQ
Last Updated: 2025-10-14 12:59:34 PST
*DISCLAIMER: Only intended for NQZ2025/MNQZ2025 charts.
This indicator plots horizontal levels based on batched GEX levels for NQZ2025/MNQZ2025. The batched data is derived from contracts expiring: 0DTE, 1DTE, EoW, EoM, Next Week, Next Month and 3-months out. Labels are available for a high-level view of which levels are which. Hovering (or long-pressing on mobile TV) over the labels will display the nominal values and Rank. This script is manually updated and may not be always updated.
When and what to use:
- Most respected levels come from 1DTE, EoW and EoM.
- 0DTE is included for when this script becomes intraday updated. (CURRENTLY NOT UPDATED INTRADAY)
- Next Week setting is best used only for Friday and Sunday trading
- Next Month setting is best for weeks close to the end of the current month
Powered by the Camels of Wallstreet

ATH Levels v4# ATH Levels v4
A powerful indicator for tracking All-Time Highs (ATH) and setting customizable price levels based on percentage drops from the ATH. Perfect for cryptocurrency trading, DCA strategies, and risk management.
## Overview
ATH Levels v4 helps traders visualize key support levels calculated as percentage drops from the All-Time High within a configurable lookback period. The indicator also tracks the All-Time Low (ATL) since the last ATH, providing a complete picture of price range dynamics.
## Key Features
### Configurable Percentage Levels
- Define up to 8 custom price levels as percentage drops from ATH
- No longer limited to fixed 10% intervals
- Each level can be set anywhere from 0% to 100% drop
- Default levels: 10%, 20%, 30%, 40%, 50%, 60%, 70%, 80%
### ATL Tracking (NEW in v4)
- Automatically tracks the All-Time Low since the last ATH was reached
- Displays ATL price and percentage drop from ATH
- Resets when a new ATH is detected
- Can be toggled on/off
### Portfolio Management
- Allocate pot size percentages to each level
- Visualize dollar amounts for each level based on your total pot size
- Plan your DCA (Dollar Cost Averaging) strategy
- Only displays levels with allocated pot percentages
### Flexible Display Options
- Show/hide level lines
- Hide ATH level for zooming into lower levels
- Configurable lookback period (default 365 days)
- Adjustable right margin positioning for labels
- Color-coded labels with transparency gradient
## How to Use
### Basic Setup
1. Add the indicator to your chart
2. Set your total pot size in dollars
3. Configure the percentage drops for each level (where you want to buy/accumulate)
4. Allocate pot size percentages to each level
### Example DCA Strategy
```
Total Pot Size: $10,000
Level 3 (-30%): 10% pot = $1,000
Level 4 (-40%): 20% pot = $2,000
Level 5 (-50%): 25% pot = $2,500
Level 6 (-60%): 30% pot = $3,000
Level 7 (-70%): 10% pot = $1,000
Level 8 (-80%): 5% pot = $500
```
## Settings
### Display Options
- **Show level lines**: Toggle horizontal lines on/off
- **Hide ATH level**: Hide the ATH label for cleaner charts
- **Show ATL since last ATH**: Display/hide the All-Time Low indicator
- **Days to Lookback**: Period for calculating ATH (default: 365)
- **Margin from last bar**: Spacing between chart and labels (default: 10)
### Level Configuration
- **Level 1-8 % drop from ATH**: Set custom percentage drops (0-100%)
- **Level 1-8 pot %**: Allocate your portfolio percentage to each level (0-100%)
**Note**: Levels only display if they have a pot percentage allocated (>0%)
### Pot Size
- **Pot size**: Total amount in dollars available for the strategy
## Version History
### V4 (October 2025)
- Upgraded to PineScript v6
- Configurable percentage drops from ATH (no longer hardcoded)
- ATL tracking and display since last ATH
- Updated syntax and functions for v6 compatibility
### V3 (May 2020)
- Added option to hide ATH level for better chart zoom
### V2
- Hide/show level lines
- Configurable lookback period
- Configurable right margin
- Only shows levels with pot size % set
### V1
- Initial release with 8 fixed levels
## Use Cases
### Cryptocurrency Trading
- Plan accumulation zones during bear markets
- Set alerts at key percentage drops from ATH
- Track historical ATH and ATL ranges
### Risk Management
- Visualize potential support zones
- Plan position sizing at different levels
- Monitor distance from ATH in real-time
### DCA Strategies
- Automate dollar-cost averaging planning
- Allocate budget across multiple price levels
- Track execution of your DCA plan
## Technical Details
- **Version**: PineScript v6
- **Type**: Indicator
- **Overlay**: Yes
- **Default Timeframe**: Works on all timeframes
- **Calculations**: Based on closing prices within lookback period
## Credits
Original concept inspired by daytask. Enhanced and maintained by SilvesterScorpion.com
## License
This source code is subject to the terms of the Mozilla Public License 2.0 at mozilla.org
---
**Tip**: For best results, use on higher timeframes (4H, Daily, Weekly) to identify major support zones. Combine with volume analysis and other indicators for confirmation.


Aladin Pair Trading System v1Aladin Pair Trading System v1
What is This Indicator?
The Aladin Pair Trading System is a sophisticated tool designed to help traders identify profitable opportunities by comparing two related stocks that historically move together. Think of it as finding when one twin is running ahead or lagging behind the other - these moments often present trading opportunities as they tend to return to moving together.
Who Should Use This?
Beginners: Learn about statistical arbitrage and pair trading
Intermediate Traders: Execute mean-reversion strategies with confidence
Advanced Traders: Fine-tune parameters for optimal pair relationships
Portfolio Managers: Implement market-neutral strategies
💡 What is Pair Trading?
Imagine two ice cream shops next to each other. They usually have similar customer traffic because they're in the same area. If one day Shop A is packed while Shop B is empty, you might expect this imbalance to correct itself soon.
Pair trading works the same way:
You find two stocks that normally move together (like TCS and Infosys)
When one stock moves too far from the other, you trade expecting them to realign
You buy the lagging stock and sell the leading stock
When they come back together, you profit from both sides
Key Features
1. Z-Score Analysis
What it is: A statistical measure showing how far the price relationship has deviated from normal
What it means:
Z-Score near 0 = Normal relationship
Z-Score at +2 = Stock A is expensive relative to Stock B (Sell A, Buy B)
Z-Score at -2 = Stock A is cheap relative to Stock B (Buy A, Sell B)
2. Multiple Timeframe Analysis
Long-term Z-Score (300 bars): Shows the big picture trend
Short-term Z-Score (100 bars): Shows recent movements
Signal Z-Score (20 bars): Generates quick trading signals
3. Statistical Validation
The indicator checks if the pair is suitable for trading:
Correlation (must be > 0.7): Confirms the stocks move together
1.0 = Perfect positive correlation
0.7 = Strong correlation
Below 0.7 = Warning: pair may not be reliable
ADF P-Value (should be < 0.05): Tests if the relationship is stable
Low value = Good for pair trading
High value = Relationship may be random
Cointegration: Confirms long-term equilibrium relationship
YES = Pair tends to revert to mean
NO = Pair may drift apart permanently
Visual Elements Explained
Chart Zones (Color-Coded Areas)
Yellow Zone (-1.5 to +1.5)
Normal Zone: Relationship is stable
Action: Wait for better opportunities
Blue Zone (±1.5 to ±2.0)
Entry Zone: Deviation is significant
Action: Prepare for potential trades
Green/Red Zone (±2.0 to ±3.0)
Opportunity Zone: Strong deviation
Action: High-probability trade setups
Beyond ±3.0
Risk Limit: Extreme deviation
Action: Either maximum opportunity or structural break
Signal Arrows
Green Arrow Up (Buy A + Sell B):
Stock A is undervalued relative to B
Buy Stock A, Short Stock B
Red Arrow Down (Sell A + Buy B):
Stock A is overvalued relative to B
Sell Stock A, Buy Stock B
Settings Guide
Symbol Inputs
Pair Symbol (Symbol B): Choose the second stock to compare
Default: NSE:INFY (Infosys)
Example pairs: TCS/INFY, HDFCBANK/ICICIBANK, RELIANCE/ONGC
Z-Score Parameters
Long Z-Score Period (300): Historical context
Short Z-Score Period (100): Recent trend
Signal Period (20): Trading signals
Z-Score Threshold (2.0): Entry trigger level
Higher = Fewer but stronger signals
Lower = More frequent signals
Statistical Parameters
Correlation Period (240): How many bars to check correlation
Hurst Exponent Period (50): Measures mean-reversion tendency
Probability Lookback (100): Historical probability calculations
Trading Parameters
Entry Threshold (0.0): Minimum Z-score for entry
Risk Threshold (1.5): Warning level
Risk Limit (3.0): Maximum deviation to trade
How to Use (Step-by-Step)
Step 1: Choose Your Pair
Add the indicator to your chart (this becomes Stock A)
In settings, select Stock B (the comparison stock)
Choose stocks from the same sector for best results
Step 2: Verify Pair Quality
Check the Statistics Table (top-right corner):
✅ Correlation > 0.70 (Green = Good)
✅ ADF P-value < 0.05 (Green = Good)
✅ Cointegrated = YES (Green = Good)
If all three are green, the pair is suitable for trading!
Step 3: Wait for Signals
BUY SIGNAL (Green Arrow Up)
Z-Score crosses above -2.0
Action: Buy Stock A, Sell Stock B
Exit: When Z-Score returns to 0
SELL SIGNAL (Red Arrow Down)
Z-Score crosses below +2.0
Action: Sell Stock A, Buy Stock B
Exit: When Z-Score returns to 0
Step 4: Risk Management
Yellow Zone: Monitor only
Blue Zone: Prepare for entry
Green/Red Zone: Active trading zone
Beyond ±3.0: Maximum risk - use caution
⚠️ Important Warnings
Not All Pairs Work: Always check the statistics table first
Market Conditions Matter: Correlation can break during market stress
Use Stop Losses: Set stops at Z-Score ±3.5 or beyond
Position Sizing: Trade both legs with appropriate hedge ratios
Transaction Costs: Factor in brokerage and slippage for both stocks
Example Trade
Scenario: TCS vs INFOSYS
Correlation: 0.85 ✅
Z-Score: -2.3 (TCS is cheap vs INFY)
Action to be taken:
Buy 1lot of TCS Future
Sell 1lot of INFOSYS Future
Expected Outcome:
As Z-Score moves toward 0, TCS outperforms INFOSYS
Close both positions when Z-Score crosses 0
Profit from the convergence
Best Practices
Test Before Trading: Use paper trading first
Sector Focus: Choose pairs from the same industry
Monitor Statistics: Check correlation daily
Avoid News Events: Don't trade pairs during earnings/major news
Size Appropriately: Start small, scale with experience
Be Patient: Wait for high-quality setups (±2.0 or beyond)
What Makes This Indicator Unique?
Multi-timeframe Z-Score analysis: Three different perspectives
Statistical validation: Built-in correlation and cointegration tests
Visual risk zones: Easy-to-understand color-coded areas
Real-time statistics: Live pair quality monitoring
Beginner-friendly: Clear signals with educational zones
Technical Background
The indicator uses:
Engle-Granger Cointegration Test: Validates pair relationship
ADF (Augmented Dickey-Fuller) Test: Tests stationarity
Pearson Correlation: Measures linear relationship
Z-Score Normalization: Standardizes deviations
Log Returns: Handles price differences properly
Support & Community
For questions, suggestions, or to share your pair trading experiences:
Comment below the indicator
Share your successful pair combinations
Report any issues for quick fixes
Disclaimer
This indicator is for educational and informational purposes only. It does not constitute financial advice. Pair trading involves risk, including the risk of loss.
Always:
Do your own research
Understand the risks
Trade with money you can afford to lose
Consider consulting a financial advisor
📌 Quick Reference Card
Z-ScoreInterpretationAction-3.0 to -2.0A very cheap vs BStrong Buy A, Sell B-2.0 to -1.5A cheap vs BBuy A, Sell B-1.5 to +1.5Normal rangeHold/Wait+1.5 to +2.0A expensive vs BSell A, Buy B+2.0 to +3.0A very expensive vs BStrong Sell A, Buy B
Good Pair Statistics:
Correlation: > 0.70
ADF P-value: < 0.05
Cointegration: YES
Version: 1.0
Last Updated: 10th October 2025
Compatible: TradingView Pine Script v6
Happy Trading!

"Top 20 Crypto Coins Table Screener + SuperTrend & EMA 9/21 CrosThis indicator is a powerful table screener for the top 20 crypto coins, updated for 2025 and designed for maximum clarity and speed. It displays customizable columns for Symbol, Price, SuperTrend ("Up"/"Down"), and EMA 9/21 crossover signals ("Buy"/"Sell") across multiple assets on a single chart.
Features:
Covers 20 major coins (edit the symbol list for preferences).
SuperTrend direction and coloring, for quick visual identification of trend.
EMA 9/21 crossover logic for rapid momentum buy/sell decisions.
Fast table rendering, minimal lag—even on basic hardware.
All logic, table columns, and alerts directly built into the script.
How To Use:
Paste the indicator code into Pine Editor and save it.
Activate for your preferred timeframes and coins.
View the table at the top right for actionable signals.
Easy to customize ticker symbols and table layout.
Remarks:
No RSI, ADX, or TSI for speed—focus is on high-impact trend/momentum signals.
Ideal for day traders, swing traders, and crypto investors monitoring broader markets.
For questions, improvements, or feedback, comment on the script page or connect via TradingView.

Aggressive Options Trade Strategy - CALLS (2025+) - ASALEHMomentum-driven options strategy built for call buyers. Uses RSI, MACD, and EMA alignment with volatility filters to spot aggressive long setups and manage exits with profit targets and trailing stops.

ULTIMATE Smart Trading Pro 🔥
## 🇬🇧 ENGLISH
### 📊 The Most Complete All-in-One Trading Indicator
**ULTIMATE Smart Trading Pro** combines the best technical analysis tools and Smart Money Concepts into a single powerful and intelligent indicator. Designed for serious traders who want a real edge in the markets.
---
### ✨ KEY FEATURES
#### 💰 **SMART MONEY CONCEPTS**
- **Order Blocks**: Automatically detects institutional zones where "smart money" enters positions
- **Break of Structure (BOS)**: Identifies structure breaks to confirm trend changes
- **Liquidity Zones**: Spots equal highs/lows areas where institutions hunt stops
- **Market Structure**: Visually displays bullish (green background) or bearish (red background) structure
#### 📈 **ADVANCED TECHNICAL INDICATORS**
- **RSI with Auto Divergences**: Classic RSI + automatic detection of bullish and bearish divergences
- **MACD with Signals**: Identifies bullish and bearish crossovers in real-time
- **Dynamic Support & Resistance**: Adaptive zones with intelligent scoring based on volume, multiple touches, and ATR
- **Fair Value Gaps (FVG)**: Detects unfilled price gaps (imbalance zones)
#### 📐 **AUTOMATIC TOOLS**
- **Auto Fibonacci**: Automatically calculates Fibonacci retracement levels on the last major trend
- **Pivot Points**: Daily, Weekly, or Monthly pivot points (PP, R1, R2, S1, S2)
- **Pattern Finder**: Automatically detects candlestick patterns (Hammer, Shooting Star, Engulfing, Morning/Evening Star) and chart patterns (Double Top/Bottom)
---
### 🎯 HOW TO USE IT
#### Quick Setup:
1. **Add the indicator** to your chart
2. **Open Settings** and enable/disable modules as needed
3. **Adjust parameters** for your trading style (scalping, swing, day trading)
#### Optimal Trading Setup:
🔥 **ULTRA STRONG Signal** when you have:
- An institutional **Order Block**
- Aligned with a **Support/Resistance** tested 3+ times
- An unfilled **FVG** nearby
- An **RSI divergence** confirming the reversal
- On a key **Fibonacci** level (50%, 61.8%, or 78.6%)
- Favorable market structure (green background for buys, red for sells)
---
### 💡 UNIQUE ADVANTAGES
✅ **Adaptive Intelligence**: Automatically adjusts to market volatility (ATR)
✅ **Volume Filters**: Validates important levels with volume confirmation
✅ **Multi-Timeframe Ready**: Works on all timeframes (1m to 1M)
✅ **Complete Alerts**: Notifications for all important signals
✅ **Clear Interface**: Emojis and colored labels for quick identification
✅ **Intelligent Scoring**: Levels ranked by importance (🔴🔴🔴 = very strong)
✅ **100% Customizable**: Enable only what you need
---
### 🎨 SYMBOL LEGEND
**Smart Money:**
- 🟢 OB = Bullish Order Block
- 🔴 OB = Bearish Order Block
- BOS ↑/↓ = Break of Structure
- 💧 LIQ = Liquidity Zone
**Candlestick Patterns:**
- 🔨 = Hammer (bullish signal)
- ⭐ = Shooting Star (bearish signal)
- 📈 = Bullish Engulfing
- 📉 = Bearish Engulfing
- 🌅 = Morning Star (bullish reversal)
- 🌆 = Evening Star (bearish reversal)
**Indicators:**
- 🚀 MACD ↑ = Bullish crossover
- 📉 MACD ↓ = Bearish crossover
- ⚠️ DIV = Bearish RSI divergence
- ✅ DIV = Bullish RSI divergence
**Support & Resistance:**
- 🟢/🔴 S1, R1 = Support/Resistance
- 🟢🟢🟢/🔴🔴🔴 = VERY strong level (3+ touches)
- (×N) = Number of times touched
---
### ⚙️ RECOMMENDED SETTINGS
**For Scalping (1m - 5m):**
- SR Lookback: 15
- Structure Strength: 3
- RSI: 14
- Volume Filter: ON
**For Day Trading (15m - 1H):**
- SR Lookback: 20
- Structure Strength: 5
- RSI: 14
- All filters: ON
**For Swing Trading (4H - Daily):**
- SR Lookback: 30
- Structure Strength: 7
- Pattern Lookback: 100
- Fibonacci: ON
---
### 🚨 DISCLAIMER
This indicator is a decision support tool. It does not guarantee profits and does not constitute financial advice. Always test on a demo account before real use. Trading involves significant risks.
---
## 📞 SUPPORT & UPDATES
For questions, suggestions, or bug reports, please comment below or contact the author.
**Version:** 1.0
**Last Updated:** October 2025
**Compatible:** TradingView Pine Script v6
---
### 🌟 If you find this indicator useful, please give it a 👍 and share it with other traders!
**Happy Trading! 🚀📈**

Session Volume Spike Detector (MTF Arrows)Overview
The Session Volume Spike Detector is a precision multi-timeframe (MTF) tool that identifies sudden surges in buy or sell volume during key market windows. It highlights high-impact institutional participation by comparing current volume against its historical baseline and short-term highs, then plots directional markers on your chart.
This version adds MTF awareness, showing spikes from 1-minute, 5-minute, and 10-minute frames on a single chart. It’s ideal for traders monitoring microstructure shifts across multiple time compressions while staying on a fast chart (like 1-second or 1-minute).
Key Features
Dual Session Windows (DST-aware)
Automatically tracks Morning (05:30–08:30 MT) and Midday (11:00–13:30 MT) activity, adjusted for daylight savings.
Directional Spike Detection
Flags Buy spikes (green triangles) and Sell spikes (magenta triangles) using dynamic volume gates, Z-Score normalization, and recent-bar jump filters.
Multi-Timeframe Projection
Displays higher-timeframe (1m / 5m / 10m) spikes directly on your active chart for continuous visual context — even on sub-minute intervals.
Adaptive Volume Logic
Each spike is validated against:
Volume ≥ SMA × multiplier
Volume ≥ recent-high × jump factor
Optional Z-Score threshold for statistical significance
Session-Only Filtering
Ensures spikes are only plotted within specified trading sessions — ideal for futures or intraday equity traders.
Configurable Alerts
Built-in alert conditions for:
Any timeframe (MTF aggregate)
Individual 1m, 5m, or 10m windows
Alerts trigger only when a new qualifying spike appears at the close of its bar.
Use Cases
Detect algorithmic or institutional activity bursts inside your trading window.
Track confluence of volume surges across multiple timeframes.
Combine with FVGs, bank levels, or range breakouts to identify probable continuation or reversal zones.
Build custom automation or alert workflows around statistically unusual participation spikes.
Recommended Settings
Use on 1-minute chart for full MTF display.
Adjust the SMA length (default 20) and Z-Score threshold (default 3.0) to suit market volatility.
For scalping or high-frequency environments, disable the 10m layer to reduce visual clutter.
Credits
Developed by Jason Hyde
© 2025 — All rights reserved.
Designed for clarity, precision, and MTF-synchronized institutional volume detection.
PulseWave StrategyThe PulseWave Strategy is designed to identify trend-aligned momentum bursts in price action, using a combination of EMA trend filters, RSI momentum, and volume surge detection.
📌 Features
– Dual EMA crossover for trend direction
– RSI filter to avoid overbought/sold traps
– Volume surge detection to catch market "pulses"
– ATR-based trailing exit and trend-reversal stop
⚙️ Inputs You Can Customize
– EMA lengths
– RSI period and thresholds
– Volume surge sensitivity
– ATR length and trailing logic
📈 Backtest Sample (BTCUSD 1h)
– Return: +127%
– Win Rate: 54%
– Max Drawdown: 18%
– Period: Jan 2023 – Oct 2025
(Replace with your actual test results)
🔧 Built for educational use. Always validate on your own data and strategy framework before using live.
⚠️ Disclaimer
This tool is for research and educational purposes only. It is not financial advice. Trade responsibly and use proper risk management.

my_strategy_2.0Overview:
This is a high-speed scalping strategy optimized for volatile crypto assets (BTC, ETH, etc.) on timeframes 1m–5m. It combines trend-following SuperTrend with confirmations from MACD, RSI, Bollinger Bands, and volume spikes for precise entries. Focus on quick profits (1–3 ATR) with strict risk control: partial take-profits, stop-loss, and trailing breakeven after the first TP.
Key Signals:
Long: SuperTrend flip up + MACD crossover up + RSI >50 + BB Upper breakout + volume spike + volatility filter (ATR >0.5%).
Short: Similar but downward.
Exits and Risks:
TP: 33% at +1 ATR, 33% at +2 ATR, 34% at +3 ATR (customizable).
SL: Initial at -1 ATR, after TP1 — to breakeven with trailing on BB midline (optional).
Filters: Minimum ATR to avoid flat markets; realistic commissions in backtests.
Recommendations:
Test on 2020–2025 data (out-of-sample 2024+). Expected Win Rate ~55%, Profit Factor >1.8, Drawdown <10%. Ideal for 1–2% risk per trade. Not for beginners — use paper trading.
Disclaimer: Past results do not guarantee future performance. Trade at your own risk.
(Pine v6 code, ready for publication. Author: gopog777 with expert fixes.)

FVG Diamond📊 Overview
FVG Diamond is an advanced indicator that detects three specific price action patterns: Inside Bar, Outside Bar, and Diamond Formation. Unlike basic FVG tools, it focuses on these higher-level setups for more precise analysis.
✨ Key Features
🎯 Detection of 3 Advanced FVG Pattern Types
Independent on/off toggle for each pattern
Inside FVG (Inside Bar / Harami): The body of the 3rd candle forms an inside bar relative to the 2nd candle
Outside FVG (Outside Bar / Engulfing): The body of the 1st candle forms an outside bar relative to the 2nd candle
Diamond FVG (Diamond Formation): A unique pattern that satisfies both Inside and Outside conditions
🎯 Mitigation Feature
ON: FVG boxes are automatically removed once price fully fills the FVG zone (keeps the chart clean by showing only active FVGs)
OFF: FVG boxes remain on the chart indefinitely (allows full historical review of all FVGs)
🎨 Visual Features
Color Coding: Assign unique colors to each pattern type
Transparency Control: Default 70% transparency for optimal readability
Extension Display: Extend the right edge of FVG boxes for any number of bars
⚙️ Advanced Configuration
Threshold Settings
Manual Threshold: Define a minimum gap size by percentage
Auto Threshold: Dynamically adjusts based on market volatility
Mitigation Tools
Real-Time Mitigation: Automatic removal when price fills an FVG zone
Mitigation Levels: Display filled FVG levels with dashed lines
🔔 Alerts
Notification on new Bullish/Bearish FVG detection
Notification when an FVG is mitigated (filled)
Works with all FVG types
📈 How to Use
Add the indicator to your chart
The three advanced FVG patterns will be detected and displayed automatically
Set your preferred threshold (0% = detect all gaps)
⚠️ Note: This indicator is designed as an analysis support tool. Trading decisions should be made in combination with other methods of technical and fundamental analysis.
Author: omochi_
Version: 1.0
Last Updated: September 28, 2025
Macro & Earnings Dashboard — NY Fed CalendarMacro & Earnings Dashboard — NY Fed Calendar
This is an overlay indicator designed to provide a quick, real-time overview of the most critical upcoming US economic data releases and corporate earnings reports directly on your TradingView chart. It functions as a dynamic dashboard, removing the need to constantly check external calendars.
Key Features
1. Real-Time Economic Calendar (Bottom-Right Table)
The dashboard tracks the time remaining until the next release of five major, high-impact economic indicators. The data for these dates is pre-loaded directly from the New York Fed Economic Indicators Calendar (currently loaded for October through December 2025).
The tracked events include:
CPI (Consumer Price Index)
PPI (Producer Price Index)
Employment Situation (Non-Farm Payrolls / Unemployment Rate)
Interest Rate Decision (FOMC Meetings)
Consumer Sentiment (University of Michigan Survey)
2. Corporate Earnings Tracker (Top-Right Table)
This table uses TradingView's built-in data to calculate the estimated days remaining until the next Earnings Per Share (EPS) report for a curated list of high-profile NASDAQ tickers:
AAPL, NVDA, GOOG, TSLA, MSFT, AMZN, META
3. Color-Coded Urgency
The "Days" column for both macro and earnings tables uses a traffic light system to instantly communicate how soon the event is:
Red: The event is scheduled for Today or Tomorrow (0–1 day away).
Orange: The event is scheduled for the current week (within 6 days).
Teal: The event is more than a week away.
Gray: The date is currently unavailable or outside the loaded calendar range.

Anchored VWAP (Triple) MYRAXESAnchored VWAP Triple Indicator
The Anchored VWAP Triple indicator is a powerful tool for technical analysis, allowing traders to plot three customizable anchored Volume Weighted Average Price (VWAP) lines on a chart. Unlike traditional VWAP, which resets daily, this indicator lets you anchor each VWAP to a specific date and time, providing a unique perspective on price action relative to key market events.
Features
Three Independent VWAPs: Plot up to three VWAP lines, each anchored to a user-defined date and time.
Customizable Inputs: Set the year, month, day, hour, and minute for each VWAP anchor point. Choose distinct colors for easy identification.
Pure Anchored Design: VWAP lines start only from the anchor point, with no pre-anchor extensions, ensuring a clean and focused analysis.
Debug Mode: Optional display of hour and minute for troubleshooting or educational purposes.
Default Settings: Pre-configured with practical defaults (e.g., September 2025 dates) for immediate use.
How to Use
Add the indicator to your TradingView chart.
Adjust the anchor dates and times for each VWAP (VWAP 1, VWAP 2, VWAP 3) via the input settings.
Select custom colors for each VWAP line to differentiate them on the chart.
Enable Debug Mode if needed to verify time alignment.
Analyze price movements relative to the anchored VWAPs to identify support, resistance, or trend shifts.
Benefits
Ideal for swing traders and long-term analysts who need to anchor VWAP to significant price levels or events.
Enhances decision-making by comparing multiple VWAPs from different anchor points.
Fully compatible with TradingView’s Pine Script v6 for smooth performance.
This indicator is perfect for traders looking to deepen their market analysis with a flexible, multi-VWAP approach. Share your feedback or custom setups in the comments!
CB Charts - GEX MESZ2025/ESZ2025Last Updated: 09/22/2025 6:41 a.m. PST
*DISCLAIMER: Only intended for ESZ2025/MESZ2025 charts.
This indicator plots horizontal levels based on batched GEX levels for ESZ2025/MESZ2025. The batched data is derived from contracts expiring: 0DTE, 1DTE, EoW, EoM, Next Week, Next Month and 3-months out. Labels are available for a high-level view of which levels are which. Hovering (or long-pressing on mobile TV) over the labels will display the nominal values and Rank. This script is manually updated and may not be always updated.
When and what to use:
- Most respected levels come from 1DTE, EoW and EoM.
- 0DTE is included for when this script becomes intraday updated. (CURRENTLY NOT UPDATED INTRADAY)
- Next Week setting is best used only for Friday and Sunday trading
- Next Month setting is best for weeks close to the end of the current month
Powered by the Camels of Wallstreet

Japan Yen Carry Trade to Risk Ratio Sharpe Ratio By UncleBFMStep-by-Step Calculation in the ScriptFetch Rates:Pulls rates dynamically using request.security() from user-specified symbols (e.g., TVC:JP10Y for yen, TVC:US10Y for target). If unavailable (NA), uses fallback inputs (e.g., 0.25% for yen, 4.50% for target).
Converts rates to decimals: (target_rate - yen_rate) / 100.
Calculate Carry:Carry = (Target Rate - Yen Rate) / 100
Example: If US 10Y yield is 4.50% and Japan 10Y is 0.25%, carry = (4.50 - 0.25) / 100 = 0.0425 (4.25% annual yield).
Calculate Daily Log Returns:Log Returns = ln(Close / Close ), where Close is the current price of the pair (e.g., USDJPY) and Close is the previous day's price.
This measures daily percentage changes in a way suitable for volatility calculations.
Calculate Annualized Volatility:Volatility = Standard Deviation of Log Returns over a lookback period (default 63 days, ~3 months) × √252.
Example: If the standard deviation of USDJPY log returns is 0.005 (0.5% daily), annualized volatility = 0.005 × √252 ≈ 0.0794 (7.94%).
Compute the Ratio:Ratio = Carry / Volatility
Example: Using above, 0.0425 / 0.0794 ≈ 0.535.
If volatility is zero, the ratio is set to NA to avoid division errors.
Plot:Plots the ratio as a line, with optional thresholds (e.g., 0.2 for "high attractiveness") to guide interpretation.
NotesDynamic Rates: Using bond yields (e.g., TVC:JP10Y) or policy rates (e.g., ECONOMICS:JPINTR) makes the indicator responsive to historical and current rate changes, unlike static inputs.
Context: BIS reports use similar ratios to assess carry trade viability. For USDJPY in 2025, with Fed rates around 4.5% and BoJ at 0.25–0.5%, the carry is positive but sensitive to volatility spikes (e.g., during 2024 unwind events).
Usage: Apply to a yen pair chart (e.g., USDJPY, AUDJPY). Adjust symbols for the target currency (e.g., TVC:AU10Y for AUD). The ratio helps compare carry trade profitability across pairs or over time.

Ighodalo Gold - CRT (Candles are ranges theory)This indicator is designed to automatically identify and display CRT (Candles are Ranges Theory) Candles on your chart. It draws the high and low of the identified range and extends them until price breaks out, providing clear levels of support and resistance.
The Candles are Ranges Theory (CRT) concept was originally developed and shared by a trader named Romeotpt (Raid). All credit for the trading methodology goes to him. This indicator simply makes spotting these specific candles easier.
What is a CRT Candle & How Is It Used?
A CRT candle is a single candle that has both the highest high AND the lowest low over a user-defined period. It is identified by analysing a block of recent candles and finding the one candle that contains the entire price range of that block.
Once a CRT candle is formed, its high and low act as an accumulation range.
A break above or below this range is the manipulation phase.
A reclaim of the range (price closing back inside) signifies a potential distribution phase.
On higher timeframes, this sequence can be interpreted as:
Candle 1: Accumulation
Candle 2: Manipulation
Candle 3: Distribution
Reversal (Turtle Soup):
A sweep of the high or low, followed by a quick reclaim (price closing back inside the range), can signify a reversal. According to the theory’s originator, Romeo, this reversal pattern is called “turtle soup.”
After a bearish reversal at the high, the target becomes the CRT low.
After a bullish reversal at the low, the target becomes the CRT high.
How to Use This Indicator
The indicator is flexible and can be adapted to your trading style. The most important settings are:
Max Lookback Period: Number of past candles ("n") the indicator checks within to find a CRT.
CRT Timeframe:
Select a timeframe (e.g., 1H): The indicator will look at the higher timeframe you selected and plot the most recent CRT range from that timeframe onto your current chart. This is useful for multi-timeframe analysis.
Enable Overlapping CRTs:
False (unchecked): Shows only one active CRT range at a time. The indicator won’t look for a new one until the current range is broken.
True (checked): Constantly searches for and displays all CRT ranges it finds, allowing multiple ranges to appear on the chart simultaneously.
Disclaimer & Notes
-This is a visualisation tool and not a standalone trading signal. Always use it alongside your own analysis and risk management strategy.
-All credit for the "Candles are Ranges Theory" (CRT) concept goes to its creator, Romeotpt (Raid).
"On the journey to the opposite side of the range, price often provides multiple turtle soup entry opportunities. Follow their footprints." — Raid, 2025

Relative Strength Comparison-NewShRelative Strength Comparison Script created by Shahbaz on 19th Sep 2025
Heikin FlowHeikin Flow
by Ben Deharde, 2025
Overview
Heikin Flow is a trend and momentum oscillator built on a smoothed reverse-Heikin-Ashi baseline. It quantifies the distance between price and this baseline, then colors the histogram to reflect both direction and acceleration/deceleration. Use it standalone to read trend energy and shifts, or pair it with Heikin Rider for momentum-aware breakout confirmation.
What It Does
Computes a reverse-HA baseline and optionally smooths it with a selectable MA.
Plots a histogram of distance (price minus baseline) to visualize directional pressure.
Colors the histogram by trend state (above/below baseline) and momentum (accelerating vs. decelerating).
Provides alerts on zero-line crosses to spotlight potential momentum regime changes.
The histogram also helps to spot divergence between price and momentum (e.g., price making new highs while the histogram weakens).
How It Works
Reverse-HA Baseline
Heikin Flow derives a “reverse close” value from Heikin Ashi context (using prior HA open/close with current bar range) to capture underlying pressure. This value is range-bounded to avoid extremes, then optionally smoothed. The resulting line acts as a soft directional baseline.
Smoothing (Noise Control)
Choose SMA/EMA/HMA/VWMA/RMA and a length to control baseline responsiveness. Shorter lengths react faster, longer lengths emphasize trend consistency by filtering noise—useful when pairing with breakout tools like Rider.
Trend & Momentum Logic
Trend: If price is above the baseline, the environment is considered uptrend; below indicates downtrend.
Momentum: The change in distance bar-to-bar distinguishes acceleration (growing distance) from deceleration (shrinking distance).
This dual readout helps you see not just direction, but the quality of that direction—strong push vs. weakening move.
Coloring (Aligned with Heikin Rider Palette)
Deep Blue: Uptrend & accelerating
Light Blue: Uptrend & decelerating
Deep Red: Downtrend & accelerating
Soft Orange: Downtrend & decelerating
This mirrors the palette logic from Heikin Rider for immediate visual consistency across the suite.
How to use
Read the histogram above/below zero (price–baseline) as directional bias; watch color changes for momentum context.
Use zero-line crosses as momentum regime shifts; confirm with price action or Heikin Rider breakout signals.
Watch for divergence between price action and the histogram as an early clue of weakening moves.
Adjust smoothing method/length to fit your market and timeframe—faster for scalping, slower to highlight sustained trends.
Inputs
Smoothing Type & Length for the baseline (SMA/EMA/HMA/VWMA/RMA)
Info Box toggles (display and formatting)
Live Mode option for real-time vs. confirmed-bar behavior (avoids inadvertent lookahead)
Originality
Heikin Flow adapts the HA-driven methodology to an oscillator that focuses on distance-to-baseline and momentum quality, using a reverse-HA construction and flexible MA smoothing—complementing Heikin Rider’s smoothed HA envelope breakout design for a cohesive, momentum-aware workflow.
Alerts
Bullish Heikin Flow Cross — distance crosses above 0 (on bar close)
Bearish Heikin Flow Cross — distance crosses below 0 (on bar close)

Iani SMC Sniper XAU v2.2 (Long+Short + News Countdown, v6)Iani SMC Sniper v2.6 — Anytime • Auto Pip • FVG 50% • OB • News Panel
Smart-Money Concepts made simple for intraday XAU/USD (works on any symbol).
Finds BOS, 50% FVG “sniper” entries, optional Order Blocks, London H/L, news countdown, and a mini info panel.
What it does
BOS (Break of Structure): detects bullish/bearish BOS after London sweep logic.
FVG 50% entries: plots precise long/short entry dots at the midpoint of the gap.
Auto TP/SL: TP = RR × risk, SL below/above recent swing with a small buffer.
Order Blocks (optional): marks the last opposite candle after BOS and alerts on OB revisit.
London High/Low: tracks session range; session filter is optional.
News countdown: shows next event time and minutes left (user-selectable timezone).
Mini Panel: top-left table with Trend (last BOS), Next news, R:R, Pip size.
Inputs (key)
Auto pip size: uses syminfo.mintick. Manual override available.
Risk:Reward (RR): default 2.0.
Pivot length: swing sensitivity.
Sessions: enable if you want signals only 12:00–20:00 (symbol timezone). Off = anytime.
News timezone: pick your own (e.g., Europe/Brussels, America/New_York).
Absolute & daily times: add your events (strings like 2025-09-17 20:00 or 14:30,16:00…).
Show labels/levels/OBs: toggle on/off.
Alerts included
BOS Bullish / BOS Bearish
BUY Entry / SELL Entry (return to 50% FVG)
Bullish OB revisit / Bearish OB revisit
TP Long/Short reached, SL Long/Short hit
NEWS WARNING (warning window only; does not block signals)
To use: Add Alert → Condition: this indicator → choose any of the alertconditions.
Best use
Bias: H1 for structure.
Execution: M15 (standard) or M5 (aggressive).
Works great on XAUUSD, but is symbol-agnostic (auto pip adapts).
Notes
News times display in the timezone you pick in settings.
OBs are a simple implementation meant for quick visual guidance.
Labels: BUY/SELL near entries, TP/SL on set and when hit, BOS up/down.
Risk disclaimer
This tool is for education only. Not financial advice. Backtest and manage risk.

Reference timesThe theory behind this indicator is that sometimes the graph reaches a certain price at at a certain time according to the price it had at the same time and day in any of the previous weeks. If you could easily see what happened a few weeks ago on this day's weekday and half an hour from now, you might theoretically gain more assurance as to where the graph might go in the next half an hour.
This of course relies of the premise that some traders choose to enter or exit positions according to historical times they are referencing. Hence the name - Reference times.
Example:
it is now 08:00 ET Wednesday. I want to guess what the graph will do in the next half hour. I enter in the indicator the weekday "Wednesday", the time "8:30", and go to 30 minute candles.
I will then see all the candles the graph has been on historical Wednesdays at 8:30. If the candles are below the 08:00 price, we might guess that the graph might want to descent. If they are above the graph, we might guess that the graph might ascend.
How it works:
The user defines a weekday and time he wants to inquire on.
The script searches for past weekdays and similar hours.
It marks these bars at their wicks.
The user can also inquire "opposite hours" - 12 hours ahead or earlier.
The user can also inquire "opposite days" - Monday<->Wednesday, Tuesday<->Thursday.
In addition, the User may inquire the previous day of his selected weekday, which will mark the most recent previous day existent.
Side note: The Time zone offset is set for Jerusalem time. and so it may need future adjustment.
send debugging instances if you find any
Thank you
Assaf Fogelman 2025
