Bollinger Bands x3 with Fill + HMA + Dynamic Width Colors📄 Description for TradingView Publication:
This is an enhanced and flexible version of the classic Bollinger Bands indicator, designed for traders who want deeper insight into market volatility and price structure.
🔹 Key Features:
✅ Triple Bollinger Bands
Displays 3 standard deviation bands: ±1σ, ±2σ, and ±3σ
Customize each deviation level independently
✅ Dynamic Band Width Coloring
Band lines change color when the distance between upper and lower bands narrows
Helps identify volatility contractions and potential squeeze setups
✅ Dynamic Fill Coloring
Fill between bands also changes color when the bands narrow
Visually highlights transitions from high to low volatility conditions
✅ Multiple Moving Average Options
Choose from:
Simple Moving Average (SMA)
Exponential Moving Average (EMA)
Smoothed Moving Average (SMMA / RMA)
Weighted Moving Average (WMA)
Volume-Weighted Moving Average (VWMA)
Hull Moving Average (HMA) for a smoother, more responsive central tendency
✅ Customization Options
Show/hide each band individually
Adjust standard deviation multipliers
Toggle fills between bands
Customize fill colors for normal and narrowing conditions
Offset option to shift all plots forward or backward
💡 Use Case Tips:
When all bands begin narrowing, it could signal an upcoming volatility expansion or breakout.
Use the ±3σ bands to gauge extreme price behavior, and ±1σ for short-term mean reversion.
Combine with price action, momentum, or volume for breakout confirmation.
🧰 Recommended For:
Volatility traders
Mean reversion strategies
Breakout traders
Trend confirmation and structure analysis
Search in scripts for "弘历投教boll指标代码分析"

Bollinger Bands + EMA 200 + EMA 50This indicator combines three technical analysis tools: the Bollinger Bands (BB), and two Exponential Moving Averages (EMA) with periods of 200 and 50.
Bollinger Bands (BB): This indicator consists of three lines—the middle line being a simple moving average (SMA), and the upper and lower bands representing two standard deviations above and below the SMA. The width of the bands indicates market volatility, with wider bands signifying higher volatility and narrower bands indicating lower volatility.
Exponential Moving Averages (EMA 200 and EMA 50): The EMA is a type of moving average that gives more weight to recent prices, making it more responsive to price changes than the simple moving average. The EMA 200 is considered a long-term trend indicator, often used to identify the overall direction of the market. The EMA 50 is a medium-term trend indicator, helping to spot more immediate market trends. Crossovers between these two EMAs (such as when EMA 50 crosses above EMA 200) are commonly used as buy or sell signals, with the idea that a short-term trend shift is occurring.
By combining these three indicators, this custom Pine Script aims to give a comprehensive view of the market conditions, helping traders to understand both the volatility (via BB), the long-term market trend (via EMA 200), and the medium-term trend (via EMA 50). The interaction between the price and these indicators, along with crossovers, can be used to identify potential entry and exit points.

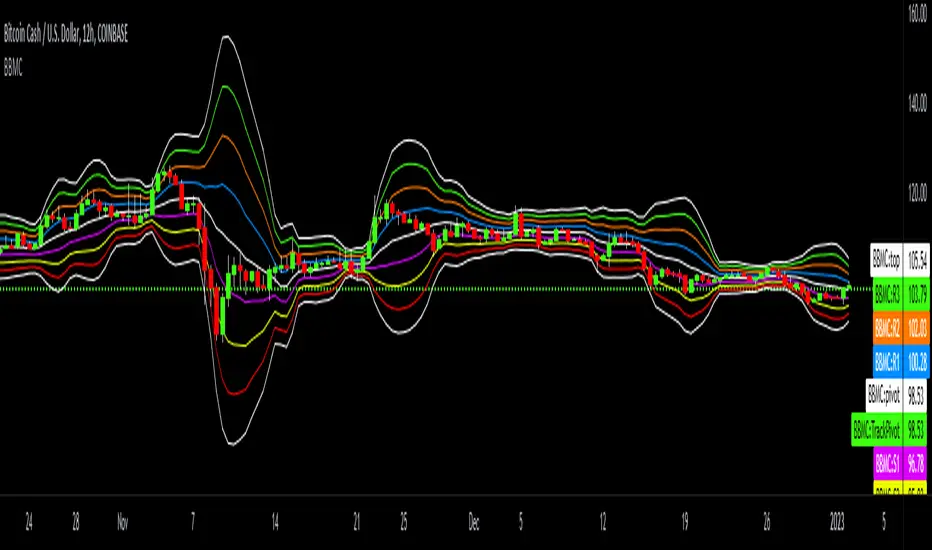
Bollinger-Bands.Multi_Choice(BBMC) "Bollinger-Bands.Multi_Choice" indicator gives the end user a choice of which Moving Average they want to use.
The MA choices available are:
SMA = simple moving average
EMA = exponentially weighted moving average
RMA = moving average used in RSI
WMA = weighted moving average
VWMA = volume weighted moving average
VWAP = volume weighted average price
HMA = Hull moving average
SWMA = symmetrically weighted moving average
ALMA = Arnaud Legoux moving average
The default setting inputs are:
source = OHLC4
length = 13
ALMA offset = 0.89
ALMA sigma = 5
Moving average type = VWMA
Level 1 standard deviation = 1.0
Level 2 standard deviation = 2.0
Level 3 standard deviation = 3.0
Level 3 standard deviation = 4.0
The default setting colors are:
Top = white
R3 = green
R2 = orange
R1 = blue
pivot = white
(track pivot line = bullish is green, bearish is red)
S1 = purple
S2 = yellow
S3 = red
Bottom = white
I made this indicator from an idea I had for a few months with the help of pine coder scripts before me. Kudos to @TradingView & @Madrid.
* This script uses altered pieces of code from @TradingView "Intrabar Efficiency Ratio indicator" & @Madrid "Bollinger Bands indicator" *
Bollinger Bands (Bad Ass B-Bands) - Wyckoff ModeHi Everyone! It's time to make this indicator public reduce the load off of me for others requesting access... This particular version of Bad Ass B-Bands has a minor change in the default settings to reduce the thickness of the B-Bands to number 1 thickness instead of a default to number 2 thickness. Feel free to adjust the colors to your personal preference to work well with the background color of your choosing.
DEFAULT INPUTS:
The Standard Deviation for White Upper B-Band = Positive 1.0
The Standard Deviation for White Lower B-Band = Negative 1.0
The Standard Deviation for Aqua Upper B-Band = Positive 1.618
The Standard Deviation for Aqua Upper B-Band = Negative 1.618
The Standard Deviation for Orange Upper B-Band = Positive 2.618
The Standard Deviation for Orange Upper B-Band = Negative 2.618
The Standard Deviation for Red Upper B-Band = Positive 3.618
The Standard Deviation for Red Upper B-Band = Negative 3.618
The Yellow B-Band BASIS is setup for 20-Moving Average
It's EXTREMELY IMPORTANT to use this indicator with my Phoenix Ascending 2.201 indicator to get a better indication of where the price action can run up to or down to in most any time frame.
BASIC RULES BELOW: Be advised these rules are ONLY BASIC... More detailed rules will be made available in the future.
If the Red RSI inside Phoenix Ascending indicator goes above level 50, there's a chance for price action to run up to the Aqua/Orange UPPER B-Bands.
If the Blue LSMA inside the Phoenix Ascending indicator goes above level 50, there's a chance for the B-Bands to expand and the body of each candle to remain inside the Aqua/Orange UPPER B-Bands until the B-Bands begin to flatten and/or contract.
If the Red RSI inside the Phoenix Ascending indicator goes below level 50, there's a CHANCE for the price action to fall down to the Aqua/Orange LOWER B-Bands.
If the Blue LSMA inside the phoenix Ascending indicator goes below level 50, there's a CHANCE for the B-Bands to expand and the body of each candle to remain inside the Aqua/Orange LOWER B-Bands until the B-Bands begin to flatten and/or contract.
If the Green Line falls down to level 50 inside the Phoenix Ascending Indicator, there's a CHANCE for the price action to fall to the Yellow B-Band Basis.
If the Green Line runs up to level 50 inside the Phoenix Ascending Indicator, there's a CHANCE for the price action to run up to the Yellow B-Band Basis.
REMINDER: The rules above are ONLY "BASIC" RULES. Additional rules will be available in the future.
Happy Trading and Stay Awesome!
David
SETUP VIDEO FOR PHOENIX ASCENDING 2.201 and BOLLINGER BANDS:

Bollinger Band+ Multi EMA, SMAHello Everyone.
I make Bollinger band , 3 ema and 3 sma combined.
I think this indicator can use all timeframe.
--------------------------------------------------------------
Indicator will show you
1. Trend follow
2. Pullback catch
2. Market bounce.
1. Trend Follow
- Trend Follow for I used 3 terms. They are short, Mid and Long Trend.
2. Pullback Catch
- EMA for Save, take care, alert Zones.
- Mid Term Trend can be catch also.
3. Market Bounce
- Bollinger Band will show you market re-bounce point.
Final Notes
Indicator will show Trend, Pullback, Market bounce and some support and resistant level.

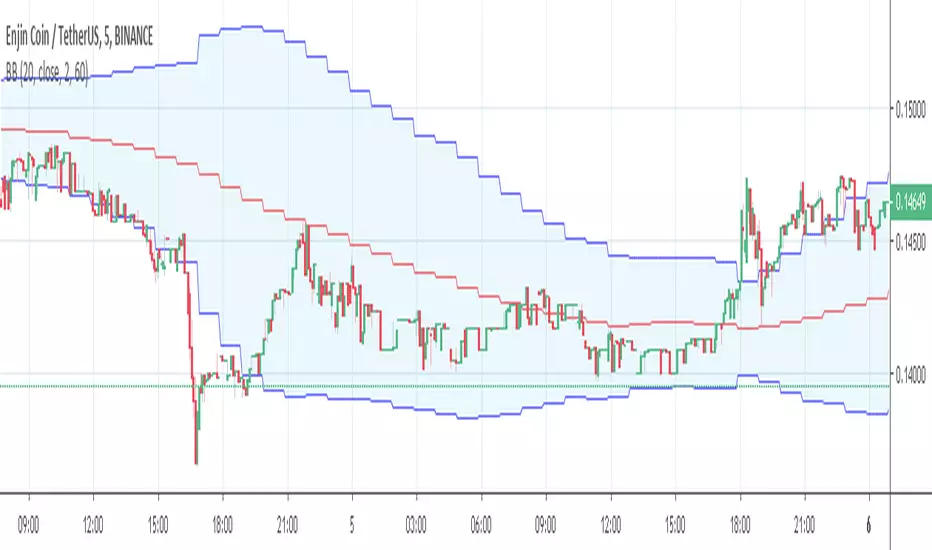
Bollinger Bands MultiThree different "Bollinger bands", which can be set individually. With this script, the "length", the "standard deviation" (StdDef), the "offset" and the "source" can be set for each band. The script is very clear. The basis of the script is the standard indicator "Bollinger Bands".
The script can be used for all markets and all time units.

Bollinger percentidea taken from scri [t of ridvansozen1
I just make the trend by using the diffrence between upper bollinger percentage to lower bollinger percentage bands
try to play with setting to better results

Bollinger Bands Multi Time FrameThis script is for using Bollinger Bands at different time frames. I usually use it at 5m chart while Bollinger Bands at 1 hour resolution.
APEX - Bollinger Bands WidthBollinger Bands Width (BBW) is an indicator derived from the Bollinger Bands indicator. BBW are measuring the volatility of an asset. The plotted curve will help you identify high and low volatility areas. Some strategies work only if there is some level of Volatility whereas others not enjoy it. When creating your strategy have a look at numbers between 0.02 – 0.10 (2 to 10 percent on 5m timeframe ) is the most common value. You can also easily avoid big pumps/dumps by using BBW in your strategy.

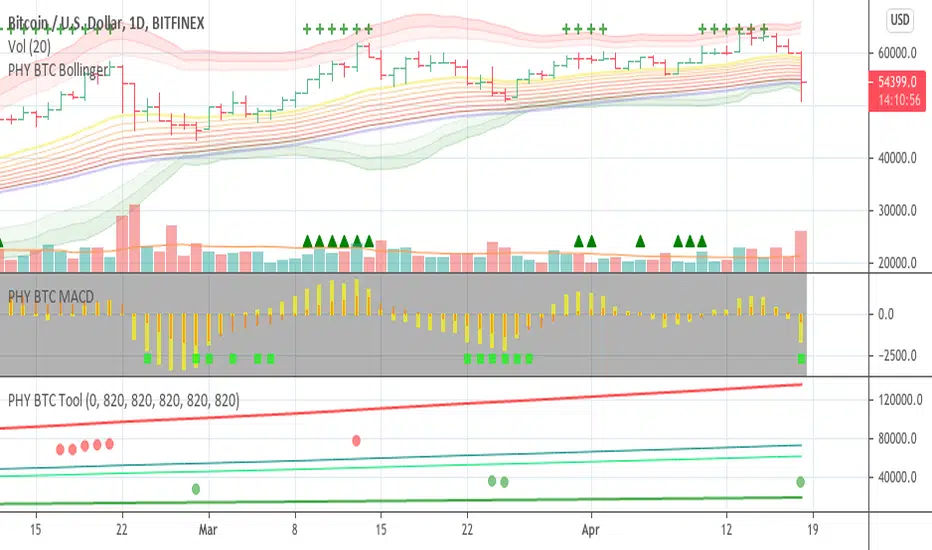
Bollinger Bands Physics with SMA 50 and EMA 15// opening bollinger bands green triangle at bottom
// sma 50 orange line
// ema 15 green line
// low above ema, and ema above sma, and diff of sma and ema increasing teal on top
// opposite red X at bottom
// use with MACD double Physics
// thank you to other users on tradingview for code for bollinger bands, sma, ema script
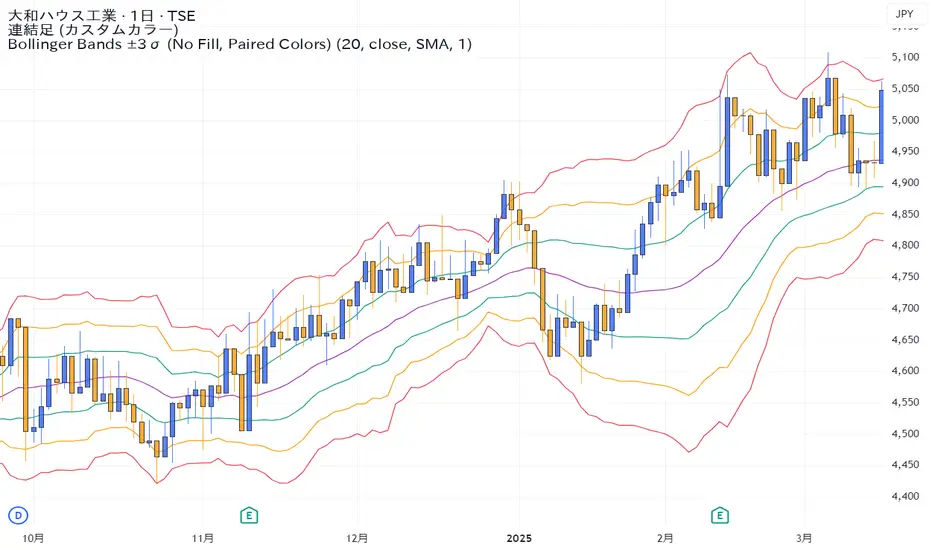
Bollinger Bands ±3σ (No Fill, Paired Colors)±3σまで1つのインジケーターで表示できるシンプルなボリンジャーバンドです。
A simple Bollinger Bands indicator that can display up to ±3σ within a single script.
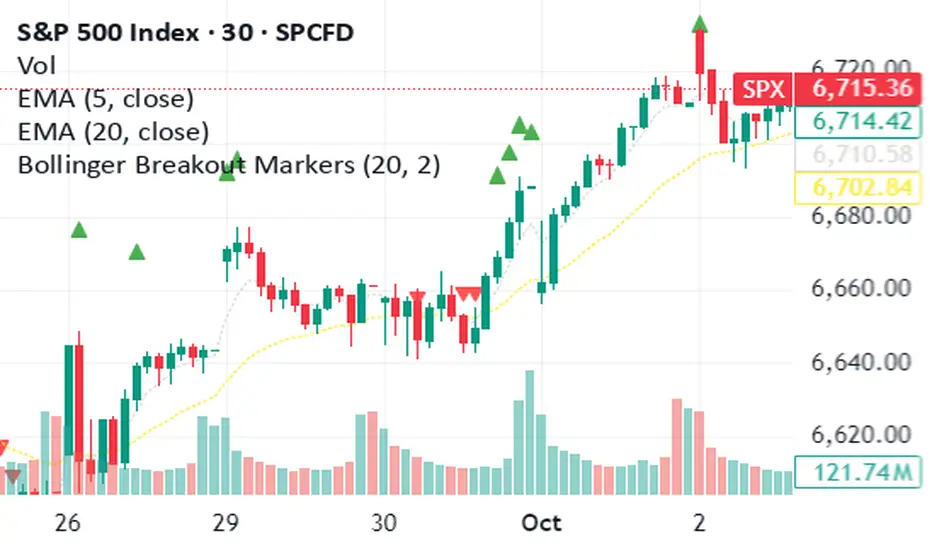
Bollinger Breakout Candle ShadingSubtle shading behind the bars when the price trades outside of the Bollinger bands.

Bollinger Breakout MarkersSubtle triangle markers that indicate when price extends out of the Bollinger bands to indicate overbought and oversold conditions
Bollinger Bands with Narrow ConsolidationThe indicator is based on the standard Bollinger Bands indicator in TradingView. Its main difference is the ability to display narrow consolidation zones (with an adjustable percentage) and generate signals in these zones.
Narrow consolidation zones can be considered as a signal before the start of a strong trend, whether upward or downward.
Индикатор построен на стандартном индикаторе полос боллинджера в трейдинг вью. Его отличие заключается в том, что здесь есть возможность отображения зон узкой консолидации (процент настраивается) и генерации сигналов на этих зонах.
Зоны узкой консолидации можно рассматривать как сигнал перед началом сильного треда как восходящего, так и нисходящего.

Bollinger Band Touch with SMI and MACD AngleThis strategy is intended for short timeframes to enter and exit when price touches lower and upper bollinger bands with confluence on RSI and MACD

Bollinger Bands Volatility Arrows
Explanation of Changes:
Arrow Style:
Green Up Arrow (▲): Indicates increasing volatility with a positive value.
Red Down Arrow (▼): Indicates decreasing volatility with a negative value.
Labels with Arrows:
label.new is used to create arrows with the label.style_label_up or label.style_label_down styles.
The numerical value of the volatility is displayed beside the arrow using str.tostring.
Label Position:
For increasing volatility, the green arrow is placed near the high of the candle.
For decreasing volatility, the red arrow is placed near the low of the candle.
Text Format:
Includes the arrow symbol and the volatility value (formatted to 4 decimal places).
How It Works:
You’ll see green upward arrows for increasing volatility and red downward arrows for decreasing volatility.
Each arrow includes the exact value of the Bollinger Bands width at that moment.

Bollinger Bands with momentum SMA'sA useful tool to look for add on opportunities. The settiing are such that 4Hr shows a Bollinger band for the daily TF. That's the settings to get a higher time frame picture but with a lower time frame focus

Bollinger Bands Width TresholdsBasic Bollinger Bands Bandwidth. I added dashed lines to indicate the 6%/9% treshold where it's likely to squeeze.

Bollinger Bands Strategy (MA type)The types of moving averages that Mr. Kıvanç Özbilgiç uses in his indicators and especially the "MACD Reloaded" and "SuperTrended Moving Averages" indicators gave me an idea.
Better results can be obtained in different time frames by increasing the range of Moving averages used in Bollinger Bands.
It is a trial and educational work only.

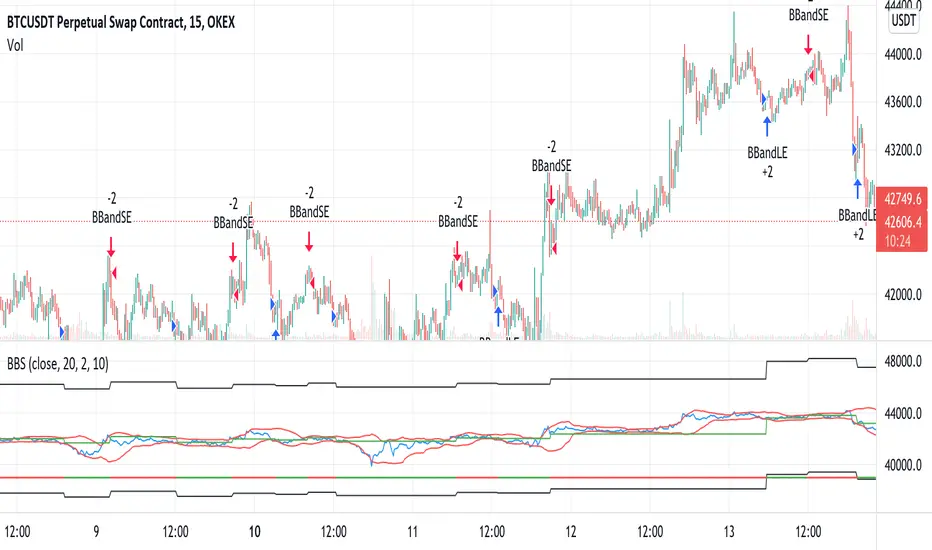
Bollinger Bands Strategy with StopLossThis is the default Bollinger Bands Strategy with a small change to support Stop Loss.
The default built-int BBS does not support Stop Loss and using it may cause large losses, specially in margin trading.
Added inputs:
Source
Stop Loss Percentage
Bollinger band & Volume based strategy V2this script is upgraded version of previous one the major change is deleted script which find a highest price after entry the last of strategy is same.
If current volume is above daily average volume, and three bollinger band`s Standard Deviation, 1 and 1.5 and 2 if the current lowest price is bigger then 1 stdev and current closed is bigger then 1.5 stdev and the last,highest price is above 2.0 stdev, it defined current market is bullish and had momentum.
and the Short will entered when ma60 and ma120 is undercrossed it work as prevent current price is way lower then entry price.
**this script is working in 15min Only in BTC market or USDT**
** basic equity setting is 500$, set your own**
**if you will use this in real-trade,plz comment the result to me**
Ps: i wanna know why my script is only working well in 15 min tick, anyone who has similar phenomenon or if you had a answer about it, please comment me.

Bollinger Bands Ultra [DM]Greetings Colleagues
I share here the classic Bollinger Bands indicator
From the Alma series that I am sharing, this is the third.
Fibonacci levels have been added to the bands to the delight of those who use this technique.
The moving average has also been replaced by an Arnaud legoux moving average
- Available settings:
1. MA length, deviation and offset
2. Individual settings for the MA "basis" (offset and sigma)
3. Activate or deactivate recurring alerts at the crossing of the mean and the ends of the bands
4. Color shift of the Moving average "basis"
5. Color change of the body of the bands
6. Bar color change
If you like them, I encourage you to share the most suitable settings you found for this variant.

Bollinger Bands SRThis simple script base on Bollinger Bands to defined Support and Resistance and marked Bar False broken SR by Reversal Arrow. Detail of rule as below:
================================================
1.Defined Support and Resistance
1.1.Support
+ Key bar:
- Open Price lower than BB lower band, Close Price higher than BB lower band
+ Support Zone:
- Bottom Zone place at Low Price of Key bar
- Top Zone place at Median Price (HL2) of Key bar
1.2.Resistance
+ Key bar:
- Open Price higher than BB upper band, Close Price lower than BB upper band
+ Resistance Zone:
- Bottom Zone place at Median Price (HL2) of Key bar
- Top Zone place at High Price of Key bar
1.3.Median Line
+ Median Line place at half of Range limit by Support and Resistance
================================================
2.Defined False Break
2.1.Defined Bull Trap
+ High Price higher than Top of Resistance Zone
+ Close Price lower than Top of Resistance Zone
+ Open Price higher than Bottom of Resistance Zone
+ Bar Direction is downward
+ Body of current Bar greater than Body of previous bar
2.2.Defined Bear Trap
+ Low Price lower than Bottom of Support Zone
+ Close Price higher than Bottom of Support Zone
+ Open Price lower than Top of Support Zone
+ Bar Direction is upward
+ Body of current Bar greater than Body of previous bar
================================================
3.Defined Reversal Arrow and Alert
+ Arrow Down when Bull Trap appear
+ Arrow Up when Bear Trap appear
+ Alert when Reversal Arrow appear
================================================
4.Trading
4.1.Long Position
+ Consider open positon when Arrow Up appear
+ Stoploss place at Low Price of Arrow Bar
+ Take profit at Resistance Zone
+ Consider Exit Position when:
- Price moving above Median Line and has Bearish Reversal Pattern
4.2.Short Position
+ Consider open positon when Arrow Down appear
+ Stoploss place at High Price of Arrow Bar
+ Take profit at Support Zone
+ Consider Exit Position when:
- Price moving below Median Line and has Bullish Reversal Pattern
