ADX Forecast Colorful [DiFlip]ADX Forecast Colorful
Introducing one of the most advanced ADX indicators available — a fully customizable analytical tool that integrates forward-looking forecasting capabilities. ADX Forecast Colorful is a scientific evolution of the classic ADX, designed to anticipate future trend strength using linear regression. Instead of merely reacting to historical data, this indicator projects the future behavior of the ADX, giving traders a strategic edge in trend analysis.
⯁ Real-Time ADX Forecasting
For the first time, a public ADX indicator incorporates linear regression (least squares method) to forecast the future behavior of ADX. This breakthrough approach enables traders to anticipate trend strength changes based on historical momentum. By applying linear regression to the ADX, the indicator plots a projected trendline n periods ahead — helping users make more accurate and timely trading decisions.
⯁ Highly Customizable
The indicator adapts seamlessly to any trading style. It offers a total of 26 long entry conditions and 26 short entry conditions, making it one of the most configurable ADX tools on TradingView. Each condition is fully adjustable, enabling the creation of statistical, quantitative, and automated strategies. You maintain full control over the signals to align perfectly with your system.
⯁ Innovative and Science-Based
This is the first public ADX indicator to apply least-squares predictive modeling to ADX dynamics. Technically, it embeds machine learning logic into a traditional trend-strength indicator. Using linear regression as a predictive engine adds powerful statistical rigor to the ADX, turning it into an intelligent, forward-looking signal generator.
⯁ Scientific Foundation: Linear Regression
Linear regression is a fundamental method in statistics and machine learning used to model the relationship between a dependent variable y and one or more independent variables x. The basic formula for simple linear regression is:
y = β₀ + β₁x + ε
Where:
y = predicted value (e.g., future ADX)
x = explanatory variable (e.g., bar index or time)
β₀ = intercept
β₁ = slope (rate of change)
ε = random error term
The goal is to estimate β₀ and β₁ by minimizing the sum of squared errors. This is achieved using the least squares method, ensuring the best linear fit to historical data. Once the coefficients are calculated, the model extends the regression line forward, generating the ADX projection based on recent trends.
⯁ Least Squares Estimation
To minimize the error, the regression coefficients are calculated as:
β₁ = Σ((xᵢ - x̄)(yᵢ - ȳ)) / Σ((xᵢ - x̄)²)
β₀ = ȳ - β₁x̄
Where:
Σ = summation
x̄ and ȳ = means of x and y
i ranges from 1 to n (number of data points)
These formulas provide the best linear unbiased estimator under Gauss-Markov conditions — assuming constant variance and linearity.
⯁ Linear Regression in Machine Learning
Linear regression is a foundational algorithm in supervised learning. Its power in producing quantitative predictions makes it essential in AI systems, predictive analytics, time-series forecasting, and automated trading. Applying it to the ADX essentially places an intelligent forecasting engine inside a classic trend tool.
⯁ Visual Interpretation
Imagine an ADX time series like this:
Time →
ADX →
The regression line smooths these values and projects them n periods forward, creating a predictive trajectory. This forecasted ADX line can intersect with the actual ADX, offering smarter buy and sell signals.
⯁ Summary of Scientific Concepts
Linear Regression: Models variable relationships with a straight line.
Least Squares: Minimizes prediction errors for best fit.
Time-Series Forecasting: Predicts future values using historical data.
Supervised Learning: Trains models to predict outcomes from inputs.
Statistical Smoothing: Reduces noise and highlights underlying trends.
⯁ Why This Indicator Is Revolutionary
Scientifically grounded: Based on rigorous statistical theory.
Unprecedented: First public ADX using least-squares forecast modeling.
Smart: Uses machine learning logic.
Forward-Looking: Generates predictive, not just reactive, signals.
Customizable: Flexible for any strategy or timeframe.
⯁ Conclusion
By merging ADX and linear regression, this indicator enables traders to predict market momentum rather than merely follow it. ADX Forecast Colorful is not just another indicator — it’s a scientific leap forward in technical analysis. With 26 fully configurable entry conditions and smart forecasting, this open-source tool is built for creating cutting-edge quantitative strategies.
⯁ Example of simple linear regression with one independent variable
This example demonstrates how a basic linear regression works when there is only one independent variable influencing the dependent variable. This type of model is used to identify a direct relationship between two variables.
⯁ In linear regression, observations (red) are considered the result of random deviations (green) from an underlying relationship (blue) between a dependent variable (y) and an independent variable (x)
This concept illustrates that sampled data points rarely align perfectly with the true trend line. Instead, each observed point represents the combination of the true underlying relationship and a random error component.
⯁ Visualizing heteroscedasticity in a scatterplot with 100 random fitted values using Matlab
Heteroscedasticity occurs when the variance of the errors is not constant across the range of fitted values. This visualization highlights how the spread of data can change unpredictably, which is an important factor in evaluating the validity of regression models.
⯁ The datasets in Anscombe’s quartet were designed to have nearly the same linear regression line (as well as nearly identical means, standard deviations, and correlations) but look very different when plotted
This classic example shows that summary statistics alone can be misleading. Even with identical numerical metrics, the datasets display completely different patterns, emphasizing the importance of visual inspection when interpreting a model.
⯁ Result of fitting a set of data points with a quadratic function
This example illustrates how a second-degree polynomial model can better fit certain datasets that do not follow a linear trend. The resulting curve reflects the true shape of the data more accurately than a straight line.
⯁ What is the ADX?
The Average Directional Index (ADX) is a technical analysis indicator developed by J. Welles Wilder. It measures the strength of a trend in a market, regardless of whether the trend is up or down.
The ADX is an integral part of the Directional Movement System, which also includes the Plus Directional Indicator (+DI) and the Minus Directional Indicator (-DI). By combining these components, the ADX provides a comprehensive view of market trend strength.
⯁ How to use the ADX?
The ADX is calculated based on the moving average of the price range expansion over a specified period (usually 14 periods). It is plotted on a scale from 0 to 100 and has three main zones:
Strong Trend: When the ADX is above 25, indicating a strong trend.
Weak Trend: When the ADX is below 20, indicating a weak or non-existent trend.
Neutral Zone: Between 20 and 25, where the trend strength is unclear.
⯁ Entry Conditions
Each condition below is fully configurable and can be combined to build precise trading logic.
📈 BUY
🅰️ Signal Validity: The signal will remain valid for X bars .
🅰️ Signal Sequence: Configurable as AND or OR .
🅰️ +DI > -DI
🅰️ +DI < -DI
🅰️ +DI > ADX
🅰️ +DI < ADX
🅰️ -DI > ADX
🅰️ -DI < ADX
🅰️ ADX > Threshold
🅰️ ADX < Threshold
🅰️ +DI > Threshold
🅰️ +DI < Threshold
🅰️ -DI > Threshold
🅰️ -DI < Threshold
🅰️ +DI (Crossover) -DI
🅰️ +DI (Crossunder) -DI
🅰️ +DI (Crossover) ADX
🅰️ +DI (Crossunder) ADX
🅰️ +DI (Crossover) Threshold
🅰️ +DI (Crossunder) Threshold
🅰️ -DI (Crossover) ADX
🅰️ -DI (Crossunder) ADX
🅰️ -DI (Crossover) Threshold
🅰️ -DI (Crossunder) Threshold
🔮 +DI (Crossover) -DI Forecast
🔮 +DI (Crossunder) -DI Forecast
🔮 ADX (Crossover) +DI Forecast
🔮 ADX (Crossunder) +DI Forecast
📉 SELL
🅰️ Signal Validity: The signal will remain valid for X bars .
🅰️ Signal Sequence: Configurable as AND or OR .
🅰️ +DI > -DI
🅰️ +DI < -DI
🅰️ +DI > ADX
🅰️ +DI < ADX
🅰️ -DI > ADX
🅰️ -DI < ADX
🅰️ ADX > Threshold
🅰️ ADX < Threshold
🅰️ +DI > Threshold
🅰️ +DI < Threshold
🅰️ -DI > Threshold
🅰️ -DI < Threshold
🅰️ +DI (Crossover) -DI
🅰️ +DI (Crossunder) -DI
🅰️ +DI (Crossover) ADX
🅰️ +DI (Crossunder) ADX
🅰️ +DI (Crossover) Threshold
🅰️ +DI (Crossunder) Threshold
🅰️ -DI (Crossover) ADX
🅰️ -DI (Crossunder) ADX
🅰️ -DI (Crossover) Threshold
🅰️ -DI (Crossunder) Threshold
🔮 +DI (Crossover) -DI Forecast
🔮 +DI (Crossunder) -DI Forecast
🔮 ADX (Crossover) +DI Forecast
🔮 ADX (Crossunder) +DI Forecast
🤖 Automation
All BUY and SELL conditions are compatible with TradingView alerts, making them ideal for fully or semi-automated systems.
⯁ Unique Features
Linear Regression: (Forecast)
Signal Validity: The signal will remain valid for X bars
Signal Sequence: Configurable as AND/OR
Condition Table: BUY/SELL
Condition Labels: BUY/SELL
Plot Labels in the Graph Above: BUY/SELL
Automate and Monitor Signals/Alerts: BUY/SELL
Background Colors: "bgcolor"
Background Colors: "fill"
Linear Regression (Forecast)
Signal Validity: The signal will remain valid for X bars
Signal Sequence: Configurable as AND/OR
Table of Conditions: BUY/SELL
Conditions Label: BUY/SELL
Plot Labels in the graph above: BUY/SELL
Automate & Monitor Signals/Alerts: BUY/SELL
Background Colors: "bgcolor"
Background Colors: "fill"
Search in scripts for "黄金近20年走势"

Megvie Scalping C - Pullback EMA20/50 (3-5m) by Lynda//@version=5
indicator("Megvie Scalping C - Pullback EMA20/50 (3-5m)", overlay=true, max_labels_count=500, max_lines_count=500)
// === INPUTS ===
ema_fast_len = input.int(20, "EMA fast (pullback)")
ema_slow_len = input.int(50, "EMA slow (trend)")
rsi_len = input.int(14, "RSI length")
rsi_min = input.int(40, "RSI min for entry")
atr_len = input.int(14, "ATR length (for SL/TP)")
use_atr_for_sl = input.bool(true, "Use ATR for SL size")
atr_sl_mult = input.float(1.0, "SL = ATR * multiplier", step=0.1)
rr = input.float(1.8, "Risk:Reward (TP = SL * RR)", step=0.1)
max_signals_repeat = input.int(3, "Min bars between signals", minval=1)
// === INDICATORS ===
ema_fast = ta.ema(close, ema_fast_len)
ema_slow = ta.ema(close, ema_slow_len)
rsi = ta.rsi(close, rsi_len)
atr = ta.atr(atr_len)
plot(ema_fast, color=color.new(color.green, 0), title="EMA 20")
plot(ema_slow, color=color.new(color.red, 0), title="EMA 50")
// === TREND FILTER ===
trend_bull = ema_fast > ema_slow
trend_bear = ema_fast < ema_slow
// === PULLBACK CONDITION ===
// Consider a pullback when price traded at/under EMA20 within the last 3 bars and now shows a bullish/bearish confirmation
pullback_bull = ta.lowest(low, 3) <= ema_fast and close > ema_fast
pullback_bear = ta.highest(high, 3) >= ema_fast and close < ema_fast
// === CONFIRMATION CANDLE ===
// Bullish confirmation: current close > open AND close > high (strong close)
// Bearish confirmation: current close < open AND close < low
bullish_candle = close > open and close > high
bearish_candle = close < open and close < low
// === ENTRY SIGNALS (Version C logic) ===
buySignal = trend_bull and pullback_bull and rsi >= rsi_min and bullish_candle
sellSignal = trend_bear and pullback_bear and rsi <= (100 - rsi_min) and bearish_candle
// Prevent firing signals too often
var int lastSignalBar = na
ok_to_fire = na(lastSignalBar) ? true : (bar_index - lastSignalBar) > max_signals_repeat
buyFire = buySignal and ok_to_fire
sellFire = sellSignal and ok_to_fire
if buyFire
lastSignalBar := bar_index
if sellFire
lastSignalBar := bar_index
// === SL / TP CALCULATION ===
var float sl_price = na
var float tp_price = na
var line sl_line = na
var line tp_line = na
var label sig_label = na
if buyFire
if use_atr_for_sl
sl_price := close - atr * atr_sl_mult
else
sl_price := ta.lowest(low, 3) - syminfo.mintick * 5
tp_price := close + (close - sl_price) * rr
// draw lines and label
line.delete(sl_line )
line.delete(tp_line )
label.delete(sig_label )
sl_line := line.new(bar_index, sl_price, bar_index + 50, sl_price, color=color.new(color.red, 0), width=1, extend=extend.right)
tp_line := line.new(bar_index, tp_price, bar_index + 50, tp_price, color=color.new(color.green, 0), width=1, extend=extend.right)
sig_label := label.new(bar_index, low, "BUY\nSL:" + str.tostring(sl_price, format.mintick) + "\nTP:" + str.tostring(tp_price, format.mintick), style=label.style_label_up, color=color.new(color.green,0), textcolor=color.white, size=size.small)
if sellFire
if use_atr_for_sl
sl_price := close + atr * atr_sl_mult
else
sl_price := ta.highest(high, 3) + syminfo.mintick * 5
tp_price := close - (sl_price - close) * rr
// draw lines and label
line.delete(sl_line )
line.delete(tp_line )
label.delete(sig_label )
sl_line := line.new(bar_index, sl_price, bar_index + 50, sl_price, color=color.new(color.red, 0), width=1, extend=extend.right)
tp_line := line.new(bar_index, tp_price, bar_index + 50, tp_price, color=color.new(color.green, 0), width=1, extend=extend.right)
sig_label := label.new(bar_index, high, "SELL\nSL:" + str.tostring(sl_price, format.mintick) + "\nTP:" + str.tostring(tp_price, format.mintick), style=label.style_label_down, color=color.new(color.red,0), textcolor=color.white, size=size.small)
// === PLOT SIGNAL ARROWS ===
plotshape(buyFire, title="Buy Signal", location=location.belowbar, color=color.green, style=shape.triangleup, size=size.small, text="BUY")
plotshape(sellFire, title="Sell Signal", location=location.abovebar, color=color.red, style=shape.triangledown, size=size.small, text="SELL")
// === ALERTS ===
alertcondition(buyFire, title="BUY Signal", message="Megvie C: BUY signal. SL: {{plot_0}} TP: {{plot_1}}")
alertcondition(sellFire, title="SELL Signal", message="Megvie C: SELL signal. SL: {{plot_0}} TP: {{plot_1}}")
alertcondition(ta.cross(close, tp_price), title="TP Hit", message="Megvie C: TP reached")
alertcondition(ta.cross(close, sl_price), title="SL Hit", message="Megvie C: SL reached")
// === NOTES ===
// - Optimized for 3-5 minute charts.
// - Test in paper trading before using real capital.
// - Adjust ATR multiplier and RR to match your risk management.

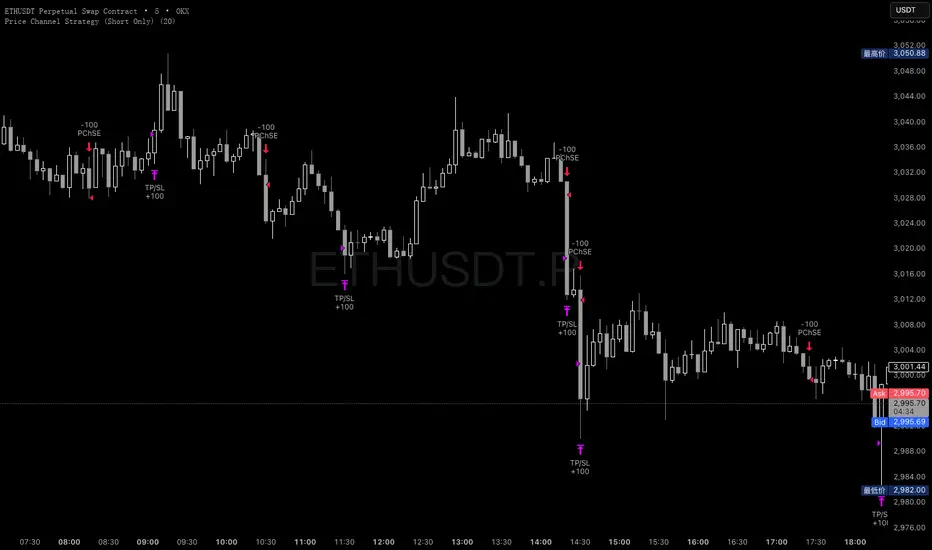
Price Channel Strategy (Short Only)Please follow my x account to get more info:@CTF_bule_lotus
1. Core Logic: Price Channel Breakout (Downside)
The strategy uses one structural signal:
Lowest Low of the past 20 bars.
When the market breaks below this 20-bar low, a stop entry is triggered to open a short position.
Key design principles:
No prediction
No attempt to call tops
Pure reaction to market-confirmed downward momentum
This makes the strategy a clean representation of short-term downside inertia.
2. Directional Constraint: Short Only
This version trades only short positions, with no long exposure.
Rationale:
To isolate and study ETH’s microstructure during downside moves
To avoid noise from symmetric long/short signal conflicts
To treat this model as part of a controlled long–short comparative study
By eliminating long trades, the strategy provides clearer insight into bearish breakout behavior.
3. Risk Management: Fixed TP / SL
Immediately after entry, two fixed exit conditions are defined:
Take Profit: +10 price units
Stop Loss: –10 price units
Both values automatically convert into tick units using syminfo.mintick.
This reflects a classic scalping pattern:
Small but frequent profits
Fast stop-outs
High turnover
Sensitivity to short bursts of momentum
Such fixed exits are useful for analyzing whether short-lived selloffs contain exploitable structure.
4. Transaction Costs
For this specific analysis, transaction fees are intentionally excluded.
This allows:
A clearer view of the raw statistical edge
Isolation of pure signal behavior
Direct comparison with fee-inclusive results in prior tests
The fee-free backtest highlights the “theoretical edge” before real-market frictions are applied.
5. Data & Testing Window (2016–2025)
The model is tested on the complete ETH dataset from 2016 to 2025, without subjective filtering:
No removal of black swan events
No skipping flash crashes
No curve-fitting on sub-periods
This ensures the results reflect ETH’s full structural history, both stable and chaotic.
6. Interpretation & Research Value
This strategy is not presented as a predictive or production-ready trading system.
Its value lies in research utility:
Understanding ETH’s short-term downward momentum
Validating breakout-based scalping structures
Generating baseline data for more complex models
Supporting long-only vs. short-only comparative system design
Removing fees helps quantify the signal strength itself, while fee-inclusive tests can later show how much of that edge survives realistic trading conditions.
APEX TREND: Macro & Hard Stop SystemAPEX TREND: Macro & Hard Stop System
The APEX TREND System is a composite trend-following strategy engineered to solve the "Whipsaw" problem inherent in standard breakout systems. It orchestrates four distinct technical theories—Macro Trend Filtering, Volatility Squeeze, Momentum, and Volatility Stop-Loss—into a single, hierarchical decision-making engine.
This script is not merely a collection of indicators; it is a rules-based trading system designed for Swing Traders (Day/Week timeframes) who aim to capture major trend extensions while strictly managing downside risk through a "Hard Stop" mechanism.
🧠 Underlying Concepts & Originality
Many trend indicators fail because they treat all price movements equally. The APEX TREND differentiates itself by applying an "Institutional Filter" logic derived from classic Dow Theory and Modern Volatility Analysis.
1. The Macro Hard Stop (The 200 EMA Logic)
Origin: Based on the institutional mandate that “Nothing good happens below the 200-day moving average.”
Function: Unlike standard super trends that flip constantly in sideways markets, this system integrates a 200-period Exponential Moving Average (EMA) as a non-negotiable "Hard Stop."
Synergy: This acts as the primary gatekeeper. Even if the volatility engine signals a "Buy," the system suppresses the signal if the price is below the Macro Baseline, effectively filtering out counter-trend traps.
2. The Volatility Engine (Squeeze Theory)
Origin: Derived from John Carter’s TTM Squeeze concept.
Function: The script identifies periods where Bollinger Bands (Standard Deviation) contract inside Keltner Channels (ATR). This indicates a period of potential energy build-up.
Synergy: The system only triggers an entry when this energy is released (Breakout) AND coincides with Linear Regression Momentum, ensuring the breakout is genuine.
3. Anti-Chop Filter (ADX Integration)
Origin: J. Welles Wilder’s Directional Movement Theory.
Function: A common failure point for trend systems is low-volatility chop. This script utilizes the Average Directional Index (ADX).
Synergy: If the ADX is below the threshold (Default: 20), the market is deemed "Choppy." The script visually represents this by painting candles GRAY, signaling a "No-Trade Zone" regardless of price action.
4. The "Run Trend" Stop Loss (Factor 4.0 ATR)
Origin: Adapted from the Turtle Trading rules regarding volatility-based stops.
Function: Standard Trailing Stops (usually Factor 3.0) are too tight for crypto or volatile equities on daily timeframes.
Optimization: This system employs a wider ATR Multiplier of 4.0. This allows the asset to fluctuate naturally within a trend without triggering a premature exit, maximizing the "Run Trend" potential.
🛠 How It Works (The Algorithm)
The script processes data in a specific order to generate a signal:
Check Macro Trend: Is Price > EMA 200? (If No, Longs are disabled).
Check Volatility: Is ADX > 20? (If No, all signals are disabled).
Check Volume: Is Current Volume > 1.2x Average Volume? (Confirmation of institutional participation).
Trigger: Has a Volatility Breakout occurred in the direction of the Macro Trend?
Execution: If ALL above are true -> Generate Signal.
🎯 Strategy Guide
1. Long Setup (Bullish)
Signal: Look for the Green "APEX LONG" Label.
Condition: The price must be ABOVE the White Line (EMA 200).
Execution: Enter at the close of the signal candle.
Stop Loss: Initial stop at the Green Trailing Line.
2. Short Setup (Bearish)
Signal: Look for the Red "APEX SHORT" Label.
Condition: The price must be BELOW the White Line (EMA 200).
Execution: Enter at the close of the signal candle.
Stop Loss: Initial stop at the Red Trailing Line.
3. Exit Rules (Crucial)
This system employs a Dual-Exit Mechanism:
Soft Exit (Profit Taking): Close the position if the price crosses the Trailing Stop Line (Green/Red line). This locks in profits during a trend reversal.
Hard Exit (Emergency): Close the position IMMEDIATELY if the price crosses the White EMA 200 Line against your trade. This prevents holding a position during a major market regime change.
⚙️ Settings
Momentum Engine: Adjust Bollinger Band/Keltner Channel lengths to tune breakout sensitivity.
Apex Filters: Toggle the EMA 200 or ADX filters on/off to adapt to different asset classes.
Risk Management: The ATR Multiplier (Default 4.0) controls the width of the trailing stop. Lower values = Tighter stops (Scalping); Higher values = Looser stops (Swing).
Disclaimer: This script is designed for trend-following on higher timeframes (4H, 1D, 1W). Please backtest on your specific asset before live trading.

Morning ORB FVG Trigger✅ Overview
Morning ORB FVG Trigger is a complete intraday trading framework built around:
A Morning Opening Range Breakout (ORB)
The first Fair Value Gap (FVG) after that breakout
Strict risk management and position sizing
Optional HTF trend filter (Daily / Weekly / Monthly)
Optional Daily ATR filter to avoid extreme days
The script is designed for futures / indices / FX on intraday charts up to 15 minutes and for traders who want a clean, mechanical entry framework with clear risk.
🧠 Core idea
Define a morning opening range (e.g. 09:30–09:45).
Wait for a clean breakout above/below that range.
After the breakout, wait for the first FVG in breakout direction,
confirmed by the next candle (no immediate full reclaim).
Use a chosen stop logic + R:R factor to build risk/reward boxes.
Calculate position size based on your account risk.
(Optional) Only take trades:
In the direction of the HTF EMA trend (D/W/M).
On days where the morning range is within a band of the Daily ATR.
You can also disable all signals/boxes and use the script just as a visual ORB tool.
⏰ 1. ORB / Morning Range
Inputs (Main section)
Morning Range Session
Time window of the opening range in exchange time
Example: 09:30–09:45 for a 15-minute ORB.
You can type custom ranges (e.g. 09:30–09:35 for a 5-minute ORB).
Risk/Reward (TP factor)
Multiplier for the take-profit distance relative to the stop.
2.0 = TP is 2× the stop distance
1.5 = TP is 1.5× the stop distance
Show ORB range
If enabled, draws:
ORB high/low lines
ORB labels (e.g. 15min ORB high / low)
Optional midline
Extend ORB lines to the right (bars)
How many bars to extend the ORB high/low horizontally beyond the ORB itself.
Trade box width (bars)
Horizontal width (in bars) of:
Red risk box (entry–stop)
Green reward box (entry–TP)
Implementation details
The ORB is always calculated on 1-minute data internally, so it stays precise even on 5m/15m charts.
The script only works on intraday timeframes up to 15 minutes.
📦 2. FVG Block
Group: “FVG”
Threshold %
Minimum size of an FVG in % of price.
0 = every FVG
Higher values = only larger gaps
Auto threshold (from volatility)
If enabled, the minimum FVG size is derived from historical volatility
instead of a fixed percentage.
Allow breakout FVG partly inside ORB
Off (default): the FVG must lie fully outside the ORB.
On: the breakout FVG itself may still overlap the ORB a bit,
as long as it is the first one attached to the breakout move.
Enable FVG entry signals, boxes & alerts
On: full system – FVG detection, entry labels, risk/TP boxes, alerts.
Off: no entries, no risk/TP boxes, no alerts.
You only get the ORB and (optionally) the HTF dashboard, so you can trade your own setups.
Entry mode
Entry mode (Mid / Edge / NextOpen)
Mid – Entry at the midpoint of the FVG.
Edge – Long at the upper FVG edge, short at the lower FVG edge.
NextOpen – No limit order in the gap. Entry is placed at the next bar open after FVG confirmation.
Edge offset (ticks)
Additional offset for Edge entries:
Long:
+ticks = a bit above the FVG (more conservative)
-ticks = deeper into the FVG (more aggressive)
Short:
+ticks = a bit below the FVG
-ticks = deeper into the FVG
FVG detection logic
Uses a LuxAlgo-style 3-candle FVG pattern (gap between candle 1 and 3).
Only one FVG is taken: the first valid FVG after the ORB breakout in breakup direction.
The FVG candle is the middle bar; the script:
Detects the FVG on the previous bar.
Waits for the current bar to confirm it:
Bullish: current low must stay above the lower FVG boundary
Bearish: current high must stay below the upper FVG boundary
Only then an entry signal is generated.
🛑 3. Stop Logic
Group: “Stop Logic”
Stop mode (PrevBar / Pivot / FVG Candle)
PrevBar – Stop at the low/high of the candle before the FVG
(tight/aggressive).
FVG Candle – Stop at the low/high of the FVG candle itself
(medium).
Pivot – Stop at the most recent swing high/low
using pivotLeft / pivotRight pivots (more conservative).
Ticks (stop buffer)
Offset (in ticks) from the selected stop level.
> 0 = further away (more room, more risk)
< 0 = closer (tighter stop)
Pivot left / Pivot right
Number of candles left/right to define a swing high/low
when using Pivot stop mode.
Typical intraday values: 2–3.
The script also sanity-checks the stop:
if the calculated stop would be invalid (e.g. above entry in a long), it moves it by a minimal distance (2 ticks) to keep a valid risk.
📈 4. HTF Trend Filter (Daily / Weekly / Monthly)
Group: “HTF Trend Filter”
Enable HTF trend filter
If enabled, trades are only allowed:
Long when at least 2 of D/W/M closes are above their EMA
Short when at least 2 of D/W/M closes are below their EMA
EMA length (D/W/M)
EMA length for all three higher timeframes (Daily, Weekly, Monthly).
This helps focus entries in the direction of the dominant higher-timeframe trend.
📊 5. ATR Filter (Daily)
Group: “ATR Filter (Daily)”
Use daily ATR filter
If enabled, the height of the ORB (ORB high – ORB low) must be within
a band of the Daily ATR to allow any signals.
Daily ATR length
ATR period on the Daily timeframe.
Min ORB size vs ATR
Lower bound:
Example: 0.3 → ORB must be at least 0.3 × Daily ATR
0.0 = no minimum.
Max ORB size vs ATR
Upper bound:
Example: 1.5 → ORB must be ≤ 1.5 × Daily ATR
0.0 = no maximum.
If the ORB is too small (choppy) or too large (exhausted move), no breakout or FVG signal will be generated on that day.
🧭 6. HTF Dashboard & Signal Labels
Group: “HTF Trend Dashboard”
Show HTF dashboard
Draws a small label at the top of the chart showing:
HTF Trend (EMA X)
D: UP/FLAT/DOWN
W: UP/FLAT/DOWN
M: UP/FLAT/DOWN
Dashboard position
Top Right, Top Center, Top Left – places the dashboard at the top.
Over Risk Info – no top dashboard; instead, the HTF trend info is shown as a label near the risk box when a new signal appears.
Lookback (bars) for top anchor
How many bars to use to determine the top price level for dashboard placement.
Show HTF trend above risk box on signal
Only relevant if Dashboard position = Over Risk Info.
When enabled, a small HTF label appears near the risk box for each new trade.
Signal label vertical offset (ticks)
Vertical spacing between risk info label and HTF label.
Minimum spacing HTF/Risk (ticks)
Ensures a minimum vertical distance so the two labels don’t overlap.
HTF signal label X offset (bars)
Horizontal offset (left/right) relative to the risk info label.
⏳ 7. ORB–FVG Filters (Session & Time Window)
Group: “ORB FVG Filter”
Only same session day
If enabled, FVG entries are only allowed on the same calendar day
as the ORB. When the date changes, all state & drawings are reset.
Limit hours after ORB
Enables a time window after the ORB end.
Trading window after ORB (hours)
Length of that window in hours.
Example: 2.0 → FVG signals only in the first 2 hours after ORB end.
💰 8. Risk Management & Position Sizing
Group: “Risk Management”
Calculate position size
If enabled, the script computes suggested mini and micro contract size for you.
Account size
Your trading account size (in account currency).
Risk mode
Percent – risk is a % of account size (Account risk %).
Fixed amount – risk is a fixed dollar amount (Fixed risk ($)).
Account risk %
Risk per trade as a percentage of account size (e.g. 1.0 for 1%).
Fixed risk ($)
Fixed risk per trade in dollars when using Fixed amount mode.
Micro factor (vs mini)
How much a micro contract is worth relative to a mini.
Example:
0.1 → one micro moves 1/10 of one mini.
Risk Info label
For each new trade, a label is shown above the boxes with:
Stop distance in price and $ risk per mini
Max risk allowed for the trade
Suggested mini and micro size
Text like:
Suggested: 2 mini
Suggested: 5 micro
or Suggested: no trade
This makes the script especially useful for prop-firm rules or strict risk discipline.
🎨 9. Visual Style (Boxes, Labels, ORB Lines)
Group: “Box & Label Style (Trade)”
Label font size (Very small, Small, Normal, Large)
Entry label BG / text color
Stop label BG / text color
TP label BG / text color
Risk info BG / text color
Risk box color (entry–stop zone)
Reward box color (entry–TP zone)
Group: “ORB Style”
ORB high line color
ORB low line color
ORB line width
ORB label font size
ORB label background color
ORB label text color
Show ORB midline
ORB midline color / width / style (Solid / Dashed / Dotted)
⚠️ 10. Alerts
Group: “Alerts”
The script defines three alert conditions:
Long entry FVG breakout
Triggered when a new long signal appears.
Short entry FVG breakout
Triggered when a new short signal appears.
FVG entry (long/short)
Generic alert for any new signal (long or short).
To use them:
Add the indicator to the chart.
Open the Alerts dialog → “Condition”.
Select this script and one of the alert conditions.
Set your preferred expiration and notification settings.
Alerts only fire when Enable FVG entry signals, boxes & alerts is on.
🧩 11. How the trading logic flows (summary)
Build ORB on 1-minute data during the selected session.
Optionally reject the day if ORB is outside the ATR bounds.
Wait for a breakout (close above high or below low), respecting HTF trend filter.
After breakout, look for the first valid FVG in that direction:
Outside the ORB (unless breakout FVG allowed inside)
Confirmed by the next candle (no full reclaim)
Once confirmed:
Compute entry, stop, target.
Draw risk/reward boxes and all labels.
Optionally show HTF signal label over the risk info.
Trigger alerts if enabled.
If you disable FVG signals, only steps 1–3 (plus dashboard) are effectively active.
⚠️ 12. Notes & Disclaimer
Script is intended for intraday trading up to 15-minute timeframes.
All signals are mechanical and do not guarantee profitability.
Always backtest and forward-test on your own data before risking real money.
This script is for educational purposes only and is not financial advice.
🚀 Quick-start guide
Add the script to your chart
Use an intraday timeframe ≤ 15 minutes (1m, 3m, 5m, 15m).
Works best on liquid indices, futures, FX and large-cap stocks.
Set the Morning Range
In “Morning Range Session” choose the exchange’s opening window.
Examples
US index futures (CME): 08:30–08:45 or 08:30–08:35
US stocks (NYSE/Nasdaq): 09:30–09:45 or 09:30–09:35
The ORB is always calculated on 1-minute data internally, so the range stays accurate on higher intraday charts.
Keep the default filters at first
HTF Trend Filter: ON
EMA length = 20
This will only allow trades in the direction of the dominant D/W/M trend.
ATR Filter: OFF (optional; you can enable later once you’re comfortable).
Use the full trade system
In the FVG group leave
“Enable FVG entry signals, boxes & alerts” = ON
Entry mode: Mid
Stop mode: FVG Candle or PrevBar
Risk/Reward: 2.0 as a starting point.
Set your risk
Turn on “Calculate position size”.
Enter your Account size and choose either:
Risk mode = Percent (e.g. 1.0 = 1% per trade), or
Risk mode = Fixed amount (e.g. $250 per trade).
The risk info label will show:
Stop distance in price and $/contract
Max allowed risk
Suggested mini and micro contract size.
Enable alerts (optional)
Open the Alerts dialog → Condition: this script.
Choose one of:
Long entry FVG breakout
Short entry FVG breakout
FVG entry (long/short)
Choose “Once per bar” or “Once per bar close”, and your preferred notification type.
Replay & journal
Use the TradingView bar replay tool to step through past days.
Focus on:
How the ORB defines the structure.
How the first confirmed FVG outside the ORB behaves.
Whether the risk/TP levels fit your own style and product.
🎛 Recommended settings & profiles
These are starting points, not rules. Always adapt to the instrument and your own risk tolerance.
1. Conservative / Trend-following
Timeframe: 5m or 15m
Morning Range Session: 15-minute ORB around the cash or futures open
FVG
Threshold %: 0.05–0.1 (filter out very small gaps)
Auto threshold: OFF (keep it simple)
Allow breakout FVG partly inside ORB: OFF
Enable FVG entry signals/boxes/alerts: ON
Entry mode: Mid
Stop Logic
Stop mode: Pivot
Pivot left/right: 2–3
Stop buffer: +1–2 ticks
HTF Trend Filter
Enabled: ON
EMA length: 20
ATR Filter
Enabled: ON
Daily ATR length: 14
Min ORB vs ATR: 0.3–0.4
Max ORB vs ATR: 1.2–1.5
Risk Management
Risk mode: Percent
Account risk: 0.5–1.0%
Idea: Only trade when the higher-timeframe trend supports the move and the opening range is of a “normal” size for the current volatility.
2. Balanced / Intraday directional
Timeframe: 3m or 5m
FVG
Threshold %: 0.02–0.05
Auto threshold: ON (lets the script adapt to volatility)
Allow breakout FVG partly inside ORB: ON
(first breakout FVG may partly sit inside the ORB)
Entry mode: Edge
Edge offset (ticks): 0 or +1
Stop Logic
Stop mode: FVG Candle
Stop buffer: 0–1 ticks
HTF Trend Filter
Enabled: ON
ATR Filter
Enabled: OFF (optional)
Risk Management
Risk mode: Percent
Account risk: 1.0–1.5% (if this fits your plan)
Idea: Slightly more aggressive entries at the gap edge, still aligned with HTF trend, but with more flexibility on ATR.
3. Aggressive / Scalping around the ORB
Timeframe: 1m or 3m
FVG
Threshold %: 0.0–0.02
Auto threshold: ON
Allow breakout FVG partly inside ORB: ON
Entry mode: NextOpen or Edge with a negative offset (deeper into the gap)
Stop Logic
Stop mode: PrevBar
Stop buffer: 0 or -1 tick
HTF Trend Filter
Enabled: OFF (or ON but treat as soft guidance)
ATR Filter
Enabled: OFF
Risk Management
Risk mode: Percent
Account risk: lower, e.g. 0.25–0.5% per trade
Idea: More trades and tighter stops. Best for experienced traders who understand the limitations of scalping and whipsaw risk.
Final reminder
All of these are templates, not guarantees:
Always check how the system behaves on your market and session.
Start on replay and demo before trading real money.
Adjust filters (HTF, ATR, thresholds) until the signals fit your personal approach.

Average Volume LabelAverage Volume Label Indicator
This TradingView Pine Script creates a customizable label that displays the average trading volume over a specified period directly on your price chart.
Core Functionality:
Calculates the simple moving average (SMA) of volume over a user-defined number of days (default: 20 days)
Displays this average in a positioned label at the top of the chart
The label shows text like "20-Day Avg Volume: 1.2M" with automatic volume formatting
Key Customization Options:
Volume Calculation:
Adjustable lookback period (1-200 days) for the volume average
Label Appearance:
Text color, background color, and transparency controls
Five size options (Tiny to Huge)
Configurable horizontal position (how many bars back from the current bar to place the label)
Technical Implementation:
Updates only on the most recent bar to optimize performance
Positions the label at the highest price point within the visible range for consistent top-of-chart placement
Includes safety checks to prevent runtime errors with lookback periods
Also plots the average volume data (visible in the data window for reference)
This indicator is useful for traders who want to quickly assess whether current volume is above or below the recent average without cluttering their chart with additional panes.
Breakout Pullback Continuation//@version=5
indicator("Breakout Pullback Continuation", overlay=true)
// === Parameters ===
lookback = 20 // Look for breakouts above this many bars
volumeFactor = 1.3 // How much volume needs to exceed average
pullbackDepth = 3 // Max bars to wait for pullback + green
// === Track State ===
var float breakoutLevel = na
var int breakoutBar = na
volumeSMA = ta.sma(volume, 20)
// === Detect Breakout ===
recentHigh = ta.highest(high, lookback)
breakout = close > recentHigh
if breakout
breakoutLevel := close
breakoutBar := bar_index
// === Check for Pullback After Breakout
pullbackOccurred = na(breakoutLevel) ? false : close < breakoutLevel and bar_index > breakoutBar
// === Check for Confirmation Candle
greenCandle = close > open
decentRange = (high - low) > (close * 0.003)
volumeSpike = volume > volumeSMA * volumeFactor
confirmation = pullbackOccurred and greenCandle and decentRange and volumeSpike and (bar_index - breakoutBar <= pullbackDepth)
// === Signal Plot ===
plotshape(confirmation, title="Pullback Continuation", location=location.belowbar, color=color.lime, style=shape.triangleup)
alertcondition(confirmation, title="Breakout Pullback Alert", message="🚀 {{ticker}} breakout-pullback-confirmation at {{close}}")

Momentum Breakout Signal//@version=5
indicator("Momentum Breakout Signal", overlay=true)
// === Breakout Logic ===
length = 20 // Lookback for recent high
recentHigh = ta.highest(high, length)
// === Breakout Condition: Close > prior high
priceBreakout = close > recentHigh
// === Volume Spike Confirmation ===
volumeSMA = ta.sma(volume, 20)
volumeSpike = volume > volumeSMA * 1.3 // Customize sensitivity
// === Optional: Filter for strong candles only
isGreen = close > open
decentRange = (high - low) > (close * 0.003)
// === Final Signal Logic ===
signal = priceBreakout and volumeSpike and isGreen and decentRange
plotshape(signal, title="Breakout Signal", location=location.abovebar, color=color.orange, style=shape.triangleup, size=size.small)
alertcondition(signal, title="Momentum Breakout Alert", message="🚀 {{ticker}} breakout confirmed at {{close}}")

Price Channel ScalpingMy X account:@CTF_bule_lotus
1. Core Logic (Price Channel Breakout)
The strategy relies on a single, simple indicator: the highest high of the past 20 bars.
When the current price breaks above this 20-period high, a stop entry is used to initiate a long position.
This design avoids prediction.
The model waits for the market to demonstrate momentum before participating.
2. Trade Direction (Long Only)
The strategy exclusively trades long positions and does not take shorts.
This choice is based on:
ETH’s historically upward-biased structure
Avoiding noise from two-sided signals during high-volatility periods
Keeping the direction consistent, which is beneficial for scalping-style systems
3. Risk Management (Fixed TP / SL)
Immediately after entry, the strategy sets two fixed exit conditions:
Take Profit: +10 price units
Stop Loss: –10 price units
Both are automatically converted using the market’s minimum tick size to ensure cross-instrument applicability.
This fixed TP/SL structure is typical in scalping systems:
small wins, fast exits, controlled losses, high turnover.
4. Transaction Costs
A 0.03% fee is applied to every trade throughout the entire backtest.
This fee level reflects the cost structure of major centralized exchanges, making results closer to real-world conditions.
5. Data & Time Range (2016–2025 Full Sample)
The backtest uses ETH’s complete historical dataset from 2016 to 2025.
No subjective filtering is applied—large moves, flash crashes, and black-swan events are all included.
The strategy does not rely on heavy parameter tuning, reducing the risk of overfitting.
6. Backtest Results (Including Fees)
Under this fixed, rule-based structure, the cumulative return is:
1,202,002.77% (2016 → 2025)
Even after including transaction fees, performance is driven by:
High trade frequency and small profit targets
Strict loss containment
Capturing momentum during breakout regimes
7. Transparency & Reproducibility
I will publish the full Pine Script implementation, including:
Entry logic
Exit logic
Fee configuration
All parameters
Backtesting framework
Transparency and reproducibility remain the core principles of this research.

Dual MACD AccelerationDual MACD Acceleration Indicator – Synopsis
Purpose:
This indicator identifies early momentum shifts in the market by comparing a fast MACD (8/20/6) with a slower MACD (12/26/9). It highlights potential strong buy and sell signals when the faster MACD crosses the slower MACD, allowing traders to catch trend accelerations before the full move develops.
Components
Fast MACD (8/20/6)
Responds quickly to short-term price changes.
Detects early momentum shifts.
Slow MACD (12/26/9)
Captures the dominant trend.
Provides a smoother reference for comparison.
Acceleration Signals
Long (▲): Fast MACD crosses above Slow MACD → potential bullish acceleration.
Short (▼): Fast MACD crosses below Slow MACD → potential bearish acceleration.
Zero Line
Optional visual reference for overall trend direction.
Crosses above zero = bullish trend, below zero = bearish trend.
Key Features
Clean, minimal chart display.
Optional toggles to show/hide each MACD line.
Label markers indicate crossovers.
Built-in alert conditions for automated notifications.
Trading Use
Trend Confirmation:
Best used with higher timeframe filters (VWAP or EMAs) to avoid fakeouts.
Entry Timing:
Enter on the first pullback after a crossover signal.
Only trade in the direction of the dominant trend.
Stops & Risk:
Use recent swing lows/highs for stop placement.
TP levels can be structure-based or trailing with price momentum.
Synopsis Summary:
The Dual MACD Acceleration Indicator is a lightweight, early-momentum tool designed for scalpers and short-term traders. It captures fast shifts in trend by comparing a faster and slower MACD, highlighting strong buy and sell opportunities while remaining clean and easy to read. For higher accuracy, combine with trend filters like VWAP or EMAs.

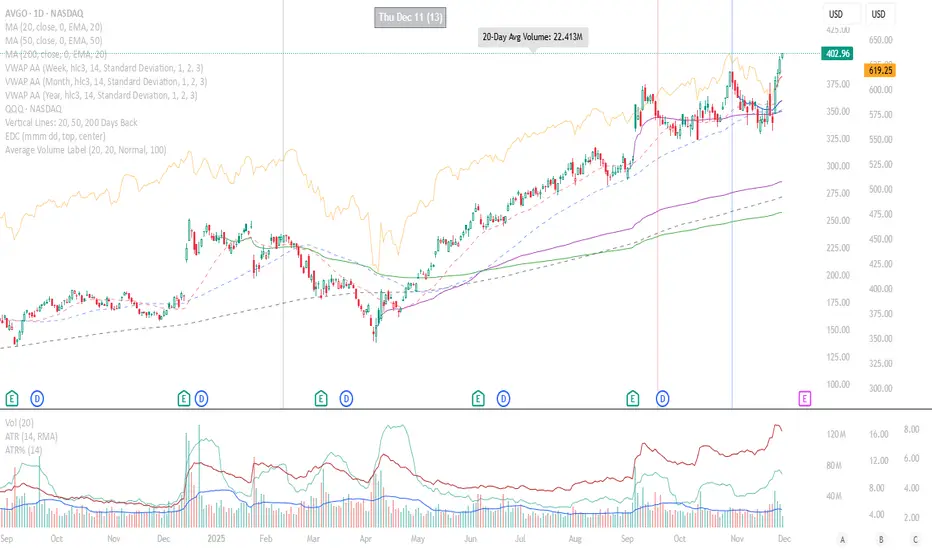
Roshan Dash Ultimate Trading DashboardHas the key moving averages sma (10,20,50,200) in daily and above timeframe. And for lower timeframe it has ema (10,20,50,200) and vwap. Displays key information like marketcap, sector, lod%, atr, atr% and distance of atr from 50sma . All things which help determine whether or not to take trade.

Breakout with Alma & Slope - for high volatility playSometimes best not to overthink,
buy at line crosses ;)
NFA, DYOR
best for 15m-1Hr, high volatility FX,Gold etc
Long only when 3 conditions met:-
- Fast Alma crosses Slow Alma
-Angle Pointing UP
-ADX above 20
Short when
- aqua line below navy line
- navy line pointing down
- adx >20
EXIT
- Trailing Stop: The trade closes automatically if price hits the **Red Stepped Line** (this is your safety net that follows the price).
- Emergency Exit:** The trade closes immediately if the ALMA lines cross back in the opposite direction (Reversal).

Sk M Sir JiSimple indicator that plots three alma moving averages and provides bgcolor based on below conditions
Red => If RSI (length 14) is below 50 or low is below the lower Bollinger band (length 20)
Green => If RSI (length 14) is above 50 or high is above the upper Bollinger band (length 20)

Consolidation Breakout PRO — Clean Boxes + 200 EMA Trend Filter High-probability range breakout detector that draws perfect, always-visible consolidation boxes and only alerts when price breaks out with strong volume and (optionally) in the direction of the prevailing trend.
Features
Automatically draws and extends clean consolidation boxes in real time
Boxes stop extending the moment the breakout occurs — no more “ghost” lines
Optional but powerful 200 EMA trend filter (dramatically reduces false breakouts)
Stronger volume confirmation (default 1.8× the 20-period average, fully adjustable)
Auto-deletes old boxes so your chart stays perfectly clean even after hundreds of signals
Clear “BREAKOUT ↑” and “BREAKDOWN ↓” labels + ready-to-use alerts
Works on any market and any timeframe (best on 1H, 4H, Daily)
How to trade it (edge > 65 % when used correctly)
Wait for the labeled breakout candle to close
Enter on pullback/retest of the box edge (or on strong close + retest)
Stop-loss just outside the opposite side of the box
Take-profit: minimum 1:2, ideally measured move (box height added/subtracted) or trailing with the 20 EMA
This is the cleanest and most professional public consolidation breakout tool available in 2025 — no repainting, no lag, no chart clutter.
Created and continuously improved with love for the TradingView community.

Grok/Claude MoneyLine Fusion * Grok/Claude X SeriesMoneyLine Fusion Indicator
This is a technical analysis indicator designed to help traders identify potential buy and sell opportunities in the market. It combines several well-known trading concepts into one unified tool, displaying visual bands on the chart and generating signals when multiple conditions align.
The Core Concept: The "Money Line"
At the heart of this indicator is something called the Money Line, which is essentially a smoothed trend line calculated using linear regression over the last 16 bars (by default). Think of it as a "best fit" line through recent prices that shows you the general direction the market is heading. The indicator colors this line green when the trend is rising, red when it's falling, and yellow when it's essentially flat or undecided.
The Dynamic Bands
Surrounding the Money Line are upper and lower bands that expand and contract based on market volatility. These bands use the ATR (Average True Range) to measure how much the price typically moves. Here's where it gets clever: the bands also factor in the ADX indicator (which measures trend strength). When the market is trending strongly, the bands widen more aggressively to account for bigger price swings. When the trend is weak, they stay tighter. This adaptive behavior helps the indicator adjust to different market conditions automatically.
The area between the bands is shaded in the trend color (green, red, or yellow) to give you a quick visual of the current market bias.
How Buy and Sell Signals Are Generated
The indicator doesn't just look at one thing — it requires multiple conditions to align before triggering a signal. This is designed to filter out false signals and only alert you when several factors agree.
Signal TypeRequired ConditionsBUYFisher Transform is below -2.0 (oversold), Aroon Up is low (below 20), Aroon Down is high (above 80), and optionally a positive TA ScoreSELLFisher Transform is above +2.0 (overbought), Aroon Up is high (above 80), Aroon Down is low (below 20), and optionally a negative TA Score
Fisher Transform is a mathematical technique that converts price data into a bell curve distribution, making extreme readings (overbought/oversold) easier to spot.
Aroon measures how long it's been since the highest high or lowest low. When Aroon Down is high and Aroon Up is low, it suggests recent price action has been dominated by lows — a potential reversal setup for a buy.
The indicator also prevents signal spam by requiring at least 5 bars between signals of the same type.
The TA Scoring System
Behind the scenes, the indicator calculates a composite score based on four different technical indicators:
MACD — Momentum and trend direction (scores -2 to +2)
DMI — Directional movement comparing buyers vs sellers (scores -2 to +2)
MFI — Money Flow Index, similar to RSI but incorporates volume (scores -2 to +2)
RSI — Classic overbought/oversold measure (scores -1 to +1)
These scores are added together, and the result is displayed in the info panel with labels like "very bullish," "slightly bearish," or "neutral." You can optionally require a minimum TA score before signals trigger, adding another layer of confirmation.
Visual Display Elements
The indicator offers several optional display features:
Shaded bands between upper and lower lines
Buy/Sell labels directly on the chart showing the entry price
Bright blue candle highlighting when a signal fires
Info panel in the corner showing the Money Line value, volatility percentile, RSI, and TA score
Score dots at the bottom of the chart (green for bullish, red for bearish, yellow for neutral)
Debug table for troubleshooting that shows real-time values of Fisher, Aroon, and signal conditions
In Summary
This indicator is essentially a multi-factor confirmation system. Rather than relying on a single indicator that might give many false signals, it waits until the trend direction (Money Line), momentum extremes (Fisher Transform), price cycle position (Aroon), and overall technical picture (TA Score) all point in the same direction. The adaptive bands help visualize where price "should" be trading given current volatility and trend strength. It's designed for traders who prefer fewer but higher-conviction signals.

Dumb Money Flow - Retail Panic & FOMO# Dumb Money Flow (DMF) - Retail Panic & FOMO
## 🌊 Overview
**Dumb Money Flow (DMF)** is a powerful **contrarian indicator** designed to track the emotional state of the retail "herd." It identifies moments of extreme **Panic** (irrational selling) and **FOMO** (irrational buying) by analyzing on-chain data, volume anomalies, and price velocity.
In crypto markets, retail traders often buy the top (FOMO) and sell the bottom (Panic). This indicator helps you do the opposite: **Buy when the herd is fearful, and Sell when the herd is greedy.**
---
## 🧠 How It Works
The indicator combines multiple data points into a single **Sentiment Index** (0-100), normalized over a 90-day period to ensure it always uses the full range of the chart.
### 1. Panic Index (Bearish Sentiment)
Tracks signs of capitulation and fear. High values contribute to the **Panic Zone**.
* **Exchange Inflows:** Spikes in funds moving to exchanges (preparing to sell).
* **Volume Spikes:** High volume during price drops (panic selling).
* **Price Crash (ROC):** Rapid, emotional price drops over 3 days.
* **Volatility (ATR):** High market nervousness and instability.
### 2. FOMO Index (Bullish Sentiment)
Tracks signs of euphoria and greed. High values contribute to the **FOMO Zone**.
* **Exchange Outflows:** Funds moving to cold storage (HODLing/Greed).
* **Profitable Addresses:** When >90% of holders are in profit, tops often form.
* **Parabolic Rise:** Rapid, unsustainable price increases.
---
## 🎨 Visual Guide
The indicator uses a distinct color scheme to highlight extremes:
* **🟢 Dark Green Zone (> 80): Extreme FOMO**
* **Meaning:** The crowd is euphoric. Risk of a correction is high.
* **Action:** Consider taking profits or looking for short entries.
* **🔴 Dark Burgundy Zone (< 20): Extreme Panic**
* **Meaning:** The crowd is capitulating. Prices may be oversold.
* **Action:** Look for buying opportunities (catching the knife with confirmation).
* **🔵 Light Blue Line:**
* The smoothed moving average of the sentiment, helpful for seeing the trend direction.
---
## 🛠️ How to Use (Trading Strategies)
### 1. Contrarian Reversals (The Primary Strategy)
* **Buy Signal:** Wait for the line to drop deep into the **Burgundy Panic Zone (< 20)** and then start curling up. This indicates that the worst of the selling pressure is over.
* **Sell Signal:** Wait for the line to spike into the **Green FOMO Zone (> 80)** and then start curling down. This suggests buying exhaustion.
### 2. Divergences
* **Bullish Divergence:** Price makes a **Lower Low**, but the DMF Indicator makes a **Higher Low** (less panic on the second drop). This is a strong reversal signal.
* **Bearish Divergence:** Price makes a **Higher High**, but the DMF Indicator makes a **Lower High** (less FOMO/buying power on the second peak).
### 3. Trend Confirmation (Midline Cross)
* **Crossing 50 Up:** Sentiment is shifting from Fear to Greed (Bullish).
* **Crossing 50 Down:** Sentiment is shifting from Greed to Fear (Bearish).
---
## ⚙️ Settings
* **Data Source:** Defaults to `INTOTHEBLOCK` for on-chain data.
* **Crypto Asset:** Auto-detects BTC/ETH, but can be forced.
* **Normalization Period:** Default 90 days. Determines the "window" for defining what is considered "Extreme" relative to recent history.
* **Weights:** You can customize how much each factor (Volume, Inflows, Price) contributes to the index.
---
**Disclaimer:** This indicator is for educational purposes only. "Dumb Money" analysis is a probability tool, not a crystal ball. Always manage your risk.
**Indicator by:** @iCD_creator
**Version:** 1.0
**Pine Script™ Version:** 6
---
## Updates & Support
For questions, suggestions, or bug reports, please comment below or message the author.
**Like this indicator? Leave a 👍 and share your feedback!**
