Multi SMA EMA WMA HMA BB (4x3 MAs Bollinger Bands) Pro MTF - RRBMulti SMA EMA WMA HMA 4x3 Moving Averages with Bollinger Bands Pro MTF by RagingRocketBull 2018
Version 1.0
This indicator shows multiple MAs of any type SMA EMA WMA HMA etc with BB and MTF support, can show MAs as dynamically moving levels.
There are 4 MA groups + 1 BB group. You can assign any type/timeframe combo to a group, for example:
- EMAs 50,100,200 x H1, H4, D1, W1 (4 TFs x 3 MAs x 1 type)
- EMAs 8,13,21,55,100,200 x M15, H1 (2 TFs x 6 MAs x 1 type)
- D1 EMAs and SMAs 12,26,50,100,200,400 (1 TF x 6 MAs x 2 types)
- H1 WMAs 7,77,231; H4 HMAs 50,100,200; D1 EMAs 144,169,233; W1 SMAs 50,100,200 (4 TFs x 3 MAs x 4 types)
- +1 extra MA type/timeframe for BB
compile time: 25-30 sec
full redraw time after parameter change in UI: 3 sec
There are several versions: Simple, MTF, Pro MTF, Advanced MTF and Ultimate MTF. This is the Pro MTF version. The Differences are listed below. All versions have BB
- Simple: you have 2 groups of MAs that can be assigned any type (5+5)
- MTF: +2 custom Timeframes for each group (2x5 MTF)
- Pro MTF: +4 custom Timeframes for each group (4x3 MTF), MA levels and show max bars back options
- Advanced MTF: +2 extra MAs/group (4x5 MTF), custom Ticker/Symbol, backreferences for type, TF and MA lengths in UI
- Ultimate MTF: +individual settings for each MA, custom Ticker/Symbols
Features:
- 4x3 = 12 MAs of any type including Hull Moving Average (HMA)
- 4x MTF groups with step line smoothing
- BB +1 extra TF/type for BB MAs
- 12 MA levels with adjustable group offsets, indents and shift
- show max bars back
- you can show/hide both groups of MAs/levels and individual MAs
Notes:
1. based on 3EmaBB, uses plot*, barssince and security functions
2. you can't set certain constants from input due to Pinescript limitations - change the code as needed, recompile and use as a private version
3. Levels = trackprice implementation
4. Show Max Bars Back = show_last implementation
5. uses timeframe textbox instead of input resolution to allow for 120 240 and other custom TFs. Also supports TFs in hours: 2H or H2
6. swma has a fixed length = 4, alma and linreg have additional offset and smoothing params
7. Smoothing is applied by default for visual aesthetics on MTF. To use exact ma mtf values (lines with stair stepping) - disable it
MTF Notes:
- uses simple timeframe textbox instead of input resolution dropdown to allow for 120, 240 and other custom TFs, also supports timeframes in H: 2H, H2
- Groups that are not assigned a Custom TF will use Current Timeframe (0).
- MTF will work for any MA type assigned to the group
- MTF works both ways: you can display a higher TF MA/BB on a lower TF or a lower TF MA/BB on a higher TF.
- MTF MA values are normally aligned at the boundary of their native timeframe. This produces stair stepping when a higher TF MA is viewed on a lower TF.
Therefore X Y Point Density/Smoothing is applied by default on MA MTF for visual aesthetics. Set both to 0 to disable and see exact ma mtf values (lines with stair stepping and original mtf alignment).
- Smoothing is disabled for BB MTF bands because fill doesn't work with smoothed MAs after duplicate values are replaced with na.
- MTF MA Value fluctuation is possible on the current bar due to default security lookahead
Smoothing:
- X,Y == 0 - X,Y smoothing disabled (stair stepping on high TFs)
- X == 0, Y > 0 - X,Y smoothing applied to all TFs
- Y == 0, X > 0 - X smoothing applied to all TFs < deltaX_max_tf, Y smoothing disabled
- X > 0, Y > 0 - Y smoothing applied to all TFs, then X smoothing applied to all TFs < deltaX_max_tf
X Smoothing with Y == 0 - shows only every deltaX-th point starting from the first bar.
X Smoothing with Y > 0 - shows only every deltaX-th point starting from the last shown Y point, essentially filling huge gaps remaining after Y Smoothing with points and preserving the curve's general shape
X Smoothing on high TFs with already scarce points produces weird curve shapes, it works best only on high density lower TFs
Y Smoothing reduces points on all TFs, removes adjacent points with prices within deltaY, while preserving the smaller curve details.
A combination of X,Y produces the most accurate smoothing. Higher delta value - larger range, more points removed.
Show Max Bars Back:
- can't set plot show_last from input -> implemented using a timenow based range check
- you can't delete/modify history once plotted, so essentially it just sets a start point for plotting (from num_bars bars back) that works only in realtime mode (not in replay)
Levels:
You can plot current MA value using plot trackprice=true or by checking Show Price Line in Style. Problem is:
- you can only change color (not the dashed line style, width), have both ma + price line (not just the line), and it's full screen wide
- you can't set plot trackprice from input => implemented using plotshape/plotchar with fixed text labels serving as levels
- there's no other way of creating a dynamic level: hline, plot, offset - nothing else works.
- you can't plot a text var - all text strings must be constants, so you can't change the style, width and text labels without recompiling.
- from input you can only adjust offset, indent and shift for each level group, and change color
- the dot below each level line is the exact MA value. If you want just the line swap plotshape with plotchar, recompile and save as your private version, adjust Y shift.
To speed up redraw times: reduce last_bars to ~2000, recompile and use as your own private version
Pinescript is a rudimentary language (should be called Painscript instead) that can basically only plot data. You can't do much else. Please see the code for tips and hints.
Certain things just can't be done or require shady workarounds and weeks of testing trying to resolve weird node.js compiler errors.
Feel free to learn from/reuse/change the code as needed and use as your own private version. See comments in code. Good Luck!
Search in scripts for "12月4号是什么星座"

Helix Protocol 7HELIX PROTOCOL 7
Overview
Helix Protocol 7 is an advanced trend-adaptive signal engine that dynamically adjusts its buy/sell thresholds based on real-time market regime detection. Unlike static indicators that use fixed overbought/oversold levels, Helix 7 recognizes that optimal entry and exit points shift dramatically depending on whether the market is trending strongly, ranging, or reversing.
The indicator fuses multiple analytical frameworks—momentum oscillators, trend strength metrics, volatility analysis, volume confirmation, and price structure—into a unified signal system that adapts to changing market conditions in real-time.
Core Philosophy
"Don't fight the trend—adapt to it."
In a strong uptrend, you want to buy dips early (before extreme oversold) and let winners run longer
In a downtrend, you want to sell bounces quickly and only buy true capitulation
In a neutral/ranging market, standard overbought/oversold levels apply
Helix Protocol 7 automatically detects which regime you're in and applies the appropriate thresholds.
Key Features
🔄 Trend-Adaptive Signal Thresholds
The indicator classifies markets into four states and adjusts Fisher Transform and RSI thresholds accordingly:
Trend StateDetection CriteriaBUY TriggersSELL TriggersSTRONG UPTRENDADX rising, ADX > 25, +DI > -DIFisher < 1.0, RSI < 50Fisher > 2.5, RSI > 70STRONG DOWNTRENDADX rising, ADX > 25, -DI > +DIFisher < -2.5, RSI < 25Fisher > 1.5, RSI > 60WEAK DOWNTRENDADX falling, -DI > +DIFisher < -2.5, RSI < 25Fisher > 1.5, RSI > 60NEUTRALDefault fallbackFisher < -2.0, RSI < 30Fisher > 2.0, RSI > 65
📊 Dynamic Envelope Bands
Adaptive bands that expand and contract based on:
ATR (Average True Range) - Base volatility measure
ADX (Trend Strength) - Bands widen in strong trends
Chaikin Oscillator - Volume-weighted band adjustment
🎯 Multi-Trigger Signal System
Signals can fire from multiple sources:
Trend-Based Signals - Fisher + RSI thresholds met for current regime
Band Touch Signals - Price touches upper/lower band (support/resistance)
EXTREME Signals - Price penetrates band by significant amount (bypasses cooldown)
⚡ Extreme Move Detection
When price makes an explosive move that penetrates the band by more than 30% of ATR (configurable), the signal fires with EXTREME priority and bypasses the normal cooldown period. This ensures you never miss major reversal opportunities.
📈 GXS Scoring System
A proprietary multi-factor scoring system (-1.0 to +1.0) that weighs:
Trend Strength (30%) - ADX direction and magnitude
Momentum (25%) - RSI, MACD, Stochastic, CCI, ROC consensus
Volume (20%) - OBV trend and volume surge detection
Price Structure (15%) - Band position and volatility percentile
Price Action (10%) - Bullish/bearish candle ratio
🔀 RSI Divergence Detection
Automatically detects and displays:
Regular Bullish Divergence - Price lower low + RSI higher low (reversal up)
Regular Bearish Divergence - Price higher high + RSI lower high (reversal down)
Hidden Bullish Divergence - Trend continuation signal (uptrend)
Hidden Bearish Divergence - Trend continuation signal (downtrend)
📉 BBWP Volatility Meter
Bollinger Band Width Percentile measures current volatility relative to historical norms:
LOW (< 30%) - Volatility compression, breakout imminent
MEDIUM (30-70%) - Normal market conditions
HIGH (> 70%) - Extended volatility, potential exhaustion
Visual Components
Money Line
A dynamic centerline (Linear Regression or Weighted EMA) colored by slope:
🟢 Green - Rising (bullish momentum)
🔴 Red - Falling (bearish momentum)
🟡 Yellow - Flat (consolidation)
Envelope Cloud
Shaded region between upper and lower bands, colored by Money Line slope direction for instant trend visualization.
Signal Labels
Clear entry/exit labels showing:
Price level
Trigger type (UPTREND DIP, CAPITULATION, BAND TOUCH, EXTREME, etc.)
Color coding (Green=Buy, Red=Sell, Lime=Extreme Buy, Fuchsia=Extreme Sell)
ADX Trend Bar
Bottom indicator showing trend state:
🟢 Lime - Strong Uptrend
🔴 Red - Downtrend
🟠 Orange - Weak/Transitional (ADX 15-24)
⚪ White - Ranging (ADX < 15)
🔵 Blue - Strong trend, neutral direction
Info Panel
Real-time dashboard displaying:
Current trend state
GXS Score
Active divergences
Volatility level (BBWP)
ADX value and direction
DI Spread
Fisher Transform value
RSI value
Context-sensitive BUY/SELL thresholds for current regime
Alert System
JSON Webhook Alerts (Bot-Ready)
json{
"action": "BUY",
"symbol": "BTC/USDT",
"price": "93500.00",
"trigger": "EXTREME",
"rsi": "28.5",
"fisher": "-2.31",
"adx": "32.4",
"trend_state": "STRONG DOWN"
}
Available Alert Conditions
Buy Signal / Sell Signal
Lower Band Touch / Upper Band Touch
EXTREME Lower Band / EXTREME Upper Band
Strong Uptrend Started
Downtrend Started
Neutral Trend Started
Trend State Change
Recommended Settings
Scalping (1m-5m)
Signal Cooldown: 3-5 bars
Extreme Penetration: 0.2 (more sensitive)
ADX Length: 10-12
Swing Trading (15m-4H)
Signal Cooldown: 5-8 bars
Extreme Penetration: 0.3 (default)
ADX Length: 14 (default)
Position Trading (Daily+)
Signal Cooldown: 8-12 bars
Extreme Penetration: 0.4-0.5 (less sensitive)
ADX Length: 14-20
Input Parameters
Core Settings
Money Line Type (Linear Regression / Weighted EMA)
Money Line Length
RSI Period
Fisher Period
Dynamic Bands
ATR Period & Multiplier
Adaptive Bands toggle
Chaikin Weight
Extreme Band Penetration threshold
Trend Detection
ADX Length & Slope Lookback
Strong Trend ADX Threshold
DI Spread for Neutral detection
Signal Thresholds (by Trend State)
Fully customizable Fisher/RSI/ADX levels for each regime
Separate BUY and SELL parameters
Display Options
Toggle bands, cloud, labels, panels
Cooldown period
Debug panel for troubleshooting
Best Practices
Confirm with price action - Signals are high-probability setups, not guarantees
Respect the trend state - The panel shows current thresholds for a reason
Watch for EXTREME signals - These indicate significant reversals
Use divergences as confluence - Especially powerful at band touches
Monitor volatility - Low BBWP often precedes big moves
Version: 7.0
Author: ralis24

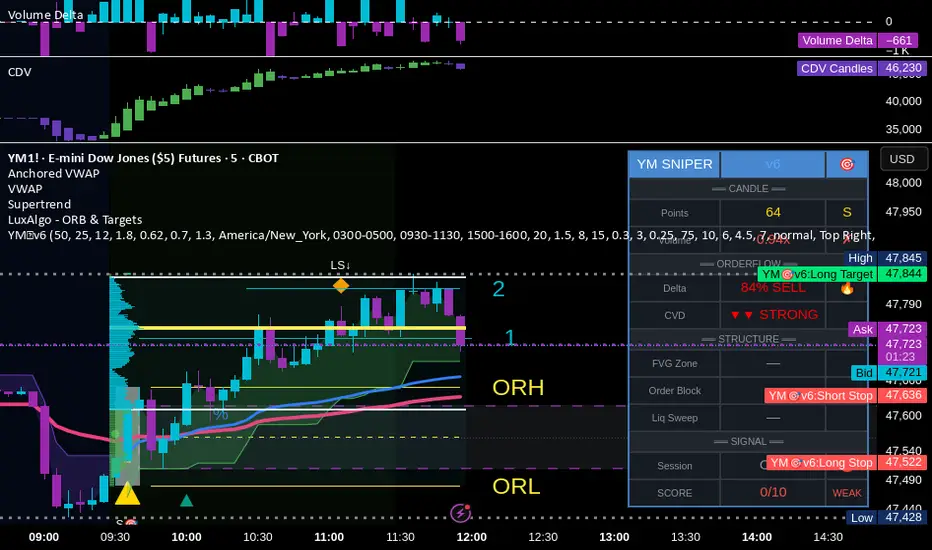
YM Ultimate SNIPER v7# YM Ultimate SNIPER v7 - Documentation & Trading Guide
## 🎯 INTRABAR EDITION | Order Blocks + Liquidity Sweeps + IFVG + INTRABAR ANALYSIS
**TARGET: 3-7 High-Confluence Trades per Day**
**Philosophy: "Zones That Matter" + "See Inside The Candle"**
---
## ⚡ WHAT'S NEW IN v7
### Major Additions: INTRABAR ANALYSIS ENGINE
| Feature | Description | Edge It Provides |
|---------|-------------|------------------|
| **Intrabar Delta** | REAL buy/sell pressure from lower TF | Far more accurate than estimated delta |
| **Intrabar Momentum** | Direction consistency within bar | See if candle formed through conviction |
| **Absorption Detection** | High vol + low price movement | Spot institutional accumulation/distribution |
| **Internal Sweeps** | Stop hunts INSIDE candles | Catch hidden liquidity grabs |
| **Volume Distribution** | Where volume clustered in bar | TOP/MID/BOT volume clustering |
### The Intrabar Advantage
**Problem with Standard Analysis:**
- You only see the final OHLC of each candle
- Delta estimation is educated guesswork
- Internal price action is invisible
- Stop hunts inside bars go undetected
**Solution with Intrabar Analysis:**
- `request.security_lower_tf()` gives us the INSIDE view
- See actual lower timeframe candles within each bar
- Calculate TRUE delta from actual price direction
- Detect sweeps and reversals hidden from current timeframe
---
## 🔬 INTRABAR ANALYSIS DEEP DIVE
### How It Works
When you're on a 5-minute chart, intrabar analysis requests 1-minute data within each 5-minute bar. This gives us 5 sub-candles to analyze within each parent candle.
```
5-MIN CANDLE (What you normally see):
┌────────────────────────────────┐
│ │
│ OPEN ──────── CLOSE │
│ │
└────────────────────────────────┘
INTRABAR VIEW (What v7 sees):
┌────────────────────────────────┐
│ 🕐1 🕐2 🕐3 🕐4 🕐5 │
│ ▲ ▼ ▲ ▲ ▲ │
│ │ │ │ │ │ │
│ Each 1-min candle analyzed │
└────────────────────────────────┘
```
### Intrabar Delta (IB Delta)
**What It Is:**
Real buy/sell pressure calculated from actual lower timeframe candle directions.
**Why It's Better:**
- Standard delta: Estimated from close position within bar
- Intrabar delta: Calculated from 5+ actual candles with known direction
**Calculation:**
```
For each intrabar candle:
├── If bullish (close > open): More weight to buy volume
├── If bearish (close < open): More weight to sell volume
├── Volume distributed by close position within each micro-candle
└── Summed across all intrabar candles = TRUE DELTA
```
**Grades:**
| IB Delta % | Grade | Meaning |
|------------|-------|---------|
| 78%+ | 🔥 EXTREME | One side has overwhelming control |
| 70-77% | ✓✓ STRONG | Clear directional bias |
| 62-69% | ✓ DOMINANT | Healthy dominance |
| <62% | — NEUTRAL | Mixed/uncertain |
---
### Intrabar Momentum (IB Momentum)
**What It Is:**
The percentage of intrabar candles moving in the same direction.
**Why It Matters:**
A bullish candle could form through:
1. **High momentum:** 4 of 5 sub-candles bullish = Strong conviction
2. **Low momentum:** 2 bullish, 2 bearish, 1 bullish = Choppy formation
**Calculation:**
```
IB Momentum = max(bullish_count, bearish_count) / total_intrabar_candles
Example (5-min bar with 1-min intrabar):
├── 1st minute: Bullish ✓
├── 2nd minute: Bullish ✓
├── 3rd minute: Bearish ✗
├── 4th minute: Bullish ✓
├── 5th minute: Bullish ✓
└── IB Momentum = 4/5 = 80% BULLISH
```
**Thresholds:**
| IB Momentum % | Classification | Signal Quality |
|---------------|----------------|----------------|
| 75%+ | 🔥 STRONG | Very high conviction |
| 60-74% | ✓ CONFIRMED | Good directional bias |
| <60% | MIXED | Choppy, low conviction |
---
### Absorption Detection
**What It Is:**
Institutional accumulation/distribution signature - high volume with little price movement.
**The Theory:**
When institutions accumulate (buy), they absorb selling without moving price much:
- Retail sells → Institution buys at limit prices
- Volume spikes but price stays flat
- Once accumulation complete → price explodes up
**Detection Logic:**
```
ABSORPTION = High Volume + Low Price Movement + Volume Clustering
Conditions:
├── Volume per point > 1.5x average
├── Price movement < 60% of average range
├── Volume clusters in one zone (TOP/MID/BOT)
└── Cluster percentage >= 65% threshold
```
**Direction:**
- **BULL ABS:** Volume clustered at BOT + net buy delta = Buying at lows
- **BEAR ABS:** Volume clustered at TOP + net sell delta = Selling at highs
**Visual:** ✕ marker below (bull) or above (bear) the candle
---
### Internal Sweeps (Hidden Liquidity Grabs)
**What It Is:**
Stop hunts that happen INSIDE a candle - invisible on current timeframe.
**The Setup:**
```
INTERNAL BULLISH SWEEP:
┌─────────────────────────────────┐
│ │
│ First Half: Second Half: │
│ ▲▼▲▼ ▲▲▲ │
│ Forms lows Reverses UP │
│ ↓ ↑ │
│ SWEEP REJECTION │
└─────────────────────────────────┘
= Hidden liquidity grab at lows, bullish
```
**Detection:**
```
Internal Bull Sweep:
├── Early intrabar candles form a low
├── Later intrabar candles sweep below that low
├── Final intrabar candles close back above
├── Parent candle closes green
└── = Hidden sweep, bullish reversal
Internal Bear Sweep:
├── Early intrabar candles form a high
├── Later intrabar candles sweep above that high
├── Final intrabar candles close back below
├── Parent candle closes red
└── = Hidden sweep, bearish reversal
```
**Visual:** "iS" marker (intrabar Sweep) on the candle
---
### Volume Distribution
**What It Is:**
Where volume clustered within the parent candle - TOP, MID, or BOT third.
**Why It Matters:**
- **BOT clustering + bullish delta:** Institutions buying at lows (bullish)
- **TOP clustering + bearish delta:** Institutions selling at highs (bearish)
- **MID clustering:** Balanced/uncertain
**Calculation:**
```
Divide parent candle into 3 zones:
├── TOP third: high - (range/3)
├── MID third: middle zone
└── BOT third: low + (range/3)
For each intrabar candle:
├── Calculate midpoint
├── Assign volume to TOP/MID/BOT based on midpoint
└── Sum volumes by zone
```
---
## 📊 ENHANCED CONFLUENCE SCORING v7
### Score Components (Max ~14, normalized to 10)
| Factor | Points | Condition |
|--------|--------|-----------|
| **Tier** | 1-3 | B=1, A=2, S=3 |
| **FVG Zone** | +1.5 | Price in quality FVG |
| **Order Block** | +1.5 | Price in OB |
| **IFVG** | +1.0 | Price in Inverse FVG |
| **Strong Volume** | +1.0 | Volume ≥ 2x average |
| **Extreme Volume** | +0.5 | Volume ≥ 2.5x average |
| **Strong Delta** | +1.0 | Delta ≥ 70% |
| **Extreme Delta** | +0.5 | Delta ≥ 78% |
| **CVD Momentum** | +0.5-1.0 | CVD trending with signal |
| **Liquidity Sweep** | +1.5 | Recent sweep confirms direction |
| **IB Delta Confirm** | +0.9-1.5 | Intrabar delta matches direction |
| **IB Momentum** | +0.5-1.0 | Consistent intrabar direction |
| **IB Absorption** | +1.0 | Absorption detected matching direction |
| **IB Internal Sweep** | +1.0 | Hidden sweep confirms direction |
| **Volume Cluster** | +0.5 | Volume at favorable zone (BOT for bull) |
### Intrabar Confluence Breakdown
```
INTRABAR CONFLUENCE ADDITIONS:
IB Delta Confirmation:
├── Strong (70%+) + matching direction = +1.5 pts
├── Dominant (62%+) + matching direction = +0.9 pts
└── Not matching = +0 pts
IB Momentum:
├── Strong (75%+) + matching direction = +1.0 pts
├── Confirmed (60%+) + matching direction = +0.5 pts
└── Mixed/not matching = +0 pts
IB Absorption:
├── Bull absorption for LONG = +1.0 pts
├── Bear absorption for SHORT = +1.0 pts
└── No absorption or wrong direction = +0 pts
IB Internal Sweep:
├── Bull internal sweep for LONG = +1.0 pts
├── Bear internal sweep for SHORT = +1.0 pts
└── No internal sweep = +0 pts
Volume Cluster:
├── BOT cluster for LONG = +0.5 pts
├── TOP cluster for SHORT = +0.5 pts
└── MID cluster or wrong zone = +0 pts
```
---
## 🎯 IDEAL SETUPS v7 (HIGHEST WIN RATE)
### Setup 1: Absorption + Zone + Tier (NEW!)
```
Conditions:
├── Absorption detected (✕ marker)
├── Price at Order Block or FVG
├── Tier signal fires (S/A/B)
├── IB Delta confirms direction
├── Score: 8+ EXCELLENT
└── Win Rate: ~80-88%
WHY IT WORKS:
Absorption = institutions filling orders
Zone = known institutional level
Tier = significant move
= Triple institutional confirmation
```
### Setup 2: Internal Sweep + Zone
```
Conditions:
├── Internal sweep detected (iS marker)
├── At or near OB/FVG zone
├── IB momentum confirms (75%+)
├── Score: 7+ EXCELLENT
└── Win Rate: ~75-85%
WHY IT WORKS:
Hidden sweep = invisible stop hunt
Zone = where institutions defend
= Retail trapped, you enter with smart money
```
### Setup 3: Full Intrabar Alignment
```
Conditions:
├── IB Delta: Strong/Extreme (✓✓ or 🔥)
├── IB Momentum: Strong (🔥)
├── Volume Cluster: Favorable zone
├── Standard delta confirms
├── Score: 7+ EXCELLENT
└── Win Rate: ~75-82%
WHY IT WORKS:
All intrabar metrics align
= Maximum conviction in candle formation
= High probability continuation
```
### Setup 4: Standard v6 Setup (Still Valid)
```
Conditions:
├── Liquidity Sweep (LS↑ or LS↓)
├── Price at Order Block or FVG
├── Tier signal fires
├── Score: 7+ EXCELLENT
└── Win Rate: ~75-85%
```
---
## 📊 ENHANCED TABLE REFERENCE v7
The v7 table adds the **INTRABAR** section:
### CANDLE Section
| Row | What It Shows |
|-----|---------------|
| Points | Candle range in points + Tier (S/A/B/X) |
| Volume | Volume ratio + grade |
### ORDERFLOW Section
| Row | What It Shows |
|-----|---------------|
| Delta | Buy/Sell % + grade (now uses IB delta if available) |
| CVD | Direction + strength |
### INTRABAR Section (NEW!)
| Row | What It Shows |
|-----|---------------|
| IB Delta | TRUE intrabar buy/sell % + grade |
| IB Momentum | Direction consistency % + grade |
| Absorption | BULL ABS / BEAR ABS / — + 🎯 indicator |
### STRUCTURE Section
| Row | What It Shows |
|-----|---------------|
| FVG Zone | Current zone + quality score |
| Order Block | OB status |
| Liq Sweep | External LS↑/↓ or internal iS↑/↓ + indicator |
### SIGNAL Section
| Row | What It Shows |
|-----|---------------|
| Session | Current session + active indicator |
| SCORE | Numeric score /10 + classification |
---
## 🔧 INTRABAR SETTINGS GUIDE
### Intrabar Timeframe Selection
| Chart TF | Recommended Intrabar TF | Sub-candles |
|----------|------------------------|-------------|
| 1 min | 1 (same) | Limited data |
| 3 min | 1 | 3 candles |
| 5 min | 1 | 5 candles |
| 15 min | 1 or 5 | 15 or 3 candles |
| 30 min | 5 | 6 candles |
| 1 hour | 5 or 15 | 12 or 4 candles |
**Rule of Thumb:** Lower intrabar TF = more data = more accurate
### Parameter Tuning
**Absorption Threshold (Default: 65%)**
```
Lower (50-60%): More absorption signals, some false positives
Standard (65%): Balanced detection
Higher (70-80%): Fewer signals, higher quality
```
**Intrabar Momentum Min (Default: 60%)**
```
Lower (50-55%): Accepts mixed candles as directional
Standard (60%): Requires clear majority
Higher (70-80%): Requires strong conviction
```
**Intrabar Delta Weight (Default: 1.5)**
```
Lower (0.5-1.0): Intrabar delta contributes less to score
Standard (1.5): Full contribution
Higher (2.0-3.0): Intrabar delta heavily weighted
```
---
## ✅ ENTRY CHECKLIST v7
### Basic Requirements
- Signal present (S🎯/A🎯/B🎯 or Z)
- Score ≥ 4.5 (MEDIUM or better)
- Session active (🟢)
### Orderflow Confirmation
- Delta colored (not gray)
- CVD arrow matches direction
- Volume shows ✓ or better
### Intrabar Confirmation (NEW!)
- IB Delta matches direction (✓ or better)
- IB Momentum shows direction or strong (🔥)
- No conflicting absorption signal
### Structure Bonus
- In FVG Zone
- In Order Block
- Recent Liquidity Sweep
- Internal Sweep (iS)
- Absorption detected
- IFVG present
---
## 🚨 NEW ALERTS v7
### Intrabar-Specific Alerts
| Alert | What It Means | Priority |
|-------|---------------|----------|
| ⚡ INTRABAR BULL SWEEP | Hidden sweep lows inside candle | 🟠 HIGH |
| ⚡ INTRABAR BEAR SWEEP | Hidden sweep highs inside candle | 🟠 HIGH |
| 🎯 BULL ABSORPTION | Institutions accumulating | 🟠 HIGH |
| 🎯 BEAR ABSORPTION | Institutions distributing | 🟠 HIGH |
### Alert Priority Guide
| Alert | Priority | Action |
|-------|----------|--------|
| ⭐ EXCELLENT + ABSORPTION | 🔴 CRITICAL | Top-tier, enter immediately |
| ⭐ EXCELLENT LONG/SHORT | 🔴 CRITICAL | Check NOW |
| 🎯 ABSORPTION | 🟠 HIGH | Check for zone confluence |
| ⚡ INTRABAR SWEEP | 🟠 HIGH | Hidden opportunity |
| 🎯 S-TIER | 🟠 HIGH | Evaluate quickly |
---
## ⛔ DO NOT TRADE v7
All previous rules PLUS:
- IB Delta strongly conflicts with signal direction
- IB Momentum shows opposite direction at 75%+
- Absorption detected in OPPOSITE direction
- Score inflated only by intrabar (no structure)
- Intrabar data unavailable (empty array)
---
## 📝 TECHNICAL NOTES v7
### Compatibility
- **Pine Script v6** (required for `request.security_lower_tf()`)
- **Works on**: YM, MYM, NQ, MNQ, ES, MES, GC, MGC, BTC
- **Chart Type**: Standard candlestick (not Renko/Heikin Ashi)
- **Timeframes**: 1-minute to 4-hour recommended
- **Tick Charts**: Use 1-minute intrabar TF
### Performance Notes
- Intrabar analysis adds computational overhead
- If chart loads slowly, try higher intrabar TF
- `request.security_lower_tf()` returns array of data
- Empty arrays indicate no lower TF data available
### Timeframe Limitations
```
request.security_lower_tf() works when:
├── Intrabar TF < Chart TF (e.g., 1 min intrabar on 5 min chart)
└── Chart receives enough data from lower TF
Does NOT work when:
├── Intrabar TF >= Chart TF
├── Tick charts with minute intrabar (use seconds or same)
└── Very old historical data
```
---
## 📈 TRADE JOURNAL v7
```
DATE: ___________
SESSION: ☐ LDN ☐ NY ☐ PWR
SETUP TYPE:
☐ Absorption + Zone ☐ Internal Sweep ☐ Full IB Align
☐ Sweep + Zone ☐ IFVG ☐ OB+FVG ☐ Zone Entry
TRADE:
├── Time: _______
├── Signal: S🎯 / A🎯 / B🎯 / Z / LS / iS
├── Direction: LONG / SHORT
├── Score: ___/10 (EXCELLENT / MEDIUM)
├── Entry: _______
├── Stop: _______
├── Target: _______
│
├── In FVG Zone: ☐ Yes ☐ No
├── In Order Block: ☐ Yes ☐ No
├── Liquidity Sweep: ☐ Yes ☐ No
├── Internal Sweep: ☐ Yes ☐ No
├── Absorption: ☐ Yes ☐ No
├── IFVG Present: ☐ Yes ☐ No
│
├── IB Delta: _____% (BULL / BEAR)
├── IB Momentum: _____% (BULL / BEAR / MIXED)
├── Volume Cluster: TOP / MID / BOT
│
├── Result: +/- ___ pts ($_____)
└── Notes: _______________________
DAILY SUMMARY:
├── Trades: ___
├── EXCELLENT setups: ___
├── With Absorption: ___
├── With Internal Sweep: ___
├── Wins: ___ | Losses: ___
├── Net P/L: $_____
└── Best setup type: _______________________
```
---
## 🏆 GOLDEN RULES v7
> **"Intrabar shows the truth the candle hides."**
> **"Absorption = They're loading. Get ready."**
> **"Internal sweep = Hidden trap. Enter after."**
> **"IB Delta + IB Momentum aligned = Maximum conviction."**
> **"When intrabar conflicts with signal, trust intrabar."**
> **"Volume at lows + buying = Institutions accumulating."**
> **"Confluence beats conviction. Stack the factors."**
> **"Leave every trade with money. The next setup is coming."**
---
## 🔧 TROUBLESHOOTING v7
| Issue | Solution |
|-------|----------|
| No intrabar data | Lower your chart TF or raise intrabar TF |
| IB Delta always neutral | Check intrabar TF is lower than chart TF |
| Too many absorption signals | Raise absorption threshold to 70%+ |
| Missing internal sweeps | More common on volatile markets |
| Slow chart loading | Use higher intrabar TF (5 instead of 1) |
| IB section not in table | Enable "Show Intrabar Metrics" |
| Conflicting signals | Trust intrabar data over standard delta |
---
## 📚 QUICK REFERENCE CARD
```
┌─────────────────────────────────────────────────────────────────────────┐
│ YM ULTIMATE SNIPER v7 │
├─────────────────────────────────────────────────────────────────────────┤
│ │
│ SIGNALS: │
│ S🎯 = S-Tier (50+ pts) → HOLD position │
│ A🎯 = A-Tier (25-49 pts) → SWING trade │
│ B🎯 = B-Tier (12-24 pts) → SCALP quick │
│ Z = Zone entry │
│ LS↑/↓ = External Liquidity Sweep │
│ iS↑/↓ = Internal (intrabar) Sweep │
│ ✕ = Absorption detected │
│ │
│ INTRABAR METRICS: │
│ IB Delta = TRUE buy/sell from lower TF │
│ IB Momentum = Direction consistency within bar │
│ Absorption = High vol + low move = accumulation │
│ Vol Cluster = TOP/MID/BOT volume distribution │
│ │
│ INTRABAR GRADES: │
│ 🔥 = Extreme (78%+ delta or 75%+ momentum) │
│ ✓✓ = Strong (70%+ delta) │
│ ✓ = Confirmed (62%+ delta or 60%+ momentum) │
│ — = Neutral / Mixed │
│ │
│ HIGH PROBABILITY SETUPS: │
│ 1. Absorption + Zone + Tier (~80-88%) │
│ 2. Internal Sweep + Zone (~75-85%) │
│ 3. Full Intrabar Alignment (~75-82%) │
│ 4. Standard Sweep + Zone (~75-85%) │
│ │
│ SCORE CLASSIFICATION: │
│ EXCELLENT (7.0+) = Full size, high confidence │
│ MEDIUM (4.5-6.9) = Standard size, good setup │
│ WEAK (<4.5) = No signal shown │
│ │
└─────────────────────────────────────────────────────────────────────────┘
```
---
*© Alexandro Disla - YM Ultimate SNIPER v7*
*Intrabar Edition | See Inside The Candle*

YM Ultimate SNIPER v6# YM Ultimate SNIPER v6 - Documentation & Trading Guide
## 🎯 ORDERFLOW EDITION | Order Blocks + Liquidity Sweeps + IFVG
**TARGET: 3-7 High-Confluence Trades per Day**
**Philosophy: "Zones That Matter"**
---
## ⚡ WHAT'S NEW IN v6
### Major Additions
| Feature | Description | Orderflow Purpose |
|---------|-------------|-------------------|
| **Order Blocks** | Last opposing candle before significant move | Shows where institutions absorbed orders |
| **Liquidity Sweeps** | Sweep of swing H/L with rejection | Identifies stop hunts / trap reversals |
| **IFVG** | Inverse FVG when price reclaims a gap | Failed institutional move = reversal signal |
| **Zone Quality Score** | 0-10 rating for each zone | Only "zones that matter" display |
| **3-Tier Scoring** | Weak/Medium/Excellent classification | Better trade selection |
| **Enhanced Table** | Larger, categorized, color-coded | Instant situation awareness |
### Orderflow Mindset
This version is built around **institutional order flow concepts**:
1. **Institutions leave footprints** → Order Blocks mark where they filled orders
2. **Retail gets trapped** → Liquidity Sweeps show the trap before reversal
3. **Failed moves reverse hard** → IFVG marks failed institutional attempts
4. **Not all zones are equal** → Quality scoring filters noise
---
## 🎯 QUICK REFERENCE
```
┌─────────────────────────────────────────────────────────────────────────┐
│ YM ULTIMATE SNIPER v6 │
├─────────────────────────────────────────────────────────────────────────┤
│ │
│ SIGNALS: │
│ S🎯 = S-Tier (50+ pts) → HOLD position │
│ A🎯 = A-Tier (25-49 pts) → SWING trade │
│ B🎯 = B-Tier (12-24 pts) → SCALP quick │
│ Z = Zone entry (quality FVG/OB zone) │
│ LS↑ = Bullish Liquidity Sweep (lows swept + rejection) │
│ LS↓ = Bearish Liquidity Sweep (highs swept + rejection) │
│ │
│ ZONES: │
│ 🟦 Blue boxes = Bullish Order Block (buy zone) │
│ 🟪 Pink boxes = Bearish Order Block (sell zone) │
│ 🟩 Green boxes = Bullish FVG (buy zone) │
│ 🟥 Red boxes = Bearish FVG (sell zone) │
│ 🟣 Purple dashed = IFVG (inverse - strong reversal zone) │
│ │
│ SCORE CLASSIFICATION: │
│ EXCELLENT (7.0+) = Full size, high confidence │
│ MEDIUM (4.5-6.9) = Standard size, good setup │
│ WEAK (<4.5) = No signal shown │
│ │
│ SESSIONS (ET): │
│ LDN = 3:00-5:00 AM (London) │
│ NY = 9:30-11:30 AM (New York Open) │
│ PWR = 3:00-4:00 PM (Power Hour) │
│ │
└─────────────────────────────────────────────────────────────────────────┘
```
---
## 📦 ORDER BLOCKS (OB)
### What Are Order Blocks?
Order blocks mark the **last opposing candle before a significant move**. This is where institutional traders absorbed retail orders before moving price in their intended direction.
### Detection Logic (Breaker Style)
```
BULLISH OB:
├── Last BEARISH candle before strong bullish move
├── Move after must be ≥ 1.5x ATR
├── Shows where institutions absorbed selling
└── Expect support when price returns
BEARISH OB:
├── Last BULLISH candle before strong bearish move
├── Move after must be ≥ 1.5x ATR
├── Shows where institutions absorbed buying
└── Expect resistance when price returns
```
### OB Quality Scoring
Each Order Block gets a strength score (0-10) based on:
- **Move strength** after the OB (ATR multiple)
- **Volume** on the OB candle
- **Body ratio** of the OB candle
Only OBs with strength ≥ 4 are displayed.
### Trading Order Blocks
| Scenario | Action |
|----------|--------|
| Price returns to Bull OB + buy delta | Look for LONG |
| Price returns to Bear OB + sell delta | Look for SHORT |
| OB + FVG overlap (thick border) | HIGH PROBABILITY |
| OB tested once (gray) | Still valid, often best entry |
| OB broken (closes through) | Invalidated, removed |
---
## 💎 LIQUIDITY SWEEPS
### What Are Liquidity Sweeps?
A liquidity sweep occurs when price **hunts stop losses** by briefly breaking a swing high/low, then **immediately reverses** back. This is the classic "stop hunt" or "liquidity grab."
### Detection Logic
```
BULLISH SWEEP (LS↑):
├── Price sweeps BELOW a recent swing low
├── Closes BACK ABOVE the swing level
├── Shows lower wick (rejection)
├── Buy delta dominance on the candle
└── SIGNAL: Lows swept, shorts trapped → GO LONG
BEARISH SWEEP (LS↓):
├── Price sweeps ABOVE a recent swing high
├── Closes BACK BELOW the swing level
├── Shows upper wick (rejection)
├── Sell delta dominance on the candle
└── SIGNAL: Highs swept, longs trapped → GO SHORT
```
### Why Sweeps Matter for Orderflow
1. **Retail stops get hit** → Liquidity provided to institutions
2. **Institutions fill orders** → At better prices thanks to the sweep
3. **Price reverses** → Move in intended direction begins
4. **You enter with institutions** → Not against them
### Sweep + Zone = High Probability
When a liquidity sweep happens AT or NEAR an Order Block or FVG zone, the probability increases significantly.
---
## 🔄 IFVG (INVERSE FVG)
### What Is an IFVG?
An Inverse FVG forms when price **fills an FVG and then reclaims it** in the opposite direction. This signals a **failed institutional move**.
### Detection Logic
```
BULLISH IFVG:
├── Bearish FVG was created (gap down)
├── Price fills the gap (tests zone)
├── Price CLOSES ABOVE the gap with buy delta
└── SIGNAL: Bears failed → Strong reversal UP
BEARISH IFVG:
├── Bullish FVG was created (gap up)
├── Price fills the gap (tests zone)
├── Price CLOSES BELOW the gap with sell delta
└── SIGNAL: Bulls failed → Strong reversal DOWN
```
### Why IFVG Is Powerful
- Shows institutional failure → Other side takes control
- Pre-assigned quality score of 8.0 (high priority)
- Often marks significant reversals
- Purple dashed boxes for easy identification
---
## 📊 ZONE QUALITY SCORING
### The "Zones That Matter" Filter
Not all FVGs and OBs are created equal. v6 implements a **Zone Quality Score** (0-10) that filters out low-quality zones.
### Quality Calculation
| Factor | Max Points | How Measured |
|--------|------------|--------------|
| Gap Size | 2.5 | Larger gap = more points |
| Impulse Strength | 2.5 | Stronger move = more points |
| Volume | 2.0 | Higher volume = more points |
| OB Alignment | 2.0 | FVG overlaps with OB = bonus |
| Session | 1.0 | Created in active session = bonus |
### Min Quality Threshold (Default: 6.0)
Zones scoring below this threshold **are not displayed**. Adjust in settings:
- **Conservative**: Set to 7.0+ (fewer, better zones)
- **Standard**: 6.0 (balanced)
- **Aggressive**: 4.0-5.0 (more zones, more noise)
### Visual Quality Indicators
- **Thick border**: Zone aligns with Order Block (high quality)
- **Bright color**: Fresh zone
- **Gray color**: Tested zone (still valid)
- **Removed**: Broken zone (invalidated)
---
## 📊 CONFLUENCE SCORING SYSTEM
### Score Components (Max ~12, normalized to 10)
| Factor | Points | Condition |
|--------|--------|-----------|
| **Tier** | 1-3 | B=1, A=2, S=3 |
| **FVG Zone** | +1.5 | Price in quality FVG |
| **Order Block** | +1.5 | Price in OB |
| **IFVG** | +1.0 | Price in Inverse FVG |
| **Strong Volume** | +1.0 | Volume ≥ 2x average |
| **Extreme Volume** | +0.5 | Volume ≥ 2.5x average |
| **Strong Delta** | +1.0 | Delta ≥ 70% |
| **Extreme Delta** | +0.5 | Delta ≥ 78% |
| **CVD Momentum** | +0.5-1.0 | CVD trending with signal |
| **Liquidity Sweep** | +1.5 | Recent sweep confirms direction |
### Score Classification
| Score | Class | Confidence | Position Size |
|-------|-------|------------|---------------|
| **7.0+** | EXCELLENT | Very High | Full size (100%) |
| **4.5-6.9** | MEDIUM | Good | Standard (75%) |
| **< 4.5** | WEAK | Low | No signal shown |
### Score Displayed in Table
The table shows both the numeric score and classification:
- Green background + "EXCELLENT" = Top tier setup
- Orange background + "MEDIUM" = Decent setup
- Gray + "WEAK" = Below threshold
---
## 📊 ENHANCED TABLE REFERENCE
The v6 table is organized into **4 sections**:
### CANDLE Section
| Row | What It Shows |
|-----|---------------|
| Points | Candle range in points + Tier (S/A/B/X) |
| Volume | Volume ratio + grade (🔥/✓✓/✓/✗) |
### ORDERFLOW Section
| Row | What It Shows |
|-----|---------------|
| Delta | Buy/Sell % + grade (🔥/✓✓/✓/—) |
| CVD | Direction + strength (▲▲ STRONG, ▲ UP, etc.) |
### STRUCTURE Section
| Row | What It Shows |
|-----|---------------|
| FVG Zone | Current zone status + quality score |
| Order Block | OB status (BULL OB / BEAR OB / —) |
| Liq Sweep | Recent sweep status + 🎯 indicator |
### SIGNAL Section
| Row | What It Shows |
|-----|---------------|
| Session | Current session (NY/LDN/PWR/OFF) + 🟢/🔴 |
| SCORE | Numeric score /10 + classification |
### Color Coding
- **🟢 Green/Lime**: Good, meets threshold, bullish
- **🟠 Orange/Amber**: Caution, borderline, medium
- **🔴 Red**: Bad, below threshold, bearish
- **⚪ Gray**: Inactive/neutral
- **🔥**: Extreme/exceptional reading
---
## ✅ ENTRY CHECKLIST v6
Before entering any trade:
### Basic Requirements
- Signal present (S🎯/A🎯/B🎯 or Z)
- Score ≥ 4.5 (MEDIUM or better)
- Session active (LDN/NY/PWR shows 🟢)
### Orderflow Confirmation
- Delta colored (not gray)
- CVD arrow matches direction
- Volume shows ✓ or better
### Structure Bonus (Any = Better)
- In FVG Zone
- In Order Block
- Recent Liquidity Sweep
- IFVG present
### Execute
- Enter at signal candle close
- Stop below/above candle (shown on chart)
- Target at calculated R:R level
---
## 🎯 IDEAL SETUPS (HIGH WIN RATE)
### Setup 1: Sweep + Zone + Tier
```
Conditions:
├── Liquidity Sweep just occurred (LS↑ or LS↓)
├── Price is at Order Block or FVG
├── Tier signal fires (S/A/B)
├── Score: 7+ EXCELLENT
└── Win Rate: ~75-85%
```
### Setup 2: IFVG + Delta Confirmation
```
Conditions:
├── IFVG just formed (purple zone)
├── Strong delta (70%+) in IFVG direction
├── CVD confirming
├── Score: 7+ EXCELLENT
└── Win Rate: ~70-80%
```
### Setup 3: OB + FVG Overlap
```
Conditions:
├── Order Block present
├── FVG zone overlaps with OB (thick border)
├── Price returns to overlap zone
├── Delta confirms direction
└── Win Rate: ~70-78%
```
### Setup 4: Clean Zone Entry
```
Conditions:
├── Quality zone (score 6+)
├── No tier signal but Z entry shows
├── Delta matches zone direction
├── In active session
└── Win Rate: ~65-72%
```
---
## ⛔ DO NOT TRADE
- Session shows "OFF" or 🔴
- Score < 4.5 (WEAK)
- Delta shows "—" (no dominance)
- CVD conflicts with signal direction
- Multiple conflicting zones
- Zone quality < 6
- Major news imminent (FOMC, NFP, CPI)
- Price chopping between zones
---
## 🔧 SETTINGS GUIDE
### Recommended Configurations
**Conservative (2-4 trades/day):**
```
Min Score Medium: 5.5
Min Score Excellent: 7.5
Min Zone Quality: 7.0
Min Volume Ratio: 2.0
Delta Threshold: 65%
```
**Standard (4-6 trades/day):**
```
Min Score Medium: 4.5
Min Score Excellent: 7.0
Min Zone Quality: 6.0
Min Volume Ratio: 1.8
Delta Threshold: 62%
```
**Aggressive (6-8 trades/day):**
```
Min Score Medium: 4.0
Min Score Excellent: 6.5
Min Zone Quality: 5.0
Min Volume Ratio: 1.5
Delta Threshold: 60%
```
---
## 🚨 ALERTS PRIORITY
### Must-Have Alerts
| Alert | Priority | Action |
|-------|----------|--------|
| ⭐ EXCELLENT LONG/SHORT | 🔴 CRITICAL | Drop everything, check NOW |
| 🎯 S-TIER | 🟠 HIGH | Evaluate within 10 seconds |
| 💎 LIQUIDITY SWEEP | 🟠 HIGH | Check for zone confluence |
| 🔄 IFVG | 🟡 MEDIUM | Note reversal potential |
### Useful Context Alerts
| Alert | Purpose |
|-------|---------|
| 📦 NEW OB | Mark institutional zone |
| 📦 NEW FVG | Mark gap zone |
| SESSION OPEN | Prepare to trade |
---
## 📈 TRADE JOURNAL v6
```
DATE: ___________
SESSION: ☐ LDN ☐ NY ☐ PWR
SETUP TYPE:
☐ Sweep + Zone ☐ IFVG ☐ OB+FVG ☐ Zone Entry
TRADE:
├── Time: _______
├── Signal: S🎯 / A🎯 / B🎯 / Z / LS
├── Direction: LONG / SHORT
├── Score: ___/10 (EXCELLENT / MEDIUM)
├── Entry: _______
├── Stop: _______
├── Target: _______
│
├── In FVG Zone: ☐ Yes ☐ No
├── In Order Block: ☐ Yes ☐ No
├── Liquidity Sweep: ☐ Yes ☐ No
├── IFVG Present: ☐ Yes ☐ No
│
├── Result: +/- ___ pts ($_____)
└── Notes: _______________________
DAILY SUMMARY:
├── Trades: ___
├── EXCELLENT setups: ___
├── MEDIUM setups: ___
├── Wins: ___ | Losses: ___
├── Net P/L: $_____
└── Best setup type: _______________________
```
---
## 🏆 GOLDEN RULES v6
> **"Institutions sweep, then move. Wait for the sweep."**
> **"Order Blocks show where they filled. Trade there."**
> **"IFVG = They failed. Take the other side."**
> **"Zone Quality 6+ or walk away."**
> **"EXCELLENT score = Green light. MEDIUM = Yellow light. WEAK = Red light."**
> **"Confluence beats conviction. Stack the factors."**
> **"Leave every trade with money. The next setup is coming."**
---
## 🔧 TROUBLESHOOTING
| Issue | Solution |
|-------|----------|
| No signals | Lower Min Score Medium to 4.0 |
| Too many signals | Raise Min Score Medium to 5.5+ |
| Too many zones | Raise Min Zone Quality to 7.0+ |
| Zones cluttering | Reduce Max Zones to 6-8 |
| OBs everywhere | Raise OB Min Strength to 1.8+ |
| Missing sweeps | Lower Sweep Lookback, reduce Min Wick Ratio |
| Table too small | Change Table Size to "large" |
| Wrong timezone | Check Session Timezone setting |
---
## 📝 TECHNICAL NOTES
- **Pine Script v6** (latest syntax)
- **Works on**: YM, MYM, NQ, MNQ, ES, MES, GC, MGC
- **Auto-detects** instrument for proper point calculation
- **Recommended TF**: 1-5 minute for day trading
- **Min TradingView Plan**: Free (no premium features required)
- **Max visual elements**: 500 labels, 500 boxes, 500 lines
---
*© Alexandro Disla - YM Ultimate SNIPER v6*
*Orderflow Edition | Zones That Matter*
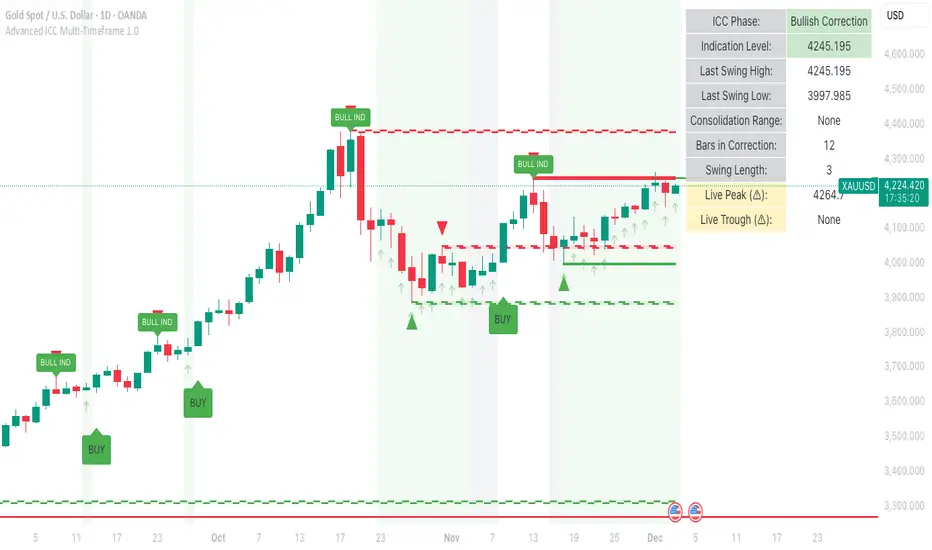
Advanced ICC Multi-Timeframe 1.0Advanced ICC Multi-Timeframe Trading System
A comprehensive implementation and interpretation of the Indication, Correction, Continuation (ICC) trading methodology made popular by Trades by Sci, enhanced with advanced multi-timeframe analysis and automation features.
⚠️ CRITICAL TRADING WARNINGS:
DO NOT blindly follow BUY/SELL signals from this indicator
This indicator shows potential entry points but YOU must validate each trade
PAPER TRADE EXTENSIVELY before risking real capital
BACKTEST THOROUGHLY on your chosen instruments and timeframes
The ICC methodology requires understanding and discretion - automated signals are guidance only
This tool aids analysis but does not replace proper trade planning, risk management, or trader judgment
⚠️ Important Disclaimers:
This indicator is not endorsed by or affiliated with Trades by Sci
This is an early implementation and interpretation of the ICC methodology
May not work exactly as Trades by Sci executes his trades and entries
Requires further debugging, backtesting, and real-world validation
Completely free to use - no purchase required
I'm just one person obsessed with this method and wanted some better visualization of the chart/entries
About ICC:
The ICC method identifies complete market cycles through three phases: Indication (breakout), Correction (pullback), and Continuation (entry). This indicator automates the identification of these phases and adds powerful features for modern traders.
Key Features:
Multi-Timeframe Capabilities:
Automatic timeframe detection with optimized settings for 5m, 15m, 30m, 1H, 4H, and Daily charts
Higher timeframe overlay to view HTF ICC levels on lower timeframe charts for precise entry timing
Smart defaults that adjust swing length and consolidation detection based on your timeframe
Advanced Phase Tracking:
Complete ICC cycle tracking: Indication, Correction, Consolidation, Continuation, and No Setup phases
Live structure detection shows potential peaks/troughs before full confirmation
Intelligent invalidation logic detects failed setups when market structure reverses
Dynamic phase backgrounds for instant visual confirmation
Three Types of Entry Signals:
Traditional Entries - Price crosses back through the original indication level (strongest signals)
"BUY" (green) / "SELL" (red)
Breakout Entries - Price breaks out of consolidation range in the same direction
"BUY" (green) / "SELL" (red)
Reversal Entries (Optional, can be toggled off) - Price breaks consolidation in opposite direction, indicating failed setup
"⚠ BUY" (yellow) / "⚠ SELL" (orange)
More aggressive, counter-trend signals
Can be disabled for more conservative trading
Professional Features:
Volatility-based support/resistance zones (ATR-adjusted) that adapt to market conditions
Historical zone tracking (0-3 configurable) with visual hierarchy
Comprehensive real-time info table displaying all key metrics
Full alert system for entries, indications, and consolidation detection
Visual distinction between high-confidence trend entries and cautionary reversal entries
📖 USAGE GUIDE
Entry Signal Types:
The indicator provides three types of entry signals with visual distinction:
Strong Entries (High Confidence):
"BUY" (bright green) / "SELL" (bright red)
Includes traditional entries (crossing back through indication level) and breakout entries (breaking consolidation in trend direction)
These are trend continuation or breakout signals with higher probability
Recommended for all traders
Reversal Entries (Caution - Counter-Trend):
"⚠ BUY" (yellow) / "⚠ SELL" (orange)
Triggered when price breaks out of correction/consolidation in the OPPOSITE direction
Indicates a failed setup and potential trend reversal
More aggressive, counter-trend plays
Can be toggled off in settings for more conservative trading
Recommended only for experienced traders or after thorough backtesting
Swing Length Settings:
The swing length determines how many bars on each side are needed to confirm a swing high/low. This is the most important setting for tuning the indicator to your style.
Auto Mode (Recommended for beginners): Toggle "Use Auto Timeframe Settings" ON
5-minute: 30 bars
15-minute: 20 bars
30-minute: 12 bars
1-hour: 7 bars
4-hour: 5 bars
Daily: 3 bars
Manual Mode: Toggle "Use Auto Timeframe Settings" OFF
Lower values (3-7): More aggressive, detects smaller swings
Pros: More signals, faster entries, catches smaller moves
Cons: More noise, more false signals, requires tighter stops
Best for: Scalping, active day trading, volatile markets
Higher values (12-20): More conservative, only major swings
Pros: More reliable signals, fewer false breakouts, clearer structure
Cons: Fewer signals, delayed entries, might miss smaller opportunities
Best for: Swing trading, position trading, trending markets
Default Manual Setting: 7 bars (balanced for 1H charts)
Minimum: 3 bars
Consolidation Bars Setting:
Determines how many bars without new structure are needed before flagging consolidation.
Lower values (3-10): Faster detection, catches brief pauses, more sensitive
Best for: Lower timeframes, volatile markets, avoiding any chop
Higher values (20-40): More reliable, only flags true extended consolidation
Best for: Higher timeframes, trending markets, patient traders
Current defaults scale with timeframe (more bars needed on shorter timeframes)
Historical S/R Zones:
Shows previous support and resistance levels to provide context.
Default: 2 historical zones (shows current + 2 previous)
Range: 0-3 zones
Visual Hierarchy: Older zones are more transparent with dashed borders
Usage: Higher numbers (2-3) show more historical context but can clutter the chart. Start with 2 and adjust based on your preference.
Live Structure Feature (Yellow Warning ⚠):
Provides early warning of potential structure changes before full confirmation.
What it does: Detects potential swing highs/lows after just 2 bars instead of waiting for full swing_length confirmation
Live Peak: Shows when a high is followed by 2 lower closes (potential top forming)
Live Trough: Shows when a low is followed by 2 higher closes (potential bottom forming)
Important: These are UNCONFIRMED - they may be invalidated if price reverses
Use case: Get early awareness of potential reversals while waiting for confirmation
Displayed in: Info table only (no visual markers on chart to reduce clutter)
Only shows: Peaks higher than last swing high, or troughs lower than last swing low (filters out noise)
Higher Timeframe (HTF) Analysis:
View higher timeframe ICC structure while trading on lower timeframes.
How to enable: Toggle "Show Higher Timeframe ICC" ON
Setup: Set "Higher Timeframe" to your reference timeframe
Example: Trading on 15-minute? Set HTF to 240 (4-hour) or 60 (1-hour)
Example: Trading on 5-minute? Set HTF to 60 (1-hour) or 15 (15-minute)
What it shows:
HTF indication levels displayed as dashed lines
Blue = HTF Bullish Indication
Purple = HTF Bearish Indication
HTF phase and levels shown in info table
Trading workflow:
Check HTF phase for overall market direction
Wait for HTF correction phase
Drop to lower timeframe to find precise entries
Enter when lower TF shows continuation in alignment with HTF
Best practice: HTF should be 3-4x your trading timeframe for best results
Reversal Entries Toggle:
Default: ON (shows all signal types)
Toggle OFF for more conservative trading (only trend continuation signals)
Recommended: Backtest with both settings to see which works better for your style
New traders should consider disabling reversal entries initially
Volatility-Based Zones:
When enabled, support/resistance zones automatically adjust their height based on ATR (Average True Range).
More volatile = wider zones
Less volatile = tighter zones
Toggle OFF for fixed-width zones
Community Feedback Welcome:
This is an evolving project and your input is valuable! Please share:
Bug reports and issues you encounter
Feature requests and suggestions for improvement
Results from your backtesting and live trading experience
Feedback on the reversal entry feature (too aggressive? working well?)
Ideas for better aligning with the ICC methodology
Perfect for traders learning or implementing the ICC methodology with the benefit of modern automation, multi-timeframe analysis, and flexible entry signal options.
One for AllOne for All (OFA) - Complete ICT Analysis Suite
Version 3.3.0 by theCodeman
📊 Overview
One for All (OFA) is a comprehensive TradingView indicator designed for traders who follow Inner Circle Trader (ICT) concepts. This all-in-one tool combines essential ICT analysis features—sessions, kill zones, previous period levels, and higher timeframe candles with Fair Value Gaps (FVGs) and Volume Imbalances (VIs)—into a single, highly customizable indicator. Whether you're a beginner learning ICT concepts or an experienced trader refining your edge, OFA provides the visual structure needed for precise market analysis and execution.
✨ Key Features
- 🏷️ Customizable Watermark**: Display your trading identity with customizable titles, subtitles, symbol info, and full style control
- 🌍 Trading Sessions**: Visualize Asian, London, and New York sessions with high/low lines, range boxes, and open/close markers
- 🎯 Kill Zones**: Highlight 5 critical ICT kill zones with precise timing and visual boxes
- 📈 Previous Period H/L**: Track Daily, Weekly, and Monthly highs/lows with customizable styles and lookback periods
- 🕐 Higher Timeframe Candles**: Display up to 5 HTF timeframes with OHLC trace lines, timers, and interval labels
- 🔍 FVG & VI Detection**: Automatically detect and visualize Fair Value Gaps and Volume Imbalances on HTF candles
- ⚙️ Universal Timezone Support**: Works globally with GMT-12 to GMT+14 timezone selection
- 🎨 Full Customization**: Control colors, styles, visibility, and layout for every feature
🚀 How to Use
Watermark Setup
The watermark overlay helps you identify your charts and maintain focus on your trading principles:
1. Enable/disable watermark via "Show Watermark" toggle
2. Customize the title (default: "Name") to display your trading name or account identifier
3. Set up to 3 subtitles (default: "Patience", "Confidence", "Execution") as trading reminders
4. Choose position (9 locations available), size, color, and transparency
5. Toggle symbol and timeframe display as needed
Use Case: Display your trading principles or account name for multi-monitor setups or content creation.
Trading Sessions Analysis
Sessions define market character and liquidity availability:
1. Enable "Show All Sessions" to visualize all three sessions
2. Adjust timezone to match your local market (default: UTC-5 for EST)
3. Customize session times if needed (defaults cover standard hours)
4. Enable session range boxes to see consolidation zones
5. Use session high/low lines to identify key levels for the current session
6. Enable open/close markers to track session transitions
Use Case: Identify which session you're trading in, track session highs/lows for liquidity, and anticipate session transition volatility.
Kill Zones Trading
Kill zones are ICT's high-probability trading windows:
1. Enable individual kill zones or use "Show All Kill Zones"
2. **Asian Kill Zone** (2000-0000 GMT): Early positioning and smart money accumulation
3. **London Kill Zone** (0300-0500 GMT): European market opening volatility
4. **NY AM Kill Zone** (0930-1100 EST): Post-NYSE open expansion
5. **NY Lunch Kill Zone** (1200-1300 EST): Midday consolidation or manipulation
6. **NY PM Kill Zone** (1330-1600 EST): Afternoon positioning and closes
7. Customize colors and times to match your trading style
8. Set max days display to control historical visibility (default: 30 days)
Use Case: Focus entries during high-probability windows. Watch for liquidity sweeps at kill zone openings and institutional positioning.
Previous Period High/Low Levels
Previous period levels act as magnetic price targets and support/resistance:
1. Enable Daily (PDH/PDL), Weekly (PWH/PWL), or Monthly (PMH/PML) levels individually
2. Set lookback period (how many previous periods to display)
3. Choose line style: Solid (current emphasis), Dashed (standard), or Dotted (subtle)
4. Customize colors per timeframe for visual hierarchy
5. Adjust line width (1-5) for visibility preference
6. Enable gradient effect to fade older periods
7. Position labels left or right based on chart layout
8. Customize label text for your preferred notation
Use Case: Identify key levels where price is likely to react. Daily levels work on intraday timeframes, Weekly on daily charts, Monthly for swing trading.
Higher Timeframe (HTF) Candles
HTF candles reveal the larger market context while trading lower timeframes:
1. Enable up to 5 HTF slots simultaneously (default: 5m, 15m, 1H, 4H, Daily)
2. Choose display mode: "Below Chart" (stacked rows) or "Right Side" (compact column)
3. Customize timeframe, colors (bull/bear), and titles for each slot
4. **OHLC Trace Lines**: Visual lines connecting HTF candle levels to chart bars
5. **HTF Timer**: Countdown showing time remaining until HTF candle close
6. **Interval Labels**: Display day of week (Daily+) or time (intraday) on each candle
7. For Daily candles: Choose open time (Midnight, 8:30, 9:30) to match your market structure preference
Use Case: Trade lower timeframes while respecting higher timeframe structure. Watch for HTF candle closes to confirm directional bias.
FVG & VI Detection
Fair Value Gaps and Volume Imbalances highlight inefficiencies that price often revisits:
1. **Fair Value Gaps (FVGs)**: Detected when HTF candle wicks don't overlap between 3 consecutive candles
- Bullish FVG: Gap between candle 1 high and candle 3 low (green box by default)
- Bearish FVG: Gap between candle 1 low and candle 3 high (red box by default)
2. **Volume Imbalances (VIs)**: Similar detection but focuses on body gaps
- Bullish VI: Gap between candle 1 close and candle 3 open
- Bearish VI: Gap between candle 1 open and candle 3 close
3. Enable FVG/VI detection per HTF slot individually
4. Customize colors and transparency for each imbalance type
5. Boxes appear on chart at formation and remain visible as retracement targets
**Use Case**: Identify high-probability retracement zones. Price often returns to fill FVGs and VIs before continuing the trend. Use as entry zones or profit targets.
🎨 Customization
OFA is built for flexibility. Every feature includes extensive customization options:
Visual Customization
- **Colors**: Independent color control for every element (sessions, kill zones, lines, labels, FVGs, VIs)
- **Transparency**: Adjust box and label transparency (0-100%) for clean charts
- **Line Styles**: Choose Solid, Dashed, or Dotted for previous period lines
- **Sizes**: Control text size, line width, and box borders
- **Positions**: Place watermark in 9 positions, labels left/right
Layout Control
- **HTF Display Mode**: "Below Chart" for detailed analysis, "Right Side" for space efficiency
- **Drawing Limits**: Set max days for sessions/kill zones to manage chart clutter
- **Lookback Periods**: Control how many previous periods to display (1-10)
- **Gradient Effects**: Enable fading for older previous period lines
Timing Adjustments
- **Timezone**: Universal GMT offset selector (-12 to +14) for global markets
- **Session Times**: Customize each session's start/end times
- **Kill Zone Times**: Adjust kill zone windows to match your market's characteristics
- **Daily Open**: Choose Midnight, 8:30, or 9:30 for Daily HTF candle open time
💡 Best Practices
1. Start Simple: Enable one feature at a time to learn how each element affects your analysis
2. Match Your Timeframe: Use Daily levels on intraday charts, Weekly on daily charts, HTF candles one or two levels above your trading timeframe
3. Kill Zone Focus: Concentrate your trading activity during kill zones for higher probability setups
4. HTF Confirmation: Wait for HTF candle closes before committing to directional bias
5. FVG/VI Entries: Look for price to return to unfilled FVGs/VIs for entry opportunities with favorable risk/reward
6. Customize Colors: Use a consistent color scheme that matches your chart theme and reduces visual fatigue
7. Reduce Clutter: Disable features you're not actively using in your current trading plan
8. Session Context: Understand which session controls the market—trade with session direction or anticipate reversals at session transitions
⚙️ Settings Guide
OFA organizes settings into logical groups for easy navigation:
- **═══ WATERMARK ═══**: Title, subtitles, position, style, symbol/timeframe display
- **═══ SESSIONS ═══**: Enable/disable sessions, times, colors, high/low lines, boxes, markers
- **═══ KILL ZONES ═══**: Individual kill zone toggles, times, colors, max days display
- **═══ PREVIOUS H/L - DAILY ═══**: Daily high/low lines, style, color, lookback, labels
- **═══ PREVIOUS H/L - WEEKLY ═══**: Weekly high/low lines, style, color, lookback, labels
- **═══ PREVIOUS H/L - MONTHLY ═══**: Monthly high/low lines, style, color, lookback, labels
- **═══ HTF CANDLES ═══**: Global display mode, layout settings
- **═══ HTF SLOT 1-5 ═══**: Individual HTF configuration (timeframe, colors, title, FVG/VI detection, trace lines, timer, interval labels)
Each setting includes tooltips explaining its function. Hover over any input for detailed guidance.
📝 Final Notes
One for All (OFA) represents a complete ICT analysis toolkit in a single indicator. By combining watermark customization, session visualization, kill zone highlighting, previous period levels, and higher timeframe candles with FVG/VI detection, OFA eliminates the need for multiple indicators cluttering your chart.
**Version**: 3.3.0
**Author**: theCodeman
**Pine Script**: v6
**License**: Mozilla Public License 2.0
Start with default settings to learn the indicator's structure, then customize extensively to match your personal trading style. Remember: tools provide information, but your edge comes from disciplined execution of a proven strategy.
Happy Trading! 📈

67 2.0Major Market Trading Hours
New York Stock Exchange (NYSE)
Open: 9:30 AM (ET)
Close: 4:00 PM (ET)
Pre-Market: 4:00 AM – 9:30 AM (ET)
After Hours: 4:00 PM – 8:00 PM (ET)
Nasdaq
Open: 9:30 AM (ET)
Close: 4:00 PM (ET)
Pre-Market: 4:00 AM – 9:30 AM (ET)
After Hours: 4:00 PM – 8:00 PM (ET)
London Stock Exchange (LSE)
Open: 8:00 AM (GMT)
Close: 4:30 PM (GMT)
Tokyo Stock Exchange (TSE)
Open: 9:00 AM (JST)
Lunch Break: 11:30 AM – 12:30 PM (JST)
Close: 3:00 PM (JST)
Hong Kong Stock Exchange (HKEX)
Open: 9:30 AM (HKT)
Lunch Break: 12:00 PM – 1:00 PM (HKT)
Close: 4:00 PM (HKT)

Trend Trader//@version=6
indicator("Trend Trader", shorttitle="Trend Trader", overlay=true)
// User-defined input for moving averages
shortMA = input.int(10, minval=1, title="Short MA Period")
longMA = input.int(100, minval=1, title="Long MA Period")
// User-defined input for the instrument selection
instrument = input.string("US30", title="Select Instrument", options= )
// Set target values based on selected instrument
target_1 = instrument == "US30" ? 50 :
instrument == "NDX100" ? 25 :
instrument == "GER40" ? 25 :
instrument == "GOLD" ? 5 : 5 // default value
target_2 = instrument == "US30" ? 100 :
instrument == "NDX100" ? 50 :
instrument == "GER40" ? 50 :
instrument == "GOLD" ? 10 : 10 // default value
// User-defined input for the start and end times with default values
startTimeInput = input.int(12, title="Start Time for Session (UTC, in hours)", minval=0, maxval=23)
endTimeInput = input.int(17, title="End Time Session (UTC, in hours)", minval=0, maxval=23)
// Convert the input hours to minutes from midnight
startTime = startTimeInput * 60
endTime = endTimeInput * 60
// Function to convert the current exchange time to UTC time in minutes
toUTCTime(exchangeTime) =>
exchangeTimeInMinutes = exchangeTime / 60000
// Adjust for UTC time
utcTime = exchangeTimeInMinutes % 1440
utcTime
// Get the current time in UTC in minutes from midnight
utcTime = toUTCTime(time)
// Check if the current UTC time is within the allowed timeframe
isAllowedTime = (utcTime >= startTime and utcTime < endTime)
// Calculating moving averages
shortMAValue = ta.sma(close, shortMA)
longMAValue = ta.sma(close, longMA)
// Plotting the MAs
plot(shortMAValue, title="Short MA", color=color.blue)
plot(longMAValue, title="Long MA", color=color.red)
// MACD calculation for 15-minute chart
= request.security(syminfo.tickerid, "15", ta.macd(close, 12, 26, 9))
macdColor = macdLine > signalLine ? color.new(color.green, 70) : color.new(color.red, 70)
// Apply MACD color only during the allowed time range
bgcolor(isAllowedTime ? macdColor : na)
// Flags to track if a buy or sell signal has been triggered
var bool buyOnce = false
var bool sellOnce = false
// Tracking buy and sell entry prices
var float buyEntryPrice_1 = na
var float buyEntryPrice_2 = na
var float sellEntryPrice_1 = na
var float sellEntryPrice_2 = na
if not isAllowedTime
buyOnce :=false
sellOnce :=false
// Logic for Buy and Sell signals
buySignal = ta.crossover(shortMAValue, longMAValue) and isAllowedTime and macdLine > signalLine and not buyOnce
sellSignal = ta.crossunder(shortMAValue, longMAValue) and isAllowedTime and macdLine <= signalLine and not sellOnce
// Update last buy and sell signal values
if (buySignal)
buyEntryPrice_1 := close
buyEntryPrice_2 := close
buyOnce := true
if (sellSignal)
sellEntryPrice_1 := close
sellEntryPrice_2 := close
sellOnce := true
// Apply background color for entry candles
barcolor(buySignal or sellSignal ? color.yellow : na)
/// Creating buy and sell labels
if (buySignal)
label.new(bar_index, low, text="BUY", style=label.style_label_up, color=color.green, textcolor=color.white, yloc=yloc.belowbar)
if (sellSignal)
label.new(bar_index, high, text="SELL", style=label.style_label_down, color=color.red, textcolor=color.white, yloc=yloc.abovebar)
// Creating labels for 100-point movement
if (not na(buyEntryPrice_1) and close >= buyEntryPrice_1 + target_1)
label.new(bar_index, high, text=str.tostring(target_1), style=label.style_label_down, color=color.green, textcolor=color.white, yloc=yloc.abovebar)
buyEntryPrice_1 := na // Reset after label is created
if (not na(buyEntryPrice_2) and close >= buyEntryPrice_2 + target_2)
label.new(bar_index, high, text=str.tostring(target_2), style=label.style_label_down, color=color.green, textcolor=color.white, yloc=yloc.abovebar)
buyEntryPrice_2 := na // Reset after label is created
if (not na(sellEntryPrice_1) and close <= sellEntryPrice_1 - target_1)
label.new(bar_index, low, text=str.tostring(target_1), style=label.style_label_up, color=color.red, textcolor=color.white, yloc=yloc.belowbar)
sellEntryPrice_1 := na // Reset after label is created
if (not na(sellEntryPrice_2) and close <= sellEntryPrice_2 - target_2)
label.new(bar_index, low, text=str.tostring(target_2), style=label.style_label_up, color=color.red, textcolor=color.white, yloc=yloc.belowbar)
sellEntryPrice_2 := na // Reset after label is created

QQQ Quant Power STRATEGY v13.3 (Ribbon + TQQQ Specs)1. The Quant Engine (Data Processing)
Weighted Scoring: It assigns specific weights to stocks (e.g., NVDA gets 8.5% weight, TXN gets 1.0%).
Z-Score Pressure: It calculates how "unusual" the current buying/selling pressure is compared to the average (Standard Deviation).
Alignment Bonus: It boosts the "Conviction Score" if Mega Caps (Top 8) and Large Caps (Next 12) are moving in the same direction.
2. The Dashboard (Mission Control)
The dashboard gives you an X-Ray view of the market:
Main Status: Tells you if the market is BULLISH, BEARISH, or CHOP (Sit Out).
Conviction %: A probability score (0-99%). Higher = Safer trade.
Breadth: Counts how many of the top 20 stocks are above their EMA.
Chop Logic: If Breadth is mixed (between 6 and 14 stocks above EMA), it declares "CHOP" and blocks trades.
Mega/Large Net: Shows the net buying/selling pressure for each group.
3. Visuals
Pressure Line: The line on the chart isn't just a Moving Average; it's the Net Pressure of the 20 stocks pushing price up or down.
Conviction Ribbon: The squares at the bottom of the screen.
🟩 Green: High Probability Long (>77%).
🟥 Red: High Probability Short (>77%).
⬜ Gray: Low Conviction / Holding.
4. Strategy Logic (Automated Trading)
Entry: Enters when the "Basket" of stocks is aligned (Bull/Bear Pressure) AND the Conviction Score is high (>77%).
Exit: Closes the trade if Conviction drops (Signal fades) or hits a Hard Stop Loss.
Time Filters: Includes strict trading windows (e.g., No trading during lunch 12-1pm, closes all positions on Friday).
Summary
This is a Market Breadth & Momentum Strategy. It assumes that QQQ cannot sustain a trend unless its underlying components (NVDA, AAPL, etc.) are pushing it. It filters out "fake moves" where QQQ moves but the components don't support it.

Macros+AMD [NW]Macros + AMD - Daily & Weekly Time-Based Analysis
Multi-timeframe AMD (Accumulation, Manipulation, Distribution) visualization with ICT Macro timing windows for time-based market analysis.
Overview
This indicator visualizes the AMD (Accumulation, Manipulation, Distribution) framework on both daily and weekly timeframes, combined with ICT Macro timing windows. It is designed as an educational tool to help traders study time-based market structure and algorithmic price delivery concepts.
The AMD model is based on the idea that markets move through distinct phases within each trading period:
Accumulation (A) - Initial range formation, liquidity building
Manipulation (M) - False moves to trap traders, liquidity sweeps
Distribution (D) - True directional move, price delivery to targets
What This Indicator Displays
Daily AMD Phases
Displays the intraday AMD cycle based on New York trading hours:
A Phase (Blue): 4:00 AM - 8:35 AM EST — Morning accumulation, Asian/London overlap
M Phase (Red): 8:35 AM - 11:25 AM EST — NY session manipulation, news events
D Phase (Green): 11:25 AM - 4:00 PM EST — Afternoon distribution and price delivery
Weekly AMD Phases
Displays the weekly AMD cycle from Monday to Monday:
A Phase: Monday 00:00 - Tuesday 21:56 EST — Weekly high/low formation begins
M Phase: Tuesday 21:56 - Thursday 02:04 EST — Mid-week reversal zone
D Phase: Thursday 02:04 - Monday 00:00 EST — Weekly price delivery
Inner M Phase Fibs
When enabled, subdivides the M (Manipulation) phase using Fibonacci levels:
0.382 level — Inner accumulation ends
0.500 level — Mid-point of manipulation
0.618 level — Inner distribution begins
This helps identify potential reversal points within the manipulation phase.
ICT Macro Windows
Horizontal lines marking the XX:42 to XX:15 macro periods (33-minute windows):
2:42 - 3:15 AM
3:42 - 4:15 AM (London)
7:42 - 8:15 AM
8:42 - 9:15 AM
9:42 - 10:15 AM (Prime AM session)
10:42 - 11:15 AM
11:42 - 12:15 PM
12:42 - 1:15 PM
1:42 - 2:15 PM
2:42 - 3:15 PM
These windows represent times when algorithmic price delivery is more likely to occur.
How To Use
Understanding the AMD Framework
During the A Phase:
Observe range formation and initial liquidity pools
Note the high and low established during this phase
Wait for manipulation before committing to direction
During the M Phase:
Watch for false breakouts and stop hunts
Look for reversal patterns after liquidity sweeps
The inner fibs (0.382, 0.5, 0.618) can help time entries within this phase
Mid-week (Wednesday) often sees key reversals on weekly AMD
During the D Phase:
This is typically when the true move occurs
Price tends to deliver toward draw on liquidity targets
The direction is often opposite to the manipulation move
Using the Macro Windows
The XX:42 to XX:15 windows are times to pay attention to price action:
These 33-minute periods often see increased algorithmic activity
Look for displacement, fair value gaps, or order blocks forming
The 9:42-10:15 AM window is considered particularly significant for NY session
Weekly Day Labels
Monday/Tuesday: "H/L of Week" — Watch for weekly high or low formation
Wednesday: "Reversal Day" — Mid-week reversal probability increases
Thursday/Friday: "Reversal Day" — Continuation or secondary reversal
Settings Guide
Main Settings
Timezone: Set to your broker's timezone or preferred timezone
Macros On Top: Toggle macro lines above or below AMD boxes
Show All Text Labels: Master toggle for all text (turn off for clean charts on HTF)
Daily/Weekly AMD
Show: Enable/disable the AMD visualization
Opacity: Adjust transparency of the phase boxes (higher = more transparent)
AMD Colors
Customize colors for each phase (A, M, D)
Default: Blue (A), Red (M), Green (D)
Inner M Style
Customize the inner M phase fib lines and text colors
Default: Black lines for clean visibility
Macro Settings
Adjust macro line color and thickness
Toggle individual macro windows on/off
Important Notes
This indicator is for educational purposes and time-based analysis
It does not provide buy/sell signals
Always use in conjunction with proper price action analysis
Past price behavior during these time windows does not guarantee future results
The AMD framework is one lens for viewing market structure — use it as part of a complete methodology
Credits
This indicator is based on concepts taught by ICT (Inner Circle Trader) and the broader Smart Money Concepts community. The AMD framework, macro timing windows, and weekly profile concepts are derived from this educational methodology.
Timeframe Recommendations
Best viewed on 1-minute to 15-minute charts
Text labels automatically hide on 9-minute and higher timeframes for cleaner visualization
Indicator hides completely on 1-hour and higher timeframes
Changelog
v1.0 - Initial release
Daily AMD phases (4am-4pm EST)
Weekly AMD phases (Monday-Monday)
Inner M phase Fibonacci subdivisions
10 ICT Macro timing windows
Full customization options
Automatic 9-day cleanup

Donchian ForecastDonchian Forecast – multi-timeframe Donchian/ATR bias with ADX regime blending
Donchian Forecast is a multi-timeframe bias tool that turns classic Donchian channels into a normalized trend/mean-reversion “forecast” and a single bias value in .
It projects a short polyline path from the current price and shows how that path adapts when the market shifts from ranging to trending (via ADX).
---
Concept
1. Donchian position → direction
For each timeframe, the script measures where price sits inside its Donchian channel:
-1 = near channel low
0 = middle
+1 = near channel high
This Donchian position is multiplied by ATR to create a **price delta** (how far the forecast moves from current price).
2. Local behavior: trend vs mean-reversion around Donchian
The indicator treats the edges vs middle of the Donchian channel differently:
* By default, edges behave more “trend-like”, middle more “mean-reverting”.
* If you enable the reversed option, this logic flips (edges = mean-reverting, middle = trend-
like).
* This “local” behavior is controlled smoothly by the absolute Donchian position |pos| (not by hard zone switches).
3. Global ADX modulation (regime aware)
ADX is mapped from your chosen low → high thresholds into a signed factor in :
* ADX ≤ low → -1 (fully reversed behavior, more range/mean-reversion oriented)
* ADX ≥ high → +1 (fully normal behavior, more trend oriented)
* Values in between create a **smooth transition**.
* This global factor can:
* Keep the local behavior as is (trending regime),
* Flip it (range regime), or
* Neutralize it (indecisive regime).
4. Multi-timeframe aggregation (1x–12x chart timeframe)
* The script repeats the same logic across 12 horizons:
* 1x = chart timeframe
* 2x..12x = multiples of the chart timeframe (e.g., 5m → 10m, 15m, …; 1h → 2h, 3h, …).
* For each horizon it builds:
* Donchian position
* ATR-scaled delta (in price units)
* Locally + globally blended delta (after Donchian + ADX logic).
* These blended deltas are ATR-weighted and summed into a single bias in , which is then shown as Bias % in the on-chart table.
---
### What you see on the chart
* Forecast polyline
* Starting at the current close, the indicator draws a short chain of **up to 12 segments**:
* Segment 1: from current price → 1x projection
* Segment 2: 1x → 2x projection
* … up to 12x.
* Each segment is:
* Green when its blended delta is ≥ 0 (upward bias)
* Red when its blended delta is < 0 (downward bias)
* This is not future price, but a synthetic path showing how the Donchian/ATR/ADX model “expects” price to drift across multiple horizons.
* Bias table (top-center)
* `Bias: X.Y%`
* > 0% (green) → net upward bias across horizons
* < 0% (red) → net downward bias
* Magnitude (e.g., ±70–100%) ≈ strength of the directional skew.
* `ADX:` current ADX value (from your DMI settings).
* `ADXBlend:` the signed ADX factor in :
* +1 ≈ fully “trend-interpretation” of Donchian behavior
* 0 ≈ neutral / mixed regime
* -1 ≈ fully “reversed/mean-reversion interpretation”
---
Inputs & settings
Core Donchian / ATR
* Donchian Length – lookback for Donchian high/low on each horizon.
* Price Source – input series used for position inside the Donchian channel (default: close).
* ATR Length – ATR lookback for all horizons.
* ATR Multiplier – scales the size of each forecast step in price units (higher = longer segments / more aggressive forecast).
*Local behavior at high ADX
* Reversed local blend at high ADX?
* Off (default) – edges behave more trend-like, middle more mean-reverting.
* On – flips that logic (edges more mean-reverting, middle more trend-like).
* The actual effect is always modulated by the global ADX factor, so you can experiment with how the regime logic feels in different markets.
Global ADX blending
* DMI DI Length – period for the DI+ and DI- components.
* ADX Smoothing – smoothing length for ADX.
* ADX low (mean-rev zone) – below this level, the global factor pushes behavior toward reversal/range logic .
* ADX high (trend zone) – above this level, the global factor pushes behavior toward **trend logic**.
* Values between low and high create a smooth blend rather than a hard on/off switch.
---
How to use it (examples)
* Directional bias dashboard
* Use the Bias % as a compact summary of multi-horizon Donchian/ATR/ADX conditions:
* Consider only trades aligned with the sign of Bias (e.g., longs only when Bias > 0).
* Use the magnitude to filter for **strong vs weak** directional contexts.
* Regime-aware context
* Watch ADX and ADXBlend:
* High ADX & ADXBlend ≈ +1 → favor trend-continuation ideas.
* Low ADX & ADXBlend ≈ -1 → favor range/mean-reversion ideas.
* Around 0 → mixed/transition regimes; forecasts will be more muted.
* Visual sanity check for systems
* Overlay Donchian Forecast on your usual entries/exits to see:
* When your system trades **with** the multi-TF Donchian bias.
* When it trades **against** it (possible fade setups or no-trade zones).
This script does not generate entry or exit signals by itself. It is a contextual/forecast tool meant to sit on top of your own trading logic.
---
Notes
* Works on most symbols and timeframes; higher-timeframe multiples are built from the chart timeframe.
* The forecast line is a model-based projection, not a prediction or guarantee of future price.
* Always combine this with your own risk management, testing, and judgement. This is for educational and analytical purposes only and is not financial advice.

Vinz Win BTC – STRATEGY AUTO 1m🚀 VinzWin BTC Strategy – BTC Scalping AUTO 1 min
The VinzWin strategy is based on a simple and highly effective price action pattern:
✅ 2 red candles followed by 1 green candle
✅ Doji filter set to 0
✅ Trading exclusively on BTC
✅ Session from 12:00 to 12:00 (24/7)
✅ Fixed Risk/Reward at 1:2
✅ Stop Loss set in fixed € amount
✅ Automatic risk management based on the Stop Loss
On every trade:
The Stop Loss is defined in fixed euros,
The Take Profit is always set at twice the risk,
The lot size is automatically adjusted to market conditions,
ensuring clean, stable, and fully controlled risk management.
📊 Multi-year backtests are available and show truly outstanding results, with strong consistency and an excellent profit/loss ratio.
👉 A simple, mechanical strategy with no over-optimization, perfectly suited for BTC scalping with fully controlled capital management in euros.

Dr. Barbara Star: Dual Strategies Combined [Merged] - geminiDr. Barbara Star: Dual Strategy Suite (Merged)
Overview
This script integrates two distinct but complementary trading methodologies developed by Dr. Barbara Star: "Capture Direction & Momentum" and "Profit with Dual Oscillators & Bands." While both strategies utilize price channels to filter noise, they approach entry and exit timing from different angles—one focusing on momentum shifts (Stochastic/EMA) and the other on cyclical price deviations (DPO/Bollinger Bands).
This tool allows the user to run either strategy independently or combine them to find high-confluence setups where momentum and cyclical structure align.
Strategy A: Capture Direction & Momentum
Source: Capture Direction And Momentum
1. Purpose & Theory
The goal of this method is to filter out the "noise" of choppy markets and identify the specific point where price direction aligns with momentum strength. It moves away from trying to catch exact tops or bottoms and instead focuses on catching the "meat" of the trend (continuation).
2. Implementation
Structure (The Channel): A 13-period SMA of the Highs and Lows creates a "No Trade Zone". When price is inside this channel, the market is considered directionless.
Direction (5 EMA): A fast 5-period EMA acts as a directional trigger. When it breaks outside the SMA channel, it signals acceleration.
Momentum (Modified Stochastic): A Slow Stochastic (14,2) is used, but with a crucial modification: the overbought/oversold levels are shifted to 40 and 60 (instead of 20/80).
3. How to Use It
The "Trend Zones" (Background Colors):
Green Background (Bullish): The 5 EMA is above the channel AND the Stochastic is > 60. This is the "Go" zone.
Red Background (Bearish): The 5 EMA is below the channel AND the Stochastic is < 40.
Yellow Background: The "No Trade Zone." The price is consolidating, or the indicators disagree.
The Continuation Signal (Marked by "U" or "D"):
Why it matters: This is the most powerful setup in the system. It detects when price pulls back (retracement) but momentum remains strong.
The Signal: If the 5 EMA dips back into the SMA channel (weakness) but the Stochastic stays above 60 (strength), a blue "U" (Up) marker appears. This indicates the pullback is likely a buying opportunity, not a reversal. Conversely, a yellow "D" appears in downtrends if Stoch stays below 40.
Exits (Marked by "X"):
Signals to take profit when the 5 EMA closes back inside the channel and the Stochastic crosses back into the neutral 40–60 zone.
Strategy B: Dual Oscillators & Bands
Source: Profit With Dual Oscillators & Bands
1. Purpose & Theory
This strategy uses "Dual Bollinger Bands" to define the volatility structure of the trend and "Dual Detrended Price Oscillators" (DPO) to time the entries based on cycle shifts.
2. Implementation
Structure (Dual Bands):
Inner Bands (1 SD): These define the "Trend Channel." Strong trends tend to ride between the 1 SD and 3 SD bands.
Outer Bands (3 SD): These represent extremes (containing 99.5% of price action). Hits here often signal exhaustion.
Timing (Dual DPOs):
Long Oscillator (DPO 20): Identifies the broader trend direction (Positive = Bullish).
Short Oscillator (DPO 9): Identifies shorter-term timing and potential divergences.
3. How to Use It
Identifying the Trend State:
Strong Uptrend: Price holds above the Upper Inner Band (1 SD).
Strong Downtrend: Price holds below the Lower Inner Band (1 SD).
Transition/Neutral: Price is stuck between the Upper and Lower Inner bands.
Entry Signals (Triangles on Chart & Circles in Pane):
Aggressive Entry: When the fast DPO 9 crosses zero. This signals early momentum shifts.
Conservative Entry: Wait for the slow DPO 20 to cross zero, confirming the broader trend has shifted.
Visuals: The script plots triangles on the main chart when these cross. In the lower pane, a Blue Circle indicates a bullish cross and a Yellow Circle indicates a bearish cross.
Continuation Setup:
Similar to Strategy A, look for moments where the DPO 9 dips below zero (pullback) while the DPO 20 remains above zero (trend intact). This is often a reload opportunity.
Combined Mode: The "Power Couple"
When selecting "Both" in the settings, the indicator merges these tools for maximum confirmation:
Visual filtering: The lower pane automatically scales the DPO lines to fit inside the 0–100 Stochastic range (centering the DPO zero line at 50). This allows you to read both momentum and cycles in a single glance.
Confluence Trading:
Look for the Background to turn Green (Strategy A Trend) coincident with a Blue Triangle/Circle (Strategy B Momentum Cross).
Use the Inner Bollinger Bands (Strategy B) as your trailing stop-loss while riding the SMA Channel (Strategy A) trend.
Reference Settings
Strategy A: SMA Channel (13), EMA (5), Stochastic (14, 2, 40/60 levels).
Strategy B: Bollinger Bands (20 SMA, 1.0 & 3.0 deviations), DPO (9 & 20).
Sources: of the methodologies
1-Stocks & Commodities V. 32:7 (10-16): Profit With Dual Oscillators & Bands by Barbara Star, PhD
2-Stocks & Commodities V. 43:12 (8–12): Capture Direction And Momentum by Barbara Star, PhD

VCP Base Detector
📊 VCP BASE DETECTOR - AUTO-DETECT CONSOLIDATION ZONES
🎯 WHAT IS THIS INDICATOR?
This indicator automatically detects and marks ALL consolidation bases (VCP bases) on your chart. It:
✅ Auto-detects when price enters consolidation
✅ Measures base tightness (volatility contraction)
✅ Tracks base duration (how long consolidating)
✅ Rates base quality (1-5 stars)
✅ Shows volume drying confirmation
✅ Detects base breakouts
✅ Shows progression of multiple bases (VCP pattern)
Use this WITH the "Mark Minervini SEPA Balanced" indicator for complete trading setups!
✅ Mark Minervini SEPA Balanced = Trend + RS + Stage
✅ VCP Base Detector = Base Quality + Progression
Combined = Complete professional trading system!
🎨 WHAT YOU SEE ON YOUR CHART
1️⃣ COLORED BOXES (Base Zones):
🟦 Aqua Box = ⭐⭐⭐⭐⭐ Excellent base (tightest)
🔵 Blue Box = ⭐⭐⭐⭐ Very good base
🟣 Purple Box = ⭐⭐⭐ Good base
🟠 Orange Box = ⭐⭐ Fair base
⬜ Gray Box = ⭐ Weak base
2️⃣ BASE LABELS (With Metrics):
Shows above each base:
• Duration: 20 days
• Tightness: 0.9%
• Quality: ⭐⭐⭐⭐⭐
3️⃣ BREAKOUT LABELS (When price exits base):
Green "BREAKOUT ✓" label shows:
• Price: ₹800
• Volume: 1.6x
4️⃣ DASHBOARD (Top-Left Panel):
Real-time base metrics showing:
• In Base: YES/NO
• Tightness: 0.8%
• Duration: 22 days
• Range: 3.5%
• Volume: Drying/Normal
• Quality: ⭐⭐⭐⭐
📊 UNDERSTANDING BASE QUALITY (⭐ Rating System)
⭐⭐⭐⭐⭐ (EXCELLENT)
├─ Tightness: < 0.8% ATR
├─ Duration: 15-40 days
├─ Volume: Significantly drying
├─ Price Range: < 5%
└─ Result: Most explosive breakouts (best quality)
⭐⭐⭐⭐ (VERY GOOD)
├─ Tightness: 0.8-1.0% ATR
├─ Duration: 15-35 days
├─ Volume: Very dry
├─ Price Range: < 7%
└─ Result: High probability breakouts
⭐⭐⭐ (GOOD)
├─ Tightness: 1.0-1.3% ATR
├─ Duration: 15-30 days
├─ Volume: Drying
├─ Price Range: < 8%
└─ Result: Decent breakout probability
⭐⭐ (FAIR)
├─ Tightness: 1.3-1.5% ATR
├─ Duration: 15-25 days
├─ Volume: Moderate drying
├─ Price Range: < 10%
└─ Result: Lower quality, riskier
⭐ (WEAK)
├─ Tightness: > 1.5% ATR
├─ Duration: Varies
├─ Volume: Not drying enough
├─ Price Range: > 10%
└─ Result: Low quality, skip these
📈 HOW TO USE - STEP BY STEP
STEP 1: ADD INDICATOR TO CHART
────────────────────────────────
1. Open any stock chart (use 1D timeframe for swing trading)
2. Click "Indicators"
3. Search "VCP Base Detector"
4. Click to add to chart
5. Wait a moment for boxes to appear
STEP 2: SCAN FOR BASES
───────────────────────
Look for:
✓ Colored boxes appearing on chart (bases forming)
✓ Dashboard showing "In Base: YES"
✓ Tightness below 1.5%
✓ Volume Dry: YES
STEP 3: MONITOR BASE QUALITY
──────────────────────────────
Dashboard shows stars:
⭐⭐⭐⭐⭐ = Wait for breakout (best setup)
⭐⭐⭐⭐ = Good quality, watch for breakout
⭐⭐⭐ = Decent, but not ideal
⭐⭐ or ⭐ = Skip (lower probability)
STEP 4: WAIT FOR BREAKOUT
──────────────────────────
When price breaks above the box:
✓ Green "BREAKOUT ✓" label appears
✓ Shows breakout price and volume
✓ If volume shows 1.3x+, breakout is confirmed
✓ This is your entry signal!
STEP 5: CHECK MINERVINI CRITERIA (Use Both Indicators)
───────────────────────────────────────────────────────
Before entering:
✓ VCP Base Detector shows ⭐⭐⭐⭐+ quality base
✓ Mark Minervini indicator shows BUY SIGNAL
✓ Dashboard shows 10+ criteria GREEN
✓ Stage shows S2
Result: HIGH-PROBABILITY SETUP! 🎯
📋 DASHBOARD INDICATORS - WHAT EACH MEANS
BASE METRICS SECTION:
─────────────────────
In Base = ✓ YES or ✗ NO
Show if price is currently consolidating
Tightness = 0-3% (lower = tighter = better)
< 0.8% = ⭐⭐⭐⭐⭐ (excellent)
0.8-1.0% = ⭐⭐⭐⭐ (very good)
1.0-1.3% = ⭐⭐⭐ (good)
1.3-1.5% = ⭐⭐ (fair)
> 1.5% = ⭐ (weak)
Duration = Number of days in consolidation
15 days = ⭐ (too short, weak)
20 days = ⭐⭐⭐ (ideal)
30 days = ⭐⭐⭐⭐ (very long, strong)
> 40 days = ⚠️ (too long, may break down)
Range = % movement within the base
< 5% = ⭐⭐⭐⭐⭐ (excellent, very tight)
5-8% = ⭐⭐⭐ (good)
> 10% = ⭐ (loose, not ideal)
Vol Dry = Volume status during consolidation
✓ YES = Volume contracting (good)
✗ NO = Normal/high volume (weak setup)
QUALITY SECTION:
────────────────
Stars = Overall base quality rating
⭐⭐⭐⭐⭐ = Best quality bases (most explosive)
⭐⭐⭐⭐ = Excellent quality
⭐⭐⭐ = Good quality
⭐⭐ = Fair quality
⭐ = Weak quality (skip)
52W INFO SECTION:
─────────────────
From 52W Hi = How far below 52-week high is price?
< 25% = In sweet zone ✓
> 25% = Too far from highs ✗
From 52W Lo = How far above 52-week low is price?
> 30% = In sweet zone ✓
< 30% = Too close to lows ✗
⚙️ CUSTOMIZATION GUIDE
Click ⚙️ gear icon next to indicator to adjust:
MINIMUM BASE DAYS (Default: 15)
──────────────────────────────
Current: 15 = Include shorter bases
Change to 20 = Longer bases only (higher quality)
Change to 10 = Include very short bases (more frequent)
Why: Longer bases = better breakouts, but fewer opportunities
ATR% TIGHTNESS THRESHOLD (Default: 1.5)
────────────────────────────────────────
Current: 1.5 = BALANCED for Indian stocks
Change to 1.0 = ONLY very tight bases (⭐⭐⭐⭐⭐)
Change to 2.0 = Looser bases included (more frequent)
Why: Lower = tighter bases = better quality, fewer signals
VOLUME DRYING THRESHOLD (Default: 0.7)
──────────────────────────────────────
Current: 0.7 = Volume at 70% of average (good drying)
Change to 0.6 = Stricter (more volume drying required)
Change to 0.8 = Looser (less volume drying required)
Why: Volume drying = consolidation confirmation
52W PERIOD (Default: 252)
─────────────────────────
Current: 252 = Full year lookback
Don't change unless you know what you're doing
📈 REAL TRADING EXAMPLE
SCENARIO: Trading MARUTI over 6 weeks
WEEK 1: Nothing happening
─────────────────────────
- No boxes on chart
- Dashboard: "In Base: NO"
- Action: SKIP (not consolidating)
WEEK 2: Base Starting to Form
─────────────────────────────
- Purple box appears (⭐⭐⭐ quality)
- Dashboard: "In Base: YES"
- Tightness: 1.2%
- Duration: 3 days (too new)
- Action: MONITOR (let it develop)
WEEK 3-4: Base Tightening
──────────────────────────
- Box color changes from Purple → Blue (⭐⭐⭐⭐ quality)
- Dashboard: Duration: 12 days
- Tightness: 0.9%
- Vol Dry: YES
- Action: GET READY (high-quality base forming)
WEEK 4-5: Perfect Base Formed
──────────────────────────────
- Box changes to Aqua (⭐⭐⭐⭐⭐ EXCELLENT!)
- Dashboard: Duration: 22 days ✓
- Tightness: 0.8% ✓
- Vol Dry: YES ✓
- Range: 4.2% ✓
- Action: WATCH FOR BREAKOUT
WEEK 5: BREAKOUT HAPPENS!
──────────────────────────
- Price closes above box
- Green "BREAKOUT ✓" label appears
- Shows: Price ₹850, Volume 1.6x
- Mark Minervini indicator: BUY SIGNAL ✓
- Dashboard all GREEN ✓
- Action: ENTER TRADE
Entry: ₹850
Stop: Box low (₹820)
Target: ₹980 (20% move)
RESULT: +15.3% profit in 2 weeks! ✅
💡 PRO TIPS FOR BEST RESULTS
1. COMBINE WITH MINERVINI INDICATOR
Use BOTH indicators together:
✓ VCP Detector = Base quality
✓ Minervini = Trend + RS + Volume
Result = Best high-probability setups
2. PREFER ⭐⭐⭐⭐+ QUALITY BASES
Don't trade ⭐⭐ or ⭐ quality bases
Only trade ⭐⭐⭐+ (ideally ⭐⭐⭐⭐+)
Higher quality = Higher win rate
3. WAIT FOR VOLUME CONFIRMATION
Base must show "Vol Dry: YES"
Breakout must have 1.3x+ volume
Low volume breakouts fail often
4. USE 1D TIMEFRAME ONLY
This indicator optimized for daily charts
Intraday = Too many false signals
Weekly = Misses good setups
5. MONITOR MULTIPLE BASES (VCP PATTERN)
Multiple bases getting tighter = VCP pattern
Each base should be better quality than last
Tightest base = Biggest breakout
6. COMBINE WITH 52W CONTEXT
Dashboard shows "From 52W Hi" and "From 52W Lo"
Price should be in sweet zone:
< 25% from 52W high (uptrend territory)
> 30% above 52W low (not oversold)
7. BACKTEST FIRST
Use TradingView Replay
Go back 6-12 months
See how many bases appeared
See which were profitable
❌ BASES TO SKIP (Lower Probability)
Skip if:
❌ Quality rating < ⭐⭐⭐ (only 1-2 stars)
❌ Tightness > 1.5% (too loose)
❌ Duration < 10 days (too short, weak)
❌ Duration > 50 days (too long, may break down)
❌ Vol Dry: NO (volume not contracting)
❌ Range > 10% (not tight consolidation)
❌ Price < 30% from 52W low (too weak)
❌ Price > 30% from 52W high (too far up, late entry)
⚠️ IMPORTANT DISCLAIMERS
✓ This indicator is for educational purposes only
✓ Past performance does not guarantee future results
✓ Always use proper risk management (position sizing, stop loss)
✓ Never risk more than 2% of your account on one trade
✓ Base detection is technical analysis, not investment advice
✓ Losses can occur - trade at your own risk
✓ Combine with other indicators for best results
🎓 LEARNING RESOURCES
To understand VCP bases better:
→ Study "Trade Like a Stock Market Wizard" by Mark Minervini
→ Watch: "VCP Pattern" videos on YouTube
→ Practice: Backtest on 1-2 years of historical data
→ Learn: How consolidation precedes breakouts
🚀 YOU'RE READY!
Happy trading! 📈🎯

67Major Market Trading Hours
New York Stock Exchange (NYSE)
Open: 9:30 AM (ET)
Close: 4:00 PM (ET)
Pre-Market: 4:00 AM – 9:30 AM (ET)
After Hours: 4:00 PM – 8:00 PM (ET)
Nasdaq
Open: 9:30 AM (ET)
Close: 4:00 PM (ET)
Pre-Market: 4:00 AM – 9:30 AM (ET)
After Hours: 4:00 PM – 8:00 PM (ET)
London Stock Exchange (LSE)
Open: 8:00 AM (GMT)
Close: 4:30 PM (GMT)
Tokyo Stock Exchange (TSE)
Open: 9:00 AM (JST)
Lunch Break: 11:30 AM – 12:30 PM (JST)
Close: 3:00 PM (JST)
Hong Kong Stock Exchange (HKEX)
Open: 9:30 AM (HKT)
Lunch Break: 12:00 PM – 1:00 PM (HKT)
Close: 4:00 PM (HKT)
If you'd like anything bigger, bold, color‑coded, or reorganized, just tell me and I’ll adjust it!

Smart Adaptive Double Patterns [The_lurker]Smart Adaptive Double Patterns
This is an advanced technical indicator that combines two of the strongest and most renowned classical price reversal patterns:
✅ Double Bottom Pattern — a bullish reversal pattern that forms after a downtrend
✅ Double Top Pattern — a bearish reversal pattern that forms after an uptrend
The indicator does not merely detect patterns — it provides a fully integrated, intelligent system that includes:
✅ Precise quality scoring for each pattern using 5 technical criteria
✅ Automatic price target calculation at three levels (Conservative, Balanced, Aggressive)
✅ Multi-layer dynamic filtering to avoid false signals
✅ Live pattern tracking from formation to target achievement or failure
✅ Comprehensive alert system covering all possible trading scenarios
🎯 Why Is This Indicator Unique?
1️⃣ High Detection Accuracy
Unlike traditional indicators that rely on simple rules, this one applies 5 strict structural conditions to confirm pattern validity:
A clear trend must precede the pattern
High symmetry between the two bottoms or two tops
No break of critical price levels during formation
Logical spacing between key points
Technical confirmation from ADX, ATR, and Volume
2️⃣ Advanced Quality Scoring System
Each pattern is scored out of 100 based on 5 weighted criteria:
Symmetry (30%): How closely the two bottoms or tops match
Trend Strength (20%): Strength of the prior trend
Volume Behavior (20%): Trading activity at critical points
Pattern Depth (15%): Vertical distance between neckline and bottom/top
Structural Integrity (15%): Full compliance with structural rules
3️⃣ Smart Target Management
Separate targets for bullish (Double Bottom) and bearish (Double Top) patterns
Separate projections for success and failure cases
Multiple options: Conservative (0.618) / Balanced (1.0) / Aggressive (1.618)
Live tracking with dynamic moving lines
4️⃣ Professional Failure Handling
Failed patterns are not ignored — they are turned into counter-trend opportunities:
Failed Double Bottom → triggers a bearish signal with downside targets
Failed Double Top → triggers a bullish signal with upside targets
Automatic color change for clear visual distinction
5️⃣ Full Customization Flexibility
Enable/disable each pattern independently
22+ adjustable settings
Unique colors for each pattern and quality level
Full bilingual support (Arabic / English)
📐 Pattern Details
🟦 Double Bottom Pattern
Sequence of points:
🔹 Point 1: Peak marking the start of a strong downtrend
🔹 Point 2 (Bottom 1): First low — first key bounce
🔹 Point 3: Intermediate high — forms the neckline (resistance)
🔹 Point 4 (Bottom 2): Second low — should closely match Bottom 1
🔹 Point 5: Breakout point — pattern confirmation
Mandatory Conditions:
✅ Clear downtrend before Point 2
✅ Bottoms 2 & 4 nearly identical (≤1.5% difference by default)
✅ Point 3 higher than both bottoms
✅ Neither bottom is broken during formation
✅ Sufficient time between points (≥10 candles by default)
✅ Success Scenario
→ Price breaks above the neckline (Point 3)
→ Point 5 is plotted at breakout candle
→ Dashed vertical line drawn from Point 5 to target
→ Horizontal dashed line tracks price toward target
→ Dashboard shows: Pattern Type | Quality | Rating | Target | Status
→ When target hits: line turns green + ✅ appears
🎯 Target Calculation
Pattern Height = Point 3 − Point 4
• Conservative: Point 3 + (Height × 0.618 × Quality Factor)
• Balanced: Point 3 + (Height × 1.0 × Quality Factor)
• Aggressive: Point 3 + (Height × 1.618 × Quality Factor)
❌ Failure Scenario
→ Price breaks below both Bottom 1 or Bottom 2 before neckline breakout
Visual Changes:
All lines turn red
Red ✖ appears at breakdown candle
Neckline stops expanding
Red dashed vertical line from breakdown point to bearish target
Red horizontal tracking line follows price
Dashboard updates to:
⚠ Failed Bottom – Bearish
→ Shows new bearish target
→ Indicates target mode for failure case
→ Status: Bearish Reversal
→ Fully red display
🟥 Double Top Pattern
Sequence of points:
🔹 Point 1: Trough marking the start of a strong uptrend
🔹 Point 2 (Top 1): First peak — first key resistance
🔹 Point 3: Intermediate low — forms the neckline (support)
🔹 Point 4 (Top 2): Second peak — should closely match Top 1
🔹 Point 5: Breakdown point — pattern confirmation
Mandatory Conditions:
✅ Clear uptrend before Point 2
✅ Tops 2 & 4 nearly identical (≤1.5% difference by default)
✅ Point 3 lower than both tops
✅ Neither top is breached during formation
✅ Sufficient time between points (≥10 candles by default)
✅ Success Scenario
→ Price breaks below the neckline (Point 3)
→ Point 5 is plotted at breakdown candle
→ Dashed vertical line drawn to target
→ Horizontal tracking line moves with price
→ Dashboard updates accordingly
→ Green line + ✅ on hit
🎯 Target Calculation
Pattern Height = Point 4 − Point 3
• Conservative: Point 3 − (Height × 0.618 × Quality Factor)
• Balanced: Point 3 − (Height × 1.0 × Quality Factor)
• Aggressive: Point 3 − (Height × 1.618 × Quality Factor)
❌ Failure Scenario
→ Price breaks above either Top 1 or Top 2 before neckline breakdown
Visual Changes:
All lines turn cyan (light blue)
Cyan ✖ appears at breakout candle
Neckline stops expanding
Cyan dashed vertical line to bullish target
Cyan horizontal tracking line follows price
Dashboard updates to:
⚠ Failed Top – Bullish
→ Shows new bullish target
→ Indicates target mode for failure case
→ Status: Bullish Reversal
→ Fully cyan display
🎯 Upside Target (after Double Top failure)
Max Top = max(Point 2, Point 4)
Height = Max Top − Point 3
• Conservative: Max Top + (Height × 0.618)
• Balanced: Max Top + (Height × 1.0)
• Aggressive: Max Top + (Height × 1.618)
📊 Quality Scoring System (0–100)
1️⃣ Symmetry (30%)
Measures price match between the two bottoms or two tops.
High score (25–30): Near-perfect symmetry → very strong pattern
Medium (15–24): Good match → reliable signal
Low (5–14): Weak symmetry → use caution
Zero: No symmetry → invalid pattern
2️⃣ Trend Strength (20%)
Uses ADX and DI indicators.
20 pts: Strong trend confirmed (e.g., ADX ≥ 20 + correct DI alignment)
10 pts: Trend filter disabled
6 pts: Weak or sideways trend
3️⃣ Volume Behavior (20%)
Declining volume on second touch is a positive sign (shows exhaustion).
15–20 pts: Clear volume drop → strong signal
10 pts: Neutral volume
6 pts: Rising volume → higher risk of continuation
4️⃣ Pattern Depth (15%)
Deeper patterns = stronger reversals.
12–15 pts: Deep → high reversal power
8–11 pts: Medium → acceptable
<8 pts: Shallow → weak signal
5️⃣ Structural Integrity (15%)
Checks logical structure (e.g., Point 1 > Point 3 in Double Bottom).
12–15 pts: Ideal structure
8–11 pts: Minor flaws
<8 pts: Poor setup
📈 Final Quality Rating & Colors
• 85–100 → ⭐ Excellent
→ Double Bottom: Cyan #00BCD4
→ Double Top: Light Red #FF5252
• 75–84 → ✨ Very Good
• 65–74 → ✓ Good
• 60–64 → ○ Acceptable
→ All use Amber #FFC107
• <60 → ❌ Rejected (not shown)
→ Gray #9E9E9E
🔧 Dynamic Filters
1️⃣ ATR Filter (Volatility Check)
Rejects patterns in abnormally high volatility periods.
→ If current ATR > 1.8 × 50-period ATR MA → pattern rejected
✅ Recommended for crypto, small caps
❌ Optional for calm markets (gold, bonds)
2️⃣ ADX Filter (Trend Confirmation)
Ensures a real trend exists before the pattern.
→ If ADX < 14 (70% of default 20) → pattern rejected
✅ Strongly recommended (keep ON)
3️⃣ Volume Filter (Behavior Validation)
Not used to reject patterns, but strongly affects quality score.
✅ Best for liquid markets (Forex majors, large stocks)
❌ Optional for illiquid assets
⚙️ Key Settings Explained
🔘 General Settings
• Language: Arabic / English
• Show Previous Patterns: Yes / No
→ “No” keeps chart clean; “Yes” for historical review
🔘 Pattern Selection
• Enable Double Bottom: ✅ / ❌
• Enable Double Top: ✅ / ❌
→ Use combinations:
✅✅ → Full reversal scanning
✅❌ → Long setups only
❌✅ → Short setups only
❌❌ → Indicator OFF
🔘 Detection Parameters
• Pivots Left (1–20): Higher = more reliable, fewer patterns
• Pivots Right (1–20): Lower = faster signals
• Min Width (5–100): Min candles between Bottom/Top 1 & 2
• Tolerance % (0.1%–5%): Max allowed price difference
• Min Arm (5–50): Min candles between pivot & neckline
• Min Trend (5–50): Min candles in prior trend
• Trend Lookback (50–500): How far back to detect trend start
• Extension Multiplier (1.0–5.0): How long to wait for breakout
🔘 Quality Settings
• Min Quality Score (0–100):
→ Conservative: 75–85
→ Balanced: 60–70
→ Flexible: 50–55
• Custom Weights: Adjust based on market (e.g., increase Volume weight in Forex)
🔘 Target Settings
• Bottom Bullish Target: Conservative / Balanced / Aggressive
• Bottom Bearish Target: (used on failure)
• Top Bearish Target: Conservative / Balanced / Aggressive
• Top Bullish Target: (used on failure)
🔘 Visual Settings
• Label Size: Small / Normal / Large / Huge
• Pattern Colors: Fully customizable
• Table: Show/Hide + Size (Small/Normal/Large) + Position (Top-Right / Top-Left / Bottom-Right / Bottom-Left)
• Fill Transparency: 70%–95% (default: 85%)
🔔 Alert System (8 Independent Alerts)
📌 Double Bottom Alerts
Bullish Breakout → “Double Bottom Breakout – Bullish!”
Bullish Target Hit → “Bullish Target Achieved!”
Failure (Bearish) → “Double Bottom Failed – Bearish!”
Bearish Target Hit → “Bearish Target Achieved (Failure)!”
📌 Double Top Alerts
Bearish Breakdown → “Double Top Breakdown – Bearish!”
Bearish Target Hit → “Bearish Target Achieved!”
Failure (Bullish) → “Double Top Failed – Bullish!”
Bullish Target Hit → “Bullish Target Achieved (Failure)!”
Each alert can be enabled/disabled independently and supports pop-ups, emails, or webhooks.
⚠️ Disclaimer:
This indicator is for educational and analytical purposes only. It does not constitute financial, investment, or trading advice. Use it in conjunction with your own strategy and risk management. Neither TradingView nor the developer is liable for any financial decisions or losses.

Atlas 8 Currency Session Momentum (6H, London)This indicator calculates real-time currency strength for the 8 major currencies (USD, EUR, GBP, JPY, AUD, NZD, CAD, CHF) using a balanced multi-pair engine and a 6-hour momentum reset.
🔍 How it works
The indicator computes the relative strength of each currency by averaging the percentage change of 7 major cross-pairs for each currency.
A currency's value increases when pairs where it is the base appreciate, and decreases when pairs where it is the quote depreciate.
This creates a symmetric and stable strength calculation similar to institutional relative-value models.
🕒 Session-based Momentum Reset
The global trading day is split into 4 × 6-hour blocks:
• 00:00–06:00 Tokyo
• 06:00–12:00 London
• 12:00–18:00 New York
• 18:00–24:00 Late US/Asia pre-open
At each new 6-hour session, all strength lines reset to 0.
This highlights fresh intraday momentum generated by liquidity transitions between sessions.
🎯 What the indicator shows
• Relative strength of all 8 currencies
• Smooth momentum curves using EMA smoothing
• Vertical dividers at each new session
• Background color for each session
• Real intraday build-up of strength/weakness (not cumulative from previous day)
This tool is designed for intraday traders who follow cross-currency momentum during session transitions (Tokyo → London → NY).
🧭 How to use it
• Look for the strongest vs weakest currency after each session reset
• Identify fresh trends during London and NY opens
• Confirm currency-pair bias using strength divergence
• Track momentum exhaustion when lines flatten or converge

Dual MACD AccelerationDual MACD Acceleration Indicator – Synopsis
Purpose:
This indicator identifies early momentum shifts in the market by comparing a fast MACD (8/20/6) with a slower MACD (12/26/9). It highlights potential strong buy and sell signals when the faster MACD crosses the slower MACD, allowing traders to catch trend accelerations before the full move develops.
Components
Fast MACD (8/20/6)
Responds quickly to short-term price changes.
Detects early momentum shifts.
Slow MACD (12/26/9)
Captures the dominant trend.
Provides a smoother reference for comparison.
Acceleration Signals
Long (▲): Fast MACD crosses above Slow MACD → potential bullish acceleration.
Short (▼): Fast MACD crosses below Slow MACD → potential bearish acceleration.
Zero Line
Optional visual reference for overall trend direction.
Crosses above zero = bullish trend, below zero = bearish trend.
Key Features
Clean, minimal chart display.
Optional toggles to show/hide each MACD line.
Label markers indicate crossovers.
Built-in alert conditions for automated notifications.
Trading Use
Trend Confirmation:
Best used with higher timeframe filters (VWAP or EMAs) to avoid fakeouts.
Entry Timing:
Enter on the first pullback after a crossover signal.
Only trade in the direction of the dominant trend.
Stops & Risk:
Use recent swing lows/highs for stop placement.
TP levels can be structure-based or trailing with price momentum.
Synopsis Summary:
The Dual MACD Acceleration Indicator is a lightweight, early-momentum tool designed for scalpers and short-term traders. It captures fast shifts in trend by comparing a faster and slower MACD, highlighting strong buy and sell opportunities while remaining clean and easy to read. For higher accuracy, combine with trend filters like VWAP or EMAs.

Dual MACD📘 Dual MACD — Synopsis
The Dual MACD indicator displays two separate MACD systems inside the same pane, allowing traders to compare fast and slow momentum behavior simultaneously.
What It Includes
Two fully adjustable MACDs
MACD 1 default: 12 / 12 / 9
MACD 2 default: 8 / 20 / 6
Show/Hide Toggles so each MACD can be viewed independently or together.
MACD Lines, Signal Lines, and Histograms for both systems.
Clean layout with a compact panel title: “MACD x2”
What It Helps You See
Short-term vs. longer-term momentum shifts
Faster MACD reacting to quick trend changes
Slower MACD confirming or filtering signals
Trend strength, momentum acceleration, and crossover behavior in a single pane
Why It’s Useful
The Dual MACD gives you momentum confirmation, fakeout filtering, and multi-speed trend insight—making it valuable for scalpers, intraday traders, and swing traders who want to reduce noise and improve signal quality.

My script//@version=5
indicator("LTF Multi-Condition BUY Signal (v5 clean)", overlay=true, max_labels_count=100, max_lines_count=100)
// ───────────────── INPUTS ─────────────────
pivot_len = input.int(4, "Pivot sensitivity (structure)", minval=2, maxval=12)
range_len = input.int(20, "Range lookback for breakout", minval=5)
htf_tf = input.timeframe("480", "HTF timeframe (8H+)")
reclaim_window = input.int(5, "Reclaim window (bars)", minval=1)
ema_fast_len = input.int(9, "EMA fast length")
ema_slow_len = input.int(21, "EMA slow length")
rsi_len = input.int(14, "RSI length")
rsi_pivot_len = input.int(4, "RSI pivot sensitivity")
rsi_div_lookback = input.int(30, "RSI divergence max lookback (bars)")
daily_vol_mult = input.float(1.0, "Daily volume vs SMA multiplier", step=0.1)
htf_vol_sma_len = input.int(20, "HTF volume SMA length")
require_reclaim = input.bool(true, "Require HTF reclaim")
use_aggressive_HL = input.bool(false, "Aggressive HL detection")
// ───────────────── BASE INDICATORS ─────────────────
emaFast = ta.ema(close, ema_fast_len)
emaSlow = ta.ema(close, ema_slow_len)
rsiVal = ta.rsi(close, rsi_len)
// ───────────────── DAILY CHECKS (VOLUME & OBV) ─────────────────
// Daily OBV and previous value
daily_obv = request.security(syminfo.tickerid, "D",
ta.cum(ta.change(close) > 0 ? volume : ta.change(close) < 0 ? -volume : 0))
daily_obv_prev = request.security(syminfo.tickerid, "D",
ta.cum(ta.change(close) > 0 ? volume : ta.change(close) < 0 ? -volume : 0) )
// Daily volume & SMA
daily_vol = request.security(syminfo.tickerid, "D", volume)
daily_vol_sma = request.security(syminfo.tickerid, "D", ta.sma(volume, 20))
daily_vol_ok = not na(daily_vol) and not na(daily_vol_sma) and daily_vol > daily_vol_sma * daily_vol_mult
daily_obv_ok = not na(daily_obv) and not na(daily_obv_prev) and daily_obv > daily_obv_prev
// ───────────────── HTF SUPPORT / RECLAIM ─────────────────
htf_high = request.security(syminfo.tickerid, htf_tf, high)
htf_low = request.security(syminfo.tickerid, htf_tf, low)
htf_close = request.security(syminfo.tickerid, htf_tf, close)
htf_volume = request.security(syminfo.tickerid, htf_tf, volume)
htf_vol_sma = request.security(syminfo.tickerid, htf_tf, ta.sma(volume, htf_vol_sma_len))
htf_bull_reject = not na(htf_high) and not na(htf_low) and not na(htf_close) and (htf_close - htf_low) > (htf_high - htf_close)
htf_vol_confirm = not na(htf_volume) and not na(htf_vol_sma) and htf_volume > htf_vol_sma
htf_support_level = (htf_bull_reject and htf_vol_confirm) ? htf_low : na
// Reclaim: LTF close back above HTF support within N bars
reclaimed_now = not na(htf_support_level) and close > htf_support_level and ta.barssince(close <= htf_support_level) <= reclaim_window
htf_reclaim_ok = require_reclaim ? reclaimed_now : true
// ───────────────── STRUCTURE: BOS & HL (CoC) ─────────────────
swingHighVal = ta.pivothigh(high, pivot_len, pivot_len)
swingLowVal = ta.pivotlow(low, pivot_len, pivot_len)
swingHighCond = not na(swingHighVal)
swingLowCond = not na(swingLowVal)
lastSwingHigh = ta.valuewhen(swingHighCond, swingHighVal, 0)
prevSwingHigh = ta.valuewhen(swingHighCond, swingHighVal, 1)
lastSwingLow = ta.valuewhen(swingLowCond, swingLowVal, 0)
prevSwingLow = ta.valuewhen(swingLowCond, swingLowVal, 1)
bos_bull = not na(prevSwingHigh) and close > prevSwingHigh
hl_confirm = not na(lastSwingLow) and not na(prevSwingLow) and lastSwingLow > prevSwingLow and ta.barssince(swingLowCond) <= 30
if use_aggressive_HL
hl_confirm := hl_confirm or (low > low and ta.barssince(swingLowCond) <= 12)
// ───────────────── RSI BULLISH DIVERGENCE ─────────────────
rsiLowVal = ta.pivotlow(rsiVal, rsi_pivot_len, rsi_pivot_len)
rsiLowCond = not na(rsiLowVal)
priceAtRsiLowA = ta.valuewhen(rsiLowCond, low , 0)
priceAtRsiLowB = ta.valuewhen(rsiLowCond, low , 1)
rsiLowA = ta.valuewhen(rsiLowCond, rsiVal , 0)
rsiLowB = ta.valuewhen(rsiLowCond, rsiVal , 1)
rsi_div_ok = not na(priceAtRsiLowA) and not na(priceAtRsiLowB) and not na(rsiLowA) and not na(rsiLowB) and
(priceAtRsiLowA < priceAtRsiLowB) and (rsiLowA > rsiLowB) and ta.barssince(rsiLowCond) <= rsi_div_lookback
// ───────────────── RANGE BREAKOUT ─────────────────
range_high = ta.highest(high, range_len)
range_breakout = ta.crossover(close, range_high)
// ───────────────── EMA CROSS / TREND ─────────────────
ema_cross_happened = ta.crossover(emaFast, emaSlow)
ema_trend_ok = emaFast > emaSlow
// ───────────────── FINAL BUY CONDITION ─────────────────
all_price_checks = bos_bull and hl_confirm and rsi_div_ok and range_breakout
all_filter_checks = ema_trend_ok and ema_cross_happened and daily_vol_ok and daily_obv_ok and htf_reclaim_ok
buy_condition = all_price_checks and all_filter_checks
// ───────────────── PLOTS & ALERT ─────────────────
plotshape(
buy_condition,
title = "BUY Signal",
location = location.belowbar,
style = shape.labelup,
text = "BUY",
textcolor = color.white,
color = color.green,
size = size.small)
plot(htf_support_level, title="HTF Support", color=color.new(color.green, 0), linewidth=2, style=plot.style_linebr)
alertcondition(buy_condition, title="LTF BUY Signal", message="LTF BUY Signal on {{ticker}} ({{interval}}) — all conditions met")

Liquidity LayoutLiquidity Layout
The Liquidity Layout is a comprehensive macroeconomic indicator that tracks global liquidity conditions by aggregating multiple financial data streams from major economies (US, EU, China, Japan, UK, Canada, Switzerland). It provides traders with a macro view of market liquidity to help identify favorable conditions for risk assets
⚠️ Important: Timeframe Settings
This indicator is designed for the 1W (weekly) timeframe. If you use other timeframes, you must adjust the offset parameter in the settings to properly align the data with price action. The default offset of 12 is calibrated for weekly charts.
What It Measures
This indicator combines seven key components of global liquidity:
1. Global M2 Money Supply - Tracks broad money supply (M2) plus 10% of narrow money supply (M1) across major economies, weighted by currency strength. This represents the total amount of money circulating in the private sector.
2. Central Bank Balance Sheets (CBBS) - Monitors the combined balance sheets of major central banks (Fed, ECB, BoJ, PBoC, etc.), reflecting quantitative easing and monetary expansion policies.
3. Foreign Exchange Reserves (FER) - Aggregates forex reserves held by central banks, indicating international liquidity buffers and capital flows.
4. Current Account + Capital Flows (CA) - Combines current account balances with capital flows to measure cross-border money movement and trade liquidity.
5. Government Spending (GSP) - Tracks government expenditure minus a portion of federal expenses, representing fiscal stimulus and public sector liquidity injection.
6. World Currency Unit (WCU) - A custom forex composite that weights major and emerging market currencies to capture global currency strength dynamics.
7. Bond Market Conditions - Analyzes yield curves, spreads, and bond indices to assess credit conditions and risk appetite in fixed income markets.
The Formula
The indicator uses two main calculation modes:
ADJ Global Liquidity (Default):
×
This multiplies liquidity components by currency and bond market factors to capture the interactive effects between monetary conditions and market sentiment.
TPI (Trend Power Index) Mode:
A normalized version that combines all components with optimized weights:
Global Liquidity Index: 10%
Bonds: 17.5%
Bond Yields: 25%
Currency Strength: 25%
Government Spending: 5%
Current Account: 5%
M2: 2.5%
Central Bank Balance Sheets: 2.5%
Forex Reserves: 5%
Oil (macro risk indicator): 2.5%
How to Use It
Visualization Modes:
Background Mode (default): Orange background appears when TPI is positive (favorable liquidity conditions)
Line Mode: Displays the indicator as an orange line with customizable offset
Interpreting the Signal:
Positive/Rising = Expanding liquidity, generally bullish for risk assets
Negative/Falling = Contracting liquidity, risk-off environment
TPI > 1 = Extremely favorable conditions (upper threshold)
TPI < -1 = Severe liquidity stress (lower threshold)
Best Practices:
Use on higher timeframes (daily, weekly) for macro trend analysis
Combine with price action - liquidity often leads market moves by weeks or months
Watch for divergences between liquidity and asset prices
Particularly relevant for Bitcoin, equities, and risk assets
Data Sources
The indicator pulls real-time economic data from TradingView's ECONOMICS database and major market indices, including central bank statistics, government reports, and forex rates across G7 and major emerging markets.
Settings
Data Plot: Choose which liquidity component to display
Plot Type: Switch between raw Index values or normalized TPI
Offset: Shift the plot forward/backward for alignment (default: 12 for weekly charts)
Style: Background shading or line plot
Notes
This is a macro-level indicator best suited for understanding the broader liquidity environment rather than short-term trading signals. It helps answer the question: "Is the global financial system expanding or contracting liquidity?"

Smart RSI MTF Matrix [DotGain]Summary
Are you tired of trading trend signals, only to miss the bigger picture because you are focused on a single timeframe?
The Smart RSI MTF Matrix is the ultimate "Cockpit View" for momentum traders. Unlike chart overlays that can sometimes clutter your price action, this indicator organizes RSI conditions across 10 different timeframes simultaneously into a clean, separate Heatmap pane.
It monitors everything from the 5-minute chart all the way up to the 12-Month view , giving you a complete X-ray vision of the market's momentum structure instantly.
⚙️ Core Components and Logic
The Smart RSI MTF Matrix relies on a sophisticated hierarchy to deliver clear, actionable context:
Multi-Timeframe Engine: The script runs 10 independent RSI calculations in the background, organized in rows from bottom (Short Term) to top (Long Term).
Classic RSI Thresholds:
Overbought (> 70): Indicates price may be extended to the upside.
Oversold (< 30): Indicates price may be extended to the downside.
Smart Visibility System (The "Secret Sauce"): Not all signals are equal. A 5-minute signal is "noise" compared to a Yearly signal. This indicator automatically applies Transparency to differentiate importance. The visibility increases by 10% for each higher timeframe slot (Row).
🚦 How to Read the Matrix
The indicator plots dots in 10 stacked rows. The position and opacity tell you the direction and significance:
🟥 RED DOTS (Overbought Condition)
Trigger: RSI is above 70 on that specific timeframe.
Meaning: Potential bearish reversal or pullback.
🟩 GREEN DOTS (Oversold Condition)
Trigger: RSI is below 30 on that specific timeframe.
Meaning: Potential bullish reversal or bounce.
⚪ GRAY DOTS (Neutral)
Trigger: RSI is between 30 and 70.
Meaning: No extreme momentum present.
👻 TRANSPARENCY (Signal Strength)
The visibility of the dot tells you exactly which Timeframe (Row) is triggered. The higher the row, the more solid the color:
Faint (10-30% Visibility): Rows 1-3 (5m, 15m, 1h). Used for scalping entries.
Medium (40-60% Visibility): Rows 4-6 (4h, 1D, 1W). Used for swing trading context.
Solid (70-100% Visibility): Rows 7-10 (1M, 3M, 6M, 12M). Used for identifying major macro cycles.
Visual Elements
Structure: Row 1 (Bottom) represents the 5-minute timeframe. Row 10 (Top) represents the 12-Month timeframe.
Vertical Alignment: If you see a vertical column of Red or Green dots, it indicates Multi-Timeframe Confluence —a highly probable reversal point.
Key Benefit
The goal of the Smart RSI MTF Matrix is to keep your main chart clean while providing maximum information. You can instantly see if a short-term pullback (Faint Green Dot) is happening within a long-term uptrend (Solid Gray/Red Dot), allowing for precision entries.
Have fun :)
Disclaimer
This "Smart RSI MTF Matrix" indicator is provided for informational and educational purposes only. It does not, and should not be construed as, financial, investment, or trading advice.
The signals generated by this tool (both "Buy" and "Sell" indications) are the result of a specific set of algorithmic conditions. They are not a direct recommendation to buy or sell any asset. All trading and investing in financial markets involves substantial risk of loss. You can lose all of your invested capital.
Past performance is not indicative of future results. The signals generated may produce false or losing trades. The creator (© DotGain) assumes no liability for any financial losses or damages you may incur as a result of using this indicator.
You are solely responsible for your own trading and investment decisions. Always conduct your own research (DYOR) and consider your personal risk tolerance before making any trades.
