TV Community AlgoTV Community Algo is a free TradingView script that I designed from the ground to benefit the traders of this community. It has plenty of features that you will enjoy, and I have included documentation for how to use this below!
Settings:
Basic:
Turn the Void Lines on or off
Turn the Dashboard on or off
Turn the Signal Bars on or off
Turn the Support & Resistance Lines on or off
Turn the EMA 8 and EMA 200 on or off
Turn the Buy & Sell Signals on or off
Turn the Fibonacci Retracement Tool on or off
Style:
Change the Dashboard's distance from the price action
Change the Dashboard's Color and Transparency
Change the Dashboard Text Color
Change the Fibonacci Deviation
Make the Fibonacci Retracement Tool reverse
Make the Fibonacci Lines extend left, right, both directions, or none
Turn Fibonacci Prices on or off
Turn Fibonacci Levels on or off and change between percent or value
Change Fibonacci Label Position from the left or the right
Usage:
This algo has many uses including but not limited to:
Finding entries and exits using the EMA 8 and EMA 200 crossovers
Using the Void Lines to identify bounces or reversals
Using the Signal Bars to identify trend and confirmation for entries and exits
Using the Dashboard information for confirmation and informational purposes
In the images below, I give a few examples of the many uses of the TV Community Algo!
VOID LINES
The Void Lines are very helpful when it comes to identifying reversals.
TV COMMUNITY ALGO DASHBOARD
The Dashboard is filled with useful information that all traders can benefit from!
SIGNAL BARS
The colored candles known as Signal Bars inform you of when the price action is above or below the midpoint of the Void Lines.
AUTO SUPPORT & RESISTANCE LINES
These lines help traders find accurate levels of support & resistance on all time frames, and the lines change color depending on if the price is above or below them.
EMA 8 AND 200
The EMA 8 and EMA 200 crossovers can be used as entry and exit signals.
BUY & SELL SIGNALS
The BUY & SELL signals can be used to find optimal entries and exits for trades on any time frame. Smaller time frames are best for scalping, while larger time frames are more suited for longer trades. When combined with the EMA lines and Dashboard information, these signals can produce incredibly profitable trades.
AUTO FIBONACCI RETRACEMENT TOOL
The Auto Fibonacci Retracement Tool allows you to plot perfect Fib Lines every time.
Conclusion:
I truly hope that the TV Community Algo benefits the TradingView community and that you all find some value in it. I worked very hard on this product and I would love to see it put to good use.
with love,
-Lemon 🍋
This work is licensed under a Attribution-NonCommercial-ShareAlike 4.0 International (CC BY-NC-SA 4.0) creativecommons.org
Search in scripts for "200元+股票大盘"

CT Moving Average Crossover IndicatorMoving Average Crossover Indicator
Here I present a moving average indicator with 9 user definable moving averages from which up to 5 pairs can be selected to show what prices would need to be closed at on the current bar to cross each individual pair.
I have put much emphasis here on simplicity of setting the parameters of the moving averages, selecting the crossover pairs and on the clarity of the displayed information in the optional “Moving Average Crossover Level” Information Box.
What Is a Moving Average (MA)?
According to Investopedia - “In statistics, a moving average is a calculation used to analyze data points by creating a series of averages of different subsets of the full data set.
In finance, a moving average (MA) is a stock indicator that is commonly used in technical analysis. The reason for calculating the moving average of a stock is to help smooth out the price data by creating a constantly updated average price.
By calculating the moving average, the impacts of random, short-term fluctuations on the price of a stock over a specified time-frame are mitigated.”
The user can set the color, type (SMA/EMA) and length of each of the 9 moving averages.
Then the user may choose 5 pairs of moving averages from the set of 9.
The script will then calculate the price needed to be crossed by the close of the current bar in order to crossover each of the user defined pairs and outputs the results as optional lineplots and/or an Infobox which shows the relevant information in a very clear way.
The user may switch the moving averages, crossover lineplots and infobox on and off easily with one click boxes in the settings menu.
The number of decimal places shown in the Infobox can be altered in the settings menu.
If the price required to cross a pair of moving averages is zero or less, the crossover level will display “Impossible” and the plots will plot at zero. (this helps ameliorate chart auto-focus issues)
Quoting a variety of online resources …….
Understanding Moving Averages (MA)
Moving averages are a simple, technical analysis tool. Moving averages are usually calculated to identify the trend direction of a stock or to determine its support and resistance levels. It is a trend-following—or lagging—indicator because it is based on past prices.
The longer the time period for the moving average, the greater the lag. So, a 200-day moving average will have a much greater degree of lag than a 20-day MA because it contains prices for the past 200 days. The 50-day and 200-day moving average figures for stocks are widely followed by investors and traders and are considered to be important trading signals.
Moving averages are a totally customizable indicator, which means that an investor can freely choose whatever time frame they want when calculating an average. The most common time periods used in moving averages are 15, 20, 30, 50, 100, and 200 days. The shorter the time span used to create the average, the more sensitive it will be to price changes. The longer the time span, the less sensitive the average will be.
Investors may choose different time periods of varying lengths to calculate moving averages based on their trading objectives. Shorter moving averages are typically used for short-term trading, while longer-term moving averages are more suited for long-term investors.
There is no correct time frame to use when setting up your moving averages. The best way to figure out which one works best for you is to experiment with a number of different time periods until you find one that fits your strategy.
Predicting trends in the stock market is no simple process. While it is impossible to predict the future movement of a specific stock, using technical analysis and research can help you make better predictions.
A rising moving average indicates that the security is in an uptrend, while a declining moving average indicates that it is in a downtrend. Similarly, upward momentum is confirmed with a bullish crossover, which occurs when a short-term moving average crosses above a longer-term moving average. Conversely, downward momentum is confirmed with a bearish crossover, which occurs when a short-term moving average crosses below a longer-term moving average.
Types of Moving Averages
Simple Moving Average (SMA)
The simplest form of a moving average, known as a simple moving average (SMA), is calculated by taking the arithmetic mean of a given set of values. In other words, a set of numbers–or prices in the case of financial instruments–are added together and then divided by the number of prices in the set.
Exponential Moving Average (EMA)
The exponential moving average is a type of moving average that gives more weight to recent prices in an attempt to make it more responsive to new information.
To calculate an EMA, you must first compute the simple moving average (SMA) over a particular time period. Next, you must calculate the multiplier for weighting the EMA (referred to as the "smoothing factor"), which typically follows the formula: 2/(selected time period + 1). So, for a 20-day moving average, the multiplier would be 2/(20+1)= 0.0952. Then you use the smoothing factor combined with the previous EMA to arrive at the current value.
The EMA thus gives a higher weighting to recent prices, while the SMA assigns equal weighting to all values.

Structure AnalyzerA momentum indicator that uses the highest and lowest values for price in three different lookback lengths to find the performance relative to three timeframes.
- The yellow line is the product of the price performance in three different timeframes.
- The red line is 200 EMA of the performance.
- The blue columns represent the same calculation or the volume(OBV based).
- The aqua line is the 200 EMA of the volume performance.
How to use: Whenever the performance crosses above the 200 EMA, the price is in an uptrend.
Important: When in a downtrend, the performance will stay below the 200 EMA for a long time; hence it is important o wait until the crossover.

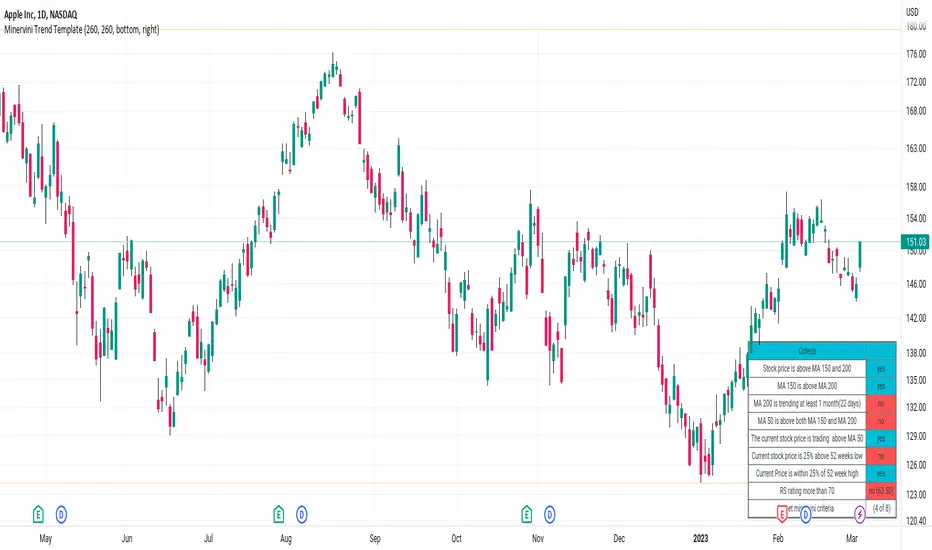
Minervini Trend TemplateMinervini Trend Template
1. Stock price is above MA 150 and 200
2. MA 150 is above MA 200
3. MA 200 is trending at least 1 month(22 days)
4. MA 50 is above both MA 150 and MA 200
5. Current stock price is 25% above 52 weeks low
6. Current Price is within 25% of 52 week high
7. RS Ratings
Xiang Stoch MACD 200EMAStochastic + MACD + 200 EMA indicator
Green flag
1) MACD crossover Signal line
2) Stochastic in oversold region (=80)
3) Below 200 EMA (direction of trend)
I use 200 EMA to determine the direction of the trend, (can ignore point 3 for both flag if you got other ways).
If green flag, high possibility of market going up.
If red flag, high possibility of market going down.

ARI-DPO TrendThis is a new indicator that uses DPO (Detrended Price Oscillator) and calculating its HMA 200 and EMA 200 is able to show the current price direction.
if the line is below 0 the market is in a downtrend in the short term, otherwise, the market is in an uptrend.
if the line is red, the market is in a downtrend in the long term (bearish), otherwise, the market is in a long term uptrend (bullish)
a sequence of red/green lines means that the market is choppy
Currently, I'm using it with cryptocurrencies to assess if the short term price action.
How it works:
the indicator calculates the DPO (default 21 periods) and its HMA (default 200 periods) and EMA (default 200 periods) and shows if the DPO is above both HMA and SMA (indicator line above 0 and green), below both (indicator line below 0 and red) or between (the indicator line and the colour are not matching: e.g. red line above the zero or green line below zero). the latter is the classic situation of a choppy market or a possible short term reversal.
The aim of this indicator is to find a good entry point for long/short positions.
I'm still testing and improving it, please
let me know in the comments if you find this useful. Cheers!

GAURs Polynomial Regression ChannelsThanks to The Sweet Lord , here is the Gaur's Polynomial Regression Channel.
Its a Polynomial Regression Channel but applied a little differently. Wont go into technical details much. Overview of options is as follows-
- - - - - - - - - - - - - - - - - - - - - - - - - - - - - - - - - - - - - - - - - - - - - - - - - - - - - - - - - - - - - - - - - - - - - - - - - - - - - - - - - - - - - - - - - - - - - - - -
Channel Options
- - - - - - - - - - - - - - - - - - - - - - - - - - - - - - - - - - - - - - - - - - - - - - - - - - - - - - - - - - - - - - - - - - - - - - - - - - - - - - - - - - - - - - - - - - - - - - - -
1. Degree of Polynomial: 1/2/3
Default = 3
Defines the degree of polynomials - 1,2,3. Note here, degree 1 will not be a straight line since its applied differently.
Try different degrees for different fits and market conditions.
2. Channel Length:
Default 30 (candles)
You can go beyond 100 or 200 candle lengths but smaller is the usual preference of Poly-Reg-channel traders. It all depends on market conditions and your style of trading. Do your research. I am usually comfortable with a range of 20-50 (in crypto markets).
3. Basis of Channel height/boundries: ATR/Manual
Default: ATR
ATR provides a dynamically adjusted entry/exit bounds of the channels. As ATR changes, the channel bounds also changes its height. It can also be fixed manually. Manual heights wont change automatically.
4. Basis of Y-Value: open/close/ sma / ema / wma /hilow
Default: close
Y- value is the y value of the (x,y) coordinates used while calculating the regression coefficients. Dont worry about it, its nothing serious.
5. Apply channel smoothning using sma?: Yes/No
Default: Yes
Without smoothning, the channel does not "look" good.
6. Shaded Area Height Percentage:
Its the extra margin for the channel. Its in percentage of the total height (defined 3 above) of channels. The shaded area provides an extra allowance for your entries or exits beyond the ATR or manual heights.
7. Plot RSI?: Yes/No
Default: Yes
Plots RSI (orange line in between the channel - its different from the dotted center line) considering the downbound of channels as 0 (oversold) and upbound of channels as 100 (overbought)
8. Plot 200 sma?: Yes/No
Default: Yes
It plots a 200 period fast (green) and 225 period slow (red) sma . I usually use two MAs. Its visually very easy to understand.
- - - - - - - - - - - - - - - - - - - - - - - - - - - - - - - - - - - - - - - - - - - - - - - - - - - - - - - - - - - - - - - - - - - - - - - - - - - - - - - - - - - - - - - - - - - - - - - -
Sample Strategy
- - - - - - - - - - - - - - - - - - - - - - - - - - - - - - - - - - - - - - - - - - - - - - - - - - - - - - - - - - - - - - - - - - - - - - - - - - - - - - - - - - - - - - - - - - - - - - - -
You can develop your own strategy with the channels. But following is just one of the ways you can trade.
Best Application: Ranging markets. But can be happily used in volatile conditions, with a little experience.
1. SMA: -- (this condition is optional really)
If green (200) is above red (225) go only long. If red is above green go only short. Defines long term trend of the market.
2. Channel slope: -- (this stuff needs practice/experience)
Depending on the channel slope, like if its tending to go up or down, you can choose to take only short or long trades. It defines short term momentum of the market.
3. ATR based heights:
Since its ATR based, the channel height are our natural entry and exit points.
Long:
When price touches lower shaded area, consider possible long entry. Exit on price entering the upper shaded area.
Short:
Enter on upper bound shaded area, exit on lower.
4. RSI:
For additional conformations. Again note, the RSI considers the lower bound of channel as 0 and upper as 100. But since, the channel moves up and down, the RSI will also move not only as RSI but also with the channel. Meaning, say if the RSI is valued at 50, then it will be near the center of the channel but since the center changes as time and price changes, the RSI valued at 50 at different times will not be at the same horizontal level respect to the graph, although it will be at the same level (center) respect to the channel.
5. PRC Channel Percentage label:
This label is at the lower side a bit ahead of the current candle. Provides you info on what is the channel percentage. This is especially helpful in crypto markets to gauge your possible percentage profit where profits can be much higher than forex or other instruments. It can also helps you select a suitable market/instrument if the channels are based on ATR.
6. Extra indicators:
I usually use stochastic along with this setup for extra conformations.
- - - - - - - - - - - - - - - - - - - - - - - - - - - - - - - - - - - - - - - - - - - - - - - - - - - - - - - - - - - - - - - - - - - - - - - - - - - - - - - - - - - - - - - - - - - - - - - -
Donate
- - - - - - - - - - - - - - - - - - - - - - - - - - - - - - - - - - - - - - - - - - - - - - - - - - - - - - - - - - - - - - - - - - - - - - - - - - - - - - - - - - - - - - - - - - - - - - - -
Use freely and donate generously if you find value. Your help will really help.
I had earlier provided BTC addresses for donations but it seems to violate TV House rules.
Hope they make TV coins redeemable in future.
- Pranav Joshi
- - - - - - - - - - - - - - - - - - - - - - - - - - - - - - - - - - - - - - - - - - - - - - - - - - - - - - - - - - - - - - - - - - - - - - - - - - - - - - - - - - - - - - - - - - - - - - - -
Extra Info
- - - - - - - - - - - - - - - - - - - - - - - - - - - - - - - - - - - - - - - - - - - - - - - - - - - - - - - - - - - - - - - - - - - - - - - - - - - - - - - - - - - - - - - - - - - - - - - -
// © cpranavjoshi
// special thanks to the "Trading View" people for providing this great platform for free
// ------------------------
// MATH
// ------------------------
// special thanks to an article on the web that provided layman friendly explanation of the maths
// unfortunately i wont be able to provide the link to that article owing to TV restrictions, though i sincerely would have liked to credit the author.
// Google search this phrase, and you should be able to get it in one of the first results - "polynomialregression Mathematics of Polynomial Regression"
// my regression math calculation is a further resolution upon the generalized matrix formula given in the that article.
// the generalized matrix looks scary but in fact its much simpler than one may assume
// the summation sign things are just float numbers that can be easily found out
// so we get a matrix with number of equations equal to the number of unknowns.
// e.g. if its a 3rd degree poly, it has 4 unknowns (c0,c1,c2,c3) with 4 equations as in the generalized matrix
// it can be resolved by simple algebra
// Note: the results have been verified with excel using same input data points.
// pine was difficult for me so i coded it in python first to verify
// ------------------------
// WHY
// ------------------------
// this script was coded because Pranav badly needed Polynomial channels (had used them in mt4 earlier)
// and at the time of this coding, i could not find any readily available script in the trading view public library ( tnx public)
// the complex math was probably the hurdle
// i m not good in maths, but by the Will of the Lord, i could resolve the issue with simple algebra and logic
// ------------------------
// PINE
// ------------------------
// i am just an average (even poor probably) programmer and pine script is not my language
// this is a humble attempt to write my first pine with whatever i could do quickly
// experts - feel free to develop if needed. have used some workarounds in drawings/plottings. rectify them if possible
//
//
// - Pranav Joshi

Trading Rush Signals & AlertsThis is an unofficial script for strategies tested on TRADING RUSH Youtube channel. Over time, most successful strategies will be added with an option to set strategy-specific alerts . Trading Rush Signals & Alerts will draw signals on the chart when the entry conditions are met. You can also opt for displaying indicators .
My script is meant for beginners but can be used by veterans too. Just pick only one or two strategies, you don't want to flood your chart with conflicting signals. You may want to support your trades with a proper analysis. If a new signal occurs when there is still an open position, you are not supposed to take another.
The current version includes MACD and Donchian Channels.
MACD strategy:
►Buy, when MACD crosses below the signal line when it is negative. The price must also be above 200 EMA.
►Sell, when MACD crosses above the signal line when it is positive. The price must also be below 200 EMA.
►This strategy was tested on 30-minute charts of EURUSD and EURJPY with reward-to-risk ratio 1,5 and win rate of 62% over 100 trades .
►►►MACD has to be added to your chart separately because it needs a new window. Indicators displaying will not add this indicator to the chart.
Donchian Channels strategy:
►Buy, when the price breaches Donchian to the upside after making a new low. The price must also be above 200 EMA.
►Sell, when the price breaches Donchian to the downside after making a new high. The price must also be below 200 EMA.
►Stop-loss is Donchian bottom for long and Donchian top for shorts. Check the channel for more information.
►This strategy was tested on 30-minute charts of EURUSD with reward-to-risk ratio 1,5 and win rate of 58% over 100 trades .
►►►I programmed alerts for Donchians to come ahead of an actual breach. If you often leave the screen when trading, this will help you. The necessary downside for that is the alerts might come when the signal doesn't trigger in the end. You will see a mark on the chart if the conditions are truly met.
Bear in mind that backtesting performance doesn't guarantee future profitability. • Most systematic strategies are not suitable for any timeframe. • You should perform your own backtest to base your trades on more data & to establish confidence in the selected strategy.
New strategies will be added when I have time. If I see multiple people asking for the same new feature, I might agree to release it with a new version. I am not going to add input options in this script, it could come as a separate script though. I am in no way affiliated with the Youtubechannel , so if you find the script helpful, shot me a message or send me some TradingView coins >)
If you encounter any bug, you can report it in a message or in comments. Support it with screenshot and relevant information such as a time when it occurred and what options were on etc.
Moving average Two ColoursExponential moving average of 200 periods, which changes color according to the position of the candles.
(200 periods: default configuration Option to change periods allowed)
If the candles are on the EMA, this will have green color, otherwise red color (colors, thickness configurable).
**********************************************************************************************************************************************
Descripción en Español:
Media móvil Exponencial de 200 periodos, la cuál cambia de color según posición de las velas.
(200 periodos: configuración default. Opción de cambio de periodos permitida)
Si las velas están sobre la EMA , esta tendrá color verde, caso contrario color rojo (colores, grosor configurables).
cci based potential buy/sell signal
Commodity Channel Index Potential Buy Signal
Commodity Channel Index (CCI) is below oversold line (-200).
CCI then crosses above -100 line
Commodity Channel Index Potential Sell Signal
Commodity Channel Index (CCI) is above overbought line (+200).
CCI then crosses below +100 line.
Türkçe Açıklama;
CCI Potansiyel Al Sinyali
CCI indikatörünün -200 altında bulunduğu bölgeler aşırı satış bölgeleri,
Sonrasında aşağıdan gelerek -100 çizgisinin üzerine çıktığı yada çıkmak üzere olduğu noktalar al sinyali
CCI Potansiyel Satl Sinyali
CCI indikatörünün +200 üzerinde bulunduğu bölgeler aşırı alım bölgeleri,
Sonrasında yukarıdan inerek +100 çizgisinin altına indiği yada inmek üzere olduğu noktalar sat sinyali
Not: Tek başına kullanılması son derece hatalı sonuçlar verebilir. Sadece olabilirlik potansiyeli taşımaktadır.
Exponential Moving Average (Set of 3) [Krypt] + 13/34 EMAsI took Krypt's script and essentially added on to it.
the 20/50/100/200 EMAs should be used together as support and resistance as normal.
Wait for price to break 200 EMA
Wait for 50 EMA to cross 200 EMA
Wait for pullback to 50 EMA to open position
20 and 100 EMAs are for extra information about moving support and resistance
and 13/34 EMAs should be used in conjunction
When 13 EMA crosses 34 EMA, open position
When price gets far from 13/34, close position (because price will attempt to revert back to mean)
This is better for scalping and swing trades than the 20/50/100/200 setup.
Twitter: @AzorAhai06

ST_Trend_ReversalSTRONG TREND REVERSAL INDICATOR
The code is the percentage difference between the spot price of a given financial asset and its 200-day MA of that period. My standard setup is Daily, and I think it's got very good predictive power at that timeframe.
It can be read in two ways:
1. Values extremely above or below the 200-period MA present chances of buying/selling agains the prevailing trend.
2. Values closely above or below the 200-period MA are make-or-break market periods, where a medium-term trend becomes evident. Breaks above or below the MA are associated with strong chances of directional movements. But it's not fool-proof as false breaks have become commonplace nowadays.
Other way to use it is as confirmation of breakdowns: For example, an asset that loses its 200-day MA and then can't rally above it becomes exposed to steep losses afterwards.
It's also helpful to use in volatility trading: the closer the asset goes to its MA, the lower goes implied vol, and thus better opportiunities to be long volatility on those occasions where direction is hard to predict.
STRI = close/(200dMA)
Values over 100 indicate percentage premiums of spot vs its moving average.
Values below indicate percentage discounts of spot vs its moving average.

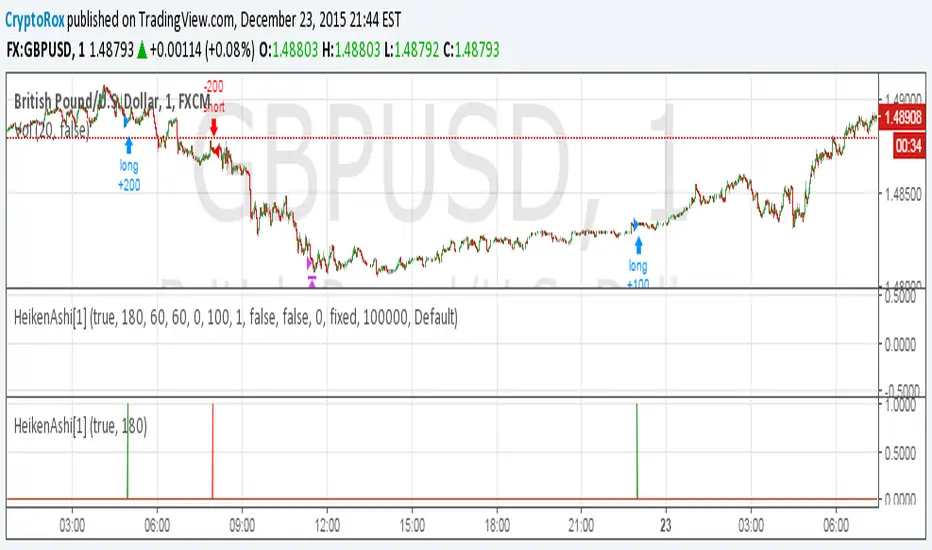
HeikenAshi[1]This is the alert script so you can automate this strategy using AutoView:
Make sure to use
crossing down value 0.9 once per bar (on condition) for this.
For the alert Message if you're using AutoView:
Long GBPUSD
c=order b=short
c=position b=short l=200 t=market
b=long q=0.01 l=200 t=market tp=60 sl=60
Short GBPUSD
c=order b=long
c=position b=long l=200 t=market
b=short q=0.01 l=200 t=market tp=60 sl=60
How to automate this strategy for free using a chrome extension.Hey everyone,
Recently we developed a chrome extension for automating TradingView strategies using the alerts they provide. Initially we were charging a monthly fee for the extension, but we have now decided to make it FREE for everyone. So to display the power of automating strategies via TradingView, we figured we would also provide a profitable strategy along with the custom alert script and commands for the alerts so you can easily cut and paste to begin trading for profit while you sleep.
Step 1:
You are going to need to download the Chrome Extension called AutoView. You can get the extension for free by following this link: bit.ly ( I had to shorten the link as it contains Google and TV automatically converts it to a symbol)
Step 2: Go to your chrome extension page, and under the new extension you'll see a "settings" button. In the setting you will have to connect and give permission to the exchange 1broker allowing the extension to place your orders automatically when triggered by an alert.
Step 3: Setup the strategy and custom script for the alerts in TradingView. The attached script is the strategy, you can play with the settings yourself to try and get better numbers/performance if you please.
This following script is for the custom alerts:
//@version=2
study("4All-Alert", shorttitle="Alerts")
src = close
len = input(4, minval=1, title="Length")
up = rma(max(change(src), 0), len)
down = rma(-min(change(src), 0), len)
rsi = down == 0 ? 100 : up == 0 ? 0 : 100 - (100 / (1 + up / down))
rsin = input(5)
sn = 100 - rsin
ln = 0 + rsin
short = crossover(rsi, sn) ? 1 : 0
long = crossunder(rsi, ln) ? 1 : 0
plot(long, "Long", color=green)
plot(short, "Short", color=red)
Now that you have the extension installed, the custom strategy and alert scripts in place, you simply need to create the alerts.
To get the alerts to communicate with the extension properly, there is a specific syntax that you will need to put in the message of the alert. You can find more details about the syntax here : gist.github.com
For this specific strategy, I use the Alerts script, long/short greater than 0.9 on close.
In the message for a long place this as your message:
Long
c=order b=short
c=position b=short l=200 t=market
b=long q=0.01 l=200 t=market tp=13 sl=25
and for the short...
Short
c=order b=long
c=position b=long l=200 t=market
b=short q=0.01 l=200 t=market tp=13 sl=25
If you'll notice in my above messages, compared to the strategy my tp and sl (take profit and stop loss) vary by a few pips. This is to cover the market opens and spread on 1broker. You can change the tp and sl in the strategy to the above and see that the overall profit will not vary much at all.
I hope this all makes sense and it is enough to not only make some people money, but to show the power of coming up with your own strategy and automating it using TradingView alerts and the free Chrome Extension AutoView.
ps. I highly recommend upgrading your TradingView account so you have access to back testing and multiple alerts.
There is really no reason you won't cover the cost and then some on a monthly basis using the tools provided.
Best of luck and happy trading.
Note: The extension currently allows for automation on 2 exchanges; 1broker and Okcoin. If you do not have accounts there, we'd appreciate you signing up using our referral links.
www.okcoin.com
1broker.com

VCP Trendline breakoutThe Signal:
Green Triangles indicate the price is approaching the trendline (Watchlist candidate).
Yellow Triangles indicate the price is very tight against the line (Execution imminent).
The Trigger: When price closes above the Grey Dotted Line, the line stops extending. This is your breakout signal.
Indicator Overview
The The VCP Trendline breakout indicator is a sophisticated technical indicator designed for trend followers and breakout traders (O'Neil, Minervini, Wyckoff styles). This script employs a State Machine logic to identify structural Volatility Contraction Patterns (VCP) in real-time.
It automatically detects valid Bases, tracks the "Right Side" construction, identifies nested handles (contractions), and draws precise supply trendlines—while strictly enforcing structural integrity rules (Higher Lows).
Core Logic & Features
1. Smart Base Detection
Trend Filter: The pattern recognition engine only activates when the price is above the 200 SMA, ensuring you are trading with the primary trend.
Base Validation: It identifies a "Base High" (H1) based on a configurable lookback period. It tracks the depth of the base and automatically invalidates the pattern if the drawdown exceeds the user-defined threshold (default 30%).
2. Recursive Nested Trendlines (VCP)
The indicator is capable of drawing Nested Trendlines (recursive resistance). It doesn't just draw a line from the peak; it identifies internal contractions within the base.
H1 (Primary): The main supply line from the top of the base.
H2, H3 (Internal): Trendlines connecting subsequent lower highs (handles) as volatility contracts.
Smart Fan: Includes a "Clean Fan" mode to show only the most relevant, latest trendline per anchor point.
3. Structural Integrity Enforcement (The "Higher Low" Rule)
This is the standout feature of this script. It performs an Anchor Integrity Check on every bar.
In a valid VCP, every contraction must form a Higher Low.
If the price creates a new pivot (H3) but then crashes lower than the previous contraction's floor (H2), the script identifies this as a Structural Failure.
Auto-Deletion: It immediately retroactively deletes the invalid trendlines associated with that failed contraction, keeping your chart clean and free of "ghost" signals.
4. "Right-Side" Logic
Collision Detection: Trendlines are calculated using "Right-Side Clearance." A line is only drawn if the path from the anchor to the new pivot is unobstructed by price action.
Signal Protection: "Watch" and "Near" signals are suppressed during the decline phase (Left Side). They only appear once the "Bottom" (L1) has been confirmed and price is recovering on the Right Side.
5. Proximity Alerts & Breakouts
Watch Zone (Green Triangle): Appears when the Low of the bar is within 8% (configurable) of a valid trendline.
Near Zone (Yellow Triangle): Appears when the Low of the bar is within 4% (configurable) of a valid trendline.
Breakout Stop: Trendlines are dynamic. The moment a bar closes above a trendline, the line stops extending immediately, marking the exact breakout point.
How to Use This Indicator
The Setup: Look for a stock in an uptrend (Price > 200 SMA).
The Construction: Wait for the script to identify the Base High (H1). As the price corrects and begins to recover, you will see Grey Dotted Lines appear, connecting the highs.
The Contraction: Watch for Nested Trendlines. If you see a second or third line form from a lower high (H2, H3), it indicates a tightening of price action (VCP).
Settings Configuration
Moving Averages
21 EMA, 50 SMA, 200 SMA: Built-in reference averages.
Base Settings
H1 Lookback: How many bars back the script looks to find the "Start" of the base (Default: 21). Increase this for longer-term bases.
Sub-High Pivot Bars: Controls the sensitivity of identifying internal highs (handles).
Max Base Depth: If the base drops more than this % (Default: 30%), the structure is considered failed and lines are removed.
Enable Nested Trendlines: Toggle ON to see internal VCP lines (H2, H3). Toggle OFF to see only the main H1 trendline.
Show Only Latest Line: Keeps the chart clean by removing older lines from the same anchor point.
Visuals & Signals
Near/Watch Zone %: Adjust the sensitivity of the Green/Yellow triangles.
Signal Size: Change the size of the triangle markers.
DISCLAIMER
This is an indicator, not a trading system. Apply good risk management and do your own due diligence before putting your hard earned money into anything.
This script is for educational and analytical purposes only. It does not constitute financial advice. Automated pattern recognition has limitations and should always be verified visually.

Q2A_CandlestickPatterns# Q2A Candlestick Patterns Library
A comprehensive Pine Script v6 library for detecting 44 candlestick patterns with trend detection and property calculations.
## 📋 Overview
The **Q2A_CandlestickPatterns** library provides a complete toolkit for identifying traditional Japanese candlestick patterns in TradingView. It includes both reversal and continuation patterns, organized by the number of candles required (1, 2, 3, and 5 candles).
### Key Features
- ✅ **44 Pattern Detection Functions** - Comprehensive coverage of major candlestick patterns
- ✅ **Organized by Candle Count** - Easy navigation (1, 2, 3, and 5 candle patterns)
- ✅ **Bullish/Bearish/Neutral Classification** - Clear signal categorization
- ✅ **Detailed Pattern Descriptions** - Each pattern returns name, type, and explanation
- ✅ **Property Calculation Helper** - Core function for analyzing candle characteristics
- ✅ **Clean Q2A Code Style** - Professional, maintainable, and well-documented
## 🚀 Quick Start
### Installation
```pinescript
import Quant2Alpha/Q2A_CandlestickPatterns/1 as candlePatterns
```
### Basic Usage Example
```pinescript
//@version=6
indicator("Candlestick Pattern Detector", overlay=true)
import Quant2Alpha/Q2A_CandlestickPatterns/1 as cp
// Calculate candle properties
= cp.calculateCandleProperties(open, close, high, low, ta.ema(close - open, 14), 5.0, 10.0, 10.0)
// Define trend
upTrend = close > ta.sma(close, 50)
downTrend = close < ta.sma(close, 50)
// Detect patterns
= cp.detectHammerBullish(smallBody, body, bodyLo, hl2, dnShadow, 2.0, hasUpShadow, downTrend)
= cp.detectShootingStarBearish(smallBody, body, bodyHi, hl2, upShadow, 2.0, hasDnShadow, upTrend)
// Visualize
if hammerDetected
label.new(bar_index, low, hammerName, style=label.style_label_up, color=color.green, textcolor=color.white, size=size.small, tooltip=hammerDesc)
if shootingStarDetected
label.new(bar_index, high, shootingStarName, style=label.style_label_down, color=color.red, textcolor=color.white, size=size.small, tooltip=shootingStarDesc)
```
## 📚 Library Structure
### Core Function
#### `calculateCandleProperties()`
Calculates essential candlestick properties for pattern detection.
**Parameters:**
- `p_open`, `p_close`, `p_high`, `p_low` - OHLC prices
- `bodyAvg` - Average body size (e.g., EMA of body sizes)
- `shadowPercent` - Minimum shadow size as % of body (typically 5.0)
- `shadowEqualsPercent` - Tolerance for equal shadows (typically 10.0)
- `dojiBodyPercent` - Max body size as % of range for doji (typically 10.0)
**Returns:** 17 properties including body dimensions, shadows, and candle characteristics
## 📊 Available Patterns
### Single Candle Patterns (13 patterns)
#### Bullish (5)
| Pattern | Function | Description |
| --------------------- | -------------------------------- | ----------------------------------------------------------- |
| **Hammer** | `detectHammerBullish()` | Small body at top, long lower shadow, forms in downtrend |
| **Inverted Hammer** | `detectInvertedHammerBullish()` | Small body at bottom, long upper shadow, forms in downtrend |
| **Marubozu White** | `detectMarubozuWhiteBullish()` | Long green body with little to no shadows |
| **Long Lower Shadow** | `detectLongLowerShadowBullish()` | Lower shadow is 75%+ of total range |
| **Dragonfly Doji** | `detectDragonflyDojiBullish()` | Doji with long lower shadow, no upper shadow |
#### Bearish (5)
| Pattern | Function | Description |
| --------------------- | -------------------------------- | --------------------------------------------------------- |
| **Hanging Man** | `detectHangingManBearish()` | Small body at top, long lower shadow, forms in uptrend |
| **Shooting Star** | `detectShootingStarBearish()` | Small body at bottom, long upper shadow, forms in uptrend |
| **Marubozu Black** | `detectMarubozuBlackBearish()` | Long red body with little to no shadows |
| **Long Upper Shadow** | `detectLongUpperShadowBearish()` | Upper shadow is 75%+ of total range |
| **Gravestone Doji** | `detectGravestoneDojiBearish()` | Doji with long upper shadow, no lower shadow |
#### Neutral (3)
| Pattern | Function | Description |
| ---------------------- | -------------------------- | --------------------------------------------- |
| **Doji** | `detectDoji()` | Open equals close, indicates indecision |
| **Spinning Top White** | `detectSpinningTopWhite()` | Small green body with long shadows both sides |
| **Spinning Top Black** | `detectSpinningTopBlack()` | Small red body with long shadows both sides |
### Two Candle Patterns (15 patterns)
#### Bullish (7)
| Pattern | Function | Description |
| ------------------------ | ------------------------------ | ------------------------------------------------------ |
| **Rising Window** | `detectRisingWindowBullish()` | Gap up between two candles in uptrend |
| **Tweezer Bottom** | `detectTweezerBottomBullish()` | Two candles with identical lows in downtrend |
| **Piercing** | `detectPiercingBullish()` | Green candle closes above midpoint of prior red candle |
| **Doji Star Bullish** | `detectDojiStarBullish()` | Doji gaps down after red candle in downtrend |
| **Engulfing Bullish** | `detectEngulfingBullish()` | Large green candle engulfs prior small red candle |
| **Harami Bullish** | `detectHaramiBullish()` | Small green candle contained in prior large red candle |
| **Harami Cross Bullish** | `detectHaramiCrossBullish()` | Doji contained in prior large red candle |
#### Bearish (8)
| Pattern | Function | Description |
| ------------------------ | ------------------------------- | ------------------------------------------------------ |
| **On Neck** | `detectOnNeckBearish()` | Small green closes near prior red candle's low |
| **Falling Window** | `detectFallingWindowBearish()` | Gap down between two candles in downtrend |
| **Tweezer Top** | `detectTweezerTopBearish()` | Two candles with identical highs in uptrend |
| **Dark Cloud Cover** | `detectDarkCloudCoverBearish()` | Red candle closes below midpoint of prior green candle |
| **Doji Star Bearish** | `detectDojiStarBearish()` | Doji gaps up after green candle in uptrend |
| **Engulfing Bearish** | `detectEngulfingBearish()` | Large red candle engulfs prior small green candle |
| **Harami Bearish** | `detectHaramiBearish()` | Small red candle contained in prior large green candle |
| **Harami Cross Bearish** | `detectHaramiCrossBearish()` | Doji contained in prior large green candle |
### Three Candle Patterns (14 patterns)
#### Bullish (7)
| Pattern | Function | Description |
| -------------------------- | ----------------------------------- | ------------------------------------------------ |
| **Upside Tasuki Gap** | `detectUpsideTasukiGapBullish()` | Three candles with gap that fails to close |
| **Morning Doji Star** | `detectMorningDojiStarBullish()` | Red, gapped doji, green - stronger morning star |
| **Morning Star** | `detectMorningStarBullish()` | Red, small middle, green - classic reversal |
| **Three White Soldiers** | `detectThreeWhiteSoldiersBullish()` | Three consecutive long green candles |
| **Abandoned Baby Bullish** | `detectAbandonedBabyBullish()` | Doji gaps away from both surrounding candles |
| **Tri-Star Bullish** | `detectTriStarBullish()` | Three dojis with gaps between them |
| **Kicking Bullish** | `detectKickingBullish()` | Black marubozu followed by gapped white marubozu |
#### Bearish (7)
| Pattern | Function | Description |
| -------------------------- | ---------------------------------- | ------------------------------------------------ |
| **Downside Tasuki Gap** | `detectDownsideTasukiGapBearish()` | Three candles with gap that fails to close |
| **Evening Doji Star** | `detectEveningDojiStarBearish()` | Green, gapped doji, red - stronger evening star |
| **Evening Star** | `detectEveningStarBearish()` | Green, small middle, red - classic reversal |
| **Three Black Crows** | `detectThreeBlackCrowsBearish()` | Three consecutive long red candles |
| **Abandoned Baby Bearish** | `detectAbandonedBabyBearish()` | Doji gaps away from both surrounding candles |
| **Tri-Star Bearish** | `detectTriStarBearish()` | Three dojis with gaps between them |
| **Kicking Bearish** | `detectKickingBearish()` | White marubozu followed by gapped black marubozu |
### Five Candle Patterns (2 patterns)
#### Bullish (1)
| Pattern | Function | Description |
| ------------------------ | ----------------------------------- | ----------------------------------------------------- |
| **Rising Three Methods** | `detectRisingThreeMethodsBullish()` | Long green, three small reds inside range, long green |
#### Bearish (1)
| Pattern | Function | Description |
| ------------------------- | ------------------------------------ | --------------------------------------------------- |
| **Falling Three Methods** | `detectFallingThreeMethodsBearish()` | Long red, three small greens inside range, long red |
## 💡 Advanced Usage Examples
### Multi-Pattern Strategy
```pinescript
//@version=6
strategy("Multi-Pattern Strategy", overlay=true)
import Quant2Alpha/Q2A_CandlestickPatterns/1 as cp
// Setup
bodyAvg = ta.ema(math.abs(close - open), 14)
= cp.calculateCandleProperties(open, close, high, low, bodyAvg, 5.0, 10.0, 10.0)
// Trends
sma50 = ta.sma(close, 50)
sma200 = ta.sma(close, 200)
upTrend = close > sma50 and sma50 > sma200
downTrend = close < sma50 and sma50 < sma200
// Detect bullish patterns
= cp.detectHammerBullish(smallBody, body, bodyLo, hl2, dnShadow, 2.0, hasUpShadow, downTrend)
= cp.detectEngulfingBullish(downTrend, whiteBody, longBody, blackBody, smallBody, close, open)
= cp.detectMorningStarBullish(longBody, smallBody, downTrend, blackBody, whiteBody, bodyHi, bodyLo, bodyMiddle)
// Detect bearish patterns
= cp.detectShootingStarBearish(smallBody, body, bodyHi, hl2, upShadow, 2.0, hasDnShadow, upTrend)
= cp.detectDarkCloudCoverBearish(upTrend, whiteBody, longBody, blackBody, open, high, close, bodyMiddle)
= cp.detectEveningStarBearish(longBody, smallBody, upTrend, whiteBody, blackBody, bodyLo, bodyHi, bodyMiddle)
// Entry signals
bullishSignal = hammer or engulfing or morningStar
bearishSignal = shootingStar or darkCloud or eveningStar
// Execute trades
if bullishSignal and strategy.position_size == 0
strategy.entry("Long", strategy.long)
if bearishSignal and strategy.position_size > 0
strategy.close("Long")
```
### Pattern Scanner Indicator
```pinescript
//@version=6
indicator("Pattern Scanner", overlay=true)
import Quant2Alpha/Q2A_CandlestickPatterns/1 as cp
// Configuration
showBullish = input.bool(true, "Show Bullish Patterns")
showBearish = input.bool(true, "Show Bearish Patterns")
showNeutral = input.bool(false, "Show Neutral Patterns")
// Calculate properties
bodyAvg = ta.ema(math.abs(close - open), 14)
= cp.calculateCandleProperties(open, close, high, low, bodyAvg, 5.0, 10.0, 10.0)
// Trends
upTrend = close > ta.sma(close, 50)
downTrend = close < ta.sma(close, 50)
// Scan for all patterns and display
// (Add pattern detection and visualization logic here)
```
## 🔧 Configuration Best Practices
### Recommended Parameter Values
| Parameter | Typical Value | Description |
| ---------------------- | ----------------------------- | ------------------------------- |
| `bodyAvg` | `ta.ema(abs(close-open), 14)` | 14-period EMA of body size |
| `shadowPercent` | `5.0` | 5% of body for shadow detection |
| `shadowEqualsPercent` | `10.0` | 10% tolerance for equal shadows |
| `dojiBodyPercent` | `10.0` | Body ≤10% of range = doji |
| `factor` (hammer/star) | `2.0` | Shadow should be 2x body size |
### Trend Definition
```pinescript
// Simple SMA crossover
upTrend = close > ta.sma(close, 50)
downTrend = close < ta.sma(close, 50)
// Double SMA confirmation
upTrend = close > ta.sma(close, 50) and ta.sma(close, 50) > ta.sma(close, 200)
downTrend = close < ta.sma(close, 50) and ta.sma(close, 50) < ta.sma(close, 200)
// EMA trend
upTrend = close > ta.ema(close, 20)
downTrend = close < ta.ema(close, 20)
```
## 📖 Function Return Format
All pattern detection functions return a tuple with 4 elements:
```pinescript
```
- **detected** (bool) - `true` if pattern is found, `false` otherwise
- **name** (string) - Pattern name (e.g., "Hammer", "Shooting Star")
- **type** (string) - "Bullish", "Bearish", or "Neutral"
- **description** (string) - Detailed explanation of the pattern
### Example
```pinescript
= cp.detectHammerBullish(...)
if isHammer
log.info("Pattern: " + patternName) // "Hammer"
log.info("Type: " + patternType) // "Bullish"
log.info("Info: " + patternInfo) // Full description
```
## 🎯 Pattern Reliability
### High Reliability (Strong Signals)
- Engulfing patterns (Bullish/Bearish)
- Morning/Evening Star formations
- Three White Soldiers / Three Black Crows
- Hammer / Shooting Star (with confirmation)
### Medium Reliability (Use with Confirmation)
- Harami patterns
- Piercing / Dark Cloud Cover
- Tweezer Top/Bottom
- Doji Star patterns
### Context-Dependent (Require Trend Analysis)
- Window patterns (gaps)
- Kicking patterns
- Tasuki Gap patterns
- Three Methods patterns
## 📝 Notes
- **Trend Context is Critical**: Most reversal patterns require proper trend identification for accuracy
- **Confirmation Recommended**: Wait for next candle confirmation before taking action
- **Volume Matters**: Consider volume alongside patterns (not included in this library)
- **Multiple Timeframes**: Check patterns across multiple timeframes for stronger signals
- **Risk Management**: Always use stop losses regardless of pattern strength
## 🔗 Integration with Other Indicators
This library works well with:
- Moving averages (trend confirmation)
- RSI/Stochastic (overbought/oversold)
- Volume indicators (confirmation)
- Support/Resistance levels (context)
- ATR (position sizing)
## 📄 License
This Pine Script® code is subject to the terms of the Mozilla Public License 2.0 at mozilla.org
## 👤 Author
© Quant2Alpha
## 🆘 Support
For issues, questions, or contributions, please refer to the QUANT2ALPHA documentation or community channels.
---
**Version:** 1.0
**Pine Script Version:** 6
**Last Updated:** 2025

Multi-Tool VWAP + EMAs (Multi-Timeframe) + Key LevelsDescription
This indicator combines several commonly used technical analysis tools into a single script, especially useful for traders using the free version of TradingView or anyone looking to reduce the number of indicators on their chart.
The goal is to provide clear visual references for trend, structure, and key levels—without generating buy/sell signals or automated trading functions.
Included Features
1. VWAP (session-anchored)
Source: HLC3
Purple line, thickness 2
Useful as a reference for daily institutional average price.
2. EMAs of the current timeframe
EMA 200 (red, thickness 3)
EMA 9 (green, thickness 1)
These EMAs help visualize long-term trend and short-term momentum.
3. Dynamic EMAs (MTF – Multi-Timeframe)
The indicator displays the 200 EMA from higher timeframes as dynamic horizontal levels:
5 minutes
15 minutes
30 minutes
1 hour
4 hours
1 day
Each level includes a descriptive label such as “15 min EMA 200”.
These EMAs serve as reference points for potential support/resistance areas coming from higher timeframes.
4. Automatic Key Levels
The indicator plots several important price levels:
Previous day:
PDH (Previous Day High)
PDL (Previous Day Low)
Previous Day 50% Fibonacci level
Pre-market (04:00–09:30 exchange time):
PMH (Pre-Market High)
PML (Pre-Market Low)
Current session:
Open (session opening price)
Previous Close (prior day’s closing price)
Purpose and Scope
This script is designed to provide basic visual reference points to support discretionary analysis.
It does not generate signals or trading suggestions, and it is not intended to predict future price movements.
How to Use It
Enable or disable each block in the Inputs section according to your analysis style.
Observe how the levels, EMAs, and VWAP interact with market structure.
Use it as a visual complement to your personal technical analysis.
Limitations
This indicator is not a trading system and does not guarantee results.
It does not include alerts, backtesting, or entry/exit logic.
Some values (such as PMH/PML) depend on the symbol’s exchange trading hours.
Credits
Designed as an educational and analytical tool for traders seeking to simplify their charts without losing key information.

Penny Stock Golden Cross ScannerPenny Stock Golden Cross Scanner
Scan and track potential breakout opportunities in penny stocks with this Golden Cross Scanner. Designed for traders looking at low-priced, high-volume stocks, this indicator identifies bullish setups using 50, 100, and 200-period moving averages.
Key Features:
✅ Monitors up to 10 user-defined tickers.
✅ Filters penny stocks by maximum price and minimum volume.
✅ Detects proximity to 100 MA and 200 MA for potential golden cross or support/resistance signals.
✅ Assigns signal tiers for each stock (Tier 1 🔥, Tier 2 ⚡, Tier 3 📊) based on price action relative to moving averages.
✅ Customizable scanner table with position options on the chart.
✅ Real-time plotting of 50, 100, and 200 moving averages for context.
✅ Option to display only stocks currently generating signals.

THF Scalp & Trend + FVG [English]This indicator is a comprehensive "All-In-One" trading suite designed for Scalpers and Day Traders who look for confluence between Trend Following indicators and Price Action (Fair Value Gaps).
It combines two powerful concepts into a single chart overlay:
1. Moving Average Crossovers & Trend Filtering (THF Logic).
2. Fair Value Gaps (FVG) detection for entry/exit targets.
### 🛠️ Key Features:
**1. Trend & Scalp Signals:**
- **Scalp Signals:** Based on fast EMA crossovers (default 7/21). These signals can be filtered by a long-term SMA (200) to ensure you are trading with the major trend.
- **Trend Signals:** Identifies stronger trend shifts using EMA 21 crossing SMA 50.
- **Major Crosses:** Automatically highlights Golden Cross (SMA 50 > 200) and Death Cross events.
**2. Price Action (FVG - Fair Value Gaps):**
- Integrated **LuxAlgo's Fair Value Gap** logic to identify imbalances in the market.
- Displays Bullish/Bearish zones which act as magnets for price or support/resistance levels.
- Includes a Dashboard to track mitigated vs. unmitigated zones.
**3. Momentum & Volume Confluence:**
- **Visual Volume:** Candles are colored based on volume relative to the average (Volume SMA).
- **RSI & MACD Signals:** Optional overlays to spot overbought/oversold conditions or momentum shifts directly on the chart.
### 🎯 How to Use:
- **For Scalping:** Wait for a "SCALP BUY" signal while the price is above the SMA 200 (Trend Filter). Use the FVG boxes as potential Take Profit targets.
- **For Trend Trading:** Look for the "Trend BUY" label and confirm with the Golden Cross.
- **Stop Loss:** Can be placed below the recent swing low or below the EMA 50.
----------------------------------------------------------------
**CREDITS & ATTRIBUTION:**
This script is a mashup of custom trend logic and open-source community codes.
- **Fair Value Gap:** Full credit goes to **LuxAlgo** for the FVG detection algorithm and dashboard logic. This script utilizes their open-source calculation methods to enhance the trend strategy.
- **Trend Logic:** Based on classic Moving Average crossover strategies tailored for scalping.
*Disclaimer: This tool is for educational purposes only. Always manage your risk.*

AlphaRank MA Lens – Multi-Timeframe Moving Average MapAlphaRank MA Lens – Multi-Timeframe Moving Average Map
AlphaRank MA Lens is a clean, open-source moving-average overlay that turns price action into an easy-to-read trend map. It focuses on structure and context only — no signals, no backtest, no hype — just a clear view of where price sits relative to key moving averages.
The script plots the 10 / 20 / 50 / 100 / 150 / 200 / 730 moving averages with full color control and a single “MA Type” switch, so you can flip the whole stack between SMA and EMA in one click. Instead of loading multiple separate MA indicators, this puts the full trend stack in one tool.
An optional background highlight lets you choose a reference MA (for example the 200 MA) and softly shade the chart:
Green when price is above that MA
Red when price is below it
This makes trend regime changes easy to see at a glance.
How traders typically use it (education only):
10/20/50 MAs → short-term trend and momentum.
100/150/200/730 MAs → bigger structural trend and “where price lives” in the long-term range.
Many traders consider conditions healthier when price and the short MAs are stacked above the longer MAs, and weaker when price trades below them.
Follow my work: AlphaRank
This script is for educational and analytical purposes only and does not provide trading advice or performance promises. Always combine it with your own judgment, testing, and risk management.

Adaptive Trend Navigator [ATH Filter & Risk Engine]Description:
This strategy implements a systematic Trend Following approach designed to capture major moves while actively protecting capital during severe bear markets. It combines a classic Moving Average "Fan" logic with two advanced risk management layers: a 4-Stage Dynamic Stop Loss and a macro-economic "Circuit Breaker" filter.
Core Concepts:
1. Trend Identification (Entry Logic) The script uses a cascade of Simple Moving Averages (SMA 25, 50, 100, 200) to identify the maturity of a trend.
Entries are triggered by specific crossovers (e.g., SMA 25 crossing SMA 50) or by breaking above the previous trade's high ("High-Water Mark" Re-Entry).
2. The "Circuit Breaker" (Crash Protection) To prevent trading during historical market collapses (like 2000 or 2008), the strategy monitors the Nasdaq 100 (QQQ) as a global benchmark:
Normal Regime: If the market is within 20% of its All-Time High, the strategy operates normally.
Crisis Regime: If the QQQ falls more than 20% from its ATH, the "Circuit Breaker" activates (Visualized by a Red Background).
Recovery Rule: In a Crisis Regime, new long positions are blocked unless the QQQ reclaims its SMA 200. This filters out "bull traps" in secular bear markets.
3. 4-Stage Risk Engine (Exit Logic) Once in a trade, the risk management adapts to the position's performance:
Stage 1: Fixed initial Stop Loss (default 10%) for breathing room.
Stage 2: Moves to Break-Even area once the price rises 12%.
Stage 3: Tightens to a trailing stop (8%) after 25% profit.
Stage 4: Maximizes gains with a tight trailing stop (5%) during parabolic moves (>40% profit).
Visual Guide:
SMAs: 25/50/100/200 period lines for trend visualization.
Red Background: Indicates the "Crisis Regime" where trading is halted due to broad market weakness.
Blue Background: Indicates a "Recovery Phase" (Crisis is active, but market is above SMA 200).
Red Line: Shows the dynamic Stop Loss level for active positions.
Settings: All parameters (SMA lengths, Drawdown threshold, Risk Stages) are fully customizable. The QQQ benchmark ticker can also be changed to SPY or other indices depending on the asset class traded.

Dynamic SMA Trend System [Multi-Stage Risk Engine]Description:
This script implements a robust Trend Following strategy based on a multiple Simple Moving Average (SMA) crossover logic (25, 50, 100, 200). What sets this strategy apart is its advanced "4-Stage Risk Engine" and a smart "High-Water Mark" Re-Entry system, designed to protect profits during parabolic moves while filtering out chop during sideways markets.
How it works:
The strategy operates on three core pillars: Trend Identification, Dynamic Risk Management, and Momentum Re-Entry.
1. Entry Logic (Trend Identification) The script looks for crossovers at different trend stages to capture early reversals as well as established trends:
Short-Term: SMA 25 crosses over SMA 50.
Mid-Term: SMA 50 crosses over SMA 100.
Macro-Trend: SMA 100 crosses over SMA 200.
2. The 4-Stage Risk Engine (Dynamic Stop Loss) Instead of a static Stop Loss, this strategy uses a progressive system that adapts as the price increases:
Stage 1 (Protection): Starts with a fixed Stop Loss (default -10%) to give the trade room to breathe.
Stage 2 (Break-Even): Once the price rises by 12%, the Stop is moved to trailing mode (10% distance), effectively securing a near break-even state.
Stage 3 (Profit Locking): At 25% profit, the trailing stop tightens to 8% to lock in gains.
Stage 4 (Parabolic Mode): At 40% profit, the trailing stop tightens further to 5% to capture the peak of parabolic moves.
3. Dual Exit Mechanism The strategy exits a position if EITHER of the following happens:
Stop Loss Hit: Price falls below the dynamic red line (Risk Engine).
Dead Cross: The trend structure breaks (e.g., SMA 25 crosses under SMA 50), signaling a momentum loss even if the Stop Loss wasn't hit.
4. "High-Water Mark" Re-Entry To avoid "whipsaws" in choppy markets, the script does not re-enter immediately after a stop-out.
It marks the highest price of the previous trade (Green Dotted Line).
A Re-Entry only occurs if the price breaks above this previous high (showing renewed strength) AND the long-term trend is bullish (Price > SMA 200).
Visuals:
SMAs: 25 (Yellow), 50 (Orange), 100 (Blue), 200 (White).
Red Line: Visualizes the dynamic Stop Loss level.
Green Dots: Visualizes the target price needed for a valid re-entry.
Settings: All parameters (SMA lengths, Stop Loss percentages, Staging triggers) are fully customizable in the settings menu to fit different assets (Crypto, Stocks, Forex) and timeframes.

RSI adaptive zones [AdaptiveRSI]This script introduces a unified mathematical framework that auto-scales oversold/overbought and support/resistance zones for any period length. It also adds true RSI candles for spotting intrabar signals.
Built on the Logit RSI foundation, this indicator converts RSI into a statistically normalized space, allowing all RSI lengths to share the same mathematical footing.
What was once based on experience and observation is now grounded in math.
✦ ✦ ✦ ✦ ✦
💡 Example Use Cases
RSI(14): Classic overbought/oversold signals + divergence
Support in an uptrend using RSI(14)
Range breakouts using RSI(21)
Short-term pullbacks using RSI(5)
✦ ✦ ✦ ✦ ✦
THE PAST: RSI Interpretation Required Multiple Rulebooks
Over decades, RSI practitioners discovered that RSI behaves differently depending on trend and lookback length:
• In uptrends, RSI tends to hold higher support zones (40–50)
• In downtrends, RSI tends to resist below 50–60
• Short RSIs (e.g., RSI(2)) require far more extreme threshold values
• Longer RSIs cluster near the center and rarely reach 70/30
These observations were correct — but lacked a unifying mathematical explanation.
✦ ✦ ✦ ✦ ✦
THE PRESENT: One Framework Handles RSI(2) to RSI(200)
Instead of using fixed thresholds (70/30, 90/10, etc.), this indicator maps RSI into a normalized statistical space using:
• The Logit transformation to remove 0–100 scale distortion
• A universal scaling based on 2/√(n−1) scaling factor to equalize distribution shapes
As a result, RSI values become directly comparable across all lookback periods.
✦ ✦ ✦ ✦ ✦
💡 How the Adaptive Zones Are Calculated
The adaptive framework defines RSI zones as statistical regimes derived from the Logit-transformed RSI .
Each boundary corresponds to a standard deviation (σ) threshold, scaled by 2/√(n−1), making RSI distributions comparable across periods.
This structure was inspired by Nassim Nicholas Taleb’s body–shoulders–tails regime model:
Body (±0.66σ) — consolidation / equilibrium
Shoulders (±1σ to ±2.14σ) — trending region
Tails (outside of ±2.14σ) — rare, high-volatility behavior
Transitions between these regimes are defined by the derivatives of the position (CDF) function :
• ±1σ → shift from consolidation to trend
• ±√3σ → shift from trend to exhaustion
Adaptive Zone Summary
Consolidation: −0.66σ to +0.66σ
Support/Resistance: ±0.66σ to ±1σ
Uptrend/Downtrend: ±1σ to ±√3σ
Overbought/Oversold: ±√3σ to ±2.14σ
Tails: outside of ±2.14σ
✦ ✦ ✦ ✦ ✦
📌 Inverse Transformation: From σ-Space Back to RSI
A final step is required to return these statistically normalized boundaries back into the familiar 0–100 RSI scale. Because the Logit transform maps RSI into an unbounded real-number domain, the inverse operation uses the hyperbolic tangent function to compress σ-space back into the bounded RSI range.
RSI(n) = 50 + 50 · tanh(z / √(n − 1))
The result is a smooth, mathematically consistent conversion where the same statistical thresholds maintain identical meaning across all RSI lengths, while still expressing themselves as intuitive RSI values traders already understand.
✦ ✦ ✦ ✦ ✦
Key Features
Mathematically derived adaptive zones for any RSI period
Support/resistance zone identification for trend-aligned reversals
Optional OHLC RSI bars/candles for intrabar zone interactions
Fully customizable zone visibility and colors
Statistically consistent interpretation across all markets and timeframes
Inputs
RSI Length — core parameter controlling zone scaling
RSI Display : Line / Bar / Candle visualization modes
✦ ✦ ✦ ✦ ✦
💡 How to Use
This indicator is a framework , not a binary signal generator.
Start by defining the question you want answered, e.g.:
• Where is the breakout?
• Is price overextended or still trending?
• Is the correction ending, or is trend reversing?
Then:
Choose the RSI length that matches your timeframe
Observe which adaptive zone price is interacting with
Interpret market behavior accordingly
Example: Long-Term Trend Assesment using RSI(200)
A trader may ask: "Is this a long term top?"
Unlikely, because RSI(200) holds above Resistance zone , therefore the trend remains strong.
✦ ✦ ✦ ✦ ✦
👉 Practical tip:
If you used to overlay weekly RSI(14) on a daily chart (getting a line that waits 5 sessions to recalculate), you can now read the same long-horizon state continuously : set RSI(70) on the daily chart (~14 weeks × 5 days/week = 70 days) and let the adaptive zones update every bar .
Note: It won’t be numerically identical to the weekly RSI due to lookback period used, but it tracks the same regime on a standardized scale with bar-by-bar updates.
✦ ✦ ✦ ✦ ✦
Note: This framework describes statistical structure, not prediction. Use as part of a complete trading approach. Past behavior does not guarantee future outcomes.
framework ≠ guaranteed signal
---
Attribution & License
This indicator incorporates:
• Logit transformation of RSI
• Variance scaling using 2/√(n−1)
• Zone placement derived from Taleb’s body–shoulders–tails regime model and CDF derivatives
• Inverse TANH(z) transform for mapping z-scores back into bounded RSI space
Released under CC BY-NC-SA 4.0 — free for non-commercial use with credit.
© AdaptiveRSI
