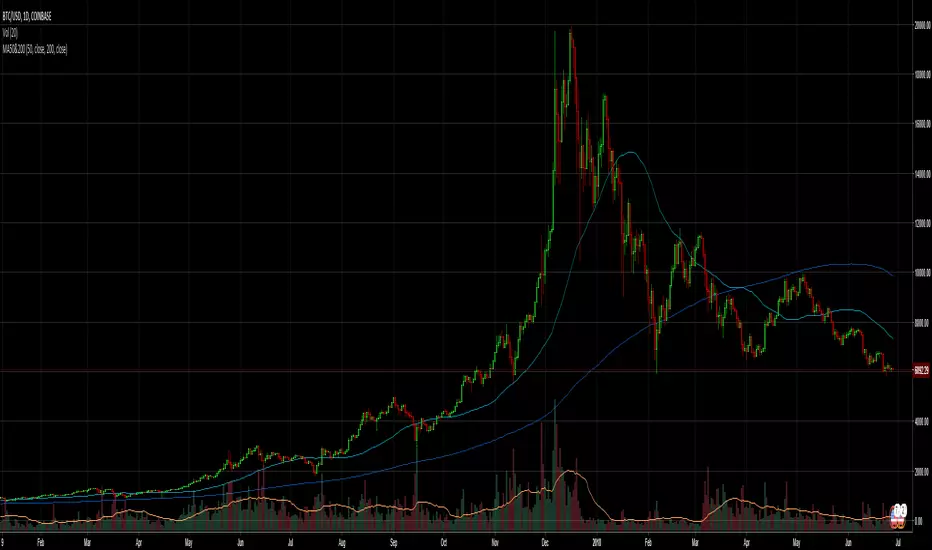
Moving Averages 50 & 200Moving Average Indicator for trading 50MA and 200MA crossovers (golden cross and death cross).
A golden cross is considered a bullish sign; it occurs when the 50-day moving average rises above 200-day moving average. A death cross is considered a bearish sign; it occurs when the 50-day moving average drops below 200-day moving average.
Search in scripts for "200元+股票大盘"
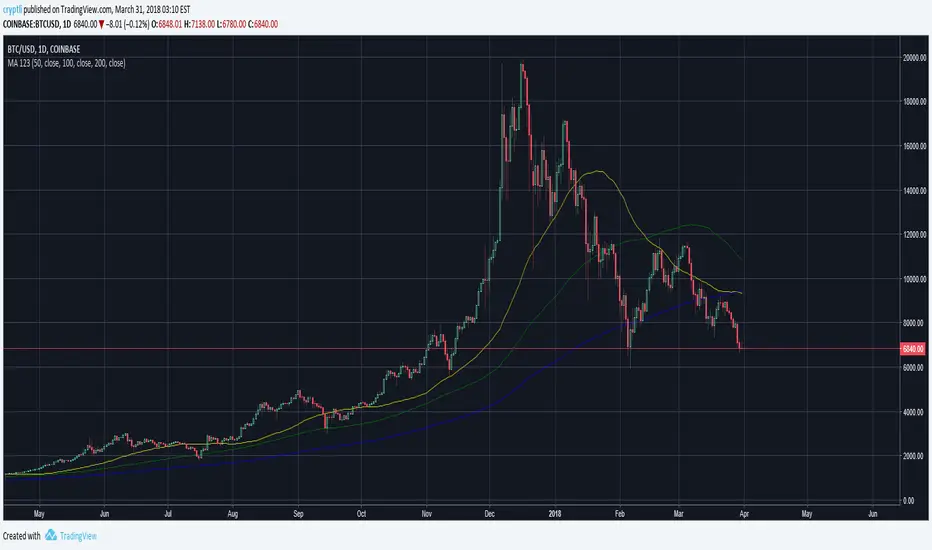
Moving Averages MA 50,100 and 200Just a simple collection of 3 most used Moving Averages 50,100 and 200
50=Yellow
100=Green
200=Blue
Moving Average 50,100 and 200Just a simple collection of 3 most used Moving Averages 50,100 and 200
50=Yellow
100=Green
200=Blue
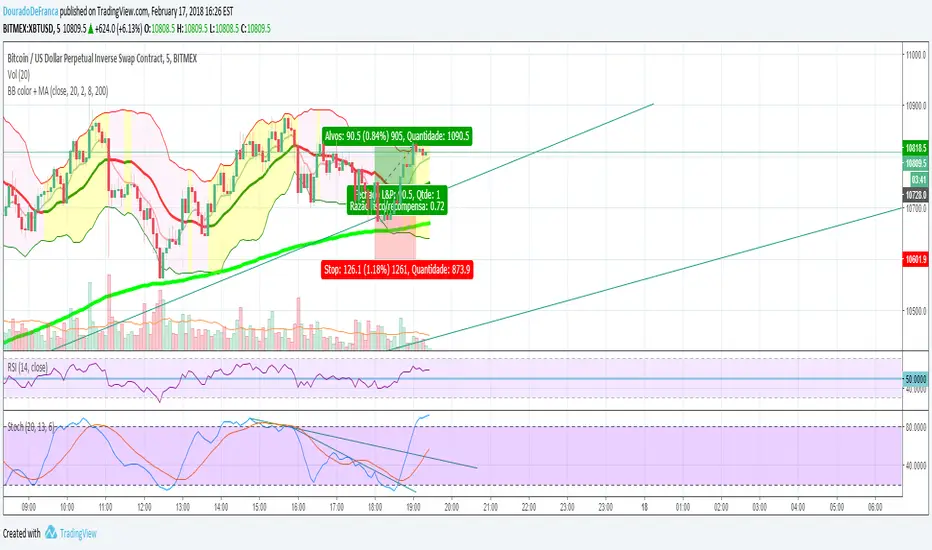
BB color 20+ EMA 8 and 200Bollinger e Emas.
Enquanto acima da EMA 200 apenas longs
Abaixo apenas shorts
O cruzamento da EMA 8 com grande volume indica reversão de tendencia
Posições abertas com as bandas de bollinger junto a EMA 200
Moving Averages (10, 21, 50, 200)Moving Averages including 10, 21, 50 and 200 period. Intended mainly for use on a daily chart, but will work for any period.

Institutional Moving Averages (50/100/200)A streamlined Moving Average suite designed for institutional-style trend analysis. This indicator plots the three most critical trend baselines used by traders and funds:
50 MA (Blue): Short-term trend and momentum.
100 MA (Orange): Medium-term support/resistance.
200 MA (Purple): Long-term trend definition (Bull/Bear line).
Features:
Fully Customizable: Switch between SMA, EMA, WMA, RMA, or HMA.
Clean Visuals: Optimized colors for dark and light themes.
Native Performance: Uses standard TradingView plotting for maximum speed and compatibility with the "Style" tab visibility settings.

EMA 9/20/50/100/200This script plots the five most commonly used Exponential Moving Averages (EMAs): 9, 20, 50, 100, and 200. These EMAs help traders quickly identify short-term momentum, medium-term trends, and long-term market direction.
It is useful for:
Trend identification
Momentum confirmation
Pullback entries
Reversal detection
Multi-timeframe confluence trading
What’s Included
EMA 9 → short-term momentum
EMA 20 → near-term trend guide
EMA 50 → medium-term trend
EMA 100 → broad trend structure
EMA 200 → long-term direction
Each EMA is color-coded for clarity, making it easy to read and visually track trend shifts.
How to Use
When shorter EMAs cross above longer EMAs → bullish trend strengthening
When shorter EMAs cross below longer EMAs → bearish trend strengthening
Wide spacing between EMAs indicates a strong trend
Compression or clustering often signals potential reversals or breakout conditions
This indicator is simple, clean, and effective for all timeframes and asset classes.

6x EMA Set (5/20/50/100/200/300)This Pine Script indicator utilizes six Exponential Moving Averages (5, 20, 50, 100, 200, and 300 EMA) to visualize market trends and support/resistance levels across multiple timeframes on a single chart. The code is highly customizable, allowing the user to input and adjust the period length and color for each EMA directly within the indicator settings. The calculation engine uses Pine Script v5's optimized ta.ema() function to compute each average based on the closing price, with the EMA formula naturally weighting recent price action more heavily. This multi-layered structure enables the trader to quickly compare short-term momentum (Fast EMAs) against long-term structural trends (Slow EMAs).

50, 100 & 200 Week MA (SMA/EMA Switch)Clean, multi-timeframe weekly moving average indicator displaying the classic 50, 100, and 200-week MAs directly on any chart timeframe.
Features:
True weekly calculations using request.security (accurate, no daily approximation)
Switch between SMA and EMA with one click
Individually toggle each MA (50w orange, 100w purple, 200w blue)
Perfect for long-term trend analysis, golden/death crosses, and institutional-level support/resistance
Ideal for swing traders, investors, and anyone tracking major market cycles. Lightweight and repaints-free.

10/20 EMA 50/100/200 SMA — by mijoomoCreated by mijoomo.
This indicator combines EMA 10 & EMA 20 with SMA 50/100/200 in one clean package.
Each moving average is toggleable, fully labeled, and alert-compatible.
Designed for traders who want a simple and effective multi-MA trend tool.

10/20 EMA 50/100/200 SMA — by mijoomoCreated by mijoomo.
This indicator combines EMA 10 & EMA 20 with SMA 50/100/200 in one clean package.
Each moving average is toggleable, fully labeled, and alert-compatible.
Designed for traders who want a simple and effective multi-MA trend tool.

Consolidation Breakout PRO — Clean Boxes + 200 EMA Trend Filter High-probability range breakout detector that draws perfect, always-visible consolidation boxes and only alerts when price breaks out with strong volume and (optionally) in the direction of the prevailing trend.
Features
Automatically draws and extends clean consolidation boxes in real time
Boxes stop extending the moment the breakout occurs — no more “ghost” lines
Optional but powerful 200 EMA trend filter (dramatically reduces false breakouts)
Stronger volume confirmation (default 1.8× the 20-period average, fully adjustable)
Auto-deletes old boxes so your chart stays perfectly clean even after hundreds of signals
Clear “BREAKOUT ↑” and “BREAKDOWN ↓” labels + ready-to-use alerts
Works on any market and any timeframe (best on 1H, 4H, Daily)
How to trade it (edge > 65 % when used correctly)
Wait for the labeled breakout candle to close
Enter on pullback/retest of the box edge (or on strong close + retest)
Stop-loss just outside the opposite side of the box
Take-profit: minimum 1:2, ideally measured move (box height added/subtracted) or trailing with the 20 EMA
This is the cleanest and most professional public consolidation breakout tool available in 2025 — no repainting, no lag, no chart clutter.
Created and continuously improved with love for the TradingView community.


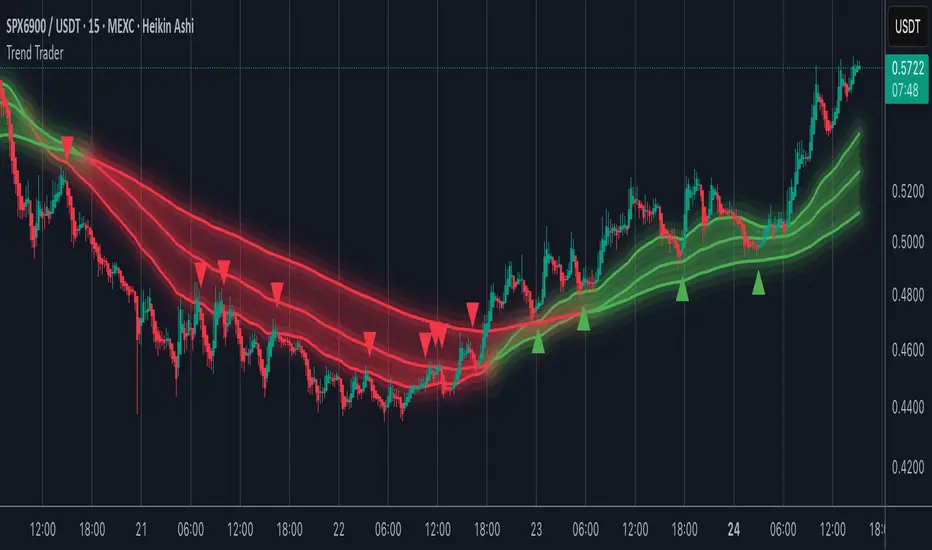
Trend TraderMost trend indicators don’t offer continuation signals or accurate bounce points, so I created this indicator that uses one of the most common trading levels (EMAs). This indicator uses the 50, 100, and 200 EMAs along with WaveTrend signals to trade trends. Buy Signals are filtered so that they only show up when the 100 EMA is above the 200. And Inverse for Sell Signals.
This indicator works well with both Stocks and Crypto. Default settings work best on 15 min, 1H, 2H, and 4H.
(Chart examples are using Heikin Ashi Candles, on Log Scale.)
*Buy and Sell Signals do not repaint.
Settings:
- Ability to show all buy and sell signals regardless of trend.
- To change the sensitivity of the buy and sell signals, change the “Average Length”
- (The lower the number the more sensitive, the higher the number the less they pop up)
- Ability to change EMA Lengths
imgur.com
Simple Moving Averages (5, 10, 20, 60, 120, 200SMA for different time frames.
Covers 5, 10, 20, 60, 120, 200 sma units
MA Suite 10/50/150/200 + Legend (v6)ma 10 50 150 200 that i have made with chat gpt to help find moving avarage

Vertical Lines: 5, 20, 50, 200 Days Back - 30 minutesVerticals lines to indicate 5, 20, 50, and 200 day marks on a 30 minute chart. Used in Swing trading with multi-timeframe approach to mark the levels.
Generated using Claude.

300/200 EMA Spread HeatmapHighlights the difference between 300 and 200 EMA to indicated potential over extensions in breakout structures.

EMA 50/100/200 Trend BandsEMA Trend Bands is a clean and powerful trend-structure tool built around the classic 50/100/200 EMA stack.
It provides an intuitive, color-coded view of market conditions by identifying when the trend is bullish, bearish, or neutral based on EMA alignment.
This indicator is designed for traders who want a simple, objective trend filter without the clutter of extra signals or repainting logic.


Moving Averages: 09-21-55-200 - Multiple Times Frames v2This is a multi-timeframe 9ema, 21ema, 55ema and the 200 SMA for the 1 minute, 2minute, 5 minute and 15 minute timeframes. SO when you are on any of these time-frames it will show the EMAs and SMAs for the other levels.

EMA 8/50/200I set it up so that three EMAs are displayed within a single indicator window.
このスクリプトでは、3本のEMA(8間・50期間・200期間)を1つのインジケータ枠で表示しています。
