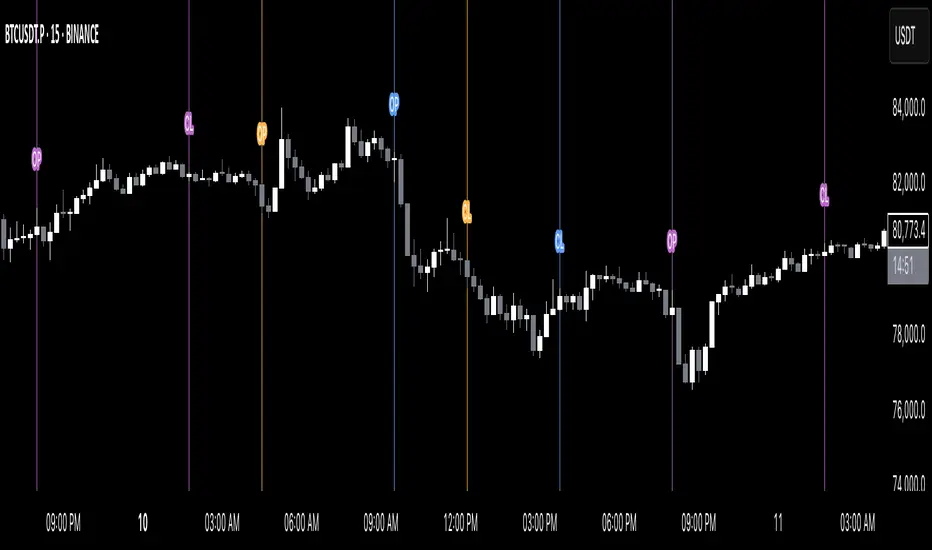
HTF 6H Visualiser for 30M - ADK - W
HTF 6H Visualiser — use on 30-minute charts
Purpose – lets 30-minute traders see the prior 6-hour candle’s range, open and close without changing time-frames.
Visual elements
Two dotted vertical lines mark the 6-hour candle’s start and an “early” finish one 30-min bar before the true close (avoids overlap).
Vertical colour: green for bullish 6 H close, red for bearish.
Dotted green horizontal at the 6 H open, red horizontal at the 6 H close – both drawn only between the two verticals.
Verticals are clipped to that candle’s exact high and low.
Data window – auto-deletes oldest guides so only ~2 trading days (8 candles) remain on the chart.
Typical uses – mean-reversion to 6 H opens/closes, quick HTF bias check, liquidity-grab targets.
Search in scripts for "30年国债收益率"
US30 Smart Money 5M/4H Strategy🧠 How It Works
✅ 1. 4H Trend Bias Detection
Uses the 4-hour chart (internally) to determine if the market is in an uptrend or downtrend.
Background turns green for bullish trend, red for bearish trend.
This helps filter trades — only take longs during uptrend, shorts during downtrend.
✅ 2. Liquidity Sweeps (Stop Hunts) on 5M
Highlights candles that break previous highs/lows and then reverse (typical of institutional stop raids).
Draws a shaded red box above sweep-high candles and green box under sweep-lows.
These indicate key reversal zones.
✅ 3. Order Block Zones
Detects bullish/bearish engulfing patterns after liquidity sweeps.
Draws a supply or demand zone box extending forward.
These zones show where institutions likely placed large orders.
✅ 4. FVG Midpoint from 30-Min Chart
Detects Fair Value Gaps (imbalances) on the 30-minute chart.
Plots a line at the midpoint of the gap (EQ level), which is often revisited for entries or rejections.
✅ 5. Buy/Sell Signals (Non-Repainting)
Buy = 4H uptrend + 5M liquidity sweep low + bullish engulfing candle.
Sell = 4H downtrend + 5M liquidity sweep high + bearish engulfing.
Prints green “BUY” or red “SELL” label on the chart — these do not repaint.
📈 How to Use It
Wait for trend bias — only take trades in the direction of the 4H trend.
Watch for liquidity sweep boxes — these hint a stop hunt just occurred.
Look for a signal label (BUY/SELL) — confirms entry criteria.
Use FVG EQ lines & Order Block zones as confluence or targets.
Take trades after NY open (9:30 AM EST) for best momentum.

First FVG Custom Time RangeFirst FVG — Opening Range Fair Value Gap Detector
Smart Money Opening Imbalance Strategy Tool
This script automatically detects and highlights the first Fair Value Gap (FVG) that forms between 9:30 and 10:00 AM Eastern Time (New York session open) — a critical period often referred to as the Opening Range. It’s designed for Smart Money traders looking to isolate early-morning inefficiencies that may influence market behavior throughout the trading day.
🔍 What This Script Does:
Automatically Detects the First FVG in the Opening Range
Scans price action between 9:30 and 10:00 AM ET and identifies the first valid bullish or bearish FVG that forms.
Only one FVG is shown per day — ensuring a clean, focused view.
Draws a Visual Zone
Once detected, the FVG zone is extended forward on the chart (customizable duration).
A labeled zone helps users track how price reacts to it throughout the session.
Optional Retest Alerts
Alerts you when price re-enters the zone — a potential reaction point used by SMC traders.
Customization Options
Set your preferred session time window
Adjust zone duration (in bars)
Customize label font size, colors, and visibility
Enable/disable alert on retest
📈 Why the First FVG Matters:
Time-Sensitive Setup: The first FVG typically forms no earlier than 9:31 AM ET and represents a potential “time distortion” or imbalance zone created by aggressive market participants during the open.
Behavioral Study: Many traders journal how price behaves around this zone each day — whether it acts as support, resistance, or gets traded through later in the session.
Predictive Value: Observing how this zone is respected or broken can provide anticipatory insight into intraday price action, rather than reactive analysis.
Great for New Traders: This opening FVG is often recommended as a starting reference point for building trade models and understanding how institutional imbalances unfold.
🚀 What Makes It Unique:
This tool doesn’t spam your chart with every FVG. It laser-focuses on a single, time-bound zone backed by institutional logic — the first presented imbalance of the day during the opening range.
Use it to:
Monitor price behavior around early inefficiencies
Plan journal entries and pattern recognition
Align intraday setups with a high-probability SMC model
Whether you’re scalping, journaling market structure, or refining entries based on liquidity behavior — this script helps you make the first 30 minutes count.

RSI - 5UP Overview
The "RSI - 5UP" indicator is a versatile tool that enhances the traditional Relative Strength Index (RSI) by adding smoothing options, Bollinger Bands, and divergence detection. It provides a clear visual representation of RSI levels with customizable bands and optional moving averages, helping traders identify overbought/oversold conditions and potential trend reversals through divergence signals.
Features
Customizable RSI: Adjust the RSI length and source to fit your trading style.
Overbought/Oversold Bands: Visualizes RSI levels with intuitive color-coded bands (red for overbought at 70, white for neutral at 50, green for oversold at 30).
Smoothing Options: Apply various types of moving averages (SMA, EMA, SMMA, WMA, VWMA) to the RSI, with optional Bollinger Bands for volatility analysis.
Divergence Detection: Identifies regular bullish and bearish divergences, with visual labels ("Bull" for bullish, "Bear" for bearish) and alerts.
G radient Fills: Highlights overbought and oversold zones with gradient fills (green for overbought, red for oversold).
How to Use
1. Add to Chart: Apply the "RSI - 5UP" indicator to any chart. It works well on timeframes from 5 minutes to daily.
2. Configure Settings:
RSI Settings:
RSI Length: Adjust the period for RSI calculation (default: 14).
Source: Choose the price source for RSI (default: close).
Calculate Divergence: Enable to detect bullish/bearish divergences (default: disabled).
Smoothing:
Type: Select the type of moving average to smooth the RSI ("None", "SMA", "SMA + Bollinger Bands", "EMA", "SMMA (RMA)", "WMA", "VWMA"; default: "SMA").
Length: Set the period for the moving average (default: 14).
BB StdDev: If "SMA + Bollinger Bands" is selected, adjust the standard deviation multiplier for the bands (default: 2.0).
3.Interpret the Indicator:
RSI Levels: The RSI line (purple) oscillates between 0 and 100. Levels above 70 (red band) indicate overbought conditions, while levels below 30 (green band) indicate oversold conditions. The 50 level (white band) is neutral.
Gradient Fills: The background gradients (green above 70, red below 30) highlight overbought and oversold zones for quick reference.
Moving Average (MA): If enabled, a yellow MA line smooths the RSI. If "SMA + Bollinger Bands" is selected, green bands appear around the MA to show volatility.
Divergences: If "Calculate Divergence" is enabled, look for "Bull" (green label) and "Bear" (red label) signals:
Bullish Divergence: Indicates a potential upward reversal when the price makes a lower low, but the RSI makes a higher low.
Bearish Divergence: Indicates a potential downward reversal when the price makes a higher high, but the RSI makes a lower high.
4. Set Alerts:
Use the "Regular Bullish Divergence" and "Regular Bearish Divergence" alert conditions to be notified when a divergence is detected.
Notes
The indicator does not provide direct buy/sell signals. Use the RSI levels, moving averages, and divergence signals as part of a broader trading strategy.
Divergence detection requires the "Calculate Divergence" option to be enabled and may not work on all timeframes or assets due to market noise.
The Bollinger Bands are only visible when "SMA + Bollinger Bands" is selected as the smoothing type.
Credits
Developed by Marrulk. Enjoy trading with RSI - 5UP! 🚀

RSI HeartHere's an introduction you can use for your RSI Heart indicator:
---
### RSI Heart Indicator
The **RSI Heart Indicator** provides a visually engaging way to monitor and track the **Relative Strength Index (RSI)** across multiple timeframes (10m, 15m, 30m, and 1H). It not only shows the RSI value but also uses heart-shaped symbols to reflect the current market condition based on RSI levels, making it easier to understand the strength and momentum of a given asset at a glance.
### Key Features:
- **Multi-Timeframe Support**: The indicator pulls the RSI values from multiple timeframes (10 minutes, 15 minutes, 30 minutes, and 1 hour) so you can analyze market strength at different intervals in one view.
- **Heart Symbols**: RSI values are displayed alongside heart emojis (❤️, 💛, 💚) that provide a visual cue for the market condition:
- **❤️ (Overbought or Oversold)**: When RSI is below 27 or above 73.
- **💛 (Near Oversold/Overbought)**: When RSI is between 27-30 or 70-73.
- **💚 (Neutral)**: When RSI is between 30 and 70.
- **Customizable Visibility**: Toggle visibility for each timeframe's RSI using simple on/off settings, giving you control over which timeframes are displayed in your chart.
### How it Can Help:
- **Quick Market Sentiment Analysis**: The heart symbols and RSI values allow you to quickly assess whether an asset is in an overbought or oversold condition.
- **Multi-Timeframe RSI**: By viewing RSI across multiple timeframes, you can gain a more comprehensive understanding of market momentum and strength.
- **Personalized to Your Preferences**: Adjust the settings to only show the timeframes that matter most to you, creating a customized and clean chart view.
This indicator helps traders make more informed decisions by providing a clear, easy-to-read representation of market conditions across various timeframes, all within one indicator.
---
This introduction explains what the indicator does, its features, and how it can benefit traders in a concise and easy-to-understand way.

Parabolic RSI [ChartPrime]The Parabolic RSI indicator applies the Parabolic SAR directly to the Relative Strength Index (RSI) . This combination helps traders identify trend shifts and potential reversal points within the RSI framework. The indicator provides both regular and strong signals based on whether the Parabolic SAR crosses above or below key RSI thresholds.
⯁ KEY FEATURES
Parabolic SAR Applied to RSI – Tracks momentum shifts within the RSI indicator.
Dynamic SAR Dots – Plots SAR levels directly on the RSI for visual clarity.
Threshold-Based Signal Filtering – Uses upper (70) and lower (30) RSI levels to determine strong signals.
Simple and Strong Signal System :
Big Diamonds (Strong Signals) – Appear when Parabolic SAR crosses above 70 or below 30 RSI, indicating potential reversals.
Small Diamonds (Regular Signals) – Appear when Parabolic SAR flips inside the RSI range, signaling weaker trend shifts.
Chart Overlay Signals – Highlights strong RSI-based trend shifts directly on the price chart.
Fully Customizable – Modify RSI length, SAR parameters, colors, and signal displays.
⯁ HOW TO USE
Look for strong signals (big diamonds) when SAR flips above 70 RSI (overbought) or below 30 RSI (oversold) for potential reversals.
Use regular signals (small diamonds) for minor trend shifts within the RSI range.
Combine with price action and other indicators to confirm entry and exit points.
Adjust the SAR acceleration factors to fine-tune sensitivity based on market conditions.
⯁ CONCLUSION
The Parabolic RSI indicator merges trend-following and momentum-based analysis by applying the Parabolic SAR to RSI. This allows traders to detect trend shifts inside the RSI space with an intuitive diamond-based signal system . Whether used alone or as part of a broader trading strategy, this indicator provides a clear and structured approach to identifying momentum reversals and potential trading opportunities.

RSI VWAP POC [Uncle Sam Trading]Category: Oscillators, Volume, Market Profile
Timeframe: Suitable for all timeframes
Markets: Crypto, Forex, Stocks, Commodities
Overview
The RSI VWAP POC indicator is a powerful and innovative oscillator that combines the Relative Strength Index (RSI), Volume-Weighted Average Price (VWAP), and Point of Control (POC) from market profile analysis. Designed to provide traders with clear, high-probability trading signals, this indicator helps you identify key market levels, spot overbought/oversold conditions, and time your entries and exits with precision. Whether you’re a day trader, swing trader, or scalper, this free tool adds significant value to your trading strategy by offering a unique blend of momentum, volume, and market profile insights.
How It Works
This indicator integrates three core components to deliver actionable insights:
RSI (Relative Strength Index): Measures momentum to identify overbought (above 70) and oversold (below 30) conditions, helping you anticipate potential reversals.
VWAP (Volume-Weighted Average Price): Calculates a volume-weighted price benchmark, which is used to compute a more accurate, volume-sensitive RSI. This ensures the indicator reflects true market dynamics.
POC (Point of Control): Derived from market profile analysis, the POC represents the price level with the highest traded volume in a session, acting as a critical support or resistance level.
The indicator plots a smoothed RSI based on VWAP, overlaid with market profile data on a user-defined higher timeframe (default: 4H). The POC is displayed as a red line, with aqua bars indicating the value area where the majority of trading volume occurred. When the RSI crosses the POC, the indicator generates clear buy and sell signals:
Strong Buy (SBU): RSI crosses above the POC in an oversold zone.
Strong Sell (SBD): RSI crosses below the POC in an overbought zone.
Additional features include:
Background colors to highlight bullish (green) or bearish (red) trends.
Shaded zones for overbought (70/60) and oversold (30/40) levels.
Customizable settings to fit your trading style and timeframe.
How This Indicator Adds Value
The RSI VWAP POC indicator offers several key benefits that enhance your trading performance:
High-Probability Signals: By combining RSI, VWAP, and POC, this indicator identifies trades at key market levels where price is likely to react, increasing your win rate.
Improved Timing: Clear buy and sell signals, such as ‘SBU’ and ‘SBD’, help you enter and exit trades at optimal points, maximizing profitability.
Risk Management: Overbought/oversold zones and trend confirmation via background colors help you avoid false signals, protecting your capital.
Versatility: Suitable for all markets (crypto, forex, stocks) and timeframes, making it a valuable tool for traders of all experience levels.
Time Efficiency: The indicator does the heavy lifting by analyzing momentum, volume, and market profile data, allowing you to focus on executing trades.
Real-World Performance Example: On a 1-hour Bitcoin chart with a 4-hour higher timeframe, this indicator identified a strong sell signal on April 6th at 12:00 ($82,000), leading to a 9% drop to $74,600. A subsequent strong buy signal on April 7th at 04:00 ($76,200) captured a 6% rise to $81,200 – a potential 25% profit with 5x leverage if exited at 5%.
How to Use
Add the Indicator: Search for “RSI VWAP POC ” in TradingView’s indicator library and add it to your chart.
Set Your Timeframe: The indicator works on any timeframe but is optimized for a 1-hour chart with a 4-hour higher timeframe (set in the settings).
Interpret Signals:
Look for ‘SBU’ (strong buy) labels when the RSI crosses above the POC in an oversold zone, indicating a potential buying opportunity.
Look for ‘SBD’ (strong sell) labels when the RSI crosses below the POC in an overbought zone, signaling a potential selling opportunity.
Use the background colors (green for bullish, red for bearish) to confirm the trend.
Combine with Your Strategy: Use the indicator alongside your existing analysis (e.g., support/resistance, candlestick patterns) for best results.
Settings and Customization
The indicator is highly customizable to suit your trading needs:
RSI Length (Default: 14): Adjust the sensitivity of the RSI. Use a shorter length (e.g., 10) for scalping, or a longer length (e.g., 20) for smoother signals.
EMA Smoothing Length (Default: 3): Smooths the RSI line. Increase to 5 or 7 for less choppy signals in volatile markets.
Higher Timeframe (Default: 240 minutes): Set to 240 (4 hours) for a 1-hour chart. Adjust based on your chart’s timeframe (e.g., 60 minutes for a 15-minute chart).
Value Area Percentage (Default: 100%): Defines the size of the value area around the POC. Lower to 70% for a tighter focus on key levels.
Overbought/Oversold Thresholds (Defaults: 70/30): Adjust these levels to match market conditions (e.g., 80/20 for trending markets).
Show POC Line (Default: True): Toggle the red POC line on or off.
Show Buy/Sell Signals: Enable ‘Show Strong Breakup Signals’ and ‘Show Strong Breakdown Signals’ to focus on high-probability trades.
Why Choose This Indicator?
The RSI VWAP POC indicator stands out by offering a unique combination of momentum, volume, and market profile analysis in a single, easy-to-use tool. It’s designed to help traders of all levels make informed decisions, reduce risk, and increase profitability. Whether you’re trading Bitcoin, forex pairs, or stocks, this indicator provides the clarity and precision you need to succeed.

Bull Bear Pivot by RawstocksThe "Bull Bear Pivot" indicator is a custom Pine Script (v5) tool designed for TradingView to assist traders in identifying key price levels and pivot points on intraday charts (up to 1-hour timeframes). It combines time-based open price markers, pivot high/low detection, and candlestick visualization to provide a comprehensive view of potential support, resistance, and trend reversal levels. Below is a detailed description of the indicator’s functionality, features, and intended use.
Indicator Overview:
The "Bull Bear Pivot" indicator is tailored for intraday trading, focusing on specific times of the day to mark significant price levels (open prices) and detect pivot points. It plots horizontal lines at the open prices of user-defined sessions, identifies pivot highs and lows on the current chart timeframe, and overlays custom candlesticks to highlight price action. The indicator is designed to work on timeframes of 1 hour or less (e.g., 1-minute, 3-minute, 5-minute, 15-minute, 30-minute, 60-minute) and includes a warning mechanism for invalid timeframes.
Key Features:
Time-Based Open Price Markers:
The indicator allows users to define up to five time-based sessions (e.g., 4:00 AM, 8:30 AM, 9:30 AM, 10:00 AM, and a custom time) to capture the open price at the start of each session.
For each session, it plots a horizontal line at the 1-minute open price, extending from the session start to the market close at 4:00 PM EST.
Each line is accompanied by a label positioned 5 bars to the right of the market close (4:00 PM EST), with the text right-aligned and vertically centered on the line.
Users can enable/disable each marker, customize the session time, label text, line color, and text color via the indicator’s settings.
Pivot Highs and Lows:
The indicator calculates pivot highs and lows on the current chart timeframe using the ta.pivothigh and ta.pivotlow functions.
Pivot highs are marked with green triangles above the bars, and pivot lows are marked with red triangles below the bars.
The pivot period (lookback/lookforward) is user-configurable, allowing flexibility in detecting short-term or longer-term reversals.
Custom Candlesticks:
The indicator overlays custom candlesticks on the chart, colored green for bullish candles (close > open) and red for bearish candles (close < open).
This feature helps visualize price action alongside the open price markers and pivot points.
Timeframe Restriction:
The indicator is designed to work on timeframes of 1 hour or less. If the chart timeframe exceeds 1 hour (e.g., 4-hour, daily), a warning label ("Timeframe > 1H\nIndicator Disabled") is displayed, and no elements are plotted.
Customizable Appearance:
Users can customize the appearance of the open price marker lines, including the line style (solid, dashed, dotted) and line width.
Labels for the open price markers have no background (transparent) and use customizable text colors.

Multi-Timeframe S/R & Breakout Projection1) What This Script Does
Collects S/R levels from the 15-minute and 1-hour timeframes, using each timeframe’s pivot detection.
Sorts those pivot-based levels by their distance from the current price, so you see the nearest levels first.
Draws up to a user-defined number of those levels as horizontal rays on the current chart.
Checks breakouts at the nearest S/R line (the one with the smallest distance from price):
Real Breakout: price breaks above a level and sustains above it for the specified number of bars.
False Breakout: price breaks above but quickly closes back below within the specified lookback.
On confirmation of a real or false breakout, that S/R line changes color to green if price is going higher, or red if price is going lower.
Displays a small table in the corner with:
Daily Trend: bullish or bearish, using an SMA on a 30-minute timeframe.
Sentiment: bullish or bearish, using RSI on the same 30-minute timeframe.
2) How It Works
Multi-Timeframe Pivot Detection
The script uses request.security() to fetch pivot highs/lows from two higher timeframes (15m and 60m).
It collects up to a user-specified number of these pivots (numRecent) from each TF.
Sorting & Plotting S/R Lines
Once pivot values are gathered, the script calculates their “distance” from current price.
It sorts them so that the S/R lines drawn on your chart are the nearest ones first.
Each line is drawn with a color and style you can customize:
srRayColor sets the overall color (e.g. yellow).
srRayStyleOptions can be Solid, Dashed, or Dotted.
Breakout Determination
After drawing the lines, the script looks at the nearest line and applies two specialized checks (f_isFalseBreakout & f_isRealBreakout):
A real breakout occurs if price closes above (or below) and remains on that side for breakLook bars.
A false breakout occurs if price closes above (or below) but quickly returns.
When a breakout is confirmed, that nearest line changes color to:
Green if price is ultimately going up,
Red if price is going down.
Daily Trend & Sentiment Table
A small table in the bottom-right corner shows:
Daily Trend: uses a 30-minute SMA to see if your price is above/below on that timeframe.
Sentiment: uses the RSI (also on 30m). A value over 50 suggests bullish sentiment; under 50 suggests bearish.
3) How to Use It
Timeframes & Pivots
Choose how many pivots (numRecent) from each TF to fetch (up to 10 total). A higher number means you’ll see more historical S/R lines.
Customize pivotLeft & pivotRight for how “wide” the pivot detection is.
Line Customization
In the script’s Inputs tab, you’ll find:
S/R Rays Color – sets the hue of the lines.
S/R Line Style – pick from Solid, Dashed, or Dotted.
Liquidity Lines Color – color for the smaller pivot lines from your chart timeframe’s pivot detection.
Breakout Lookback
breakLook determines how many bars must confirm or refute the breakout. Adjust it based on how conservative or aggressive you want the breakout detection.
Check the Table
In the bottom-right, watch the script’s “Daily Trend” & “Sentiment”. This can be a quick filter for trades:
“Bullish” daily trend with a bullish sentiment is often more favorable for long trades.
Conversely, “Bearish” daily trend & sentiment can confirm short ideas.
Scenarios
If you see a “Real Breakout” label near the line, the script recolors that line green or red, indicating a possible continuous move.
A “False Breakout” label suggests the price has quickly retraced.
4) Originality & Concepts
Multi-Timeframe Approach: Many S/R indicators fetch only local pivot lines; here, we explicitly gather pivot points from two separate TFs (15m & 60m) and project them onto your lower timeframe chart.
Distance-Based Sorting ensures you only see the nearest lines on the chart, preventing clutter from excessive lines.
Breakout Logic used is straightforward but effective: it checks if price truly holds beyond a level (real breakout) or fails to hold (false breakout).
Line Recoloring provides immediate visual feedback on the success or failure of the breakout.
5) Chart Usage
Plot this script on a relatively low timeframe chart (like the 1m, 5m, or 15m) to see the higher timeframe S/R lines.
Select how many S/R lines you want to show, choose the line style, set your pivot detection parameters, then watch for breakouts.
Tips:
Start with fewer lines (maxLevels=3 or 5) so the chart remains clear.
You can experiment with a small breakLook if you want more immediate breakout signals, or a higher breakLook if you need stronger confirmation.
Enjoy using the “Multi-Timeframe S/R & Breakout Projection” script! It simplifies the manual process of spotting higher timeframe pivot lines and helps you quickly assess potential breakouts or fakes on your intraday charts, all while giving you a snapshot of the higher timeframe’s trend and sentiment.

Market Sessions & LevelsOverview
This Pine Script indicator identifies key trading levels and market sessions, making it easier for traders to analyze price movements. It highlights the previous day's high and low, tracks premarket price action, and marks the first 5-minute high and low after the market opens.
Features
✅ Identifies Market Sessions:
Pre-Market Session (4:30 AM - 9:30 AM EST)
Regular Market Session (9:30 AM - 4:00 PM EST)
✅ Tracks Key Levels:
Previous Day’s High & Low
Premarket High & Low
First 5-Minute High & Low after market open
✅ Visual Cues for Easy Analysis:
Plots horizontal lines for each level with distinct colors
Displays labels for key price levels on the chart
How It Helps Traders
📊 Pre-Market Preparation: Helps traders spot key resistance/support levels before the market opens.
🚀 Momentum Trading: The first 5-minute high/low can act as breakout or reversal zones.
📉 Historical Price Context: Uses the previous day's high/low to gauge market sentiment.
Customization
The script can be easily modified to adjust session timings, colors, or additional levels based on your trading strategy.
💡 How to Use:
Apply the script to a 1-minute or 5-minute chart for the most accurate premarket and first 5-minute tracking.
Look for price reactions at the plotted levels to determine potential trade setups.
Relative Directional Index (RDI)🔍 Overview
The Relative Directional Index (RDI) is a hybrid tool that fuses the Average Directional and the Relative Strength Indices (ADX and RSI) into a single, highly visual interface. While the former captures trend strength, the latter reveals momentum shifts and potential exhaustion. Together, they can confirm trend structure, anticipate reversals, and sharpen the timing entries and exits.
📌 Why Combine ADX with RSI?
Most indicators focus on either trend-following (like ADX) or momentum detection (like RSI)—but rarely both. Each comes with trade-offs:
- ADX alone confirms trend strength but ignores momentum.
- RSI alone signals overbought/oversold, but lacks trend context.
The RDI resolves this by integrating both, offering:
- Smarter filters for trend entries
- Early warnings of momentum breakdowns
- More confident signal validation
🧠 Design Note: Fibonacci Harmony
All default values—5, 13, 21—are Fibonacci numbers. This is intentional, as these values reflect the natural rhythm of market cycles, and promote harmonic calibration between price action and indicator logic.
🔥 Key Features
✅ ADX Histogram
- Green bars = trend gaining strength
- Red bars = trend weakening
- Adjustable transparency for visual tuning
✅ ADX Line (Orange)
- Measures trend strength over time
- Rising = accelerating trend
- Falling = trend may be fading
✅ RSI Line (Lemon Yellow)
- Captures momentum surges and slowdowns
- Above 50 = bullish control
- Below 50 = bearish pressure
✅ Trend Strength Squares
- Bright green = strong uptrend
- Bright red = strong downtrend
- Faded colors = range-bound or indecisive
✅ ADX/RSI Crossover Markers
- Yellow square = RSI crosses above ADX → momentum building
- Orange square = ADX crosses above RSI → trend still dominant
✅ Customizable Reference Lines
- Yellow (50) = strong trend threshold
- Red (30) = weak trend zone
- Green (70) = overextended, potential exhaustion
_______________________________________________________
🎯 How to Trade with the RDI
The RDI helps traders identify momentum-supported trends, catch early reversals, and avoid false signals during consolidation.
✅ Trend Confirmation Entries
🔼 Bullish → Enter long on pullbacks or resistance breakouts
- ADX rising above 30
- RSI above 50
- Green trend square visible
🔽 Bearish → Enter short on breakdowns or failed retests
- ADX rising
- RSI below 50
- Red trend square visible
🧯 Exit if RSI crosses back against trend direction or ADX flattens
🚨 Reversal Setups Using Divergence
📈 Bullish Divergence → Long entry after confirmation (e.g. engulfing bar, volume spike)
- Price prints lower low
- RSI prints higher low
- Green triangle
📉 Bearish Divergence → Short entry on breakdown
- Price prints higher high
- RSI prints lower high
- Red triangle
Tip: Stronger if ADX is declining (fading trend strength)
🔂 Breakout Detection via Cross Markers
- Yellow square = RSI > ADX → breakout brewing
- Orange square = ADX > RSI → trend continuation likely
⏸️ Avoid Choppy Markets
- RSI between 45–55
- Faded trend squares
- Flat ADX below 20–30
🧠 Pro Tips
- Combine RDI with VWAPs, moving averages and/or pitchforks
- Watch for alignment between trend and momentum
- Use divergence markers as confirmation, not stand-alone triggers
_______________________________________________________
⚠️ Hidden Divergence (Optional)
The RDI includes optional hidden divergence detection. These signals suggest trend continuation but are off by default. Use with discretion—best in established trends, not sideways markets.
🙈 Hidden Bullish
- Price prints higher low
- RSI prints lower low
🙈 Hidden Bearish
- Price prints lower high
- RSI prints higher high

zone trading stratThis only works for DOGEUSD , I made it for the 8cap chart so only use it for that.
If you want this for other symbols/charts you need to comment below or msg me.
# Price Zone Trading System: Technical Explanation
## Core Concept
The Price Zone Tracker is built on the concept that price tends to respect certain key levels or "zones" on the chart. These zones act as support and resistance areas where price may bounce or break through. The system combines zone analysis with multiple technical indicators to generate high-probability trading signals.
## Zone Analysis
The system tracks 9 predefined price zones. Each zone has both a high and low boundary, except for Zone 5 which is represented by a single line. When price enters a zone, the system monitors whether it stays within the zone, breaks above it (bullish), or breaks below it (bearish).
This zone behavior establishes the foundational bias of the system:
- When price closes above its previous zone: Zone State = Bullish
- When price closes below its previous zone: Zone State = Bearish
- When price remains within a zone: Zone State = Neutral
## Trend Analysis Components
The system performs multi-timeframe analysis using several technical components:
1. **Higher Timeframe Analysis** (±3 points in scoring)
- Uses 15-minute charts for sub-5-minute timeframes
- Uses 30-minute charts for 5-minute timeframes
- Uses 60-minute charts for timeframes above 5 minutes
- Evaluates candlestick patterns and EMA crossovers on the higher timeframe
2. **EMA Direction** (±1 point in scoring)
- Compares 12-period and 26-period EMAs
- Bullish when fast EMA > slow EMA
- Bearish when fast EMA < slow EMA
3. **MACD Analysis** (±1 point in scoring)
- Uses standard 12/26/9 MACD settings
- Bullish when MACD line crosses above signal line with positive histogram
- Bearish when MACD line crosses below signal line with negative histogram
4. **Price Action** (±2 points in scoring)
- Evaluates whether price is making higher highs/higher lows (uptrend)
- Or lower highs/lower lows (downtrend)
- Also considers ATR-based volatility and strength of movements
## Trend Score Calculation
All these components are weighted and combined into a trend score:
- Higher timeframe components have stronger weights (±2-3 points)
- Current timeframe components have moderate weights (±1 point)
- Price action components have varied weights (±0.5-2 points)
The final trend state is determined by thresholds:
- Score > +3: Trend Analysis State = Bullish
- Score < -3: Trend Analysis State = Bearish
- Score between -3 and +3: Trend Analysis State = Neutral
## Signal Generation Logic
The system combines the Zone State with the Trend Analysis State:
1. If Zone State and Trend Analysis State are both bullish:
- Combined State = Bullish
- Line Color = Green
2. If Zone State and Trend Analysis State are both bearish:
- Combined State = Bearish
- Line Color = Red
3. If Zone State and Trend Analysis State contradict each other:
- Combined State = Neutral
- Line Color = Black
This implements a safety mechanism requiring both zone analysis and technical indicators to agree before generating a directional signal.
## Trading Signals
Trading signals are generated based on changes in the Combined State:
- When Combined State changes from neutral/bearish to bullish:
- Trading Signal = LONG (green triangle appears on chart)
- When Combined State changes from neutral/bullish to bearish:
- Trading Signal = SHORT (red triangle appears on chart)
- When Combined State changes from bullish/bearish to neutral:
- Trading Signal = EXIT (yellow X appears on chart)
- When Combined State remains unchanged:
- Trading Signal = NONE (no new marker appears)
## Reversal Warning
The system also monitors for potential reversal conditions:
- When Combined State is bullish but both RSI and MFI are overbought (>70)
- When Combined State is bearish but both RSI and MFI are oversold (<30)
In these cases, a yellow diamond appears on the chart as a warning that a reversal might be imminent.
## Visual Elements
The indicator provides multiple visual elements:
1. Zone boundaries as translucent orange areas
2. A single colored line below price (green/red/black) showing the current signal
3. Trading signals as shapes on the chart
4. An information panel showing all relevant indicator values and signals
## Usage Limitations
The indicator is designed to work optimally on timeframes below 30 minutes. On higher timeframes, a warning appears and analysis is disabled.

ZRK 30m This TradingView indicator draws alternating 30-minute boxes aligned precisely to real clock times (e.g., 10:00, 10:30, 11:00), helping traders visually segment intraday price action. It highlights every other 30-minute block with customizable colors, line styles, and opacity, allowing users to clearly differentiate between trading intervals. The boxes automatically adjust based on the chart’s timeframe, maintaining accuracy on 1-minute to 60-minute charts. Optional time labels can also be displayed for additional context. This tool is useful for identifying patterns, measuring volatility, or applying breakout strategies based on defined, consistent time windows across global trading sessions.

Reversal & Breakout Strategy with ORB### Reversal & Breakout Strategy with ORB
This strategy combines three distinct trading approaches—reversals, trend breakouts, and opening range breakouts (ORB)—into a single, cohesive system. The goal is to capture high-probability setups across different market conditions, leveraging a mashup of technical indicators for confirmation and risk management. Below, I’ll explain why this combination works, how the components interact, and how to use it effectively.
#### Why the Mashup?
- **Reversals**: Identifies overextended moves using RSI (overbought/oversold) and SMA50 crosses, filtered by VWAP and SMA200 trend direction. This targets mean-reversion opportunities in trending markets.
- **Breakouts**: Uses EMA9/EMA20 crossovers with VWAP and SMA200 confirmation to catch momentum-driven trend continuations.
- **Opening Range Breakout (ORB)**: Detects early momentum by breaking the high/low of a user-defined opening range (default: 15 bars) with volume confirmation. This adds a time-based edge, ideal for intraday trading.
The synergy comes from blending these methods: reversals catch pullbacks, breakouts ride trends, and ORB exploits early volatility—all filtered by trend (SMA200) and anchored by VWAP for context.
#### How It Works
1. **Indicators**:
- **EMA9/EMA20**: Fast-moving averages for breakout signals.
- **SMA50**: Medium-term trend filter for reversals.
- **SMA200**: Long-term trend direction to align trades.
- **RSI (14)**: Measures overbought (>70) or oversold (<30) conditions.
- **VWAP**: Acts as a dynamic support/resistance level.
- **ATR (14)**: Sets stop-loss distance (default: 1.5x ATR).
- **Volume**: Confirms ORB breakouts (1.5x average volume of opening range).
2. **Entry Conditions**:
- **Long**: Triggers on reversal (SMA50 cross + RSI < 30 + below VWAP + uptrend), breakout (EMA9 > EMA20 + above VWAP + uptrend), or ORB (break above opening range high + volume).
- **Short**: Triggers on reversal (SMA50 cross + RSI > 70 + above VWAP + downtrend), breakout (EMA9 < EMA20 + below VWAP + downtrend), or ORB (break below opening range low + volume).
3. **Risk Management**:
- Risks 5% of equity per trade (based on the initial capital set in the strategy tester).
- Stop-loss: Based on lowest low/highest high over 7 bars ± 1.5x ATR.
- Targets: Two exits at 1:1 and 1:2 risk:reward (50% of position at each).
- Break-even: Stop moves to entry price after the first target is hit.
4. **Backtesting Settings**:
- Commission: Hardcoded at 0.1% per trade (realistic for most brokers).
- Slippage: Hardcoded at 2 ticks (realistic for most markets).
- Tested on datasets yielding 100+ trades (e.g., 2-min or 5-min charts over months).
#### How to Use It
- **Timeframe**: Works best on intraday (2-min, 5-min) or daily charts. Adjust `Opening Range Bars` (e.g., 15 bars = 30 min on 2-min chart) for your timeframe.
- **Settings**:
- Set your initial equity in the TradingView strategy tester’s "Properties" tab under "Initial Capital" (e.g., $10,000). The script automatically risks 5% of this equity per trade.
- Adjust `Stop Loss ATR Multiplier` or `Risk:Reward Targets` based on your risk tolerance.
- Note that commission (0.1%) and slippage (2 ticks) are fixed in the script for backtesting consistency.
- **Execution**: Enter on signal, monitor plotted stop (red) and targets (green/blue). The strategy supports pyramiding (up to 2 positions) for scaling into trends.
#### Backtesting Notes
Results are realistic with commission (0.1%) and slippage (2 ticks) included. For a sufficient sample, test on volatile instruments (e.g., stocks, forex) over 3-6 months on lower timeframes. The default 1.5x ATR stop may seem wide, but it’s justified to avoid premature exits in volatile markets—feel free to tweak it with justification. The script assumes an initial capital of $10,000 in the strategy tester for the 5% risk calculation (e.g., $500 risk per trade); adjust this in the "Properties" tab as needed.
This mashup isn’t just a random mix; it’s a deliberate fusion of complementary strategies, offering traders flexibility across market phases. Questions? Let me know!

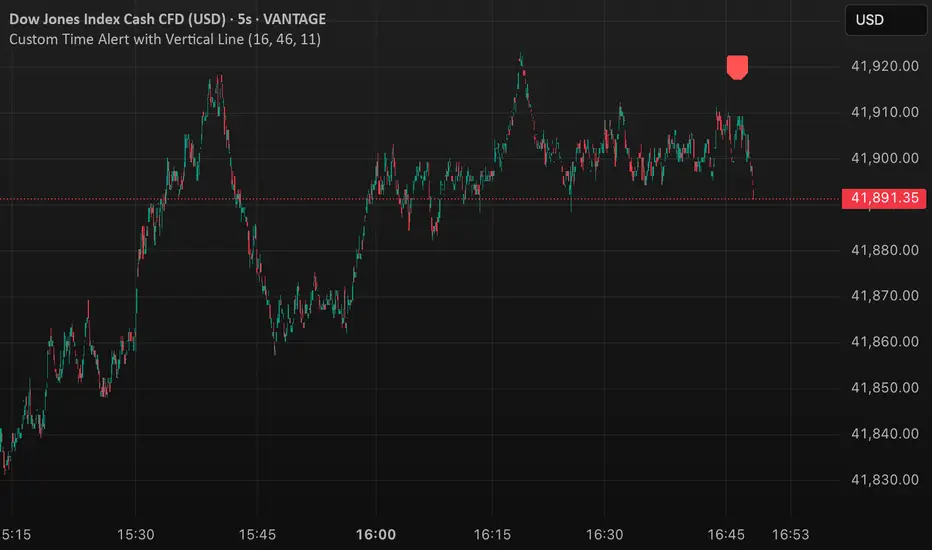
Custom Time Alert with Vertical Line📌 Detailed Explanation of the Custom Time Alert with Vertical Line in Pine Script v5
This script is a time-based alert system designed for TradingView. It allows traders to set a specific hour and minute for alerts and provides visual indicators on the chart, including a marker when the alert triggers and a vertical line at the alert time.
🔹 Main Features
Custom Alert Time → Users can specify the exact hour and minute for an alert.
Time Zone Offset Support → Users can manually adjust their local UTC offset to ensure alerts trigger at the correct time.
Real-Time Alert Condition → When the market reaches the set time, an alert notification is triggered.
Chart Visualization → A red marker appears when the alert is activated, and a blue vertical line is drawn at the alert time.
Automated Calculation → The script adjusts the alert time based on the user’s time zone settings.
🛠️ How It Works
User Input for Alert Time
The script allows users to enter their desired alert hour (0-23) and minute (0-59).
This ensures the alert triggers at the exact specified time.
Time Zone Offset Handling
Users enter their UTC offset (e.g., New York is -5, Tokyo is +9).
This ensures alerts work correctly regardless of the user’s location.
Time Calculation
The script adjusts the TradingView time by adding the time zone offset in milliseconds.
This converts the UTC-based TradingView time into the user’s local time.
Checking for a Time Match
The script constantly checks if the current hour and minute match the user-defined alert time.
If they match, the script activates an alert.
Triggering Alerts
The script uses TradingView’s alertcondition() function to create an alert.
When the time matches, TradingView sends a notification (e.g., pop-up, sound, or mobile alert).
Chart Markers for Visual Alerts
A red marker is displayed on the chart when the alert triggers.
A blue vertical line is drawn at the exact alert time.
📌 Example Use Cases
📈 1. Forex Traders Monitoring Market Opens
A forex trader who trades the London session wants an alert when the market opens at 8:00 AM UTC.
The trader sets:
Alert Hour = 8
Alert Minute = 0
Time Zone Offset = 0 (for UTC)
When the market reaches 8:00 AM UTC, the script triggers an alert.
📈 2. Stock Market Open Alerts
A trader in New York (EST) wants an alert at 9:30 AM Eastern Time (New York Stock Exchange open).
New York’s UTC offset is -5.
The trader sets:
Alert Hour = 9
Alert Minute = 30
Time Zone Offset = -5
The script ensures the alert triggers at 9:30 AM EST.
📈 3. Crypto Trader Watching a Specific Time
A crypto trader wants an alert for a specific strategy at 3:00 PM in Tokyo (UTC+9).
Tokyo’s UTC offset is +9.
The trader sets:
Alert Hour = 15
Alert Minute = 0
Time Zone Offset = +9
The script ensures the alert triggers exactly at 3:00 PM Tokyo time.
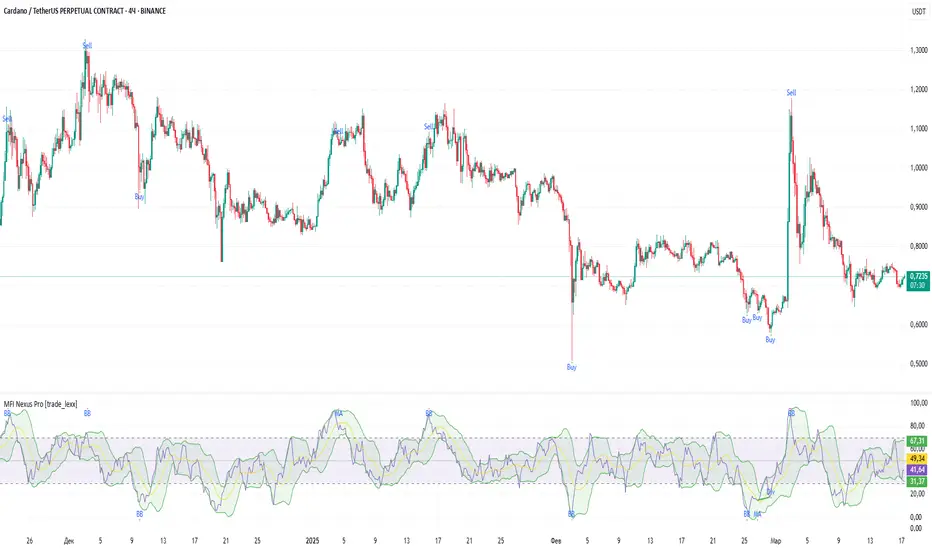
MFI Nexus Pro [trade_lexx]📈 MFI Nexus Pro is your reliable trading assistant!
📊 What is MFI Nexus Pro ?
MFI Nexus Pro is a trading indicator that analyzes cash flows in the market. It shows where money is moving — into or out of an asset, and based on this, generates buy or sell signals.
💡 The main components of the indicator
📊 The MFI Cash Flow Index (MFI)
shows the strength of cash flow into an asset. Values above 70 indicate overbought (an early sale is possible), and values below 30 indicate oversold (an early purchase is possible).
📈 Moving Averages (MA)
The indicator uses 10 different types of moving averages to smooth the MFI line.:
- SMA: Simple moving average
- EMA: Exponential moving average
- WMA: Weighted moving average
And other more complex types (HMA, KAMA, VWMA, ALMA, TEMA, ZLEMA, DEMA)
The choice of the type of moving average affects the speed of the indicator's response to market changes.
🎯 Bollinger Bands (BB)
Bands around the moving average that widen and narrow depending on volatility. They help determine when the MFI is out of the normal range.
🔄 Divergences
Divergences show discrepancies between price and MFI:
- Bullish divergence: the price is falling and the MFI is rising — an upward reversal is possible
- Bearish divergence: the price is rising and the MFI is falling — a downward reversal is possible
🔍 Indicator signals
1️⃣ Moving average signals (MA)
Buy signal
- What happens: MFI crosses its moving average from bottom to top
- What does it look like: the green triangle labeled "MA" under the chart
- What does it mean: money begins to actively flow into the asset, price growth is possible
Sell signal
- What happens: the MFI crosses the moving average from top to bottom
- What does it look like: a red triangle with the label "MA" above the chart
- What does it mean: money starts to leave the asset, the price may fall
2️⃣ Bollinger Band Signals (BB)
Buy signal
- What's happening: The MFI crosses the lower Bollinger band from bottom to top
- What it looks like: the green triangle marked "BB"
- What it means: The MFI was too low and is now starting to recover
Sell Signal
- What's going on: MFI crosses the upper Bollinger band from top to bottom
- What it looks like: a red triangle marked "BB"
- What it means: The MFI was too high and is now starting to decline
3️⃣ Divergence Signals (Div)
Buy Signal (Bullish Divergence)
- What's going on: the price is falling more than the MFI
- What it looks like: a green triangle marked "Div"
- What it means: despite the fall in price, money is already starting to return to the asset
Sell signal (bearish divergence)
- What is happening: the price is rising more strongly than the MFI
- What does it look like: the red triangle with the label "Div"
- What does it mean: despite the price increase, money is already starting to leave the asset
🛠️ Filters to filter out false signals
1️⃣ Minimum distance between the signals
- What it does: sets the minimum number of candles between signals
- Why it is needed: prevents signals from being too frequent during strong market fluctuations
- How to set it up: Set the number from 0 and above (default: 5)
2️⃣ "Waiting for the opposite signal" mode
- What it does: waits for a signal in the opposite direction before generating a new signal
- Why you need it: it helps you not to miss important trend reversals
- How to set up: just turn the function on or off
3️⃣ Filter by MFI levels
- What it does: generates signals only when the MFI is in the specified ranges
- Why it is needed: it helps to catch the moments when the market is oversold or overbought
- How to set up:
- For buy signals: set a range for oversold (e.g. 1-30)
- For sell signals: set a range for overbought (e.g. 70-100)
4️⃣ The RSI filter
- What it does: additionally checks the RSI values to confirm the signals
- Why it is needed: adds additional confirmation from another popular indicator
- How to set up: Similar to the MFI filter, set ranges for buying and selling
🔄 Signal combination modes
1️⃣ Normal mode ("None")
- How it works: all signals (MA, BB, Div) work independently of each other
- When to use it: for general market analysis or when learning how to work with the indicator
2️⃣ "And" mode ("MA and BB and Div")
- How it works: the alarm appears only when several conditions are triggered simultaneously
- Combination options:
- MA+BB: signals from the moving average and Bollinger bands
- MA+Div: signals from the moving average and divergence
- BB+Div: signals from the Bollinger bands and divergence
- MA+BB+Div: all three signals simultaneously
- When to use: for more reliable but rare signals
3️⃣ "OR" mode ("MA or BB or Div")
- How it works: the alarm appears when any of the conditions are triggered
- When to use: for frequent signals when you don't want to miss any opportunity.
🔌 Connecting to trading strategies
The indicator can be connected to your trading strategies using 5 different channels.:
1. Channel for MA signals: connects only signals from moving averages
2. BB signal channel: connects only the signals from the Bollinger bands
3. Channel for divergence signals: connects only divergence signals
4. Channel for "And" mode: connects only combined signals
5. Channel for "OR" mode: connects signals from any source
🔔 Setting up alerts
The indicator can send alerts when alarms appear.:
- Alerts for MA: when the MFI crosses the moving average
- Alerts for BB: when the MFI crosses the Bollinger bands
- Divergence alerts: when a divergence is detected
- Combined alerts: for "AND" and "OR" modes
🎭 What does the indicator look like on the chart ?
- MFI main line: purple line
- Overbought/oversold levels: horizontal lines at levels 30 and 70
- Middle line: dotted line at level 50
- MFI Moving Average: yellow line
- Bollinger bands: green lines around the moving average
- Signals: green and red triangles with corresponding labels
📚 How to start using MFI Nexus Pro
1️⃣ Initial setup
- Add an indicator to your chart
- Select the type of moving average and the period (you can leave it as the default)
- Activate the desired signal types (MA, BB, Div)
2️⃣ Filter settings
- Set the distance between the signals to get rid of unnecessary noise
- Adjust the MFI and RSI levels depending on how volatile your asset is
- If you need more reliable signals, turn on the "Waiting for the opposite signal" mode.
3️⃣ Operation mode selection
- First, use the standard mode to see all possible signals.
- When you get comfortable, try the "And" mode for more reliable signals.
- For active trading, you can use the "OR" mode
4️⃣ Setting up Alerts
- Select the types of signals you want to be notified about
- Set up alerts for "AND" or "OR" modes if you use them
5️⃣ Verification and adaptation
- Check the operation of the indicator on historical data
- Adjust the parameters for a specific asset
- Adapt the settings to your trading style
🌟 Usage examples
For trend trading
- Use MA signals in the direction of the main trend
- Turn on the "Waiting for the opposite signal" mode
- Set stricter levels for filters
For trading in a sideways range
- Use BB signals to detect bounces from the range boundaries
- Use the MFI level filter to confirm overbought/oversold conditions
- Adjust the Bollinger bands according to the width of the range
To determine the pivot points
- Pay attention to the divergence signals
- Use the "And" mode by combining divergences with other signals
- Check the RSI filter for additional confirmation
Volume-Price Divergence RSIUnderstanding the Display
Once added, you'll see a new panel below your price chart with:
Purple Line: This is the RSI (Relative Strength Index)
Red Dashed Line: The overbought threshold (default: 70)
Green Dashed Line: The oversold threshold (default: 30)
Blue Columns: Volume histogram
Dark Blue Line: Volume moving average
Trading Signals
Look for these markers on the indicator panel:
Green Triangle (↑): Buy signal - appears when there's a bullish divergence AND RSI conditions are met (oversold and rising)
Red Triangle (↓): Sell signal - appears when there's a bearish divergence AND RSI conditions are met (overbought and falling)
Lime Diamond (◆): Bullish divergence without RSI confirmation
Orange Diamond (◆): Bearish divergence without RSI confirmation
What These Signals Mean
Buy Signal (Green Triangle):
Price is making lower lows BUT volume is making higher lows
RSI is in oversold territory (below 30) and starting to rise
This suggests potential upward reversal
Sell Signal (Red Triangle):
Price is making higher highs BUT volume is making lower highs
RSI is in overbought territory (above 70) and starting to fall
This suggests potential downward reversal
Customizing the Indicator
To adjust settings:
Right-click on the indicator
Select "Settings"
In the "Inputs" tab, you can modify:
RSI Period (default: 14)
Volume MA Period (default: 20)
Lookback Period for finding pivot points (default: 10)
RSI Overbought level (default: 70)
RSI Oversold level (default: 30)
Setting Alerts
To get notified when a signal appears:
Right-click on the indicator
Select "Add Alert"
Choose the condition you want to be alerted for:
Buy Signal
Sell Signal
Bullish Divergence
Bearish Divergence
Configure notification preferences and save
Trading Strategy
This indicator is best used:
On higher timeframes (4H, Daily) for more reliable signals
As confirmation with other indicators or price action
At market extremes where divergences are more meaningful
With proper risk management (stop losses below recent swing lows for buys, above recent swing highs for sells)
Remember that no indicator is 100% accurate. This tool works by identifying situations where price movement isn't confirmed by volume, suggesting a potential reversal, especially when RSI conditions align.
Valerio Diotallevi

Modified RSIModified RSI (Round Number RSI)
Category: Oscillator / Momentum
Description
The Modified RSI (Round Number RSI) is an enhanced version of the classic Relative Strength Index (RSI), designed to provide clearer and more structured signals by rounding its values to whole numbers. This modification helps traders filter out noise, making trend analysis and overbought/oversold conditions easier to interpret.
Key Features:
✔ Rounded RSI Values – Instead of fluctuating with decimals, this RSI rounds values to whole numbers (e.g., 30, 50, 70) for clearer decision-making.
✔ Easier Signal Interpretation – Helps traders identify key RSI levels without distractions from small fluctuations.
✔ Customizable Lookback Period – Allows adjustment of RSI sensitivity to fit different trading strategies.
✔ Works on All Timeframes & Assets – Can be applied to stocks, forex, crypto, and futures.
How to Use It:
📌 Overbought & Oversold Levels:
RSI ≥ 70 → Market may be overbought (potential reversal or correction).
RSI ≤ 30 → Market may be oversold (potential buying opportunity).
📌 Trend Confirmation:
RSI staying above 50 signals bullish momentum.
RSI staying below 50 signals bearish momentum.
📌 Divergence Trading:
Price makes a new high, but RSI does not → Bearish Divergence (Possible Downtrend).
Price makes a new low, but RSI does not → Bullish Divergence (Possible Uptrend).
Best Used For:
📈 Day Traders & Swing Traders looking for simplified RSI signals.
📉 Trend Confirmation with moving averages or volume analysis.
⚡ Confluence Trading with support/resistance zones.
Why Use This Over Traditional RSI?
🔹 Removes unnecessary noise by rounding RSI values.
🔹 Helps traders focus on key levels (30, 50, 70).
🔹 Reduces decision fatigue for fast-paced trading.

RSI + Stochastic + WMA StrategyThis script is designed for TradingView and serves as a trading strategy (not just a visual indicator). It's intended for backtesting, strategy optimization, or live trading signal generation using a combination of popular technical indicators.
📊 Indicators Used in the Strategy:
Indicator Description
RSI (Relative Strength Index) Measures momentum; identifies overbought (>70) or oversold (<30) conditions.
Stochastic Oscillator (%K & %D) Detects momentum reversal points via crossovers. Useful for timing entries.
WMA (Weighted Moving Average) Identifies the trend direction (used as a trend filter).
📈 Trading Logic / Strategy Rules:
📌 Long Entry Condition (Buy Signal):
All 3 conditions must be true:
RSI is Oversold → RSI < 30
Stochastic Crossover Upward → %K crosses above %D
Price is above WMA → Confirms uptrend direction
👉 Interpretation: Market was oversold, momentum is turning up, and price confirms uptrend — bullish entry.
📌 Short Entry Condition (Sell Signal):
All 3 conditions must be true:
RSI is Overbought → RSI > 70
Stochastic Crossover Downward → %K crosses below %D
Price is below WMA → Confirms downtrend direction
👉 Interpretation: Market is overbought, momentum is turning down, and price confirms downtrend — bearish entry.
🔄 Strategy Execution (Backtesting Logic):
The script uses:
pinescript
Copy
Edit
strategy.entry("LONG", strategy.long)
strategy.entry("SHORT", strategy.short)
These are Pine Script functions to place buy and sell orders automatically when the above conditions are met. This allows you to:
Backtest the strategy
Measure win/loss ratio, drawdown, and profitability
Optimize indicator settings using TradingView Strategy Tester
📊 Visual Aids (Charts):
Plots WMA Line: Orange line for trend direction
Overbought/Oversold Zones: Horizontal lines at 70 (red) and 30 (green) for RSI visualization
⚡ Strategy Type Summary:
Category Setting
Strategy Type Momentum Reversal + Trend Filter
Timeframe Flexible (Works best on 1H, 4H, Daily)
Trading Style Swing/Intraday
Risk Profile Medium to High (due to momentum triggers)
Uses Leverage Possible (adjust risk accordingly)

Enhanced HHLL Time Confirmation with EMAStrong recommendation , remove the green and red circle , or leave it how it is ;)
To be used on 1 minute chart MSTR , Stock
other time frames are good , ;)
How to Use
HHLL Signals: Look for green triangles (buy) below bars or red triangles (sell) above bars to identify confirmed HH/LL setups with trend alignment.
EMA Signals: Watch for lime circles (buy) below bars or maroon circles (sell) above bars when price crosses the EMA 400 in a trending market.
Trend Context: Use the EMA 400 as a dynamic support/resistance level and the SMA trend filter to gauge market direction.
Enable alerts to get notified of signals in real-time.
Best Practices
Adjust the Lookback Period and Confirmation Minutes to suit your timeframe (e.g., shorter for scalping, longer for swing trading).
Combine with other indicators (e.g., volume, RSI) for additional confirmation.
Test on your preferred market and timeframe to optimize settings.
Indicator Description: Enhanced HHLL Time Confirmation with EMA
Overview
The "Enhanced HHLL Time Confirmation with EMA" is a versatile trading indicator designed to identify key reversal and continuation signals based on Higher Highs (HH), Lower Lows (LL), and a 400-period Exponential Moving Average (EMA). It incorporates time-based confirmation and trend filters to reduce noise and improve signal reliability. This indicator is ideal for traders looking to spot trend shifts or confirm momentum with a combination of price structure and moving average crossovers.
Key Features
Higher High / Lower Low Detection:
Identifies HH and LL based on a customizable lookback period (default: 30 bars).
Signals are confirmed only after a user-defined time period (in minutes, default: 60) has passed since the last HH or LL, ensuring stability.
Trend Filter:
Uses a fast (10-period) and slow (30-period) Simple Moving Average (SMA) crossover to confirm bullish or bearish trends.
Buy signals require a bullish trend (Fast SMA > Slow SMA), and sell signals require a bearish trend (Fast SMA < Slow SMA).
EMA 400 Integration:
Plots a 400-period EMA (customizable) as a long-term trend reference.
Generates additional buy/sell signals when price crosses above (buy) or below (sell) the EMA 400, filtered by trend direction.
Visualizations:
Optional dashed lines for HH and LL levels (toggleable).
Debug markers (diamonds) to visualize HH/LL detection points.
Distinct signal shapes: triangles for HHLL signals (green/red) and circles for EMA signals (lime/maroon).
Alerts:
Built-in alert conditions for HHLL Buy/Sell and EMA Buy/Sell signals, making it easy to stay informed of key events.
Input Parameters
Lookback Period (default: 30): Number of bars to look back for HH/LL detection.
Confirmation Minutes (default: 60): Time (in minutes) required to confirm HH/LL signals.
High/Low Source: Select the price source for HH (default: high) and LL (default: low).
Show HH/LL Lines (default: true): Toggle visibility of HH/LL dashed lines.
Show Debug Markers (default: true): Toggle HH/LL detection markers.
EMA Period (default: 400): Adjust the EMA length.

TradZoo - EMA Crossover IndicatorDescription:
This EMA Crossover Trading Strategy is designed to provide precise Buy and Sell signals with confirmation, defined targets, and stop-loss levels, ensuring strong risk management. Additionally, a 30-candle gap rule is implemented to avoid frequent signals and enhance trade accuracy.
📌 Strategy Logic
✅ Exponential Moving Averages (EMAs):
Uses EMA 50 & EMA 200 for trend direction.
Buy signals occur when price action confirms EMA crossovers.
✅ Entry Confirmation:
Buy Signal: Occurs when either the current or previous candle touches the 200 EMA, and the next candle closes above the previous candle’s close.
Sell Signal: Occurs when either the current or previous candle touches the 200 EMA, and the next candle closes below the previous candle’s close.
✅ 30-Candle Gap Rule:
Prevents frequent entries by ensuring at least 30 candles pass before the next trade.
Improves signal quality and prevents excessive trading.
🎯 Target & Stop-Loss Calculation
✅ Buy Position:
Target: 2X the difference between the last candle’s close and the lowest low of the last 2 candles.
Stop Loss: The lowest low of the last 2 candles.
✅ Sell Position:
Target: 2X the difference between the last candle’s close and the highest high of the last 2 candles.
Stop Loss: The highest high of the last 2 candles.
📊 Visual Features
✅ Buy & Sell Signals:
Green Upward Arrow → Buy Signal
Red Downward Arrow → Sell Signal
✅ Target Levels:
Green Dotted Line: Buy Target
Red Dotted Line: Sell Target
✅ Stop Loss Levels:
Dark Red Solid Line: Stop Loss for Buy/Sell
💡 How to Use
🔹 Ideal for trend-following traders using EMAs.
🔹 Works best in volatile & trending markets (avoid sideways ranges).
🔹 Can be combined with RSI, MACD, or price action levels for added confluence.
🔹 Recommended timeframes: 1M, 5M, 15m, 1H, 4H, Daily (for best results).
🚀 Try this strategy and enhance your trading decisions with structured risk management!

Simple Sessions========== TLDR ==========
The "Simple Sessions" indicator plots vertical lines and labels at the open and close of the US (New York), Asia (Tokyo), and Europe (London), daily session. The existing session indicators I could find all changed the background color of the chart for the entire session or added extra information to the chart that cluttered up my view. This is meant to be a less noisy and easy to interpret indication that the session you trade has started or is ending.
========== Features ==========
- Show or hide vertical lines for session opens and closes
- Show or hide labels for session opens and closes
- Show or hide each session individually
- Show or hide just the session close indications
- Change the color used for each session open and close
- Change the labels text, size, and text color
========== Limitations ==========
The session start and end times are hard coded in for their time zones and can't be changed:
- US (New York) - 9:30 - 16:00
- Asia (Tokyo) - 9:00 - 15:00
- Europe (London) - 8:30 - 16:30
========== Use Cases ==========
- Easily see when each session started and ended without the chart being too noisy
- Make it easier to identify price action patterns and trade setups that may occur on the open of each session
=============================
If you'd like more features or options feel free to request them in the comments.
TJR SEEK AND DESTROYTJR SEEK AND DESTROY – Intraday ICT Trading Tool
Built for day traders, TJR SEEK AND DESTROY combines Smart Money concepts like order blocks, fair value gaps, and liquidity sweeps with structure breaks and daily bias to pinpoint high-probability trades during US market hours (9:30–16:00). Ideal for scalping or intraday strategies on stocks, futures, or forex.
What Makes It Unique?
Unlike standalone ICT indicators, this script integrates:
Order Blocks with volume and range filters for precise support/resistance zones.
Fair Value Gaps (FVG) to spot pre-market price imbalances.
Break of Structure (BOS) and Liquidity Sweeps for trend and reversal signals.
A 1H MA-based Bias to align trades with the day’s direction.
BUY/SELL Labels triggered only when bias, BOS, and sweeps align, reducing noise.
How Does It Work?
Order Blocks: Marks zones with high volume (>1.5x 20-period SMA) and low range (<0.5x ATR20) as teal boxes—potential reversal points.
Fair Value Gap: Compares the prior day’s close to the current open (pre- or post-9:30), shown as a purple line and label (e.g., "FVG: 0.005").
Pivot Point: Calculates (prevHigh + prevLow + prevClose) / 3 from the prior day, plotted as an orange line for equilibrium.
Break of Structure: Detects crossovers of 5-bar highs/lows (gray lines), marked with red triangles.
Liquidity Sweeps: Tracks breaches of the prior day’s high/low (yellow lines), marked with yellow triangles.
Daily Bias: Uses 1H close vs. 20-period MA (blue line) for bullish (green background), bearish (red), or neutral (gray) context.
Signals: BUY (green label) when bias is bullish, price breaks up, and sweeps the prior high; SELL (red label) when bias is bearish, price breaks down, and sweeps the prior low.
How to Use It
Setup: Apply to 1M–15M charts for US session trading (9:30–16:00 EST).
Trading:
Wait for a BUY label after a yellow sweep triangle above the prior day’s high in a green (bullish) background.
Wait for a SELL label after a yellow sweep triangle below the prior day’s low in a red (bearish) background.
Use order blocks (teal boxes) as support/resistance for stop-loss or take-profit.
Markets: Best for SPY, ES futures, or forex pairs with US session volatility.
Underlying Concepts
Order Blocks: High-volume, low-range bars suggest institutional activity.
FVG: Gaps between close and open indicate imbalance to be filled.
BOS & Sweeps: Price breaking key levels signals momentum or stop-hunting.
Bias: 1H MA filters trades by broader trend.
Chart Setup
Displays order blocks (teal boxes), pivot (orange), open (purple), bias (colored background), BOS/sweeps (triangles), and signals (labels). Keep other indicators off for clarity.
