COLOUR CODED ULTIMATE OSCILLATOR WITH LEVELS (70/50/30)Just added 70/30/50 levels to @LazyBear 's "Color Coded UO" script.
Happy Trading!
Search in scripts for "30年国债收益率"

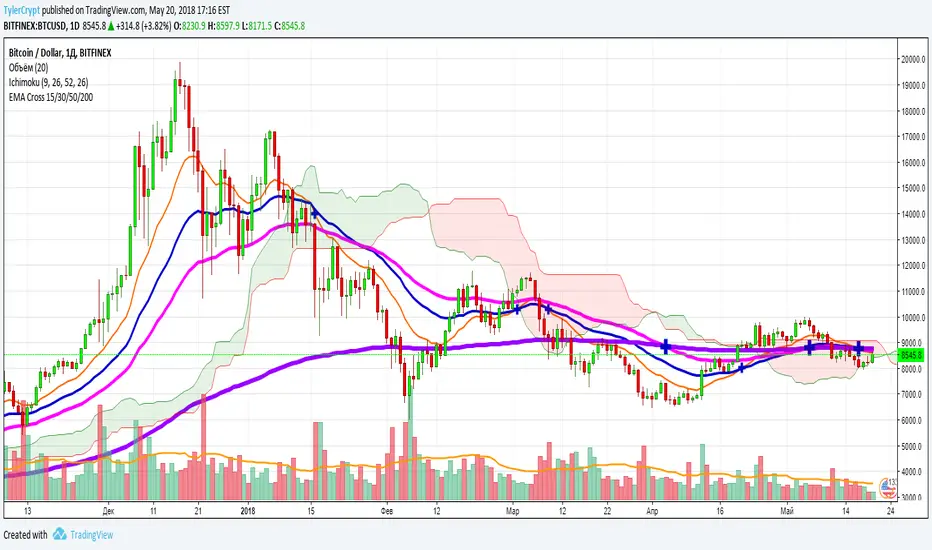
[STRATEGY]EMA 30/60 Cross Strategystrategy based on EMA 30/60 cross
works best on 4hr timeframes & high-midcaps

5 Moving Average Exponential 7-15-30-50-2005 Moving Average Exponential. Crypto EMA. 7 is a fast support or resistance, 15 confirmation support or resistance. 30 Important support and resistance. 50 institutional support or resistance. 200 general trend, support and resistance.

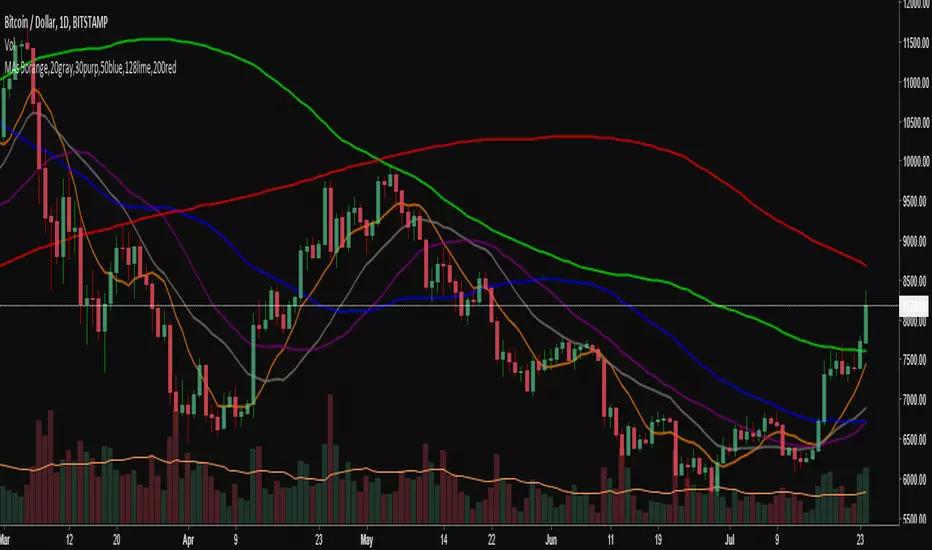
6 SMA's (fit to BTC) 9,20,30,50,128,200 (exponential optional)I've been using these for a while trading Bitcoin and I've found them to be the most useful to me. I replaced the 7 you may have seen in the first set with the 9 as I'm seeing it tested across many time frames quite frequently. The least used of the six is the 30 period, but it does have some influence I've found on the large time frames, mainly the weekly.

6 Simple Moving Averages 9,20,30,50,128,200 (bitcoin tested)I've condensed my SMAs down to these 6 and have found them to be most useful for Bitcoin, which is what I trade the most. They all have played their roll in acting as support and resistance and making decisions with the 30 period probably the least relevant, but relevant nonetheless. There is the option to change to exponential if desired.

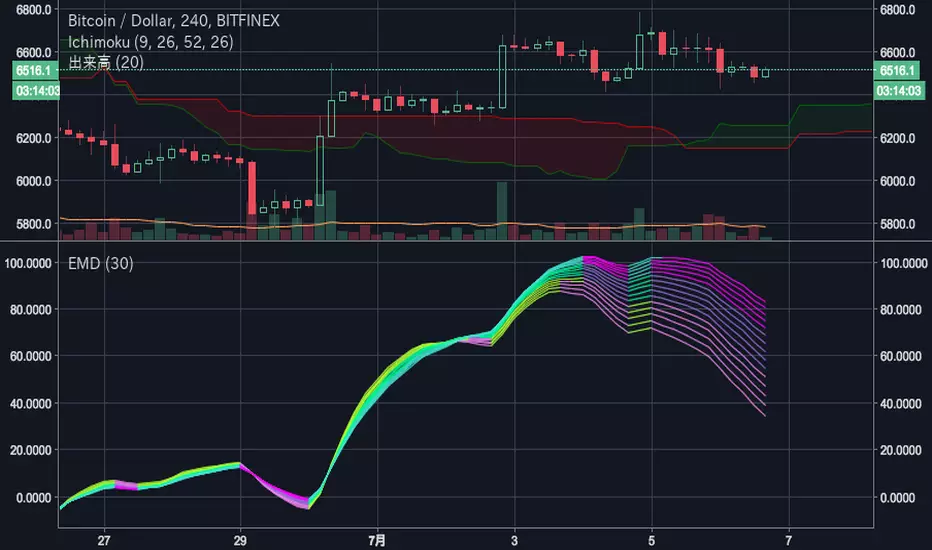
EvaMacD for 30 linesEva Chart calculate IIR Filter with Multiple MACD Histogram and estimate the cycle.
This oscillator can find the most powerful frequency. This use 30 MACD histogram lines tuned for filter.

Simple Moving Averages (7, 30, 50, 100, 200)7, 30, 50, 100, 200 simple moving averages, bundled in one indicator (for users who are using the free TradingView service and can only load limited number of indicators at any given time).
You can turn each moving average on or off at will and change the colors.

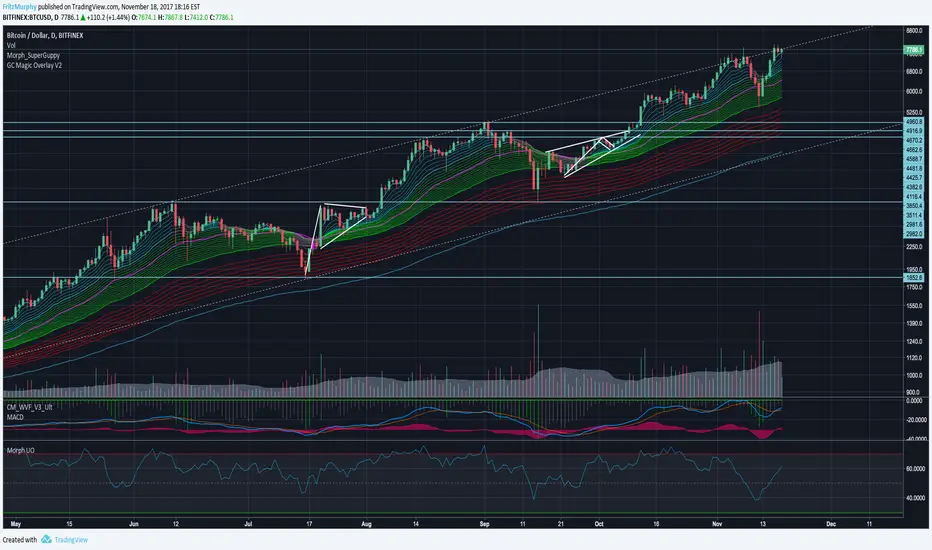
Guppy MMA 3, 5, 8, 10, 12, 15 and 30, 35, 40, 45, 50, 60Guppy Multiple Moving Average
Short Term EMA 3, 5, 8, 10, 12, 15
Long Term EMA 30, 35, 40, 45, 50, 60
Use for SFTS Class

Ultimate Oscillator with 70/30/50 LinesUltimate Oscillator with 70/30/50 lines and a background.
Read how to use it here:
stockcharts.com
Enjoy :)


9:30 USA OPENEasy if it go up it will turn green and you can lng if it goes down it will turn red and you can short

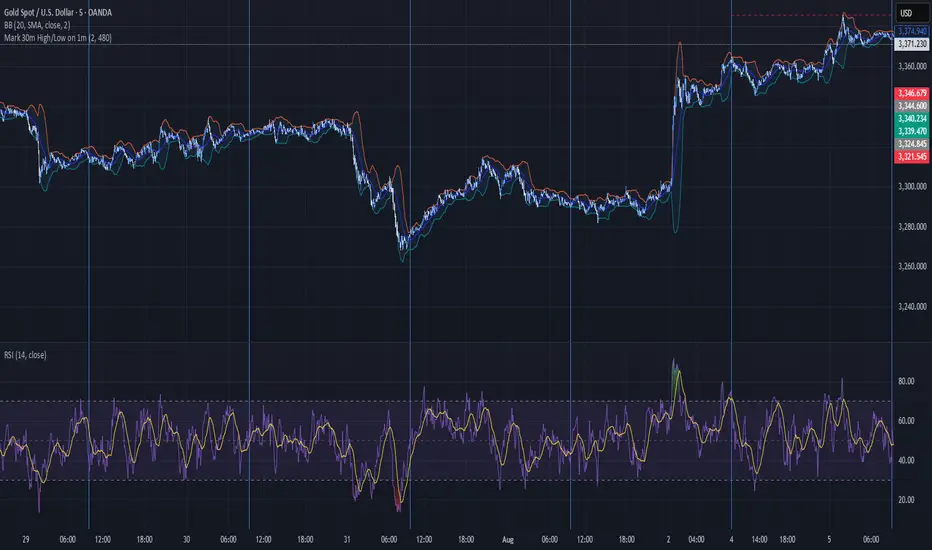
Mark 30m High/Low on 1m30 MIN HIGHS AND LOWS
Marked on the one minute chart.
High is marked with a green line.
Low is marked with a red line.
MTF EMA Pane with Diagnostics30 sec chart, 1 min EMA goes flat, I buy, 1 min EMA stays inside the group, I stay in the trade.
Not financial advice. I am working on an Algo killer, stay tuned. I am dedicating the rest of my life, as short as it my be, to beating the Men behind the Algo's. Buy me some coffee.
Send USDT thru ETH or Base to BYDFi 0x20391e32afd61dc9e1ec027651391b56ceade4e0
Join BYDFi
Referral Link: Spin for a possible $100
partner.bydfi.com
Deposit: USDT via;
ETH (ERC20) 0x20391e32afd61dc9e1ec027651391b56ceade4e0
Tron (TRC20)
TUs5u2YxtQrQfRwYK2CsMmSDGvND6Uopdj
BNB/Base (BEP20)
0x20391e32afd61dc9e1ec027651391b56ceade4e0
Solana
696LAngiQBbdk4m6k1ZBiKZrFtjTJo6dxCnVXMEePQea

30s OR ProjectionsThis script gets the opening range for NQ,ES, and YM. It then created deviations based on this range as targets to take profit from. You may also use the deviations to enter into trades looking for the other side of the range. You have the ability to shade areas of the range.

7:30 AM ET Bar HighlighterHow it works
Step Explanation
1️⃣ hour(time, targetTZ) and minute(time, targetTZ) convert each bar’s opening time to America/New_York and check for 7 : 25.
2️⃣ When both match, isTargetBar becomes true.
3️⃣ bgcolor() paints that candle red, and plotshape() draws the white dot just above it.
Adjustable Color Changing WMA by Slope Degree30 weighted moving average that changes colors based upon degree of slope. Consider it a green light for buying/selling pullbacks to the wma. You can adjust the colors and the threshold for the degree of slope.

30 Day Moving AverageThis indicator offers a longer time frame view compared to the 9 day moving average. This can give a better indication over longer term market moves.

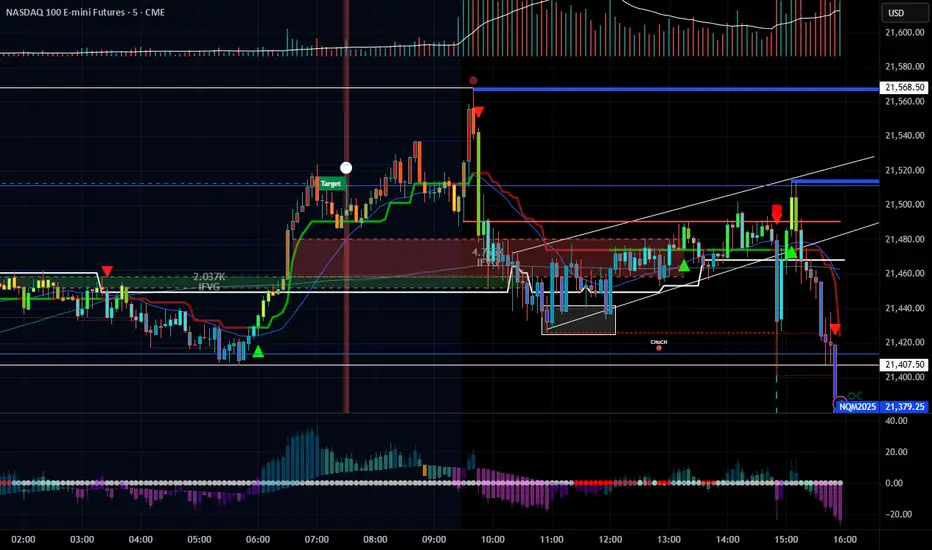
GRA v5 SNIPER# GRA v5 SNIPER - Documentation & Cheatsheet
## 🎯 Get Rich Aggressively v5 - SNIPER Edition
**Precision Futures Scalping | NQ • ES • YM • GC • BTC**
> **Philosophy:** *Quality over quantity. One sniper shot beats ten spray-and-pray attempts.*
---
## ⚡ QUICK CHEATSHEET
```
┌─────────────────────────────────────────────────────────────────────────────┐
│ GRA v5 SNIPER - QUICK REFERENCE │
├─────────────────────────────────────────────────────────────────────────────┤
│ │
│ 🎯 SIGNAL REQUIREMENTS (ALL MUST BE TRUE): │
│ ═══════════════════════════════════════════ │
│ ✓ Tier → B minimum (20+ pts NQ) │
│ ✓ Volume → 1.5x+ average │
│ ✓ Delta → 60%+ dominance (buyers OR sellers) │
│ ✓ Body → 70%+ of candle range │
│ ✓ Range → 1.3x+ average candle size │
│ ✓ Wicks → Small opposite wick (<50% of body) │
│ ✓ CVD → Trending with signal direction │
│ ✓ Session → London (3-5am ET) OR NY (9:30-11:30am ET) │
│ │
├─────────────────────────────────────────────────────────────────────────────┤
│ │
│ 📊 TIER ACTIONS: │
│ ════════════════ │
│ S-TIER (100+ pts) → 🥇 HOLD position, ride the wave │
│ A-TIER (50-99 pts) → 🥈 SWING for 2-3 minutes │
│ B-TIER (20-49 pts) → 🥉 SCALP quick, 30-60 seconds │
│ │
├─────────────────────────────────────────────────────────────────────────────┤
│ │
│ 🚨 ENTRY CHECKLIST: │
│ ═══════════════════ │
│ □ Signal appears (S🎯, A🎯, or B🎯) │
│ □ Table shows: Vol GREEN, Delta colored, Body GREEN │
│ □ CVD arrow matches direction (▲ for long, ▼ for short) │
│ □ Session active (LDN! or NY! in yellow) │
│ □ Enter at close of signal candle │
│ │
├─────────────────────────────────────────────────────────────────────────────┤
│ │
│ ⛔ DO NOT TRADE WHEN: │
│ ════════════════════ │
│ ✗ Session shows "---" (outside key hours) │
│ ✗ Vol shows RED (below 1.5x) │
│ ✗ Body shows RED (weak candle structure) │
│ ✗ Delta below 60% (no clear dominance) │
│ ✗ Multiple conflicting signals │
│ │
├─────────────────────────────────────────────────────────────────────────────┤
│ │
│ 📈 INSTRUMENT SETTINGS: │
│ ════════════════════════ │
│ NQ/ES (1-3 min): S=100, A=50, B=20 pts │
│ YM (1-5 min): S=100, A=50, B=25 pts │
│ GC (5-15 min): S=15, A=8, B=4 pts │
│ BTC (1-15 min): S=500, A=250, B=100 pts │
│ │
└─────────────────────────────────────────────────────────────────────────────┘
```
---
## 📋 DETAILED DOCUMENTATION
### What Makes SNIPER Different?
The SNIPER edition eliminates 80%+ of signals compared to standard GRA. Every signal that passes through has been validated by **8 independent filters**:
| Filter | Standard GRA | SNIPER GRA | Why It Matters |
|--------|-------------|------------|----------------|
| Volume | 1.3x avg | **1.5x avg** | Institutional participation |
| Delta | 55% | **60%** | Clear buyer/seller control |
| Body Ratio | None | **70%+** | No dojis or spinners |
| Range | None | **1.3x avg** | Significant price movement |
| Wicks | None | **<50% body** | Conviction in direction |
| CVD | None | **Required** | Trend confirmation |
| B-Tier Min | 10 pts | **20 pts** | Filter noise |
| Session | Optional | **Required** | Institutional hours |
---
### Signal Anatomy
When you see a signal like `A🎯`, here's what passed validation:
```
Signal: A🎯 LONG at 21,450.00
Validation Breakdown:
├── Points: 67.5 pts ✓ (A-Tier = 50-99)
├── Volume: 2.1x avg ✓ (≥1.5x required)
├── Delta: 68% Buyers ✓ (≥60% required)
├── Body: 78% of range ✓ (≥70% required)
├── Range: 1.6x avg ✓ (≥1.3x required)
├── Wick: Upper 15% ✓ (<50% of body)
├── CVD: ▲ Rising ✓ (Matches LONG)
└── Session: NY! ✓ (Active session)
RESULT: VALID SNIPER SIGNAL
```
---
### Table Legend
| Field | Reading | Color Meaning |
|-------|---------|---------------|
| **Pts** | Point movement | Gold/Green/Yellow = Tiered |
| **Tier** | S/A/B/X | Gold/Green/Yellow/White |
| **Vol** | Volume ratio | 🟢 ≥1.5x, 🔴 <1.5x |
| **Delta** | Buy/Sell % | 🟢 Buy dom, 🔴 Sell dom, ⚪ Neutral |
| **Body** | Body % of range | 🟢 ≥70%, 🔴 <70% |
| **CVD** | Cumulative delta | ▲ Bullish trend, ▼ Bearish trend |
| **Sess** | Session status | 🟡 Active, ⚫ Inactive |
---
### Trading Rules
#### Entry Rules
1. **Wait for signal** - Don't anticipate
2. **Verify table** - All conditions GREEN
3. **Enter at candle close** - Not during formation
4. **Position size by tier:**
- S-Tier: Full size
- A-Tier: 75% size
- B-Tier: 50% size
#### Exit Rules
| Tier | Target | Max Hold Time |
|------|--------|---------------|
| S | Let it run | 5-10 minutes |
| A | 1:1.5 R:R | 2-3 minutes |
| B | 1:1 R:R | 30-60 seconds |
#### Stop Loss
- Place at **opposite end of signal candle**
- For S-Tier: Allow 50% retracement
- For B-Tier: Tight stop, quick exit
---
### Session Priority
```
LONDON OPEN (3:00-5:00 AM ET)
════════════════════════════
• Best for: GC, European indices
• Characteristics: Stop hunts, reversals
• Look for: Sweeps of Asian session levels
NY OPEN (9:30-11:30 AM ET)
════════════════════════════
• Best for: NQ, ES, YM
• Characteristics: High volume, trends
• Look for: Continuation after 10 AM
```
---
### Common Mistakes to Avoid
| Mistake | Why It's Bad | Solution |
|---------|-------------|----------|
| Trading outside sessions | Low volume = fake moves | Wait for LDN! or NY! |
| Ignoring weak body | Dojis reverse | Body must be 70%+ |
| Fighting CVD | Swimming upstream | CVD must confirm |
| Oversizing B-Tier | Small moves = small size | 50% max on B |
| Chasing missed signals | FOMO loses money | Wait for next setup |
---
### Alert Setup
Configure these alerts in TradingView:
| Alert | Priority | Action |
|-------|----------|--------|
| 🎯 S-TIER LONG/SHORT | 🔴 High | Drop everything, check chart |
| 🎯 A-TIER LONG/SHORT | 🟠 Medium | Evaluate within 30 seconds |
| 🎯 B-TIER LONG/SHORT | 🟢 Low | Quick glance if available |
| LONDON/NY OPEN | 🔵 Info | Prepare for action |
---
### Pine Script v6 Notes
This indicator uses Pine Script v6 features:
- `request.security_lower_tf()` for intrabar delta
- Type inference for cleaner code
- Array operations for CVD calculation
**Minimum TradingView Plan:** Pro (for intrabar data)
---
## 🏆 Golden Rule
> **"If you have to convince yourself it's a good signal, it's not a good signal."**
The SNIPER edition is designed so that when a signal appears, there's nothing to think about. If all conditions are met, you trade. If any condition fails, you wait.
**Leave every trade with money. That's the goal.**
---
*© Alexandro Disla - Get Rich Aggressively v5 SNIPER*
*Pine Script v6 | TradingView*

RSI adaptive zones [AdaptiveRSI]This script introduces a unified mathematical framework that auto-scales oversold/overbought and support/resistance zones for any period length. It also adds true RSI candles for spotting intrabar signals.
Built on the Logit RSI foundation, this indicator converts RSI into a statistically normalized space, allowing all RSI lengths to share the same mathematical footing.
What was once based on experience and observation is now grounded in math.
✦ ✦ ✦ ✦ ✦
💡 Example Use Cases
RSI(14): Classic overbought/oversold signals + divergence
Support in an uptrend using RSI(14)
Range breakouts using RSI(21)
Short-term pullbacks using RSI(5)
✦ ✦ ✦ ✦ ✦
THE PAST: RSI Interpretation Required Multiple Rulebooks
Over decades, RSI practitioners discovered that RSI behaves differently depending on trend and lookback length:
• In uptrends, RSI tends to hold higher support zones (40–50)
• In downtrends, RSI tends to resist below 50–60
• Short RSIs (e.g., RSI(2)) require far more extreme threshold values
• Longer RSIs cluster near the center and rarely reach 70/30
These observations were correct — but lacked a unifying mathematical explanation.
✦ ✦ ✦ ✦ ✦
THE PRESENT: One Framework Handles RSI(2) to RSI(200)
Instead of using fixed thresholds (70/30, 90/10, etc.), this indicator maps RSI into a normalized statistical space using:
• The Logit transformation to remove 0–100 scale distortion
• A universal scaling based on 2/√(n−1) scaling factor to equalize distribution shapes
As a result, RSI values become directly comparable across all lookback periods.
✦ ✦ ✦ ✦ ✦
💡 How the Adaptive Zones Are Calculated
The adaptive framework defines RSI zones as statistical regimes derived from the Logit-transformed RSI .
Each boundary corresponds to a standard deviation (σ) threshold, scaled by 2/√(n−1), making RSI distributions comparable across periods.
This structure was inspired by Nassim Nicholas Taleb’s body–shoulders–tails regime model:
Body (±0.66σ) — consolidation / equilibrium
Shoulders (±1σ to ±2.14σ) — trending region
Tails (outside of ±2.14σ) — rare, high-volatility behavior
Transitions between these regimes are defined by the derivatives of the position (CDF) function :
• ±1σ → shift from consolidation to trend
• ±√3σ → shift from trend to exhaustion
Adaptive Zone Summary
Consolidation: −0.66σ to +0.66σ
Support/Resistance: ±0.66σ to ±1σ
Uptrend/Downtrend: ±1σ to ±√3σ
Overbought/Oversold: ±√3σ to ±2.14σ
Tails: outside of ±2.14σ
✦ ✦ ✦ ✦ ✦
📌 Inverse Transformation: From σ-Space Back to RSI
A final step is required to return these statistically normalized boundaries back into the familiar 0–100 RSI scale. Because the Logit transform maps RSI into an unbounded real-number domain, the inverse operation uses the hyperbolic tangent function to compress σ-space back into the bounded RSI range.
RSI(n) = 50 + 50 · tanh(z / √(n − 1))
The result is a smooth, mathematically consistent conversion where the same statistical thresholds maintain identical meaning across all RSI lengths, while still expressing themselves as intuitive RSI values traders already understand.
✦ ✦ ✦ ✦ ✦
Key Features
Mathematically derived adaptive zones for any RSI period
Support/resistance zone identification for trend-aligned reversals
Optional OHLC RSI bars/candles for intrabar zone interactions
Fully customizable zone visibility and colors
Statistically consistent interpretation across all markets and timeframes
Inputs
RSI Length — core parameter controlling zone scaling
RSI Display : Line / Bar / Candle visualization modes
✦ ✦ ✦ ✦ ✦
💡 How to Use
This indicator is a framework , not a binary signal generator.
Start by defining the question you want answered, e.g.:
• Where is the breakout?
• Is price overextended or still trending?
• Is the correction ending, or is trend reversing?
Then:
Choose the RSI length that matches your timeframe
Observe which adaptive zone price is interacting with
Interpret market behavior accordingly
Example: Long-Term Trend Assesment using RSI(200)
A trader may ask: "Is this a long term top?"
Unlikely, because RSI(200) holds above Resistance zone , therefore the trend remains strong.
✦ ✦ ✦ ✦ ✦
👉 Practical tip:
If you used to overlay weekly RSI(14) on a daily chart (getting a line that waits 5 sessions to recalculate), you can now read the same long-horizon state continuously : set RSI(70) on the daily chart (~14 weeks × 5 days/week = 70 days) and let the adaptive zones update every bar .
Note: It won’t be numerically identical to the weekly RSI due to lookback period used, but it tracks the same regime on a standardized scale with bar-by-bar updates.
✦ ✦ ✦ ✦ ✦
Note: This framework describes statistical structure, not prediction. Use as part of a complete trading approach. Past behavior does not guarantee future outcomes.
framework ≠ guaranteed signal
---
Attribution & License
This indicator incorporates:
• Logit transformation of RSI
• Variance scaling using 2/√(n−1)
• Zone placement derived from Taleb’s body–shoulders–tails regime model and CDF derivatives
• Inverse TANH(z) transform for mapping z-scores back into bounded RSI space
Released under CC BY-NC-SA 4.0 — free for non-commercial use with credit.
© AdaptiveRSI
