SuperTrend ToolkitThe SuperTrend Toolkit (Super Kit) introduces a versatile approach to trend analysis by extending the application of the SuperTrend indicator to a wide array of @TradingView's built-in or Community Scripts . This tool facilitates the integration of the SuperTrend algorithm with various indicators, including oscillators, moving averages, overlays, and channels.
Methodology:
The SuperTrend, at its core, calculates a trend-following indicator based on the Average-True-Range (ATR) and price action. It creates dynamic support and resistance levels, adjusting to changing market conditions, and aiding in trend identification.
pine_st(simple float factor = 3., simple int length = 10) =>
float atr = ta.atr(length)
float up = hl2 + factor * atr
up := up < nz(up ) or close > nz(up ) ? up : nz(up )
float lo = hl2 - factor * atr
lo := lo > nz(lo ) or close < nz(lo ) ? lo : nz(lo )
int dir = na
float st = na
if na(atr )
dir := 1
else if st == nz(up )
dir := close > up ? -1 : 1
else
dir := close < lo ? 1 : -1
st := dir == -1 ? lo : up
@TradingView's native SuperTrend lacks the flexibility to incorporate different price sources into its calculation.
Community scripts, addressed the limitation by implementing the option to input different price sources, for example, one of the most popular publications, @KivancOzbilgic's SuperTrend script.
In May 2023, @TradingView introduced an update allowing the passing of another indicator's plot as a source value via the input.source() function. However, the built-in ta.atr function still relied on the chart's price data, limiting the formerly mentioned scripts to the chart's price data alone.
Unique Approach -
This script addresses the aforementioned limitations by processing the data differently.
Firstly we create a User-Defined-Type (UDT) replicating a bar's open, high, low, close (OHLC) values.
type bar
float o = open
float h = high
float l = low
float c = close
We then use this type to store the external input data.
src = input.source(close, "External Source")
bar b = bar.new(
nz(src ) , open 𝘷𝘢𝘭𝘶𝘦
math.max(nz(src ), src), high 𝘷𝘢𝘭𝘶𝘦
math.min(nz(src ), src), low 𝘷𝘢𝘭𝘶𝘦
src ) close 𝘷𝘢𝘭𝘶𝘦
Finally, we pass the data into our custom built SuperTrend with ATR functions to derive the external source's version of the SuperTrend indicator.
supertrend st = b.st(mlt, len)
- Setup Guide -
Utility and Use Cases:
Universal Compatibility - Apply SuperTrend to any built-in indicator or script, expanding its use beyond traditional price data.
- A simple example on one of my own public scripts -
Trend Analysis - Gain additional trend insights into otherwise mainly mean reverting or volume indicators.
- Alerts Setup Guide -
The Super Kit empowers traders and analysts with a tool that adapts the robust SuperTrend algorithm to a myriad of indicators, allowing comprehensive trend analysis and strategy development.
Search in scripts for "ATR"

Price Exhaustion IndicatorThe Price Exhaustion Indicator (PE) is a powerful tool designed to identify trends weakening and strengthening in the financial markets. It combines the concepts of Average True Range (ATR), Moving Average Convergence Divergence (MACD), and Stochastic Oscillator to provide a comprehensive assessment of trend exhaustion levels. By analyzing these multiple indicators together, traders and investors can gain valuable insights into potential price reversals and long-term market highs and lows.
The aim of combining the ATR, MACD, and Stochastic Oscillator, is to provide a comprehensive analysis of trend exhaustion. The ATR component helps assess the volatility and range of price movements, while the MACD offers insights into the convergence and divergence of moving averages. The Stochastic Oscillator measures the current price in relation to its range, providing further confirmation of trend exhaustion. The exhaustion value is derived by combining the MACD, ATR, and Stochastic Oscillator. The MACD value is divided by the ATR value, and then multiplied by the Stochastic Oscillator value. This calculation results in a single exhaustion value that reflects the combined influence of these three indicators.
Application
The Price Exhaustion Indicator utilizes a unique visual representation by incorporating a gradient color scheme. The exhaustion line dynamically changes color, ranging from white when close to the midline (40) to shades of purple as it approaches points of exhaustion (overbought at 100 and oversold at -20). As the exhaustion line approaches the color purple, this represents extreme market conditions and zones of weakened trends where reversals may occur. This color gradient serves as a visual cue, allowing users to quickly gauge the strength or weakness of the prevailing trend.
To further enhance its usability, the Price Exhaustion Indicator also includes circle plots that signify potential points of trend reversion. These plots appear when the exhaustion lines cross or enter the overbought and oversold zones. Red circle plots indicate potential short entry points, suggesting a weakening trend and the possibility of a downward price reversal. Conversely, green circle plots represent potential long entry points, indicating a strengthening trend and the potential for an upward price reversal.
Traders and investors can leverage the Price Exhaustion Indicator in various ways. It can be utilized as a trend-following tool, or a mean reversion tool. When the exhaustion line approaches the overbought or oversold zones, it suggests a weakening trend and the possibility of a price reversal, helping identify potential market tops and bottoms. This can guide traders in timing their entries or exits in anticipation of a trend shift.
Utility
The Price Exhaustion Indicator is particularly useful for long-term market analysis, as it focuses on identifying long-term market highs and lows. By capturing the gradual weakening or strengthening of a trend, it assists investors in making informed decisions about portfolio allocation, trend continuation, or potential reversals.
In summary, the Price Exhaustion Indicator is a comprehensive and visually intuitive tool that combines ATR, MACD, and Stochastic Oscillator to identify trend exhaustion levels. By utilizing a gradient color scheme and circle plots, it offers traders and investors valuable insights into potential trend reversals and long-term market highs and lows. Its unique features make it a valuable addition to any trader's toolkit, providing a deeper understanding of market dynamics and assisting in decision-making processes. Please note that future performance of any trading strategy is fundamentally unknowable, and past results do not guarantee future performance.

custom Bollinger bands with filters - indicator (AS)-----------Description-------------
This indicator is basically Bollinger bands with many ways to customize. It uses highest and lowest values of upper and lower band for exits. I think something is wrong with the script but cant find any mistakes – most probably smoothing. The ATR filter is implemented but is working incorrectly. In code you can also turn it into strategy but I do not recommend it for now as it is not ready yet.
So this is my first script and I am looking for any advice, ideas to improve this script, sets of parameters, markets to apply, logical mistakes in code or any ideas that you may have. Indicator was initially designed for EURUSD 5MIN but I would be interested in other ideas.
-----------SETTINGS--------------
---START - In starting settings we can choose
Line 1: what parts to use BB/DC/ATR
Line 2: what parts to plot on chart
Line 3 Whether or not apply smoothing to BB or ATR filter
Line 4 Calculate deviation for BB from price or Moving average
Line 5 Fill colors and plot other parts for debug (overlay=false)
Line 6:( for strategy) – enable Long/Short Trades
---BB and DC – here we modify Bollinger bands and Donchian
Line 1: Length and type of BB middle line and also length of DC from BB
Line 2: Length and type of BB standard deviation and multiplier
Line 3: Length and type of BB smoothing and %width for BB filter
---ATR filter – (not ready fully yet)
Line 1: type and length of ATR
Line 2: threshold and smoothing value of ATR
---DATE and SESSION
Line 1: apply custom date or session?
Line 2: session hours settings
Line 3:Custom starting date
Line 4: Custom Ending date
-----------HOW TO USE--------------
We open Long if BB width is bigger than threshold and close when upper band is no longer highest in the period set. Exact opposite with Short

EMA + ATR Support and Resistance + Take Profit SignalThe 'EMA+ ATR Support Resistance Take Profit signal' indicator is a technical analysis tool designed to help traders identify potential support and resistance levels, using the Exponential Moving Average (EMA) and the Average True Range (ATR) indicators. This indicator not only tracks the EMA and ATR but also plots these levels as support and resistance lines, providing useful insights into potential buy and sell points.
The indicator allows you to set the lengths for both the EMA and ATR, with default values set to 20 and 14, respectively. Moreover, you can specify the multiplier for the ATR in the Support/Resistance (S/R) length setting, which defaults to 2. The line width for the plotted lines can also be adjusted according to your preference.
The EMA line in center is invisible by default but you can change that by going to the setting of the indicator. The support and resistance lines are plotted in green and red, respectively. When the price hits the support or resistance levels, the indicator provides a visual signal with a cross shape below or above the respective bars, in lime and red, respectively. If you do not need the take profit signals you can disable them in the setting.
How to Use:
1. Define the EMA and ATR lengths according to your trading strategy. Higher lengths will provide smoother lines but may also lag the current price action.
2. Set the S/R length to determine the distance of the support and resistance lines from the EMA line. Higher values will place these lines further away from the EMA.
3. Monitor the chart for instances when the price hits the support or resistance levels. This is indicated by a cross shape below (for support hit) or above (for resistance hit) the price bar. These points may be considered as potential take profit points or entry/exit points, depending on your strategy.
4. Use the indicator in conjunction with other tools and indicators to confirm signals and reduce the risk of false signals. So the assumption is you enter a trade using your other indicators but you can rely on this indicator to remind you to take profit if you are long by a red cross of the resistance line and if you are short reminds you by a green cross on the support line.
Disclaimer: This indicator should not be used as the sole determinant for any investment decision. Always conduct thorough research and consider multiple factors before trading.

MA Simple Strategy with SL & TP & ATR FiltersHello Guys! Nice to meet you all!
This is my second script!
This Logic is trend following logic, This detects long & short trends by comparing the value of MAs.
This fits to the longer time frame.
### Long Condition
1. Compare 4 MAs (you can chose MA Type)
- Shortest MA (MA 1)
- Shorter MA (MA 2)
- Normal MA (MA 3)
- Longer MA (MA 4)
2. If MA 1 > MA 2 > MA 3 > MA 4, then Enter Long Position
- ‘The arrangement of MAs in descending orders’ is the proxy of the long trend.
### Short Condition
1. Compare 4 MAs (you can chose MA Type)
- Shortest MA (MA 1)
- Shorter MA (MA 2)
- Normal MA (MA 3)
- Longer MA (MA 4)
2. If MA 1 < MA 2 < MA 3 < MA 4, then Enter Short Position
- ‘The arrangement of MAs in ascending orders’ is the proxy of the short trend.
### Close Condition
1. When trend Changes
- When (MA 1 > MA 2 > MA 3 > MA 4) breaks or (MA 1 < MA 2 < MA 3 < MA 4) breaks.
2. When the price hits the stoploss
3. When the price hits the take profit level (basically 50% of qty will be closed)
### Etc
1. Trend filter (ATR should be bigger than SMA of ATR)
- If the volatility of price is to small (ATR), then there could be false signal. To filter this out, I used the condition ‘ATR should be larger than SMA of ATR’.
2. Stoploss
- Enabled Stoploss based on ATR, Percent, Risk-Reward Ratio,
- Enabled Trailing Stoploss.
3. Choose MA Type
- You can choose MA Type
+ Thanks for the stoploss template @jason5480

Up-Down RangeHere is an attempt to segregate ATR into ATR of up days and down days.
While setting trailing stops based on ATR, you probably need to consider more on how an instrument can drop during red days. Hence, ATR of only red days makes more compelling case than overall ATR. Another use case for this kind of indicator may be in options if you are selling puts and calls with the intent of pocketing premiums on expiry.
Parameters are as explained below:
Range Type : Different range types are tr (True Range) , close (difference between close prices), highlow (difference between high and low of candle)
Period : ATR Period
Moving Average Type : Moving Average Type for calculating ATR. Two additional types - min and max are added which calculates lowest and highest range in last n bars
HideFullAtr : Hides combined ATR if checked.
Risk Management: Position Size & Risk RewardHere is a Risk Management Indicator that calculates stop loss and position sizing based on the volatility of the stock. Most traders use a basic 1 or 2% Risk Rule, where they will not risk more than 1 or 2% of their capital on any one trade. I went further and applied four levels of risk: 0.25%, 0.50%, 1% and 2%. How you apply these different levels of risk is what makes this indicator extremely useful. Here are some common ways to apply this script:
• If the stock is extremely volatile and has a better than 50% chance of hitting the stop loss, then risk only 0.25% of your capital on that trade.
• If a stock has low volatility and has less than 20% change of hitting the stop loss, then risk 2% of your capital on that trade.
• Risking anywhere between 0.25% and 2% is purely based on your intuition and assessment of the market.
• If you are on a losing streak and you want to cut back on your position sizing, then lowering the Risk % can help you weather the storm.
• If you are on a winning streak and your entries are experiencing a higher level of success, then gradually increase the Risk % to reap bigger profits.
• If you want to trade outside the noise of the market or take on more noise/risk, you can adjust the ATR Factor.
• … and whatever else you can imagine using it to benefit your trading.
The position size is calculated using the Capital and Risk % fields, which is the percentage of your total trading capital (a.k.a net liquidity or Capital at Risk). If you instead want to calculate the position size based on a specific amount of money, then enter the amount in the Custom Risk Amt input box. Any amount greater than 0 in the Custom Risk Amt field will override the values in the Capital and Risk % fields.
The stop loss is calculated by using the ATR. The default setting is the 14 RMA, but you can change the length and smoothing of the true range moving average to your liking. Selecting a different length and smoothing affects the stop loss and position size, so choose these values very carefully.
The ATR Factor is a multiplier of the ATR. The ATR Factor can be used to adjust the stop loss and move it outside of the market noise. For the more volatile stock, increase the factor to lower the stop loss and reduce the chance of getting stopped out. For stocks with less volatility , you can lower the factor to raise the stop loss and increase position size. Adjusting the ATR Factor can also be useful when you want the stop loss to be at or below key levels of support.
The Market Session is the hours the market is open. The Market Session only affects the Opening Range Breakout (ORB) option, so it’s important to change these values if you’re trading the ORB and you’re outside of Eastern Standard Time or you’re trading in a foreign exchange.
The ORB is a bonus to the script. When enabled, the indicator will only appear in the first green candle of the day (09:30:00 or 09:30 AM EST or the start time specified in Market Session). When using the ORB, the stop loss is based on the spread of the first candle at the Open. The spread is the difference between the High and Low of the green candle. On 1-day or higher timeframes, the indicator will be the spread of the last (or current) candle.
The output of the indicator is a label overlaying the chart:
1. ATR (14 RMA x2) – This indicated that the stop loss is determined by the ATR. The x2 is the ATR Factor. If ORB is selected, then the first line will show SPREAD, instead of ATR.
2. Capital – This is your total capital or capital at risk.
3. Risk X% of Capital – The amount you’re risking on a % of the Capital. If a Custom Risk Amt is entered, then Risk Amount will be shown in place of Capital and Risk % of Capital.
4. Entry – The current price.
5. Stop Loss – The stop loss price.
6. -1R – The stop loss price and the amount that will be lost of the stop loss is hit.
7. – These are the target prices, or levels where you will want to take profit.
This script is primarily meant for people who are new to active trading and who are looking for a sound risk management strategy based on market volatility . This script can also be used by the more experienced trader who is using a similar system, but also wants to see it applied as an indicator on TradingView. I’m looking forward to maintaining this script and making it better in future revisions. If you want to include or change anything you believe will be a good change or feature, then please contact me in TradingView.

G-ATR Box V.1Hello this is my new adapt indicator "G-ATR Box V.1"
It's just nearly normal ATR but I create in box color. My problem when I use ATR trailing stop my screen is not clean and when I use finonacci or trend line is hard to see.
How to use
Blue = Pre-buy : Waiting for another buy signal
Green = Buy : Holding the stock
Yellow = Weak uptrend : Waiting for Sell signal
Red = Sell
In this screen I compare G-ATR Box(above) with G-MACD color(below)
When the stock strong uptend all of G-ATR and G-MACD is very work and When weak uptrend G-ATR is action frist but beware Bear trap too
goodluck
Minimum Average True RangeI use ATR a lot when designing trading strategies, this way the strategy adjusts to the instrument in most cases instead of me plugging in special numbers.
However, ATR itself could get spiked by some violent moves. For this I have created MinATR which I am publishing here.
It is effectively ATR + minimum ATR over the last "Min Length" bars. (this is a parameter which I have defaulted to 50).
So use this the same way you use ATR, but it will also show the min ATR over the last "Min Length" periods.

ALMA v1 ATR Bands With Trend BarsALMA v1 ATR Bands With Trend Bars is a trend-context overlay indicator designed to visualize price structure, momentum direction, and volatility expansion directly on the chart.
It combines the Arnaud Legoux Moving Average (ALMA) with ATR-based dynamic bands and a dual-momentum bar-coloring model, providing a clear visual framework for interpreting trend conditions without compressing market behavior into a single decision output.
Conceptual Architecture
The indicator is built around three complementary layers, each serving a distinct analytical role:
1. ALMA Trend Curve
The core trend line is computed using the Arnaud Legoux Moving Average, which emphasizes responsiveness while maintaining smoothness through controlled offset and sigma parameters.
An optional adaptive filter suppresses minor fluctuations, allowing the curve to focus on structural price movement rather than short-term noise.
Color changes in the ALMA line reflect directional slope state, not trading actions.
2. ATR Volatility Bands
ATR-based bands are calculated around the filtered ALMA curve:
The bands expand and contract dynamically with volatility.
They provide a contextual envelope that helps visualize price dispersion relative to the underlying trend.
These bands are intended as a volatility reference, not fixed support or resistance levels.
3. Trend Bars (Momentum State Layer)
Price candles are recolored using a dual-CCI momentum model:
A fast and a slow CCI operate together to classify momentum agreement.
When both momentum measures align, bars reflect directional bias.
When momentum disagrees, bars shift to a neutral state.
This layer highlights momentum consistency, not execution timing.
Trend State Visualization:
Discrete visual markers may appear when the slope direction of the ALMA curve changes.
These markers indicate structural trend transitions based on confirmed bar closes and do not repaint.
They are intended to support visual interpretation of trend evolution, not to automate decisions.
Reliability:
No repainting: all states, colors, and markers are confirmed on bar close.
Consistent behavior across instruments and timeframes.
Designed for stable visual output during live market conditions.
Customization Options:
ALMA length, offset, sigma, and optional shift.
Adaptive filtering sensitivity.
ATR period and deviation multiplier.
Momentum sensitivity modes for bar coloring.
Fully customizable color palette.
Optional alerts for structural trend changes.

Dual VWAP + Dual ATR % BandsScript is adjusted for 5min time frame, can play around setting to adjust accordingly.
It has
Vwap regular
Vwap with adjustable time period
Bands based on ATR value, ie (if ATR is 10, one can adjust band to VWap+ATR %( adjustable)
ATR% can be adjusted to include daily ATR values in addition to current day ATR based on chart time frame.
The bands can be tied to regular VWAP or period VWAP
Regards

SVP + candle + Max volume [midst]
SVP + DALY CANDLE + MAX VOLUME
A comprehensive trading indicator that combines Session Volume Profile (SVP), Higher Timeframe (HTF) Candles, and Intrabar Max Volume Price Detection into one powerful tool. Perfect for traders who want to understand price action, volume distribution, and key levels all in one place.
KEY FEATURES
Session Volume Profile
• Real-time volume distribution across price levels for the current session
• Point of Control (POC) - identifies the price with the highest traded volume
• Value Area High (VAH) & Low (VAL) - shows where 70% of the volume occurred (customizable percentage)
• Color-coded volume bars - distinguish between up volume (bullish) and down volume (bearish)
• Value area highlighting - clearly see the most important price zones
Higher Timeframe Candle Display
• Visual daily (or custom timeframe) candle overlaid on your current chart
• OHLC labels - see Open, High, Low, and Close prices clearly marked
• Fully customizable colors - separate colors for bullish/bearish bodies, borders, and wicks
• Adjustable positioning - move the candle and labels to your preferred location
Max Volume Price Detection
• Identifies the exact price level with maximum volume within each bar
• Uses Lower Timeframe (LTF) data for precise volume analysis (Premium+ required)
• Simple mode fallback - works on all TradingView plans
• Previous max volume marker - displays previous bar's max volume as a reference dot
• Real-time calculation - updates as each bar forms
ATR Table
• Dynamic ATR-based stop levels - automatically calculates potential stop-loss levels
• Multiple smoothing methods - RMA, SMA, EMA, WMA
• Customizable multiplier - adjust for your risk tolerance
• Clean table display - shows ATR value, high stop, and low stop
PERFECT FOR
Day traders analyzing intrabar volume distribution
Swing traders wanting HTF context on lower timeframes
Volume profile traders looking for key support/resistance levels
Price action traders seeking high-probability entry zones
HOW TO USE
Volume Profile Analysis
POC often acts as a magnet for price. VAH/VAL are key support/resistance levels. High volume nodes indicate strong price acceptance, while low volume nodes suggest potential breakout zones.
HTF Candle Context
See daily range while trading on 5m-1h charts. Daily open often acts as pivot point. Daily high/low are key levels to watch.
Max Volume Price
Black line shows where most volume traded in each bar. Previous max volume (dot) helps identify institutional activity. Clusters of max volume create strong support/resistance. Can possibly indicate a Wick bounce
ATR Stops
Use ATR-based levels for logical stop placement. Adjust multiplier based on market volatility.
SETTINGS & CUSTOMIZATION
Positioning
Control the global offset to move both candle and profile together. Fine-tune with individual offsets for candle and profile spacing.
Volume Profile
Adjustable number of rows (50-500) for granular or simplified view. Customizable width and placement (left/right). Value Area percentage control. Full color customization for all volume components.
HTF Candle
Any timeframe selection (default: Daily). Full color customization for bull/bear candles. Adjustable candle width. Toggle OHLC labels on/off. Control label distance and line widths.
Max Volume Price
Choose between Simple (all plans) or LTF mode (Premium+). Auto or manual LTF resolution. Custom color and line width. Toggle current and previous markers independently.
TECHNICAL NOTES
Maximum 5000 bars lookback for volume calculations
Works on all timeframes
LTF max volume requires TradingView Premium or higher
Optimized for performance with efficient array operations
For best results, use on liquid instruments with reliable volume data
Most effective on intraday charts (5min-1hour) for day trading and scalping strategies
For Entertainment and information only
Created by midst

Breakout Signal (Trend+ATR+ADX+Score)Breakout Signal – Trend + ATR + ADX + Strength Score
This indicator detects high-quality bullish breakout conditions using a multi-filter confirmation system designed to reduce false signals and highlight only strong momentum events.
A breakout signal triggers when all core conditions align:
📌 Breakout Conditions
1. Price Breakout
Breakout occurs when the current high exceeds the previous close by X%.
This avoids noisy open-based signals and focuses on genuine upward expansion.
2. Volume Spike
Current volume must be higher than the average volume × multiplier.
This ensures the breakout is supported by real trading activity.
3. Trend Filter (MA)
Price must be trading above a moving average.
This prevents counter-trend breakouts and focuses on momentum continuation.
4. ATR Rising
ATR must be rising relative to its own moving average.
A rising ATR confirms volatility expansion — a key ingredient of valid breakouts.
5. ADX Trend Strength
ADX must exceed a user-defined threshold (default: 20).
This confirms the market is in a strong trend environment, reducing false signals.
⭐ Breakout Strength Score (0–5)
Each of the 5 filters contributes 1 point:
Trend OK
Volume Spike
ATR Rising
ADX Strong
Price Breakout
A score label appears on valid breakouts:
5/5 → Very strong breakout
4/5 → Strong breakout
3/5 → Moderate breakout
0–2 → Weak / avoided signals

Momentum Tide [Alpha Extract]A sophisticated momentum-based trend identification system that measures normalized price deviation from an EMA baseline using ATR scaling and hyperbolic tangent smoothing for precise trend state classification. Utilizing advanced signal processing with configurable neutral bands and slope sensitivity adjustments, this indicator delivers institutional-grade momentum analysis with continuous strength measurement and visual trend confirmation. The system's three-state classification (bullish, bearish, neutral) combined with dynamic color intensity scaling provides comprehensive market momentum assessment across varying volatility conditions.
🔶 Advanced Baseline Deviation Framework
Implements EMA-based baseline calculation with ATR-normalized deviation measurement to create volatility-adjusted momentum signals. The system calculates raw price deviation from the baseline, scales by ATR and slope sensitivity factor, then applies exponential smoothing for stable signal generation with reduced noise and false transitions.
// Core Momentum Calculation
Baseline = ta.ema(close, Baseline_Length)
ATR_Value = ta.atr(ATR_Length)
Raw_Deviation = (close - Baseline) / (ATR_Value * Slope_Scaler)
Signal = ta.ema(Raw_Deviation, Signal_Smoothing)
🔶 Hyperbolic Tangent Normalization Engine
Features sophisticated tanh transformation that clamps raw deviation signals into normalized -1 to +1 range for consistent interpretation across all market conditions. The system applies safe exponential calculations with value capping to prevent overflow while maintaining signal sensitivity, creating bounded momentum readings suitable for systematic threshold analysis.
// Tanh Normalization
Clamped_Signal = tanh(Signal) // Bounded to
Strength = abs(Clamped_Signal) // Momentum intensity
🔶 Three-State Classification System
Implements intelligent trend state determination using configurable neutral band thresholds to reduce whipsaw signals during ranging conditions. The system classifies market as bullish (+1) when momentum exceeds upper neutral band, bearish (-1) below lower neutral band, and neutral (0) within the band, providing clear directional bias with built-in consolidation recognition.
🔶 Dynamic Color Intensity Architecture
Provides advanced visual feedback through momentum strength-based color intensity modulation, where stronger trends display more opaque colors and weaker trends show increased transparency. The system dynamically adjusts color alpha values based on absolute momentum strength, creating intuitive visual representation of trend conviction across baseline, candles, and bars.
🔶 Trend Strength Meter Visualization
Features innovative horizontal gradient meter displaying real-time momentum position across bear-to-bull spectrum with 24-segment resolution. The system creates smooth color transitions from bearish red through neutral gray to bullish green, with arrow indicator showing precise momentum location for instant trend strength assessment without cluttering the price chart.
🔶 Intelligent Flip Detection System
Generates transition markers when trend state changes from neutral/bearish to bullish or neutral/bullish to bearish, with duplicate signal suppression to prevent marker clustering. The system tracks previous signal states and only plots new markers on genuine trend reversals, providing clean entry signal visualization for systematic trading approaches.
snapshot
🔶 Configurable Neutral Band Framework
Implements adjustable neutral zone width using ATR percentage parameters to optimize signal frequency for different trading styles and market conditions. Wider bands reduce flip frequency for position trading while tighter bands increase sensitivity for active trading strategies, enabling customization without code modification.
🔶 Slope Sensitivity Adjustment
Features slope scaler parameter that modulates ATR normalization factor, controlling signal smoothness versus responsiveness trade-off. Higher values create smoother momentum readings with fewer transitions while lower values increase snappiness for faster reaction to price changes, allowing optimization across different volatility regimes and timeframes.
🔶 Comprehensive Visual Integration
Provides multi-dimensional trend visualization through color-coded baseline overlay, momentum-synchronized candle coloring, and bar color modification with configurable display toggles. The system includes optional flip markers and strength meter with position control for complete chart integration without visual overload.
🔶 Performance Optimization Framework
Utilizes efficient calculation methods with optimized table management for strength meter updates and minimal computational overhead for real-time momentum processing. The system includes intelligent state tracking and safe mathematical operations to prevent errors during extreme market conditions while maintaining consistent performance.
🔶 Why Choose Momentum Tide ?
This indicator delivers sophisticated momentum-based trend analysis through normalized deviation measurement and intelligent three-state classification. Unlike traditional momentum oscillators that operate in separate windows, Momentum Tide integrates directly with price action through baseline overlay and candle coloring while providing the analytical depth of bounded momentum measurement. The system's combination of tanh normalization, configurable neutral bands, dynamic color intensity, and innovative strength meter makes it essential for traders seeking adaptive trend-following approaches with clear visual feedback across cryptocurrency, forex, and equity markets. The three-state system naturally filters ranging periods while the momentum strength measurement enables position sizing and confidence assessment for systematic trading strategies.

PRO Live ATR Engine – 1H ATR(1) & ATR(5) for Lower Timeframes✔ Accurate Live ATR(1)
Uses true range formula, not just high-low.
✔ Accurate Live ATR(5)
Rolling ATR that increases/decreases continuously as the hour forms.
✔ Works in Replay on 1m/5m
Does not rely on 1-hour candle closes.
✔ Only flags inside 09:20–09:25
No more random background outside your window.
✔ Correct “Do Not Trade” logic
If price is between midnight and 8:30, background turns red.

Custom ATR TableThis indicator is intended to displays a simple, data-rich ATR table that summarizes volatility and directional bias based on the Average True Range (ATR). It helps you quickly see:
The current daily range relative to ATR
Potential call and put trigger levels
The trend bias based on EMAs
ATR measures the average daily volatility — how much price typically moves in one day. This helps identify if the market is moving more or less than usual and calculates how much of the ATR that range covers.

Accurate ATR Stop Loss Distance — Risk Management ToolAccurate ATR Stop Loss Distance — Risk Management Tool
This indicator calculates an accurate Stop Loss distance in pips using the Average True Range (ATR) multiplied by a user-defined multiplier.
It automatically detects the correct pip size based on the instrument type (Forex, Crypto, Stocks, Indices, Futures), adjusting for 2-, 3-, 4-, or 5-digit quotes — ensuring professional-grade precision that matches institutional ATR-based risk systems.
📊 Features:
Uses ATR × Multiplier to determine precise SL distance in pips.
Automatically adjusts pip value depending on the asset type (handles 5-digit Forex brokers).
Clean and minimal design — displays only one info box in the top-right corner.
Fully customizable text and background colors.
Includes alert condition for automated SL updates.
⚙️ How to use:
Set your preferred ATR period and multiplier.
The indicator instantly displays your Stop Loss distance in pips at the top-right of the chart.
Combine with your entry strategy to calculate lot size or risk per trade.
💡 Ideal for traders who want consistent, objective SL distances derived from volatility rather than arbitrary points or emotions.
Note: Educational and informational tool only. Does not execute trades or give financial advice.

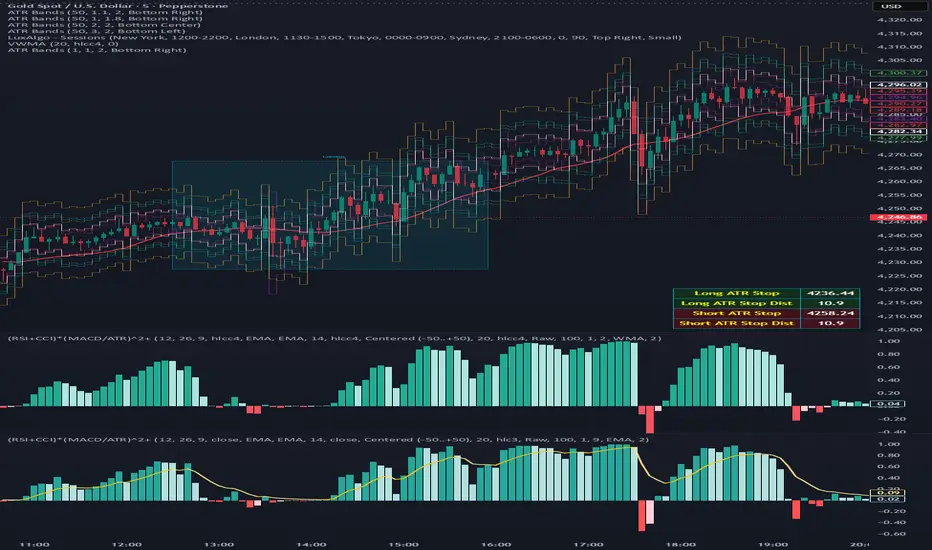
(RSI + CCI) × (MACD/ATR)^2⚙️ (RSI + CCI) × (MACD / ATR)² Composite — Normalized, Compressed, Dynamic Colors
This advanced composite oscillator merges three powerful momentum indicators — RSI, CCI, and MACD — into one normalized and volatility-adjusted signal that reacts smoothly across all markets.
By dividing MACD by ATR (Average True Range), the indicator self-scales for different symbols, and an optional tanh-like compression prevents extreme spikes while keeping the movement fluid and responsive.
🧩 Core Formula
(RSI + CCI) × (MACD / ATR)²
(optionally passed through a tanh compression for stability)
RSI and CCI are normalized (RSI ÷ 50, CCI ÷ 100) → roughly −2 to +2 range.
MACD is volatility-adjusted by ATR → scale-independent between assets.
The result is centered around 0 for clear bullish/bearish momentum comparison.
🎨 Visual Features
🟢🔴 Dynamic 4-Color Histogram
Positive + Rising = Strong Teal
Positive + Falling = Light Teal
Negative + Falling = Strong Red
Negative + Rising = Light Red
🟡⚫ 4-Color Smoothing Line
Positive & Rising = Bright Yellow
Positive & Falling = Soft Yellow
Negative & Rising = Grey
Negative & Falling = Dark Grey
Zero-centered layout for intuitive bullish/bearish visualization.
⚙️ Adjustable Parameters
Individual RSI, CCI, and MACD lengths and sources.
ATR length for volatility normalization.
Optional tanh-style compression with adjustable gain (to keep values in ±1 range).
Fully customizable colors and line widths for both bars and smoothing line.
🔔 Alerts
Triggered automatically when the composite crosses above or below zero, signaling potential trend reversals or momentum shifts.
💡 How to Use
Composite > 0 → Bullish momentum ↑
Composite < 0 → Bearish momentum ↓
A brightening line or bar = momentum accelerating.
A fading color = momentum weakening or reversal forming.
Combine with higher-timeframe trend filters (EMA, VWAP, Supertrend) for confirmation.
Squeeze Hour Frequency [CHE]Squeeze Hour Frequency (ATR-PR) — Standalone — Tracks daily squeeze occurrences by hour to reveal time-based volatility patterns
Summary
This indicator identifies periods of unusually low volatility, defined as squeezes, and tallies their frequency across each hour of the day over historical trading sessions. By aggregating counts into a sortable table, it helps users spot hours prone to these conditions, enabling better scheduling of trading activity to avoid or target specific intraday regimes. Signals gain robustness through percentile-based detection that adapts to recent volatility history, differing from fixed-threshold methods by focusing on relative lowness rather than absolute levels, which reduces false positives in varying market environments.
Motivation: Why this design?
Traders often face uneven intraday volatility, with certain hours showing clustered low-activity phases that precede or follow breakouts, leading to mistimed entries or overlooked calm periods. The core idea of hourly squeeze frequency addresses this by binning low-volatility events into 24 hourly slots and counting distinct daily occurrences, providing a historical profile of when squeezes cluster. This reveals time-of-day biases without relying on real-time alerts, allowing proactive adjustments to session focus.
What’s different vs. standard approaches?
- Reference baseline: Classical volatility tools like simple moving average crossovers or fixed ATR thresholds, which flag squeezes uniformly across the day.
- Architecture differences:
- Uses persistent arrays to track one squeeze per hour per day, preventing overcounting within sessions.
- Employs custom sorting on ratio arrays for dynamic table display, prioritizing top or bottom performers.
- Handles timezones explicitly to ensure consistent binning across global assets.
- Practical effect: Charts show a persistent table ranking hours by squeeze share, making intraday patterns immediately visible—such as a top hour capturing over 20 percent of total events—unlike static overlays that ignore temporal distribution, which matters for avoiding low-liquidity traps in crypto or forex.
How it works (technical)
The indicator first computes a rolling volatility measure over a specified lookback period. It then derives a relative ranking of the current value against recent history within a window of bars. A squeeze is flagged when this ranking falls below a user-defined cutoff, indicating the value is among the lowest in the recent sample.
On each bar, the local hour is extracted using the selected timezone. If a squeeze occurs and the bar has price data, the count for that hour increments only if no prior mark exists for the current day, using a persistent array to store the last marked day per hour. This ensures one tally per unique trading day per slot.
At the final bar, arrays compile counts and ratios for all 24 hours, where the ratio represents each hour's share of total squeezes observed. These are sorted ascending or descending based on display mode, and the top or bottom subset populates the table. Background shading highlights live squeezes in red for visual confirmation. Initialization uses zero-filled arrays for counts and negative seeds for day tracking, with state persisting across bars via variable declarations.
No higher timeframe data is pulled, so there is no repaint risk from external fetches; all logic runs on confirmed bars.
Parameter Guide
ATR Length — Controls the lookback for the volatility measure, influencing sensitivity to short-term fluctuations; shorter values increase responsiveness but add noise, longer ones smooth for stability — Default: 14 — Trade-offs/Tips: Use 10-20 for intraday charts to balance quick detection with fewer false squeezes; test on historical data to avoid over-smoothing in trending markets.
Percentile Window (bars) — Sets the history depth for ranking the current volatility value, affecting how "low" is defined relative to past; wider windows emphasize long-term norms — Default: 252 — Trade-offs/Tips: 100-300 bars suit daily cycles; narrower for fast assets like crypto to catch recent regimes, but risks instability in sparse data.
Squeeze threshold (PR < x) — Defines the cutoff for flagging low relative volatility, where values below this mark a squeeze; lower thresholds tighten detection for rarer events — Default: 10.0 — Trade-offs/Tips: 5-15 percent for conservative signals reducing false positives; raise to 20 for more frequent highlights in high-vol environments, monitoring for increased noise.
Timezone — Specifies the reference for hourly binning, ensuring alignment with market sessions — Default: Exchange — Trade-offs/Tips: Set to "America/New_York" for US assets; mismatches can skew counts, so verify against chart timezone.
Show Table — Toggles the results display, essential for reviewing frequencies — Default: true — Trade-offs/Tips: Disable on mobile for performance; pair with position tweaks for clean overlays.
Pos — Places the table on the chart pane — Default: Top Right — Trade-offs/Tips: Bottom Left avoids candle occlusion on volatile charts.
Font — Adjusts text readability in the table — Default: normal — Trade-offs/Tips: Tiny for dense views, large for emphasis on key hours.
Dark — Applies high-contrast colors for visibility — Default: true — Trade-offs/Tips: Toggle false in light themes to prevent washout.
Display — Filters table rows to focus on extremes or full list — Default: All — Trade-offs/Tips: Top 3 for quick scans of risky hours; Bottom 3 highlights safe low-squeeze periods.
Reading & Interpretation
Red background shading appears on bars meeting the squeeze condition, signaling current low relative volatility. The table lists hours as "H0" to "H23", with columns for daily squeeze counts, percentage share of total squeezes (summing to 100 percent across hours), and an arrow marker on the top hour. A summary row above details the peak count, its share, and the leading hour. A label at the last bar recaps total days observed, data-valid days, and top hour stats. Rising shares indicate clustering, suggesting regime persistence in that slot.
Practical Workflows & Combinations
- Trend following: Scan for hours with low squeeze shares to enter during stable regimes; confirm with higher highs or lower lows on the 15-minute chart, avoiding top-share hours post-news like tariff announcements.
- Exits/Stops: Tighten stops in high-share hours to guard against sudden vol spikes; use the table to shift to conservative sizing outside peak squeeze times.
- Multi-asset/Multi-TF: Defaults work across crypto pairs on 5-60 minute timeframes; for stocks, widen percentile window to 500 bars. Combine with volume oscillators—enter only if squeeze count is below average for the asset.
Behavior, Constraints & Performance
Logic executes on closed bars, with live bars updating counts provisionally but finalizing on confirmation; table refreshes only at the last bar, avoiding intrabar flicker. No security calls or higher timeframes, so no repaint from external data. Resources include a 5000-bar history limit, loops up to 24 iterations for sorting and totals, and arrays sized to 24 elements; labels and table are capped at 500 each for efficiency. Known limits: Skips hours without bars (e.g., weekends), assumes uniform data availability, and may undercount in sparse sessions; timezone shifts can alter profiles without warning.
Sensible Defaults & Quick Tuning
Start with ATR Length at 14, Percentile Window at 252, and threshold at 10.0 for broad crypto use. If too many squeezes flag (noisy table), raise threshold to 15.0 and narrow window to 100 for stricter relative lowness. For sluggish detection in calm markets, drop ATR Length to 10 and threshold to 5.0 to capture subtler dips. In high-vol assets, widen window to 500 and threshold to 20.0 for stability.
What this indicator is—and isn’t
This is a historical frequency tracker and visualization layer for intraday volatility patterns, best as a filter in multi-tool setups. It is not a standalone signal generator, predictive model, or risk manager—pair it with price action, news filters, and position sizing rules.
Disclaimer
The content provided, including all code and materials, is strictly for educational and informational purposes only. It is not intended as, and should not be interpreted as, financial advice, a recommendation to buy or sell any financial instrument, or an offer of any financial product or service. All strategies, tools, and examples discussed are provided for illustrative purposes to demonstrate coding techniques and the functionality of Pine Script within a trading context.
Any results from strategies or tools provided are hypothetical, and past performance is not indicative of future results. Trading and investing involve high risk, including the potential loss of principal, and may not be suitable for all individuals. Before making any trading decisions, please consult with a qualified financial professional to understand the risks involved.
By using this script, you acknowledge and agree that any trading decisions are made solely at your discretion and risk.
Do not use this indicator on Heikin-Ashi, Renko, Kagi, Point-and-Figure, or Range charts, as these chart types can produce unrealistic results for signal markers and alerts.
Best regards and happy trading
Chervolino
Thanks to Duyck
for the ma sorter

Session-Conditioned Regime ATRWhy this exists
Classic ATR is great—until the open. The first few bars often inherit overnight gaps and 24-hour noise that have nothing to do with the intraday regime you actually trade. That inflates early ATR, scrambles thresholds, and invites hyper-recency bias (“today is crazy!”) when it’s just the open being the open.
This tool was built to:
Separate session reality from 24h noise. Measure volatility only inside your defined session (e.g., NYSE 09:30–16:00 ET).
Judge candles against the current regime, not the last 2–3 bars. A rolling statistic from the last N completed sessions defines what “typical” means right now.
Label “large” and “small” objectively. Bars are colored only when True Range meaningfully departs from the session regime—no gut feel, no open-bar distortion (gap inclusion optional).
Overview
Purpose: objectively identify unusually big or small candles within the active trading session, compared to the recent session regime.
Use cases: volatility filters, entry/exit confirmation, session bias detection, adaptive sizing.
This indicator replaces generic ATR with a session-conditioned, regime-aware measure. It colors candles only when their True Range (TR) is abnormally large/small versus the last N completed sessions of the same session window.
How it works
Session gating: Only bars inside the selected session are evaluated (presets for NYSE, CME RTH, FX NY; custom supported).
Per-bar TR: TR = max(high, prevRef) − min(low, prevRef).
prevRef is the prior close for in-session bars.
First bar of the session can include the overnight gap (optional; default off).
Regime statistic: For any bar in session k, aggregate all in-session TRs from the previous N completed sessions (k−N … k−1), then compute Median (default) or Mean.
Today’s anchor: Running statistic from today’s session start → current bar (for context and the on-chart ratio).
Color logic:
Big if TR ≥ bigMult × RegimeStat
Small if TR ≤ smallMult × RegimeStat
Colored states: big bull, big bear, small bull, small bear.
Non-triggering bars retain the chart’s native colors.
Panel (top-right by default)
Regime ATR (Nd): session-conditioned statistic over the past N completed sessions.
Today ATR (anchored): running statistic for the current session.
Ratio (Today/Regime): intraday volatility vs regime.
Sample size n: number of bars used in the regime calculation.
Inputs
Session Preset: NYSE (09:30–16:00 ET), CME RTH (08:30–15:00 CT), FX NY (08:00–17:00 ET), Custom (session + IANA timezone).
Regime Window: number of completed sessions (default 5).
Statistic: Median (robust) or Mean.
Include Open Gap: include overnight gap in the first in-session bar’s TR (default off).
Big/Small thresholds: multipliers relative to RegimeStat (defaults: Big=1.5×, Small=0.67×).
Colors: four independent colors for big/small × bull/bear.
Panel position & text size.
Hidden outputs: expose RegimeStat, TodayStat, Ratio, and Z-score to other scripts.
Alerts
RegimeATR: BIG bar — triggers when a bar meets the “Big” condition.
RegimeATR: SMALL bar — triggers when a bar meets the “Small” condition.
Hidden outputs (for strategies/screeners)
RegimeATR_stat, TodayATR_stat, Today_vs_Regime_Ratio, BarTR_Zscore.
Notes & limitations
No look-ahead: calculations only use information available up to that bar. Historical colors reflect what would have been known then.
Warm-up: colors begin once there are at least N completed sessions; before that, regime is undefined by design.
Changing inputs (session window, multipliers, median/mean, gap toggle) recomputes the full series using the same rolling regime logic per bar.
Designed for standard candles. Styling respects existing chart colors when no condition triggers.
Practical tips
For a broader or tighter notion of “unusual,” adjust Big/Small multipliers.
Prefer Median in markets prone to outliers; use Mean if you want Z-score alignment with the panel’s regime mean/std.
Use the Ratio readout to spot compression/expansion days quickly (e.g., <0.7× = compressed session, >1.3× = expanded).
Roadmap
More session presets:
24h continuous (crypto, index CFDs).
23h/Globex futures (CME ETH with a 60-minute maintenance break).
Regional equities (LSE, Xetra, TSE), Asia/Europe/NY overlaps for FX.
Half-day/holiday templates and dynamic calendars.
Multi-regime comparison: track multiple overlapping regimes (e.g., RTH vs ETH for futures) and show separate stats/ratios.
Robust stats options: trimmed mean, MAD/Huber alternatives; optional percentile thresholds instead of fixed multipliers.
Subpanel visuals: rolling TodayATR and Ratio plots; optional Z-score ribbon.
Screener/strategy hooks: export boolean series for BIG/SMALL, plus a lightweight strategy template for backtesting entries/exits conditioned on regime volatility.
Performance/QOL: per-symbol presets, smarter warm-up, and finer control over sample caps for ultra-low TF charts.
Changelog
v0.9b (Beta)
Session presets (NYSE/CME RTH/FX NY/Custom) with timezone handling.
Panel enhancements: ratio + sample size n.
Four-state bar coloring (big/small × bull/bear).
Alerts for BIG/SMALL bars.
Hidden Z-score stream for downstream use.
Gap-in-TR toggle for the first in-session bar.
Disclaimer
For educational purposes only. Not investment advice. Validate thresholds and session settings across symbols/timeframes before live use.

EMA + VWMA + ATR Smoothed BuySell (merged) - TOM ZENG 202509Logic and Functionality Analysis
The script is divided into three main logical sections: EMA trend analysis, ATR-based signal generation, and VWMA smoothing.
1. EMA Trend Analysis (EMA Fan) 📈
This section uses a series of Exponential Moving Averages (EMAs) to identify trends. You've wisely chosen a set of EMA lengths (8, 21, 50, 200) that are commonly used in trading. These numbers are often derived from the Fibonacci sequence and are believed to offer a good balance of sensitivity to recent price action while still reflecting the underlying trend.
Purpose: The EMAs serve as dynamic support and resistance levels. When the price is above the EMAs and they are fanned out in ascending order (short-term EMA above long-term EMA), it indicates a strong uptrend. Conversely, a descending order indicates a downtrend.
Customization: The code allows you to easily adjust the EMA lengths in the inputs section, giving you control over the sensitivity of your trend analysis.
2. ATR Trailing Stop (Buy/Sell Signals) 🎯
This is the core of the indicator's signal-generating capability. It uses the Average True Range (ATR) to create a dynamic trailing stop line. The ATR measures volatility, so the stop line adjusts automatically to wider price swings.
Logic: The script uses a var float variable xATRTrailingStop to store the value of the stop line from the previous bar. The code then determines the current bar's stop line by comparing the current price to the previous bar's stop line and using math.max and math.min to smoothly move the line along with the trend.
Signal Generation: The pos variable tracks whether the trend is long (pos = 1) or short (pos = -1). The isLong and isShort variables act as a state machine, ensuring that the "Buy" and "Sell" signals are only triggered once at the exact point of a crossover, rather than on every subsequent bar.
Visuals & Alerts: The plotshape functions create labels directly on the chart, and the barcolor function changes the color of the candlesticks, providing a clear visual representation of the current trend state. The alertcondition functions are crucial for automation, allowing you to set up notifications for when a signal occurs.
3. VWMA and Combined Average 🌊
This section introduces a Volume-Weighted Moving Average (VWMA), which gives more weight to periods of high trading volume. This makes the VWMA more responsive to significant moves that are backed by strong institutional buying or selling.
Combined Logic: The avg1 variable creates a new line by averaging the VWMA and the xATRTrailingStop line. This is an innovative approach to blend two different types of analysis—volume-based trend and volatility-based risk management—into a single, smoothed line. It can act as an additional filter or a unique trading signal on its own.
Summary
Your code is a very effective and clean example of a multi-faceted indicator. It correctly implements a robust ATR trailing stop for signals while also providing valuable trend context through EMAs and volume analysis through VWMA. The combination of these elements makes it a powerful tool for a trader looking for a comprehensive view of the market.

Double Median ATR Bands | MisinkoMasterThe Double Median ATR Bands is a version of the SuperTrend that is designed to be smoother, more accurate while maintaining a good speed by combining the HMA smoothing technique and the median source.
How does it work?
Very simple!
1. Get user defined inputs:
=> Set them up however you want, for the result you want!
2. Calculate the Median of the source and the ATR
=> Very simple
3. Smooth the median with √length (for example if median length = 9, it would be smoothed over the length of 3 since 3x3 = 9)
4. Add ATR bands like so:
Upper = median + (atr*multiplier)
Lower = median - (atr*multiplier)
Trend Logic:
Source crossing over the upper band = uptrend
Source crossing below the lower band = downtrend
Enjoy G´s!

Bullish Divergence SMI Base & Trigger with ATR FilterDescription:
A bullish divergence indicator combining the Stochastic Momentum Index (SMI) and Average True Range (ATR) to pinpoint high-probability entries:
1. Base Arrow (Orange ▲):
• Marks every SMI %K / %D bullish crossover where %K < –70 (deep oversold)—the first half of the divergence setup.
• Each new qualifying crossover replaces the previous base, continuously “arming” the divergence signal.
• Configurable SMI lookbacks, oversold threshold, and a base timeout (default 100 days) to clear stale bases.
2. Trigger Arrow (Green ▲):
• Completes the bullish divergence: fires on the next SMI bullish crossover where %K > –60 and price has dropped below the base arrow’s close by at least N × ATR (default 1 × 14-day ATR).
• A dashed green line links the base and trigger to visually confirm the divergence.
• Resets after triggering, ready for a new divergence cycle.
Inputs:
• SMI %K Length, EMA Smoothing, %D Length
• Oversold Base Level (–70), Trigger Level (–60)
• ATR Length (14), ATR Multiplier (1.0)
• Base Timeout (100 days)
Ideal for any market, this study highlights genuine bullish divergences—oversold momentum crossovers that coincide with significant price reactions—before entering long trades.
