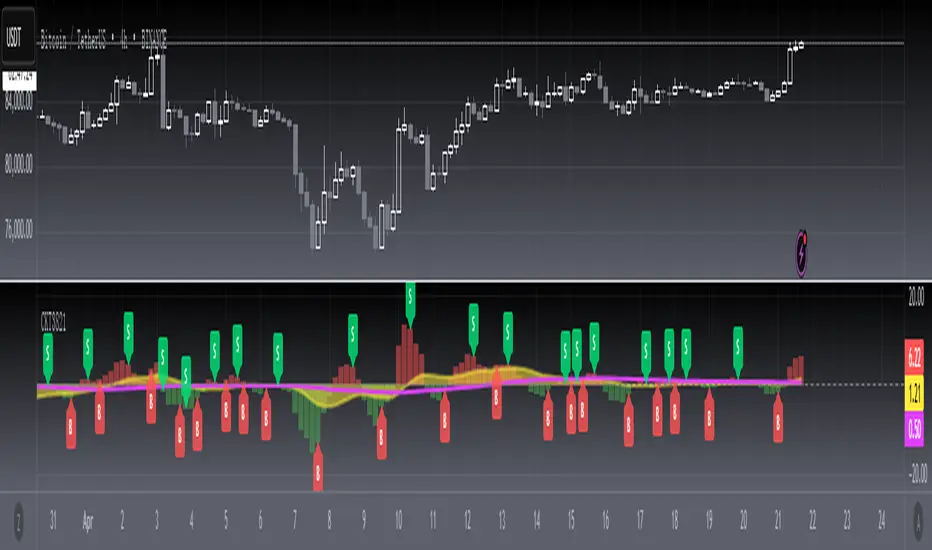
[blackcat] L3 Candle Skew 3821 TraderLevel 3
Background
By modeling skew to produce long and short entry points.
Function
The concept of skew comes from physics and statistics, and is used in market technical analysis to reflect the expectation of future stock price distribution. Because the return distribution of stocks in the trend market has skew (Skew), it is reasonable to judge the trend continuity according to the historical and current skew. It is precisely because the stock price rises that there is a skew. The greater the strength of the rise, the greater the angle of inclination and the greater the skew. The degree of this upward or downward slope in the statistical distribution of stock prices is defined as skew. Through the size of skew, we can know the direction, inertia and extent of the stock's rise or fall, and find stocks with a high probability of quick profit. The technical indicator introduced today is a simplified but effective stock price skew model used to generate buying and selling points.
The principle of this technical indicator is based on the success rate test results of different moving averages corresponding to different skews as follows:
10 trading cycles profit 5% success rate (%)
5 period moving average 10 period moving average 20 period moving average 30 period moving average 60 period moving average
skew>=0 51.36 52.26 52.65 52.55 52.08
skew>=0.5 55.44 58.06 60.56 62.37 65.66
skew>=1 59.72 63.06 67.07 69.78 70.62
skew>=1.5 63.01 67.08 71.61 72.9 70.61
skew>=2 65.53 70.22 74.18 73.76 70.12
skew>=2.5 67.89 72.93 75.32 73.66 68.92
skew>=3 70.07 75.32 75.69 72.54 67.45
skew>=3.5 71.85 77.05 75.32 73.63 63.82
skew>=4 73.6 78.06 74.19 68.96 59.91
skew>=4.5 76.04 78.56 72.85 69.55 49.24
skew>=5 77.44 78.88 71.58 67.28 51.69
skew>=5.5 78.97 78.39 70.33 64.31 49.7
skew>=6 79.68 78.07 68.82 61.65 53.57
Table 1
As can be seen from the above table, with the increase of the 5-period and 10-period moving average skew values, the success rate is increasing, but after the 20- and 30-period moving average skew values increase to an upper bound, it shows a downward trend. When the skew of the 20-period and 30-period moving averages is greater than 0.5, the 10-period profit of 5% is above 60%, and when it is greater than 1.5, the success rate can reach above 70%. The larger the 5-period moving average skew, the higher the success rate, but often because the short-term skew is too large, the stock price has risen rapidly to a high level, and chasing up is risky, which is not suitable for the investment habits of most people, so prudent investors may like to do swings. Investors may wish to pay more attention to the skew of the 20-period and 30-period moving averages. Based on the above analysis, as a short-term trading enthusiast, I need to choose the 5-period and 10-period moving average skew, and consider the medium-term trend as a compromise, and I also need to consider the 20-period moving average skew. Finally, according to the principle of personal preference, I chose 3 groups of periods based on Fibonacci magic numbers: 3 periods, 8 periods, 21 periods, and skews that take into account both short-term and mid-line trends. So, I named this indicator number 3821 as a distinction.
002084 1D from TradingView
BTCUSDT 1H from TradingView
Tesla 1D from TradingView
Search in scripts for "A股+股票筛选器+10元以下"
GT 5.1 Strategy═════════════════════════════════════════════════════════════════════════
█ OVERVIEW
People often look an indicator in their technical analysis to enter a position. We may also need to look at the signals of one or more indicators to verify the signals given by some indicators. In this context, I developed a strategy to test whether it really works by choosing some of the indicators that capture trend changes with the same characteristics. Also, since the subject is to catch the trend change, I thought it would be right to include an indicator using the heikin ashi logic. By averaging and smoothing the market noise, Heiken Ashi makes it easier to detect the direction of the trend helps to see possible reversal points on the chart. However, it should be noted that Heiken Ashi is a lagging indicator.
I picked 5 different indicators (but their purpose are similar) and combined them to produce buy and sell signals based on your choice(not repaint). First of all let's get some information about our indicators. So you will understand me why i picked these indicators and what is the meaning of their signals.
1 — Coral Trend Indicator by LazyBear
Coral Trend Indicator is a linear combination of moving averages, all obtained by a triple or higher order exponential smoothing. The indicator comes with a trend indication which is based on the normalized slope of the plot. the usage of this indicator is simple. When the color of the line is green that means the market is in uptrend. But when the color is red that means the market is in downtrend.
As you see the original indicator it is simple to find is it in uptrend or downtrend.
So i added a code to find when the color of the line change. When it turns green to red my script giving sell signals, when it turns red to green it gives buy signals.
I hide the candles to show you more clearly what is happening when you choose only Coral Strategy. But sometimes it is not enough only using itself. Even if green dots turn to red it continues in uptrend. So we need a to look another indicator to approve our signal.
2 — SSL channel by ErwinBeckers
Known as the SSL , the Semaphore Signal Level channel is an indicator that combines moving averages to provide you with a clear visual signal of price movement dynamics. In short, it's designed to show you when a price trend is forming. This indicator creates a band by calculating the high and low values according to the determined period. Simply if you decide 10 as period, it calculates a 10-period moving average on the latest 10 highs. Calculate a 10-period moving average on the latest 10 lows. If the price falls below the low band, the downtrend begins, if the price closes above the high band, the uptrend begins. Lets look the original form of indicator and learn how it using.
If the red line is below and the green band is above, it means that we are in uptrend, and if it is on the opposite side, it means that we are in downtrend. Therefore, it would be logical to enter a position where the trend has changed. So i added a code to find when the crossover has occured.
As you see in my strategy, it gives you signals when the trend has changed. But sometimes it is not enough only using this indicator itself. So lets look 2 indicator together in one chart.
Look circle SSL is saying it is in downtrend but Coral is saying it has entered in uptrend. if we just look to coral signal it can misleads us. So it can be better to look another indicator for validating our signals.
3 — Heikin Ashi RSI Oscillator by JayRogers
The Heikin-Ashi technique is used by technical traders to identify a given trend more easily. Heikin-Ashi has a smoother look because it is essentially taking an average of the movement. There is a tendency with Heikin-Ashi for the candles to stay red during a downtrend and green during an uptrend, whereas normal candlesticks alternate color even if the price is moving dominantly in one direction. This indicator actually recalculates the RSI indicator with the logic of heikin ashi. Due to smoothing, the bars are formed with a slight lag, reflecting the trend rather than the exact price movement. So lets look the original version to understand more clearly. If red bars turn to green bars it means uptrend may begin, if green bars turn to red it means downtrend may begin.
As you see HARSI giving lots of signal some of them is really good but some of them are not very well. Because it gives so much signals Now i will change time period and lets look same chart again.
Now results are better because of heikin ashi's logic. it is not suitable for day traders, it gives more accurate result when using the time period is longer. But it can be useful to use this indicator in short time periods using with other indicators. So you may catch the trend changes more accurately.
4 — MACD DEMA by ToFFF
This indicator uses a double EMA and MACD algorithm to analyze the direction of the trend. Though it might seem a tough task to manage the trades with the help of MACD DEMA once you know how the proper way to interpret the signal lines, it will be an easy task.
This indicator also smoothens the signal lines with the time series algorithm which eventually makes the higher time frame important. So, expecting better results in the lower time frame can result in big losses as the data reading from the MACD DEMA will not be accurate. In order to understand the function of this indicator, you have to know the functions of the EMA also.
The exponential moving average tends to give more priority to the recent price changes. So, expecting better results when the volatility is very high is a very risky approach to trade the market. Moreover, the MACD has some lagging issues compared to the EMA, so it is super important to use a trading method that focuses on the higher time frame only. What does MACD 12 26 Close 9 mean? When the DEMA-9 crosses above the MACD(12,26), this is considered a bearish signal. It means the trend in the stock – its magnitude and/or momentum – is starting to shift course. When the MACD(12,26) crosses above the DEMA-9, this is considered a bullish signal. Lets see this indicator on Chart.
When the blue line crossover red line it is good time to buy. As you see from the chart i put arrows where the crossover are appeared.
When the red line crossover blue line it is good time to sell or exit from position.
5 — WaveTrend Oscillator by LazyBear
This is a technical indicator that creates high and low bands between two values. It then creates a trend indicator that draws waves with highs and lows within these boundaries. WaveTrend is a widely used indicator for finding direction of an asset.
Calculation period: number of candles used to calculate WaveTrend, defaults to 10. Averaging period: number of candles used to average WaveTrend, defaults to 21.
As you see in chart when the lines crossover occured my strategy gives buy or sell signals.
═════════════════════════════════════════════════════════════════════════
█ HOW TO USE
I hope you understand how the indicators I mentioned above work and what they are used for. Now, I will explain in detail how to use the strategy I have created.
When you enter the settings section, you will see 5 types of indicators. If you want to use the signals of the indicators, simply tick the box next to the indicators. Also, under each option there is an area where you can set the "lookback". This setting is a field that will make the signals overlap when you select more than one option. If you are going to trade with only one option, you should make sure that this field is 0. Otherwise, it may continue to generate as many signals as you choose.
Lets see in chart for easy understanding.
As you see chart, if i chose only HARSI with lookback 0 (HARSI and CORAL should be 1 minumum because of algorithm-we looking 1 bar before, others 0 because we are looking crossovers), it will give signals only when harsı bar's color changed. But when i changed Lookback as 7 it will be like this in chart.
Now i will choose 2 indicator with settings of their lookback 0.
As you see it will give signals when both of them occurs same time. But HARSI is an indicator giving very early signal so we can enter position 5-6 bars after the first bar color change. So i will change HARSI Lookback settings as 7. Lets look what happens when we use lookback option.
So it wil be useful to change lookback settings to find best signals in each time period and in each symbol. But it shouldnt be too high. Because you can be late to catch trend's starting.
this is an image of MACD and WAVE trend used and lookback option are both 6.
Now lets see an example with 3 options are chosen with lookback option 11-1-5
Now lets talk about indicators settings. After strategy options you will see each indicators settings, you can change their settings as you desired. So each indicators signal will be changed according to your adjustment.
I left strategy options with default settings. You can change it manually as if you want.
═════════════════════════════════════════════════════════════════════════
█ LIMITATIONS: Don't rely on non-standard charts results. For example Heikin Ashi is a technical analysis method used with the traditional candlestick chart.Heikin Ashi vs. Candlestick Chart: The decisive visual difference between Heikin Ashi and the traditional chart is that Heikin Ashi flattens the traditional candlestick chart using a modified formula.
The primary advantage of Heikin Ashi is that it makes the chart more reader-friendly and helps users identify and analyze trends .
Because Heikin Ashi provides averaged price information rather than real-time price and reacts slowly to volatility — not suitable for scalpers and high-frequency traders. I added HARSI indicator as a supportive signal because it is useful with using CORAL and SSL channel indicators. If you change your candle types to Heikin Ashi , your profit will change in good way but dont rely on it.
═════════════════════════════════════════════════════════════════════════
█ THANKS:
Special thanks to authors of the scripts that i used.
@LazyBear and @ErwinBeckers and @JayRogers and @ToFFF
═════════════════════════════════════════════════════════════════════════
█ DISCLAIMER
Any trade decisions you make are entirely your own responsibility.

STD/C-Filtered, N-Order Power-of-Cosine FIR Filter [Loxx]STD/C-Filtered, N-Order Power-of-Cosine FIR Filter is a Discrete-Time, FIR Digital Filter that uses Power-of-Cosine Family of FIR filters. This is an N-order algorithm that turns the following indicator from a static max 16 orders to a N orders, but limited to 50 in code. You can change the top end value if you with to higher orders than 50, but the signal is likely too noisy at that level. This indicator also includes a clutter and standard deviation filter.
See the static order version of this indicator here:
STD/C-Filtered, Power-of-Cosine FIR Filter
Amplitudes for STD/C-Filtered, N-Order Power-of-Cosine FIR Filter:
What are FIR Filters?
In discrete-time signal processing, windowing is a preliminary signal shaping technique, usually applied to improve the appearance and usefulness of a subsequent Discrete Fourier Transform. Several window functions can be defined, based on a constant (rectangular window), B-splines, other polynomials, sinusoids, cosine-sums, adjustable, hybrid, and other types. The windowing operation consists of multipying the given sampled signal by the window function. For trading purposes, these FIR filters act as advanced weighted moving averages.
What is Power-of-Sine Digital FIR Filter?
Also called Cos^alpha Window Family. In this family of windows, changing the value of the parameter alpha generates different windows.
f(n) = math.cos(alpha) * (math.pi * n / N) , 0 ≤ |n| ≤ N/2
where alpha takes on integer values and N is a even number
General expanded form:
alpha0 - alpha1 * math.cos(2 * math.pi * n / N)
+ alpha2 * math.cos(4 * math.pi * n / N)
- alpha3 * math.cos(4 * math.pi * n / N)
+ alpha4 * math.cos(6 * math.pi * n / N)
- ...
Special Cases for alpha:
alpha = 0: Rectangular window, this is also just the SMA (not included here)
alpha = 1: MLT sine window (not included here)
alpha = 2: Hann window (raised cosine = cos^2)
alpha = 4: Alternative Blackman (maximized roll-off rate)
This indicator contains a binomial expansion algorithm to handle N orders of a cosine power series. You can read about how this is done here: The Binomial Theorem
What is Pascal's Triangle and how was it used here?
In mathematics, Pascal's triangle is a triangular array of the binomial coefficients that arises in probability theory, combinatorics, and algebra. In much of the Western world, it is named after the French mathematician Blaise Pascal, although other mathematicians studied it centuries before him in India, Persia, China, Germany, and Italy.
The rows of Pascal's triangle are conventionally enumerated starting with row n = 0 at the top (the 0th row). The entries in each row are numbered from the left beginning with k=0 and are usually staggered relative to the numbers in the adjacent rows. The triangle may be constructed in the following manner: In row 0 (the topmost row), there is a unique nonzero entry 1. Each entry of each subsequent row is constructed by adding the number above and to the left with the number above and to the right, treating blank entries as 0. For example, the initial number in the first (or any other) row is 1 (the sum of 0 and 1), whereas the numbers 1 and 3 in the third row are added to produce the number 4 in the fourth row.
Rows of Pascal's Triangle
0 Order: 1
1 Order: 1 1
2 Order: 1 2 1
3 Order: 1 3 3 1
4 Order: 1 4 6 4 1
5 Order: 1 5 10 10 5 1
6 Order: 1 6 15 20 15 6 1
7 Order: 1 7 21 35 35 21 7 1
8 Order: 1 8 28 56 70 56 28 8 1
9 Order: 1 9 36 34 84 126 126 84 36 9 1
10 Order: 1 10 45 120 210 252 210 120 45 10 1
11 Order: 1 11 55 165 330 462 462 330 165 55 11 1
12 Order: 1 12 66 220 495 792 924 792 495 220 66 12 1
13 Order: 1 13 78 286 715 1287 1716 1716 1287 715 286 78 13 1
For a 12th order Power-of-Cosine FIR Filter
1. We take the coefficients from the Left side of the 12th row
1 13 78 286 715 1287 1716 1716 1287 715 286 78 13 1
2. We slice those in half to
1 13 78 286 715 1287 1716
3. We reverse the array
1716 1287 715 286 78 13 1
This is our array of alphas: alpha1, alpha2, ... alphaN
4. We then pull alpha one from the previous order, order 11, the middle value
11 Order: 1 11 55 165 330 462 462 330 165 55 11 1
The middle value is 462, this value becomes our alpha0 in the calculation
5. We apply these alphas to the cosine calculations
example: + alpha4 * math.cos(6 * math.pi * n / N)
6. We then divide by the sum of the alphas to derive our final coefficient weighting kernel
**This is only useful for orders that are EVEN, if you use odd ordering, the following are the coefficient outputs and these aren't useful since they cancel each other out and result in a value of zero. See below for an odd numbered oder and compare with the amplitude of the graphic posted above of the even order amplitude:
What is a Standard Deviation Filter?
If price or output or both don't move more than the (standard deviation) * multiplier then the trend stays the previous bar trend. This will appear on the chart as "stepping" of the moving average line. This works similar to Super Trend or Parabolic SAR but is a more naive technique of filtering.
What is a Clutter Filter?
For our purposes here, this is a filter that compares the slope of the trading filter output to a threshold to determine whether to shift trends. If the slope is up but the slope doesn't exceed the threshold, then the color is gray and this indicates a chop zone. If the slope is down but the slope doesn't exceed the threshold, then the color is gray and this indicates a chop zone. Alternatively if either up or down slope exceeds the threshold then the trend turns green for up and red for down. Fro demonstration purposes, an EMA is used as the moving average. This acts to reduce the noise in the signal.
Included
Bar coloring
Loxx's Expanded Source Types
Signals
Alerts

STD-Stepped, Variety N-Tuple Moving Averages [Loxx]STD-Stepped, Variety N-Tuple Moving Averages is the standard deviation stepped/filtered indicator of the following indicator
Variety N-Tuple Moving Averages is a moving average indicator that allows you to create 1- 30 tuple moving average types; i.e., Double-MA, Triple-MA, Quadruple-MA, Quintuple-MA, ... N-tuple-MA. This version contains 5 different moving average types including T3. A list of tuples can be found here if you'd like to name the order of the moving average by depth: Tuples extrapolated
STD-Stepped, You'll notice that this is a lot of code and could normally be packed into a single loop in order to extract the N-tuple MA, however due to Pine Script limitations and processing paradigm this is not possible ... yet.
If you choose the EMA option and select a depth of 2, this is the classic DEMA ; EMA with a depth of 3 is the classic TEMA , and so on and so forth this is to help you understand how this indicator works. This version of NTMA is restricted to a maximum depth of 30 or less. Normally this indicator would include 50 depths but I've cut this down to 30 to reduce indicator load time. In the future, I'll create an updated NTMA that allows for more depth levels.
This is considered one of the top ten indicators in forex. You can read more about it here: forex-station.com
How this works
Step 1: Run factorial calculation on the depth value,
Step 2: Calculate weights of nested moving averages
factorial(nemadepth) / (factorial(nemadepth - k) * factorial(k); where nemadepth is the depth and k is the weight position
Examples of coefficient outputs:
6 Depth: 6 15 20 15 6
7 Depth: 7 21 35 35 21 7
8 Depth: 8 28 56 70 56 28 8
9 Depth: 9 36 34 84 126 126 84 36 9
10 Depth: 10 45 120 210 252 210 120 45 10
11 Depth: 11 55 165 330 462 462 330 165 55 11
12 Depth: 12 66 220 495 792 924 792 495 220 66 12
13 Depth: 13 78 286 715 1287 1716 1716 1287 715 286 78 13
Step 3: Apply coefficient to each moving average
For QEMA, which is 5 depth EMA , the caculation is as follows
ema1 = ta. ema ( src , length)
ema2 = ta. ema (ema1, length)
ema3 = ta. ema (ema2, length)
ema4 = ta. ema (ema3, length)
ema5 = ta. ema (ema4, length)
qema = 5 * ema1 - 10 * ema2 + 10 * ema3 - 5 * ema4 + ema5
Included:
Alerts
Loxx's Expanded Source Types
Bar coloring
Signals
Standard deviation stepping

Variety N-Tuple Moving Averages [Loxx]Variety N-Tuple Moving Averages is a moving average indicator that allows you to create 1- 30 tuple moving average types; i.e., Double-MA, Triple-MA, Quadruple-MA, Quintuple-MA, ... N-tuple-MA. This version contains 5 different moving average types including T3. A list of tuples can be found here if you'd like to name the order of the moving average by depth: Tuples extrapolated
You'll notice that this is a lot of code and could normally be packed into a single loop in order to extract the N-tuple MA, however due to Pine Script limitations and processing paradigm this is not possible ... yet.
If you choose the EMA option and select a depth of 2, this is the classic DEMA; EMA with a depth of 3 is the classic TEMA, and so on and so forth this is to help you understand how this indicator works. This version of NTMA is restricted to a maximum depth of 30 or less. Normally this indicator would include 50 depths but I've cut this down to 30 to reduce indicator load time. In the future, I'll create an updated NTMA that allows for more depth levels.
This is considered one of the top ten indicators in forex. You can read more about it here: forex-station.com
How this works
Step 1: Run factorial calculation on the depth value,
Step 2: Calculate weights of nested moving averages
factorial(nemadepth) / (factorial(nemadepth - k) * factorial(k); where nemadepth is the depth and k is the weight position
Examples of coefficient outputs:
6 Depth: 6 15 20 15 6
7 Depth: 7 21 35 35 21 7
8 Depth: 8 28 56 70 56 28 8
9 Depth: 9 36 34 84 126 126 84 36 9
10 Depth: 10 45 120 210 252 210 120 45 10
11 Depth: 11 55 165 330 462 462 330 165 55 11
12 Depth: 12 66 220 495 792 924 792 495 220 66 12
13 Depth: 13 78 286 715 1287 1716 1716 1287 715 286 78 13
Step 3: Apply coefficient to each moving average
For QEMA, which is 5 depth EMA, the caculation is as follows
ema1 = ta.ema(src, length)
ema2 = ta.ema(ema1, length)
ema3 = ta.ema(ema2, length)
ema4 = ta.ema(ema3, length)
ema5 = ta.ema(ema4, length)
qema = 5 * ema1 - 10 * ema2 + 10 * ema3 - 5 * ema4 + ema5
Included:
Alerts
Loxx's Expanded Source Types
Bar coloring

Inside Bar SetupScript Details
- This script plots Inside Bar for given day in selected time-frame (applicable only for Timeframes < Day)
- Basis plotted inside bar, relevant targets are marked on the chart
- Targets can be customised from script settings. Example, if range of mother candle is 10 points, then T1 is 10 * x above/below mother candle and T2 is 10 * y above/below mother candle. This x & y are configured via script settings
How to use this script ?
- This script works well on 10-15 mins timeframe for stocks, 15/30 mins timeframe for nifty index and 30/60 mins time frame for bank nifty index
- If mother candle high is broken, take long trade with SL of mother candle low and if low is broken, take short trade with SL of mother candle high
Remember:
1. Above logic is to be combined with support/resistances i.e. price action. This script is an add-on to price action analysis giving you more conviction.
2. If range of mother candle is very high, it is recommended to avoid the trade.
3. Basis inside bar formed on higher time frame, take trade on basis of lower time frame i.e if inside bar is formed on 60 mins, take trade on the basis of 10-15 mins time frame
Example:
1. As seen in the chart, Nifty is near it's resistance and we are seeing Inside Bar being formed, In such scenario, even if High of Mother Candle is broken, we should be more interested to short as we are near resistance and probability of getting our targets in long side is less.
2. So, if I see breakdown of mother candle i.e. price going below low of mother candle, we will short with SL of high of mother candle.
3. As seen in the chart, both the targets are achieved.
Additional Info:
1. Targets on Long/Short Side can be configured via settings. For indices 1 times/1.5 times the range works well.
2. This script plots targets basis the first inside bar formed in the day for selected time frame.
3. Inside bars formed through out the day are coloured separately but lines are plotted only on the basis of 1st formed inside bar as this strategy works well for the first formed inside bar)
4. Don't forget to check volume in case of breakout/breakdown.
Note:
1. Mother Candle - First Candle of Inside Bar
2. Child Candle - Candle formed inside Mother Candle (Second Candle of Inside Bar)
Happy Trading :)

Smoothed Heikin Ashi Trend on Chart - TraderHalai BACKTESTSmoothed Heikin Ashi Trend on chart - Backtest
This is a backtest of the Smoothed Heikin Ashi Trend indicator, which computes the reverse candle close price required to flip a Heikin Ashi trend from red to green and vice versa. The original indicator can be found in the scripts section of my profile.
This particular back test uses this indicator with a Trend following paradigm with a percentage-based stop loss.
Note, that backtesting performance is not always indicative of future performance, but it does provide some basis for further development and walk-forward / live testing.
Testing was performed on Bitcoin , as this is a primary target market for me to use this kind of strategy.
Sample Backtesting results as of 10th June 2022:
Backtesting parameters:
Position size: 10% of equity
Long stop: 1% below entry
Short stop: 1% above entry
Repainting: Off
Smoothing: SMA
Period: 10
8 Hour:
Number of Trades: 1046
Gross Return: 249.27 %
CAGR Return: 14.04 %
Max Drawdown: 7.9 %
Win percentage: 28.01 %
Profit Factor (Expectancy): 2.019
Average Loss: 0.33 %
Average Win: 1.69 %
Average Time for Loss: 1 day
Average Time for Win: 5.33 days
1 Day:
Number of Trades: 429
Gross Return: 458.4 %
CAGR Return: 15.76 %
Max Drawdown: 6.37 %
Profit Factor (Expectancy): 2.804
Average Loss: 0.8 %
Average Win: 7.2 %
Average Time for Loss: 3 days
Average Time for Win: 16 days
5 Day:
Number of Trades: 69
Gross Return: 1614.9 %
CAGR Return: 26.7 %
Max Drawdown: 5.7 %
Profit Factor (Expectancy): 10.451
Average Loss: 3.64 %
Average Win: 81.17 %
Average Time for Loss: 15 days
Average Time for Win: 85 days
Analysis:
The strategy is typical amongst trend following strategies with a less regular win rate, but where profits are more significant than losses. Most of the losses are in sideways, low volatility markets. This strategy performs better on higher timeframes, where it shows a positive expectancy of the strategy.
The average win was positively impacted by Bitcoin’s earlier smaller market cap, as the percentage wins earlier were higher.
Overall the strategy shows potential for further development and may be suitable for walk-forward testing and out of sample analysis to be considered for a demo trading account.
Note in an actual trading setup, you may wish to use this with volatility filters, combined with support resistance zones for a better setup.
As always, this post/indicator/strategy is not financial advice, and please do your due diligence before trading this live.
Original indicator links:
On chart version -
Oscillator version -
Update - 27/06/2022
Unfortunately, It appears that the original script had been taken down due to auto-moderation because of concerns with no slippage / commission. I have since adjusted the backtest, and re-uploaded to include the following to address these concerns, and show that I am genuinely trying to give back to the community and not mislead anyone:
1) Include commission of 0.1% - to match Binance's maker fees prior to moving to a fee-less model.
2) Include slippage of 10 ticks (This is a realistic slippage figure from searching online for most crypto exchanges)
3) Adjust account balance to 10,000 - since most of us are not millionaires.
The rest of the backtesting parameters are comparable to previous results:
Backtesting parameters:
Initial capital: 10000 dollars
Position size: 10% of equity
Long stop: 2% below entry
Short stop: 2% above entry
Repainting: Off
Smoothing: SMA
Period: 10
Slippage: 10 ticks
Commission: 0.1%
This script still remains to shows viability / profitablity on higher term timeframes (with slightly higher drawdown), and I have included the backtest report below to document my findings:
8 Hour:
Number of Trades: 1082
Gross Return: 233.02%
CAGR Return: 14.04 %
Max Drawdown: 7.9 %
Win percentage: 25.6%
Profit Factor (Expectancy): 1.627
Average Loss: 0.46 %
Average Win: 2.18 %
Average Time for Loss: 1.33 day
Average Time for Win: 7.33 days
Once again, please do your own research and due dillegence before trading this live. This post is for education and information purposes only, and should not be taken as financial advice.

Scalping The Bull IndicatorName: Scalping The Bull Indicator
Category: Scalping, Trend Following, Mean Reversion.
Timeframe: 1M, 5M, 30M, 1D depending on the specific technique.
Technical Analysis: The indicator supports the operations of the trader named "Scalping The Bull" which uses price action and exponential moving averages.
Suggested usage: Altcoin showing strong trends for scalping and intra-day trades. Trigger points are used as entry and exit points and to be used to understand when a signal has more power.
It is possible to identify the following conformations:
Shimano: look at the price records of a consecutive series of closings between the EMA 60 and the EMA 223 when a certain threshold is reached. Use the trigger points as price structures to identify entry and exit zones (e.g. breakout of the yesterday high as for entry point) .
Bomb: look at the price registers a percentage variation in a single candle, greater than a threshold such as 2%, in particular on shorter timeframes and around the trigger points.
Viagra: look at there is a consecutive series of closes below the EMA 10.
Downward fake: look when, after a cross under (Death Cross), the price returns above the EMA 223 using the yesterday high as a trigger point.
Emergence: look at the EMA 60 is about to cross over the EMA 223.
Anti-crossing: look at, after an important price rise and a subsequent retracement, the EMA 60 is about to cross under the EMA 223 but a bullish impulse brings the price back above the EMAs.
For Sales: look at two types of situations: 1) when the price falls by more than 10% from the opening price and around the yesterday’s low or 2) when the price falls and then reaches, in the last 5 days, a bigger percentage and then breaks a trigger point.
Colour change: look at the opening price of the session - indicated as a trigger point.
Third touch of EMA 60: look for 3 touches below the EMA 60, and enter when there is a close above the EMA 60.
Third touch of EMA 223: look for 3 touches when there are 3 touches below the EMA 223, and enter when there is a close above the EMA 60.
Bud: look at price when it crosses upwards the average 10 and subsequently at least 2 "rest" candles are between the maximum and minimum of the breaking candle.
Fake on EMA 10: look for the open of a candle higher than the EMA 10, the minimum of the candle lower and the closing price returns above the EMA 10..
For Stop Loss and Profit Targets consider a proper R/R depending on Risk Management, using price structures such as the low of the entering candle and a quick Position Management moving quickly the Stop-Loss at Break-Even.
Configuration:
Market
EMA: The indicator automatically configure itself on market it knows (Binance, Piazza Affari and NASDAQ) otherwise it can be configured manually fo Crypto market (5/10/60/223) or Stock Market (5/10/50/200).
Additional Average: You can display an additional average, e.g. 20-period average.
Chart elements:
Session Separators: indicates the beginning of the current session (in blue)
Background: signals with the background in green an uptrend situation ( 60 > 223) and in red background a downtrend situation (60 < 223).
Trigger points:
Today's highs and lows: draw on the chart the opening price of the daily candle and the highs and lows of the day (high in purple, low in red and open in green)
Yesterday's highs and lows: draw on the chart the opening price of the daily candle, the highs and lows of the previous day (high in yellow, low in red).
Credits
Massimo : for refactoring and suggestions.

Ratings AlgoThe ratings algo is my discount version of the many paid-for algorithms put out by numerous different companies. A technical "rating" (by default between -10 and 10) is produced for each candle, telling the user when to buy, sell, or hold. I took 11 of my personal favorite indicators to develop a rating system. They are:
50/200 SMA crossover
10/20 SMA crossover
10/20 LSMA crossover
10/20 EMA crossover
"Arnold" a rate-of-change analysis of a smoothed LSMA
PVT and OBV momentum
MACD
RSI
DMI
Fisher Transform
The ratings system is very basic (a more complex, detailed version will be coming in the future!) where each indicator returns -1, 0, or 1, and the MAs and Oscillators are stratified with a user-defined weighting. The total calculation is based on the function:
maweight * (average of MA ratings) + oscillator weight * (average of osc ratings)
If the total value > user-defined threshold, the bar is teal, and if > 2.5 * threshold, is green, and vice versa for orange/red respectively. Purple is given if the total value is close to zero.
"Strong" signals are printed if the bar changes to either green or red and exits are printed if the bars change from green/red to any other color.
A table is also produced showing what each indicator is indicating, either "Buy" "Sell" or "Hold.
Reversal Bands are printed, intended to be used as areas where a trade might be exited if the market is sideways. If a Strong Buy signal is produced, it may be a good idea to enter the trade, and hold until the price enters the reversal bands, then hold until a candle closes outside the band for the first time.
This indicator truly shines in trending markets (like most indicators), but with very fast-acting exit signals and reversal zones, will facilitate minimal losses and possibly even profits in sideways markets.

Weighted RiskONessRevision of tedtalksmacro's risk-on metric. Number go up means global markets are more risk-on; number go down means more risk-off. Weights now allow you to adjust the weights of various elements of the indicator. These are exponentials with the weight being the power / 10.
I.e. setting gold's weight to 10 takes it's value ^ (10 / 10). Setting it to 5 would square root it (^5/10 = ^1/2) while 20 would square it (^20/10 = ^2).
A green line means "riskONess" has gone up in the last day, red means down.
Resolution minimum for the indicator is 1D due to TradingView's limitations.

Double SupertrendThis strategy is based on a custom indicator that was created based on the Supertrend indicator. At its core, there are always 2 super trend indicators with different factors to reduce market noise (false signals).
The strategy/indicator has some parameters to improve the signals and filters.
TECHNICAL ANALYSIS
☑ Show Indicators
This option will enable/disable the Supertrend indicators on the chart.
☑ Length
The length will be used on the Supertrend Indicator to calculate its values.
☑ Dev Fast
The fast deviation or factor from one of the super trend indicators. This will be the leading indicator for entry signals, as well as for the exit signals.
☑ Dev Slow
The slow deviation or factor from one of the super trend indicators. This will be the confirmation indicator for entry and exit signals.
☑ Exit Type
It's possible to select from 4 options for the exit signals. Exit signals always take profit target.
☑ ⥹ Reversals
This option will make the strategy/indicator calculate the exit signals based on the difference between the given period's highest and lowest candle value (see Period on this list). It's displayed on the chart with the cross. As it's possible to verify in the image below, there are multiple exit spots for every entry.
☑ ⥹ ATR
Using ATR as a base indicator for exit signals will make the strategy/indicator place limit/stop orders. Candle High + ATR for longs, Candle Low - ATR for shorts. The strategy will show the ATR level for take profit and stick with it until the next signal. This way, the take profit value remains based on the candle of the entry signal.
☑ ⥹ Fast Supertrend
With this option selected, the exit signals will be based on the Fast Supertsignal value, mirrored to make a profit.
☑ ⥹ Slow Supertrend
With this option selected, the exit signals will be based on the Slow Supertsignal value, which is mirrored to take profit.
☑ Period
This will represent the number of candles used on the exit signals when Reversals is selected as Exit Type. It's also used to calculate the gradient used on the Fills and Supertrend signals.
☑ Multiplier
It's used on the take profit when the ATR option is selected on the Exit Type.
STRATEGY
☑ Use The Strategy
This will enable/disable the strategy to show the trades calculations.
☑ Show Use Long/Short Entries
Option to make the strategy show/use Long or Short signals. Available only if Use The Strategy is enabled
☑ Show Use Exit Long/Short
Option to make the strategy show/use Exit Long or Short signals (valid when Reversals option is selected on the Exit Type). Available only if Use The Strategy is enabled
☑ Show Use Add Long/Short
Option to make the strategy show/use Add Long or Short signals. With this option enabled, the strategy will place multiple trades in the same direction, almost the same concept as a pyramiding parameter. It's based on the Fast Supersignal when the candle fails to cross and reverses. Available only if Use The Strategy is enabled
☑ Trades Date Start/End
The date range that the strategy will check the market data and make the trades
HOW TO USE
It's very straightforward. A long signal will appear as a green arrow with a text Long below it. A short signal will appear as a red arrow with a text Short above it. It's ideal to wait for the candle to finish to validate the signal.
The exit signals are optional but give a good idea of the configuration used when backtesting. Each market and timeframe will have its own configuration for the best results. On average, sticking to ATR as an exit signal will have less risk than the other options.
☑ Entry Signals
Follow the arrows with Long/Short texts on them. Wait for the signal candle to close to validate the entry.
☑ Exit Signals
Use them to close your position or to trail stop your orders and maximize profits. Select the exit type suitable for each timeframe and market
☑ Add Entries
It's possible to increase the position following the add margin/contracts based on the Add signals. Not mandatory, but may work as reentries or late entries using the same signal.
☑ What about Stop Loss?
The stop-loss levels were not included as a separated signal because it's already in the chart. There are some possible ideas for the stop loss:
☑⥹ Candle High/Low (2nd recommend option)
When it's a Long signal from the entry signal candle, the stop loss can be the Low value of the same candle. Very tight stop loss in some cases, depending on the candle range
☑⥹ Local Top/Bottom
Selecting the local top/bottom as stop loss will give the strategy more room for false breakouts or reversals, keeping the trade open and minimizing noises. Increases the risk
☑⥹ Fast Supertrend (1st recommend option)
The fast supertrend can be used as stop-loss as well. making it a moving level and working close to trail stop management
☑⥹ Fixed Percentage
It's possible to use a fixed risk percentage for the trades, making the risk easier to control and project. Since the market volatility is not fixed, this may affect the accuracy of the trades
☑⥹ Based on the ATR (3rd recommend option)
When the exit type option ATR is selected, it will display the take profit level for that entry. Just mirror that value and put it as stop-loss, or multiply that amount by 1.5 to have more room for market noise.
EXAMPLE CONFIGURATIONS
Here are some configuration ideas for some markets (all of them are from crypto, especially futures markets)
BTCUSDT 15min - Default configuration
BTCUSDT 1h - Length 10 | Dev Fast 3 | Dev Slow 4 | Exit Type ATR | Period 50 | Multiplier 1
BTCUSDT 4h - Length 10 | Dev Fast 2 | Dev Slow 4 | Exit Type ATR | Period 50 | Multiplier 1
ETHUSDT 15min - Length 20 | Dev Fast 1 | Dev Slow 3 | Exit Type Fast Supertrend | Period 50 | Multiplier 1
IOTAUSDT 15min - Length 10 | Dev Fast 1 | Dev Slow 2 | Exit Type Slow Supertrend | Period 50 | Multiplier 1
OMGUSDT 15min - Length 10 | Dev Fast 1 | Dev Slow 4 | Exit Type Slow Supertrend | Period 50 | Multiplier 1
VETUSDT 15min - Length 10 | Dev Fast 3 | Dev Slow 4 | Exit Type Slow Supertrend | Period 50 | Multiplier 1
HOW TO FIND OTHER CONFIGURATIONS
Here are some steps to find suitable configurations
select a market and time frame
enable the Use This Strategy option on the strategy
open the strategy tester panel and select the performance summary
open the strategy configuration and go to properties
change the balance to the same price of the symbol (example: BTCUSDT 60.000, use 60.000 as balance)
go back to the inputs tab and keep changing the parameters until you see the net profit be positive and bigger than the absolute value of the drawdown
in case you can't find a suitable configuration, try other timeframes
Since the tester reflects what happened in the past candles, it's not guaranteed to give the same results. However, this indicator/Strategy can be used with other indicators as a leading signal or confirmation signal.

MathConstantsLibrary "MathConstants"
Mathematical Constants
E() The number e
Log2E() The number log (e)
Log10E() The number log (e)
Ln2() The number log (2)
Ln10() The number log (10)
LnPi() The number log (pi)
Ln2PiOver2() The number log (2*pi)/2
InvE() The number 1/e
SqrtE() The number sqrt(e)
Sqrt2() The number sqrt(2)
Sqrt3() The number sqrt(3)
Sqrt1Over2() The number sqrt(1/2) = 1/sqrt(2) = sqrt(2)/2
HalfSqrt3() The number sqrt(3)/2
Pi() The number pi
Pi2() The number pi*2
PiOver2() The number pi/2
Pi3Over2() The number pi*3/2
PiOver4() The number pi/4
SqrtPi() The number sqrt(pi)
Sqrt2Pi() The number sqrt(2pi)
SqrtPiOver2() The number sqrt(pi/2)
Sqrt2PiE() The number sqrt(2*pi*e)
LogSqrt2Pi() The number log(sqrt(2*pi))
LogSqrt2PiE() The number log(sqrt(2*pi*e))
LogTwoSqrtEOverPi() The number log(2 * sqrt(e / pi))
InvPi() The number 1/pi
TwoInvPi() The number 2/pi
InvSqrtPi() The number 1/sqrt(pi)
InvSqrt2Pi() The number 1/sqrt(2pi)
TwoInvSqrtPi() The number 2/sqrt(pi)
TwoSqrtEOverPi() The number 2 * sqrt(e / pi)
Degree() The number (pi)/180 - factor to convert from Degree (deg) to Radians (rad).
Grad() The number (pi)/200 - factor to convert from NewGrad (grad) to Radians (rad).
PowerDecibel() The number ln(10)/20 - factor to convert from Power Decibel (dB) to Neper (Np). Use this version when the Decibel represent a power gain but the compared values are not powers (e.g. amplitude, current, voltage).
NeutralDecibel() The number ln(10)/10 - factor to convert from Neutral Decibel (dB) to Neper (Np). Use this version when either both or neither of the Decibel and the compared values represent powers.
Catalan() The Catalan constant
Sum(k=0 -> inf){ (-1)^k/(2*k + 1)2 }
EulerMascheroni() The Euler-Mascheroni constant
lim(n -> inf){ Sum(k=1 -> n) { 1/k - log(n) } }
GoldenRatio() The number (1+sqrt(5))/2, also known as the golden ratio
Glaisher() The Glaisher constant
e^(1/12 - Zeta(-1))
Khinchin() The Khinchin constant
prod(k=1 -> inf){1+1/(k*(k+2))^log(k,2)}

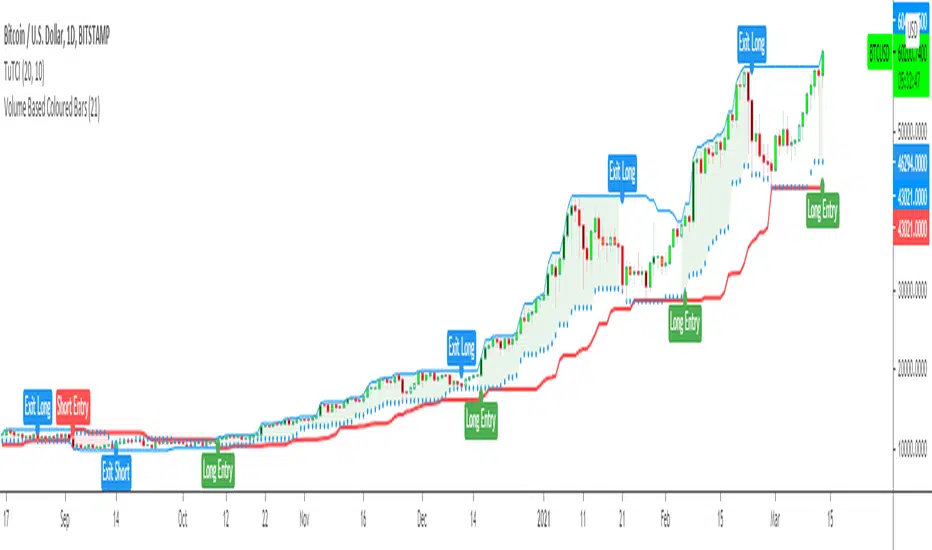
Turtle Trade Channels Indicator TUTCILegendary trade system which proved that great traders can be made, not born.
Turtle Trade Experiment made 80% annual return for 4 years and made 150 million $
Turtle Trade trend following system is a complete opposite to the "buy low and sell high" approach.
This trend following system was taught to a group of average and normal individuals, and almost everyone turned into a profitable trader.
They used the basis logic of well known DONCHIAN CHANNELS which developed by Richard Donchian.
The main rule is "Trade an 20-day breakout and take profits when an 10-day high or low is breached ". Examples:
Buy a 20-day breakout and close the trade when price action reaches a 10-day low.
Go short a 20-day breakout and close the trade when price action reaches a 10-day high.
In this indicator,
The red line is the trading line which indicates the trend directio n:
Price bars over the trend line indicates uptrend
Price bars under the trend line means downtrend
The dotted blue line is the exit line.
Original system is:
Go long when the price High is equal to or above previous 20 day Highest price.
Go short when the price Low is equal to or below previous 20 day Lowest price.
Exit long positions when the price touches the exit line
Exit short positions when the price touches the exit line
Recommended initial stop-loss is ATR * 2 from the opening price.
Default system parameters were 20,10 and 55,20.
Original Turtle Rules:
To trade exactly like the turtles did, you need to set up two indicators representing the main and the failsafe system.
Set up the main indicator with EntryPeriod = 20 and ExitPeriod = 10 (A.k.a S1)
Set up the failsafe indicator with EntryPeriod = 55 and ExitPeriod = 20 using a different color. (A.k.a S2)
The entry strategy using S1 is as follows
Buy 20-day breakouts using S1 only if last signaled trade was a loss.
Sell 20-day breakouts using S1 only if last signaled trade was a loss.
If last signaled trade by S1 was a win, you shouldn't trade -Irregardless of the direction or if you traded last signal it or not-
The entry strategy using S2 is as follows:
Buy 55-day breakouts only if you ignored last S1 signal and the market is rallying without you
Sell 55-day breakouts only if you ignored last S1 signal and the market is pluging without you
You can Highlight the chart with provided trade signals:
Green background color when Long
Red background color when Short
No background color when flat
WARNING: TURTLE TRADE STOP or ADDING more UNITS RULES ARE NOT INCLUDED.
Author: Kıvanç Özbilgiç
Also you can show or hide trade signals with the button on the settings menu
RSI EMA CrossOver RameshThe RSI is one of the most popular technical indicators. The RSI measures the internal strength of the security. The RSI indicator oscillates between oversold and over bought levels, where a trader is advised to look for buying opportunities when the stock is in over sold region and selling opportunities when the stock is in over bought region.
The RSI with EMA strategy signals a trade when EMA of 7 period RSI crosses over the EMA of a 14 period RSI.
Buy: when 10 EMA of 7 period RSI crossing up 10 EMA of a 14 period RSI
Sell: when 10 EMA of 7 period RSI crossing down 10 EMA of a 14 period RSI
EMA = Exponential Moving Average
Crossover = Simple crossover between current RSI values and its 10 day EMA

Multi SMA EMA WMA HMA BB (4x5 MAs Bollinger Bands) Adv MTF - RRBMulti SMA EMA WMA HMA 4x5 Moving Averages with Bollinger Bands Advanced MTF by RagingRocketBull 2019
Version 1.0
This indicator shows multiple MAs of any type SMA EMA WMA HMA etc with BB and MTF support, can show MAs as dynamically moving levels.
There are 4 MA groups + 1 BB group, a total of 4 TFs * 5 MAs = 20 MAs. You can assign any type/timeframe combo to a group, for example:
- EMAs 12,26,50,100,200 x H1, H4, D1, W1 (4 TFs x 5 MAs x 1 type)
- EMAs 8,10,13,21,30,50,55,100,200,400 x M15, H1 (2 TFs x 10 MAs x 1 type)
- D1 EMAs and SMAs 8,10,12,26,30,50,55,100,200,400 (1 TF x 10 MAs x 2 types)
- H1 WMAs 7,77,89,167,231; H4 HMAs 12,26,50,100,200; D1 EMAs 89,144,169,233,377; W1 SMAs 12,26,50,100,200 (4 TFs x 5 MAs x 4 types)
- +1 extra MA type/timeframe for BB
There are several versions: Simple, MTF, Pro MTF, Advanced MTF and Ultimate MTF. This is the Advanced MTF version. The Differences are listed below. All versions have BB
- Simple: you have 2 groups of MAs that can be assigned any type (5+5)
- MTF: +2 custom Timeframes for each group (2x5 MTF) +1 TF for BB, TF XY smoothing
- Pro MTF: 4 custom Timeframes for each group (4x3 MTF), 1 TF for BB, MA levels and show max bars back options
- Advanced MTF: +2 extra MAs/group (4x5 MTF), custom Ticker/Symbols, Timeframe <>= filter, Remove Duplicates Option
- Ultimate MTF: +individual settings for each MA, custom Ticker/Symbols
Features:
- 4x5 = 20 MAs of any type
- 4x MTF groups with XY step line smoothing
- +1 extra TF/type for BB MAs
- 4x5 = 20 MA levels with adjustable group offsets, indents and shift
- supports any existing type of MA: SMA, EMA, WMA, Hull Moving Average (HMA)
- custom tickers/symbols for each group - you can compare MAs of the same symbol across exchanges
- show max bars back option
- show/hide both groups of MAs/levels/BB and individual MAs
- timeframe filter: show only MAs/Levels with TFs <>= Current TF
- hide MAs/Levels with duplicate TFs
- support for custom TFs that are not available in free accounts: 2D, 3D etc
- support for timeframes in H: H, 2H, 4H etc
Notes:
- Uses timeframe textbox instead of input resolution dropdown to allow for 240 120 and other custom TFs
- Uses symbol textbox instead of input symbol to avoid establishing multiple dummy security connections to the current ticker - otherwise empty symbols will prevent script from running
- Possible reasons for missing MAs on a chart:
- there may not be enough bars in history to start plotting it. For example, W1 EMA200 needs at least 200 bars on a weekly chart.
- price << default Y smoothing step 5. For charts with low/fractional prices (i.e. 0.00002 << 5) adjust X Y smoothing as needed (set Y = 0.0000001) or disable it completely (set X,Y to 0,0)
- TradingView Replay Mode UI and Pinescript security calls are limited to TFs >= D (D,2D,W,MN...) for free accounts
- attempting to plot any TF < D1 in Replay Mode will only result in straight lines, but all TFs will work properly in history and real-time modes. This is not a bug.
- Max Bars Back (num_bars) is limited to 5000 for free accounts (10000 for paid), will show error when exceeded. To plot on all available history set to 0 (default)
- Slow load/redraw times. This indicator becomes slower, its UI less responsive when:
- Pinescript Node.js graphics library is too slow and inefficient at plotting bars/objects in a browser window. Code optimization doesn't help much - the graphics engine is the main reason for general slowness.
- the chart has a long history (10000+ bars) in a browser's cache (you have scrolled back a couple of screens in a max zoom mode).
- Reload the page/Load a fresh chart and then apply the indicator or
- Switch to another Timeframe (old TF history will still remain in cache and that TF will be slow)
- in max possible zoom mode around 4500 bars can fit on 1 screen - this also slows down responsiveness. Reset Zoom level
- initial load and redraw times after a param change in UI also depend on TF. For example:
D1/W1 - 2 sec, H1/H4 - 5-6 sec, M30 - 10 sec, M15/M5 - 4 sec, M1 - 5 sec.
M30 usually has the longest history (up to 16000 bars) and W1 - the shortest (1000 bars).
- when indicator uses more MAs (plots) and timeframes it will redraw slower. Seems that up to 5 Timeframes is acceptable, but 6+ Timeframes can become very slow.
- show_last=last_bars plot limit doesn't affect load/redraw times, so it was removed from MA plot
- Max Bars Back (num_bars) default/custom set UI value doesn't seem to affect load/redraw times
- In max zoom mode all dynamic levels disappear (they behave like text)
1. based on 3EmaBB, uses plot*, barssince and security functions
2. you can't set certain constants from input due to Pinescript limitations - change the code as needed, recompile and use as a private version
3. Levels = trackprice implementation
4. Show Max Bars Back = show_last implementation
5. swma has a fixed length = 4, alma and linreg have additional offset and smoothing params
6. Smoothing is applied by default for visual aesthetics on MTF. To use exact ma mtf values (lines with stair stepping) - disable it
Good Luck! You can explore, modify/reuse the code to build your own indicators.

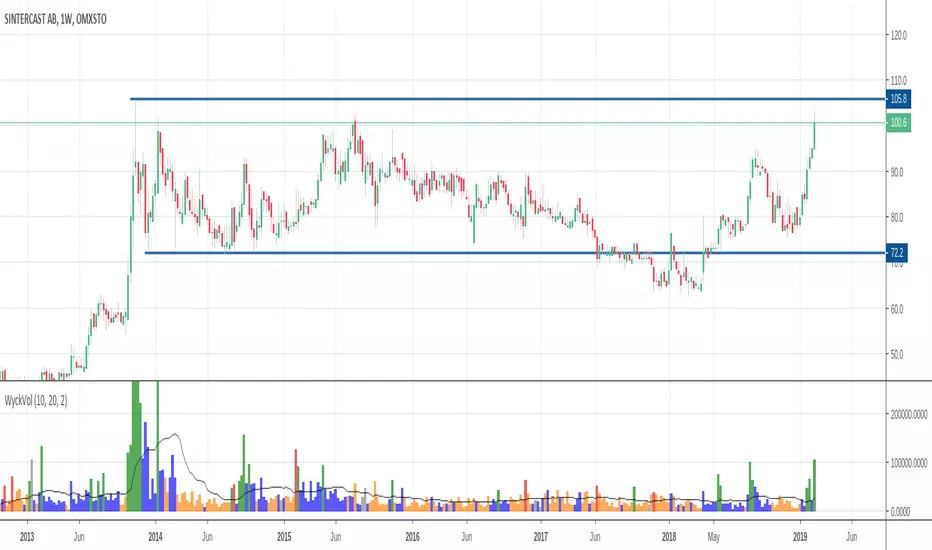
Wyckoff Volume ColorThis volume indicator is intended to be used for the Wyckoff strategy.
Green volume bar indicates last price close above close 10 days ago together with volume larger than 2 * SMA(volume, 20)
Blue volume bar indicates last price close above close 10 days ago together with volume less than 2 * SMA(volume, 20)
Orange volume bar indicates last price close lower than close 10 days ago together with volume less than 2 * SMA(volume, 20)
Red volume bar indicates last price close lower than close 10 days ago together with volume larger than 2 * SMA(volume, 20)
The main purpose is to have green bars with a buying climax and red bars with a selling climax.
Three variables can be changed by simply pressing the settings button.
How many days back the closing price is compared to. Now 10 days.
How many times the SMA(volume) is multiplied by. Now times 2.
How many days the SMA(volume) consists by. Now 20 days.
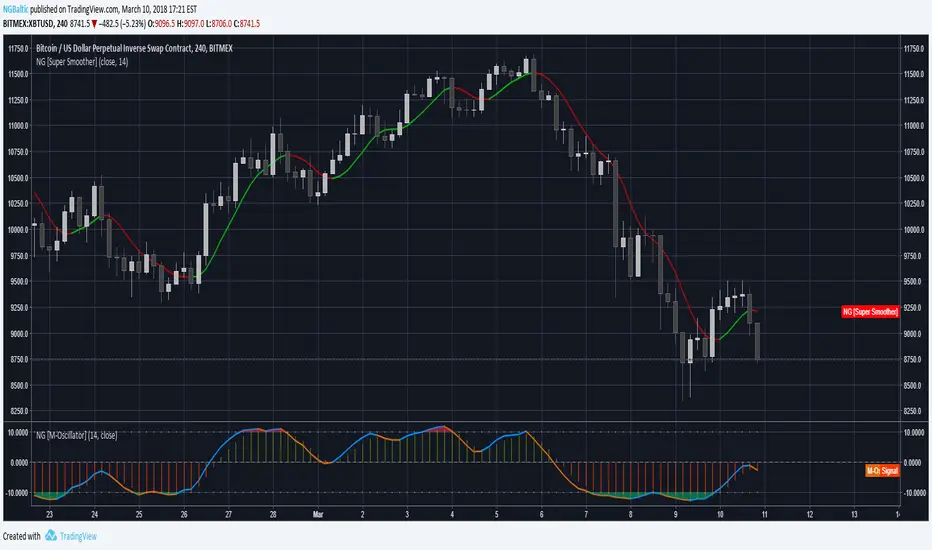
M-OscillatorThe M-Oscillator is a bounded oscillator that moves between (-14) and (+14), it gives early buy/sell signals, spots divergences, displays overbought/oversold levels, and provides re-entry points, and it also work as a trend identifier.
Interpretation
• M-Oscillator is plotted along the bottom of the price chart; it fluctuates between positive and negative 14.
• Movement above 10 is considered overbought, and movement below -10 is oversold.
• In sharp moves to the upside, the M-Oscillator fluctuates between 5 and 14, while in down side it fluctuates between -5 and -14.
• In an uptrend, the M-Oscillator fluctuates between zero and 14 and vice versa.
Trading tactics
Overbought/Oversold: We define the overbought area as anywhere above the 10 level.
The oversold area is below -10. When the M-Oscillator goes above 10 (overbought) and then re-crosses it to the downside, a sell signal is triggered.
When the M-Oscillator surpasses -10 to the downside and then re-crosses back above this level, a buy signal is triggered.
This tactic is only successful during sideways markets; during an uptrend, the oscillator will remain in its overbought territory for long period of times.
During a downtrend, it will remain in oversold for a long time.
Divergence
Divergence is one of the most striking features of the M-Oscillator.
It is a very important aspect of technical analysis that enhances trading tactics enormously; it shows hidden weakness or strength in the market, which is not apparent in the price action.
A positive divergence occurs when the price is declining and makes a lower low, while M-Oscillator witnesses a higher low.
A negative divergence occurs when the price is rising and makes a higher High, while the M-Oscillator makes a lower high, which indicates hidden weakness in the market.
Divergences are very important as they give us early hints of trend reversal (weekly chart)
Grok/Claude AI Neural Fusion Pro V2AI Neural Fusion Pro V2 - New Features
Overview
Version 2 of AI Neural Fusion Pro introduces two complementary protection systems designed to preserve capital during market extremes. The first prevents over-buying during violent crashes. The second prevents over-selling during powerful rallies. Together, they transform a reactive trading system into one that adapts intelligently to market conditions.
Feature 1: Cascade Protection
Purpose
Cascade Protection prevents capital destruction during violent market crashes by implementing two independent safeguards that must both pass before any buy signal can fire.
The Problem It Solves
During market crashes, several dangerous conditions occur simultaneously. Volatility spikes to extreme levels, indicators scream "oversold," and each dip looks like the bottom. Traditional systems fire buy after buy, depleting capital reserves while price continues falling. By the time the actual bottom forms, there's no capital left to capture it.
How It Works
Layer 1: BBWP Freeze
Bollinger Band Width Percentile measures current volatility relative to historical volatility. When BBWP exceeds 92%, it indicates the market is experiencing abnormal volatility—typically during liquidation cascades or panic selling. During these periods, all buy signals are frozen regardless of how oversold conditions appear. This is an absolute freeze with no exceptions.
Layer 2: Consecutive Buy Counter
This layer limits the maximum number of buy orders that can execute without an intervening sell. The default limit is 3 consecutive buys. Once reached, additional buy signals are blocked until a sell signal fires and resets the counter. This prevents the common scenario where a bot keeps averaging down position after position during an extended decline.
Configuration
SettingDefaultDescriptionEnable Cascade ProtectionONMaster toggle for entire featureBBWP Length7Period for Bollinger Band calculationBBWP Lookback100Historical period for percentile rankingBBWP Freeze Level92%Threshold above which buys freezeMax Consecutive Buys3Maximum buys before forced pause
Panel Display
The info panel shows real-time protection status with color-coded feedback:
BBWP row: Shows current percentage and status (OK in green, FROZEN in red)
Buy Counter row: Shows current count versus maximum (green when available, orange approaching limit, red when blocked)
Key Behavior
Sell signals are never affected by cascade protection
The buy counter resets to zero after any sell signal fires
BBWP freeze is absolute—even extreme oversold conditions cannot bypass it
Feature 2: Dynamic Cooldown
Purpose
Dynamic Cooldown prevents over-selling during powerful rallies by automatically extending the minimum time between signals when the market enters a strong trend.
The Problem It Solves
During strong rallies, traditional indicators repeatedly hit overbought conditions, triggering sell after sell as price climbs. A trader might execute 10-15 sells during a sustained move from $86K to $93K, selling away their position piece by piece instead of letting profits run. Each sell captures a small gain while missing the larger move.
How It Works
The system monitors ADX (Average Directional Index) to detect trend strength. When ADX exceeds 50 and is rising, the market has entered a powerful trending phase. During these conditions, the cooldown period between signals automatically increases from 5 bars to 10 bars.
This means signals fire less frequently during strong trends, allowing positions more time to develop before the next potential exit. The extended cooldown applies equally to both buy and sell signals, though the primary benefit is reducing premature sells during rallies.
Normal Market (ADX < 50 or falling):
Cooldown = 5 bars (25 minutes on 5-minute chart)
Standard signal frequency
Strong Trend (ADX > 50 and rising):
Cooldown = 10 bars (50 minutes on 5-minute chart)
Reduced signal frequency to let trends develop
Configuration
SettingDefaultDescriptionEnable Dynamic CooldownONMaster toggle for featureSignal Cooldown5 barsStandard cooldown between signalsStrong Trend ADX Threshold50ADX level that triggers extended cooldownStrong Trend Cooldown10 barsExtended cooldown during strong trends
Panel Display
The info panel provides visual indication of current cooldown state:
ADX row: Shows value with arrow indicator (ADX ↑) when in strong trend mode, blue background when above threshold
Cooldown row: Shows active cooldown period with arrow indicator (Cooldown ↑) when extended, blue background during strong trends
Key Behavior
Cooldown applies to both buy and sell signals equally
Transition between modes is automatic based on ADX conditions
ADX must be both above threshold AND rising to trigger extended cooldown
When ADX stops rising or drops below threshold, cooldown returns to normal immediately
Combined Effect
These two features work together to create a more intelligent trading system:
During Crashes:
BBWP spikes above 92% → Buys frozen
System waits for volatility to normalize
When BBWP drops, limited buys (3 max) capture the actual bottom
Capital preserved for recovery
During Rallies:
ADX rises above 50 → Cooldown extends to 10 bars
Fewer sell signals fire during the move
Positions held longer, capturing more of the trend
Profits allowed to run
During Normal Markets:
Standard 5-bar cooldown
No BBWP restrictions
Full signal frequency for active trading
Summary
Version 2 transforms AI Neural Fusion Pro from a purely reactive indicator into an adaptive system that recognizes market extremes and adjusts its behavior accordingly. Cascade Protection guards against buying into crashes. Dynamic Cooldown guards against selling out of rallies. Together, they help preserve capital during adverse conditions while allowing full participation when markets behave normally.

Ultimate RSI [captainua]Ultimate RSI
Overview
This indicator combines multiple RSI calculations with volume analysis, divergence detection, and trend filtering to provide a comprehensive RSI-based trading system. The script calculates RSI using three different periods (6, 14, 24) and applies various smoothing methods to reduce noise while maintaining responsiveness. The combination of these features creates a multi-layered confirmation system that reduces false signals by requiring alignment across multiple indicators and timeframes.
The script includes optimized configuration presets for instant setup: Scalping, Day Trading, Swing Trading, and Position Trading. Simply select a preset to instantly configure all settings for your trading style, or use Custom mode for full manual control. All settings include automatic input validation to prevent configuration errors and ensure optimal performance.
Configuration Presets
The script includes preset configurations optimized for different trading styles, allowing you to instantly configure the indicator for your preferred trading approach. Simply select a preset from the "Configuration Preset" dropdown menu:
- Scalping: Optimized for fast-paced trading with shorter RSI periods (4, 7, 9) and minimal smoothing. Noise reduction is automatically disabled, and momentum confirmation is disabled to allow faster signal generation. Designed for quick entries and exits in volatile markets.
- Day Trading: Balanced configuration for intraday trading with moderate RSI periods (6, 9, 14) and light smoothing. Momentum confirmation is enabled for better signal quality. Ideal for day trading strategies requiring timely but accurate signals.
- Swing Trading: Configured for medium-term positions with standard RSI periods (14, 14, 21) and moderate smoothing. Provides smoother signals suitable for swing trading timeframes. All noise reduction features remain active.
- Position Trading: Optimized for longer-term trades with extended RSI periods (24, 21, 28) and heavier smoothing. Filters are configured for highest-quality signals. Best for position traders holding trades over multiple days or weeks.
- Custom: Full manual control over all settings. All input parameters are available for complete customization. This is the default mode and maintains full backward compatibility with previous versions.
When a preset is selected, it automatically adjusts RSI periods, smoothing lengths, and filter settings to match the trading style. The preset configurations ensure optimal settings are applied instantly, eliminating the need for manual configuration. All settings can still be manually overridden if needed, providing flexibility while maintaining ease of use.
Input Validation and Error Prevention
The script includes comprehensive input validation to prevent configuration errors:
- Cross-Input Validation: Smoothing lengths are automatically validated to ensure they are always less than their corresponding RSI period length. If you set a smoothing length greater than or equal to the RSI length, the script automatically adjusts it to (RSI Length - 1). This prevents logical errors and ensures valid configurations.
- Input Range Validation: All numeric inputs have minimum and maximum value constraints enforced by TradingView's input system, preventing invalid parameter values.
- Smart Defaults: Preset configurations use validated default values that are tested and optimized for each trading style. When switching between presets, all related settings are automatically updated to maintain consistency.
Core Calculations
Multi-Period RSI:
The script calculates RSI using the standard Wilder's RSI formula: RSI = 100 - (100 / (1 + RS)), where RS = Average Gain / Average Loss over the specified period. Three separate RSI calculations run simultaneously:
- RSI(6): Uses 6-period lookback for high sensitivity to recent price changes, useful for scalping and early signal detection
- RSI(14): Standard 14-period RSI for balanced analysis, the most commonly used RSI period
- RSI(24): Longer 24-period RSI for trend confirmation, provides smoother signals with less noise
Each RSI can be smoothed using EMA, SMA, RMA (Wilder's smoothing), WMA, or Zero-Lag smoothing. Zero-Lag smoothing uses the formula: ZL-RSI = RSI + (RSI - RSI ) to reduce lag while maintaining signal quality. You can apply individual smoothing lengths to each RSI period, or use global smoothing where all three RSIs share the same smoothing length.
Dynamic Overbought/Oversold Thresholds:
Static thresholds (default 70/30) are adjusted based on market volatility using ATR. The formula: Dynamic OB = Base OB + (ATR × Volatility Multiplier × Base Percentage / 100), Dynamic OS = Base OS - (ATR × Volatility Multiplier × Base Percentage / 100). This adapts to volatile markets where traditional 70/30 levels may be too restrictive. During high volatility, the dynamic thresholds widen, and during low volatility, they narrow. The thresholds are clamped between 0-100 to remain within RSI bounds. The ATR is cached for performance optimization, updating on confirmed bars and real-time bars.
Adaptive RSI Calculation:
An adaptive RSI adjusts the standard RSI(14) based on current volatility relative to average volatility. The calculation: Adaptive Factor = (Current ATR / SMA of ATR over 20 periods) × Volatility Multiplier. If SMA of ATR is zero (edge case), the adaptive factor defaults to 0. The adaptive RSI = Base RSI × (1 + Adaptive Factor), clamped to 0-100. This makes the indicator more responsive during high volatility periods when traditional RSI may lag. The adaptive RSI is used for signal generation (buy/sell signals) but is not plotted on the chart.
Overbought/Oversold Fill Zones:
The script provides visual fill zones between the RSI line and the threshold lines when RSI is in overbought or oversold territory. The fill logic uses inclusive conditions: fills are shown when RSI is currently in the zone OR was in the zone on the previous bar. This ensures complete coverage of entry and exit boundaries. A minimum gap of 0.1 RSI points is maintained between the RSI plot and threshold line to ensure reliable polygon rendering in TradingView. The fill uses invisible plots at the threshold levels and the RSI value, with the fill color applied between them. You can select which RSI (6, 14, or 24) to use for the fill zones.
Divergence Detection
Regular Divergence:
Bullish divergence: Price makes a lower low (current low < lowest low from previous lookback period) while RSI makes a higher low (current RSI > lowest RSI from previous lookback period). Bearish divergence: Price makes a higher high (current high > highest high from previous lookback period) while RSI makes a lower high (current RSI < highest RSI from previous lookback period). The script compares current price/RSI values to the lowest/highest values from the previous lookback period using ta.lowest() and ta.highest() functions with index to reference the previous period's extreme.
Pivot-Based Divergence:
An enhanced divergence detection method that uses actual pivot points instead of simple lowest/highest comparisons. This provides more accurate divergence detection by identifying significant pivot lows/highs in both price and RSI. The pivot-based method uses a tolerance-based approach with configurable constants: 1% tolerance for price comparisons (priceTolerancePercent = 0.01) and 1.0 RSI point absolute tolerance for RSI comparisons (pivotTolerance = 1.0). Minimum divergence threshold is 1.0 RSI point (minDivergenceThreshold = 1.0). It looks for two recent pivot points and compares them: for bullish divergence, price makes a lower low (at least 1% lower) while RSI makes a higher low (at least 1.0 point higher). This method reduces false divergences by requiring actual pivot points rather than just any low/high within a period. When enabled, pivot-based divergence replaces the traditional method for more accurate signal generation.
Strong Divergence:
Regular divergence is confirmed by an engulfing candle pattern. Bullish engulfing requires: (1) Previous candle is bearish (close < open ), (2) Current candle is bullish (close > open), (3) Current close > previous open, (4) Current open < previous close. Bearish engulfing is the inverse: previous bullish, current bearish, current close < previous open, current open > previous close. Strong divergence signals are marked with visual indicators (🐂 for bullish, 🐻 for bearish) and have separate alert conditions.
Hidden Divergence:
Continuation patterns that signal trend continuation rather than reversal. Bullish hidden divergence: Price makes a higher low (current low > lowest low from previous period) but RSI makes a lower low (current RSI < lowest RSI from previous period). Bearish hidden divergence: Price makes a lower high (current high < highest high from previous period) but RSI makes a higher high (current RSI > highest RSI from previous period). These patterns indicate the trend is likely to continue in the current direction.
Volume Confirmation System
Volume threshold filtering requires current volume to exceed the volume SMA multiplied by the threshold factor. The formula: Volume Confirmed = Volume > (Volume SMA × Threshold). If the threshold is set to 0.1 or lower, volume confirmation is effectively disabled (always returns true). This allows you to use the indicator without volume filtering if desired.
Volume Climax is detected when volume exceeds: Volume SMA + (Volume StdDev × Multiplier). This indicates potential capitulation moments where extreme volume accompanies price movements. Volume Dry-Up is detected when volume falls below: Volume SMA - (Volume StdDev × Multiplier), indicating low participation periods that may produce unreliable signals. The volume SMA is cached for performance, updating on confirmed and real-time bars.
Multi-RSI Synergy
The script generates signals when multiple RSI periods align in overbought or oversold zones. This creates a confirmation system that reduces false signals. In "ALL" mode, all three RSIs (6, 14, 24) must be simultaneously above the overbought threshold OR all three must be below the oversold threshold. In "2-of-3" mode, any two of the three RSIs must align in the same direction. The script counts how many RSIs are in each zone: twoOfThreeOB = ((rsi6OB ? 1 : 0) + (rsi14OB ? 1 : 0) + (rsi24OB ? 1 : 0)) >= 2.
Synergy signals require: (1) Multi-RSI alignment (ALL or 2-of-3), (2) Volume confirmation, (3) Reset condition satisfied (enough bars since last synergy signal), (4) Additional filters passed (RSI50, Trend, ADX, Volume Dry-Up avoidance). Separate reset conditions track buy and sell signals independently. The reset condition uses ta.barssince() to count bars since the last trigger, returning true if the condition never occurred (allowing first signal) or if enough bars have passed.
Regression Forecasting
The script uses historical RSI values to forecast future RSI direction using four methods. The forecast horizon is configurable (1-50 bars ahead). Historical data is collected into an array, and regression coefficients are calculated based on the selected method.
Linear Regression: Calculates the least-squares fit line (y = mx + b) through the last N RSI values. The calculation: meanX = sumX / horizon, meanY = sumY / horizon, denominator = sumX² - horizon × meanX², m = (sumXY - horizon × meanX × meanY) / denominator, b = meanY - m × meanX. The forecast projects this line forward: forecast = b + m × i for i = 1 to horizon.
Polynomial Regression: Fits a quadratic curve (y = ax² + bx + c) to capture non-linear trends. The system of equations is solved using Cramer's rule with a 3×3 determinant. If the determinant is too small (< 0.0001), the system falls back to linear regression. Coefficients are calculated by solving: n×c + sumX×b + sumX²×a = sumY, sumX×c + sumX²×b + sumX³×a = sumXY, sumX²×c + sumX³×b + sumX⁴×a = sumX²Y. Note: Due to the O(n³) computational complexity of polynomial regression, the forecast horizon is automatically limited to a maximum of 20 bars when using polynomial regression to maintain optimal performance. If you set a horizon greater than 20 bars with polynomial regression, it will be automatically capped at 20 bars.
Exponential Smoothing: Applies exponential smoothing with adaptive alpha = 2/(horizon+1). The smoothing iterates from oldest to newest value: smoothed = alpha × series + (1 - alpha) × smoothed. Trend is calculated by comparing current smoothed value to an earlier smoothed value (at 60% of horizon): trend = (smoothed - earlierSmoothed) / (horizon - earlierIdx). Forecast: forecast = base + trend × i.
Moving Average: Uses the difference between short MA (horizon/2) and long MA (horizon) to estimate trend direction. Trend = (maShort - maLong) / (longLen - shortLen). Forecast: forecast = maShort + trend × i.
Confidence bands are calculated using RMSE (Root Mean Squared Error) of historical forecast accuracy. The error calculation compares historical values with forecast values: RMSE = sqrt(sumSquaredError / count). If insufficient data exists, it falls back to calculating standard deviation of recent RSI values. Confidence bands = forecast ± (RMSE × confidenceLevel). All forecast values and confidence bands are clamped to 0-100 to remain within RSI bounds. The regression functions include comprehensive safety checks: horizon validation (must not exceed array size), empty array handling, edge case handling for horizon=1 scenarios, division-by-zero protection, and bounds checking for all array access operations to prevent runtime errors.
Strong Top/Bottom Detection
Strong buy signals require three conditions: (1) RSI is at its lowest point within the bottom period: rsiVal <= ta.lowest(rsiVal, bottomPeriod), (2) RSI is below the oversold threshold minus a buffer: rsiVal < (oversoldThreshold - rsiTopBottomBuffer), where rsiTopBottomBuffer = 2.0 RSI points, (3) The absolute difference between current RSI and the lowest RSI exceeds the threshold value: abs(rsiVal - ta.lowest(rsiVal, bottomPeriod)) > threshold. This indicates a bounce from extreme levels with sufficient distance from the absolute low.
Strong sell signals use the inverse logic: RSI at highest point, above overbought threshold + rsiTopBottomBuffer (2.0 RSI points), and difference from highest exceeds threshold. Both signals also require: volume confirmation, reset condition satisfied (separate reset for buy vs sell), and all additional filters passed (RSI50, Trend, ADX, Volume Dry-Up avoidance).
The reset condition uses separate logic for buy and sell: resetCondBuy checks bars since isRSIAtBottom, resetCondSell checks bars since isRSIAtTop. This ensures buy signals reset based on bottom conditions and sell signals reset based on top conditions, preventing incorrect signal blocking.
Filtering System
RSI(50) Filter: Only allows buy signals when RSI(14) > 50 (bullish momentum) and sell signals when RSI(14) < 50 (bearish momentum). This filter ensures you're buying in uptrends and selling in downtrends from a momentum perspective. The filter is optional and can be disabled. Recommended to enable for noise reduction.
Trend Filter: Uses a long-term EMA (default 200) to determine trend direction. Buy signals require price above EMA, sell signals require price below EMA. The EMA slope is calculated as: emaSlope = ema - ema . Optional EMA slope filter additionally requires the EMA to be rising (slope > 0) for buy signals or falling (slope < 0) for sell signals. This provides stronger trend confirmation by requiring both price position and EMA direction.
ADX Filter: Uses the Directional Movement Index (calculated via ta.dmi()) to measure trend strength. Signals only fire when ADX exceeds the threshold (default 20), indicating a strong trend rather than choppy markets. The ADX calculation uses separate length and smoothing parameters. This filter helps avoid signals during sideways/consolidation periods.
Volume Dry-Up Avoidance: Prevents signals during periods of extremely low volume relative to average. If volume dry-up is detected and the filter is enabled, signals are blocked. This helps avoid unreliable signals that occur during low participation periods.
RSI Momentum Confirmation: Requires RSI to be accelerating in the signal direction before confirming signals. For buy signals, RSI must be consistently rising (recovering from oversold) over the lookback period. For sell signals, RSI must be consistently falling (declining from overbought) over the lookback period. The momentum check verifies that all consecutive changes are in the correct direction AND the cumulative change is significant. This filter ensures signals only fire when RSI momentum aligns with the signal direction, reducing false signals from weak momentum.
Multi-Timeframe Confirmation: Requires higher timeframe RSI to align with the signal direction. For buy signals, current RSI must be below the higher timeframe RSI by at least the confirmation threshold. For sell signals, current RSI must be above the higher timeframe RSI by at least the confirmation threshold. This ensures signals align with the larger trend context, reducing counter-trend trades. The higher timeframe RSI is fetched using request.security() from the selected timeframe.
All filters use the pattern: filterResult = not filterEnabled OR conditionMet. This means if a filter is disabled, it always passes (returns true). Filters can be combined, and all must pass for a signal to fire.
RSI Centerline and Period Crossovers
RSI(50) Centerline Crossovers: Detects when the selected RSI source crosses above or below the 50 centerline. Bullish crossover: ta.crossover(rsiSource, 50), bearish crossover: ta.crossunder(rsiSource, 50). You can select which RSI (6, 14, or 24) to use for these crossovers. These signals indicate momentum shifts from bearish to bullish (above 50) or bullish to bearish (below 50).
RSI Period Crossovers: Detects when different RSI periods cross each other. Available pairs: RSI(6) × RSI(14), RSI(14) × RSI(24), or RSI(6) × RSI(24). Bullish crossover: fast RSI crosses above slow RSI (ta.crossover(rsiFast, rsiSlow)), indicating momentum acceleration. Bearish crossover: fast RSI crosses below slow RSI (ta.crossunder(rsiFast, rsiSlow)), indicating momentum deceleration. These crossovers can signal shifts in momentum before price moves.
StochRSI Calculation
Stochastic RSI applies the Stochastic oscillator formula to RSI values instead of price. The calculation: %K = ((RSI - Lowest RSI) / (Highest RSI - Lowest RSI)) × 100, where the lookback is the StochRSI length. If the range is zero, %K defaults to 50.0. %K is then smoothed using SMA with the %K smoothing length. %D is calculated as SMA of smoothed %K with the %D smoothing length. All values are clamped to 0-100. You can select which RSI (6, 14, or 24) to use as the source for StochRSI calculation.
RSI Bollinger Bands
Bollinger Bands are applied to RSI(14) instead of price. The calculation: Basis = SMA(RSI(14), BB Period), StdDev = stdev(RSI(14), BB Period), Upper = Basis + (StdDev × Deviation Multiplier), Lower = Basis - (StdDev × Deviation Multiplier). This creates dynamic zones around RSI that adapt to RSI volatility. When RSI touches or exceeds the bands, it indicates extreme conditions relative to recent RSI behavior.
Noise Reduction System
The script includes a comprehensive noise reduction system to filter false signals and improve accuracy. When enabled, signals must pass multiple quality checks:
Signal Strength Requirement: RSI must be at least X points away from the centerline (50). For buy signals, RSI must be at least X points below 50. For sell signals, RSI must be at least X points above 50. This ensures signals only trigger when RSI is significantly in oversold/overbought territory, not just near neutral.
Extreme Zone Requirement: RSI must be deep in the OB/OS zone. For buy signals, RSI must be at least X points below the oversold threshold. For sell signals, RSI must be at least X points above the overbought threshold. This ensures signals only fire in extreme conditions where reversals are more likely.
Consecutive Bar Confirmation: The signal condition must persist for N consecutive bars before triggering. This reduces false signals from single-bar spikes or noise. The confirmation checks that the signal condition was true for all bars in the lookback period.
Zone Persistence (Optional): Requires RSI to remain in the OB/OS zone for N consecutive bars, not just touch it. This ensures RSI is truly in an extreme state rather than just briefly touching the threshold. When enabled, this provides stricter filtering for higher-quality signals.
RSI Slope Confirmation (Optional): Requires RSI to be moving in the expected signal direction. For buy signals, RSI should be rising (recovering from oversold). For sell signals, RSI should be falling (declining from overbought). This ensures momentum is aligned with the signal direction. The slope is calculated by comparing current RSI to RSI N bars ago.
All noise reduction filters can be enabled/disabled independently, allowing you to customize the balance between signal frequency and accuracy. The default settings provide a good balance, but you can adjust them based on your trading style and market conditions.
Alert System
The script includes separate alert conditions for each signal type: buy/sell (adaptive RSI crossovers), divergence (regular, strong, hidden), crossovers (RSI50 centerline, RSI period crossovers), synergy signals, and trend breaks. Each alert type has its own alertcondition() declaration with a unique title and message.
An optional cooldown system prevents alert spam by requiring a minimum number of bars between alerts of the same type. The cooldown check: canAlert = na(lastAlertBar) OR (bar_index - lastAlertBar >= cooldownBars). If the last alert bar is na (first alert), it always allows the alert. Each alert type maintains its own lastAlertBar variable, so cooldowns are independent per signal type. The default cooldown is 10 bars, which is recommended for noise reduction.
Higher Timeframe RSI
The script can display RSI from a higher timeframe using request.security(). This allows you to see the RSI context from a larger timeframe (e.g., daily RSI on an hourly chart). The higher timeframe RSI uses RSI(14) calculation from the selected timeframe. This provides context for the current timeframe's RSI position relative to the larger trend.
RSI Pivot Trendlines
The script can draw trendlines connecting pivot highs and lows on RSI(6). This feature helps visualize RSI trends and identify potential trend breaks.
Pivot Detection: Pivots are detected using a configurable period. The script can require pivots to have minimum strength (RSI points difference from surrounding bars) to filter out weak pivots. Lower minPivotStrength values detect more pivots (more trendlines), while higher values detect only stronger pivots (fewer but more significant trendlines). Pivot confirmation is optional: when enabled, the script waits N bars to confirm the pivot remains the extreme, reducing repainting. Pivot confirmation functions (f_confirmPivotLow and f_confirmPivotHigh) are always called on every bar for consistency, as recommended by TradingView. When pivot bars are not available (na), safe default values are used, and the results are then used conditionally based on confirmation settings. This ensures consistent calculations and prevents calculation inconsistencies.
Trendline Drawing: Uptrend lines connect confirmed pivot lows (green), and downtrend lines connect confirmed pivot highs (red). By default, only the most recent trendline is shown (old trendlines are deleted when new pivots are confirmed). This keeps the chart clean and uncluttered. If "Keep Historical Trendlines" is enabled, the script preserves up to N historical trendlines (configurable via "Max Trendlines to Keep", default 5). When historical trendlines are enabled, old trendlines are saved to arrays instead of being deleted, allowing you to see multiple trendlines simultaneously for better trend analysis. The arrays are automatically limited to prevent memory accumulation.
Trend Break Detection: Signals are generated when RSI breaks above or below trendlines. Uptrend breaks (RSI crosses below uptrend line) generate buy signals. Downtrend breaks (RSI crosses above downtrend line) generate sell signals. Optional trend break confirmation requires the break to persist for N bars and optionally include volume confirmation. Trendline angle filtering can exclude flat/weak trendlines from generating signals (minTrendlineAngle > 0 filters out weak/flat trendlines).
How Components Work Together
The combination of multiple RSI periods provides confirmation across different timeframes, reducing false signals. RSI(6) catches early moves, RSI(14) provides balanced signals, and RSI(24) confirms longer-term trends. When all three align (synergy), it indicates strong consensus across timeframes.
Volume confirmation ensures signals occur with sufficient market participation, filtering out low-volume false breakouts. Volume climax detection identifies potential reversal points, while volume dry-up avoidance prevents signals during unreliable low-volume periods.
Trend filters align signals with the overall market direction. The EMA filter ensures you're trading with the trend, and the EMA slope filter adds an additional layer by requiring the trend to be strengthening (rising EMA for buys, falling EMA for sells).
ADX filter ensures signals only fire during strong trends, avoiding choppy/consolidation periods. RSI(50) filter ensures momentum alignment with the trade direction.
Momentum confirmation requires RSI to be accelerating in the signal direction, ensuring signals only fire when momentum is aligned. Multi-timeframe confirmation ensures signals align with higher timeframe trends, reducing counter-trend trades.
Divergence detection identifies potential reversals before they occur, providing early warning signals. Pivot-based divergence provides more accurate detection by using actual pivot points. Hidden divergence identifies continuation patterns, useful for trend-following strategies.
The noise reduction system combines multiple filters (signal strength, extreme zone, consecutive bars, zone persistence, RSI slope) to significantly reduce false signals. These filters work together to ensure only high-quality signals are generated.
The synergy system requires alignment across all RSI periods for highest-quality signals, significantly reducing false positives. Regression forecasting provides forward-looking context, helping anticipate potential RSI direction changes.
Pivot trendlines provide visual trend analysis and can generate signals when RSI breaks trendlines, indicating potential reversals or continuations.
Reset conditions prevent signal spam by requiring a minimum number of bars between signals. Separate reset conditions for buy and sell signals ensure proper signal management.
Usage Instructions
Configuration Presets (Recommended): The script includes optimized preset configurations for instant setup. Simply select your trading style from the "Configuration Preset" dropdown:
- Scalping Preset: RSI(4, 7, 9) with minimal smoothing. Noise reduction disabled, momentum confirmation disabled for fastest signals.
- Day Trading Preset: RSI(6, 9, 14) with light smoothing. Momentum confirmation enabled for better signal quality.
- Swing Trading Preset: RSI(14, 14, 21) with moderate smoothing. Balanced configuration for medium-term trades.
- Position Trading Preset: RSI(24, 21, 28) with heavier smoothing. Optimized for longer-term positions with all filters active.
- Custom Mode: Full manual control over all settings. Default behavior matches previous script versions.
Presets automatically configure RSI periods, smoothing lengths, and filter settings. You can still manually adjust any setting after selecting a preset if needed.
Getting Started: The easiest way to get started is to select a configuration preset matching your trading style (Scalping, Day Trading, Swing Trading, or Position Trading) from the "Configuration Preset" dropdown. This instantly configures all settings for optimal performance. Alternatively, use "Custom" mode for full manual control. The default configuration (Custom mode) shows RSI(6), RSI(14), and RSI(24) with their default smoothing. Overbought/oversold fill zones are enabled by default.
Customizing RSI Periods: Adjust the RSI lengths (6, 14, 24) based on your trading timeframe. Shorter periods (6) for scalping, standard (14) for day trading, longer (24) for swing trading. You can disable any RSI period you don't need.
Smoothing Selection: Choose smoothing method based on your needs. EMA provides balanced smoothing, RMA (Wilder's) is traditional, Zero-Lag reduces lag but may increase noise. Adjust smoothing lengths individually or use global smoothing for consistency. Note: Smoothing lengths are automatically validated to ensure they are always less than the corresponding RSI period length. If you set smoothing >= RSI length, it will be auto-adjusted to prevent invalid configurations.
Dynamic OB/OS: The dynamic thresholds automatically adapt to volatility. Adjust the volatility multiplier and base percentage to fine-tune sensitivity. Higher values create wider thresholds in volatile markets.
Volume Confirmation: Set volume threshold to 1.2 (default) for standard confirmation, higher for stricter filtering, or 0.1 to disable volume filtering entirely.
Multi-RSI Synergy: Use "ALL" mode for highest-quality signals (all 3 RSIs must align), or "2-of-3" mode for more frequent signals. Adjust the reset period to control signal frequency.
Filters: Enable filters gradually to find your preferred balance. Start with volume confirmation, then add trend filter, then ADX for strongest confirmation. RSI(50) filter is useful for momentum-based strategies and is recommended for noise reduction. Momentum confirmation and multi-timeframe confirmation add additional layers of accuracy but may reduce signal frequency.
Noise Reduction: The noise reduction system is enabled by default with balanced settings. Adjust minSignalStrength (default 3.0) to control how far RSI must be from centerline. Increase requireConsecutiveBars (default 1) to require signals to persist longer. Enable requireZonePersistence and requireRsiSlope for stricter filtering (higher quality but fewer signals). Start with defaults and adjust based on your needs.
Divergence: Enable divergence detection and adjust lookback periods. Strong divergence (with engulfing confirmation) provides higher-quality signals. Hidden divergence is useful for trend-following strategies. Enable pivot-based divergence for more accurate detection using actual pivot points instead of simple lowest/highest comparisons. Pivot-based divergence uses tolerance-based matching (1% for price, 1.0 RSI point for RSI) for better accuracy.
Forecasting: Enable regression forecasting to see potential RSI direction. Linear regression is simplest, polynomial captures curves, exponential smoothing adapts to trends. Adjust horizon based on your trading timeframe. Confidence bands show forecast uncertainty - wider bands indicate less reliable forecasts.
Pivot Trendlines: Enable pivot trendlines to visualize RSI trends and identify trend breaks. Adjust pivot detection period (default 5) - higher values detect fewer but stronger pivots. Enable pivot confirmation (default ON) to reduce repainting. Set minPivotStrength (default 1.0) to filter weak pivots - lower values detect more pivots (more trendlines), higher values detect only stronger pivots (fewer trendlines). Enable "Keep Historical Trendlines" to preserve multiple trendlines instead of just the most recent one. Set "Max Trendlines to Keep" (default 5) to control how many historical trendlines are preserved. Enable trend break confirmation for more reliable break signals. Adjust minTrendlineAngle (default 0.0) to filter flat trendlines - set to 0.1-0.5 to exclude weak trendlines.
Alerts: Set up alerts for your preferred signal types. Enable cooldown to prevent alert spam. Each signal type has its own alert condition, so you can be selective about which signals trigger alerts.
Visual Elements and Signal Markers
The script uses various visual markers to indicate signals and conditions:
- "sBottom" label (green): Strong bottom signal - RSI at extreme low with strong buy conditions
- "sTop" label (red): Strong top signal - RSI at extreme high with strong sell conditions
- "SyBuy" label (lime): Multi-RSI synergy buy signal - all RSIs aligned oversold
- "SySell" label (red): Multi-RSI synergy sell signal - all RSIs aligned overbought
- 🐂 emoji (green): Strong bullish divergence detected
- 🐻 emoji (red): Strong bearish divergence detected
- 🔆 emoji: Weak divergence signals (if enabled)
- "H-Bull" label: Hidden bullish divergence
- "H-Bear" label: Hidden bearish divergence
- ⚡ marker (top of pane): Volume climax detected (extreme volume) - positioned at top for visibility
- 💧 marker (top of pane): Volume dry-up detected (very low volume) - positioned at top for visibility
- ↑ triangle (lime): Uptrend break signal - RSI breaks below uptrend line
- ↓ triangle (red): Downtrend break signal - RSI breaks above downtrend line
- Triangle up (lime): RSI(50) bullish crossover
- Triangle down (red): RSI(50) bearish crossover
- Circle markers: RSI period crossovers
All markers are positioned at the RSI value where the signal occurs, using location.absolute for precise placement.
Signal Priority and Interpretation
Signals are generated independently and can occur simultaneously. Higher-priority signals generally indicate stronger setups:
1. Multi-RSI Synergy signals (SyBuy/SySell) - Highest priority: Requires alignment across all RSI periods plus volume and filter confirmation. These are the most reliable signals.
2. Strong Top/Bottom signals (sTop/sBottom) - High priority: Indicates extreme RSI levels with strong bounce conditions. Requires volume confirmation and all filters.
3. Divergence signals - Medium-High priority: Strong divergence (with engulfing) is more reliable than regular divergence. Hidden divergence indicates continuation rather than reversal.
4. Adaptive RSI crossovers - Medium priority: Buy when adaptive RSI crosses below dynamic oversold, sell when it crosses above dynamic overbought. These use volatility-adjusted RSI for more accurate signals.
5. RSI(50) centerline crossovers - Medium priority: Momentum shift signals. Less reliable alone but useful when combined with other confirmations.
6. RSI period crossovers - Lower priority: Early momentum shift indicators. Can provide early warning but may produce false signals in choppy markets.
Best practice: Wait for multiple confirmations. For example, a synergy signal combined with divergence and volume climax provides the strongest setup.
Chart Requirements
For proper script functionality and compliance with TradingView requirements, ensure your chart displays:
- Symbol name: The trading pair or instrument name should be visible
- Timeframe: The chart timeframe should be clearly displayed
- Script name: "Ultimate RSI " should be visible in the indicator title
These elements help traders understand what they're viewing and ensure proper script identification. The script automatically includes this information in the indicator title and chart labels.
Performance Considerations
The script is optimized for performance:
- ATR and Volume SMA are cached using var variables, updating only on confirmed and real-time bars to reduce redundant calculations
- Forecast line arrays are dynamically managed: lines are reused when possible, and unused lines are deleted to prevent memory accumulation
- Calculations use efficient Pine Script functions (ta.rsi, ta.ema, etc.) which are optimized by TradingView
- Array operations are minimized where possible, with direct calculations preferred
- Polynomial regression automatically caps the forecast horizon at 20 bars (POLYNOMIAL_MAX_HORIZON constant) to prevent performance degradation, as polynomial regression has O(n³) complexity. This safeguard ensures optimal performance even with large horizon settings
- Pivot detection includes edge case handling to ensure reliable calculations even on early bars with limited historical data. Regression forecasting functions include comprehensive safety checks: horizon validation (must not exceed array size), empty array handling, edge case handling for horizon=1 scenarios, and division-by-zero protection in all mathematical operations
The script should perform well on all timeframes. On very long historical data, forecast lines may accumulate if the horizon is large; consider reducing the forecast horizon if you experience performance issues. The polynomial regression performance safeguard automatically prevents performance issues for that specific regression type.
Known Limitations and Considerations
- Forecast lines are forward-looking projections and should not be used as definitive predictions. They provide context but are not guaranteed to be accurate.
- Dynamic OB/OS thresholds can exceed 100 or go below 0 in extreme volatility scenarios, but are clamped to 0-100 range. This means in very volatile markets, the dynamic thresholds may not widen as much as the raw calculation suggests.
- Volume confirmation requires sufficient historical volume data. On new instruments or very short timeframes, volume calculations may be less reliable.
- Higher timeframe RSI uses request.security() which may have slight delays on some data feeds.
- Regression forecasting requires at least N bars of history (where N = forecast horizon) before it can generate forecasts. Early bars will not show forecast lines.
- StochRSI calculation requires the selected RSI source to have sufficient history. Very short RSI periods on new charts may produce less reliable StochRSI values initially.
Practical Use Cases
The indicator can be configured for different trading styles and timeframes:
Swing Trading: Select the "Swing Trading" preset for instant optimal configuration. This preset uses RSI periods (14, 14, 21) with moderate smoothing. Alternatively, manually configure: Use RSI(24) with Multi-RSI Synergy in "ALL" mode, combined with trend filter (EMA 200) and ADX filter. This configuration provides high-probability setups with strong confirmation across multiple RSI periods.
Day Trading: Select the "Day Trading" preset for instant optimal configuration. This preset uses RSI periods (6, 9, 14) with light smoothing and momentum confirmation enabled. Alternatively, manually configure: Use RSI(6) with Zero-Lag smoothing for fast signal detection. Enable volume confirmation with threshold 1.2-1.5 for reliable entries. Combine with RSI(50) filter to ensure momentum alignment. Strong top/bottom signals work well for day trading reversals.
Trend Following: Enable trend filter (EMA) and EMA slope filter for strong trend confirmation. Use RSI(14) or RSI(24) with ADX filter to avoid choppy markets. Hidden divergence signals are useful for trend continuation entries.
Reversal Trading: Focus on divergence detection (regular and strong) combined with strong top/bottom signals. Enable volume climax detection to identify capitulation moments. Use RSI(6) for early reversal signals, confirmed by RSI(14) and RSI(24).
Forecasting and Planning: Enable regression forecasting with polynomial or exponential smoothing methods. Use forecast horizon of 10-20 bars for swing trading, 5-10 bars for day trading. Confidence bands help assess forecast reliability.
Multi-Timeframe Analysis: Enable higher timeframe RSI to see context from larger timeframes. For example, use daily RSI on hourly charts to understand the larger trend context. This helps avoid counter-trend trades.
Scalping: Select the "Scalping" preset for instant optimal configuration. This preset uses RSI periods (4, 7, 9) with minimal smoothing, disables noise reduction, and disables momentum confirmation for faster signals. Alternatively, manually configure: Use RSI(6) with minimal smoothing (or Zero-Lag) for ultra-fast signals. Disable most filters except volume confirmation. Use RSI period crossovers (RSI(6) × RSI(14)) for early momentum shifts. Set volume threshold to 1.0-1.2 for less restrictive filtering.
Position Trading: Select the "Position Trading" preset for instant optimal configuration. This preset uses extended RSI periods (24, 21, 28) with heavier smoothing, optimized for longer-term trades. Alternatively, manually configure: Use RSI(24) with all filters enabled (Trend, ADX, RSI(50), Volume Dry-Up avoidance). Multi-RSI Synergy in "ALL" mode provides highest-quality signals.
Practical Tips and Best Practices
Getting Started: The fastest way to get started is to select a configuration preset that matches your trading style. Simply choose "Scalping", "Day Trading", "Swing Trading", or "Position Trading" from the "Configuration Preset" dropdown to instantly configure all settings optimally. For advanced users, use "Custom" mode for full manual control. The default configuration (Custom mode) is balanced and works well across different markets. After observing behavior, customize settings to match your trading style.
Reducing Repainting: All signals are based on confirmed bars, minimizing repainting. The script uses confirmed bar data for all calculations to ensure backtesting accuracy.
Signal Quality: Multi-RSI Synergy signals in "ALL" mode provide the highest-quality signals because they require alignment across all three RSI periods. These signals have lower frequency but higher reliability. For more frequent signals, use "2-of-3" mode. The noise reduction system further improves signal quality by requiring multiple confirmations (signal strength, extreme zone, consecutive bars, optional zone persistence and RSI slope). Adjust noise reduction settings to balance signal frequency vs. accuracy.
Filter Combinations: Start with volume confirmation, then add trend filter for trend alignment, then ADX filter for trend strength. Combining all three filters significantly reduces false signals but also reduces signal frequency. Find your balance based on your risk tolerance.
Volume Filtering: Set volume threshold to 0.1 or lower to effectively disable volume filtering if you trade instruments with unreliable volume data or want to test without volume confirmation. Standard confirmation uses 1.2-1.5 threshold.
RSI Period Selection: RSI(6) is most sensitive and best for scalping or early signal detection. RSI(14) provides balanced signals suitable for day trading. RSI(24) is smoother and better for swing trading and trend confirmation. You can disable any RSI period you don't need to reduce visual clutter.
Smoothing Methods: EMA provides balanced smoothing with moderate lag. RMA (Wilder's smoothing) is traditional and works well for RSI. Zero-Lag reduces lag but may increase noise. WMA gives more weight to recent values. Choose based on your preference for responsiveness vs. smoothness.
Forecasting: Linear regression is simplest and works well for trending markets. Polynomial regression captures curves and works better in ranging markets. Exponential smoothing adapts to trends. Moving average method is most conservative. Use confidence bands to assess forecast reliability.
Divergence: Strong divergence (with engulfing confirmation) is more reliable than regular divergence. Hidden divergence indicates continuation rather than reversal, useful for trend-following strategies. Pivot-based divergence provides more accurate detection by using actual pivot points instead of simple lowest/highest comparisons. Adjust lookback periods based on your timeframe: shorter for day trading, longer for swing trading. Pivot divergence period (default 5) controls the sensitivity of pivot detection.
Dynamic Thresholds: Dynamic OB/OS thresholds automatically adapt to volatility. In volatile markets, thresholds widen; in calm markets, they narrow. Adjust the volatility multiplier and base percentage to fine-tune sensitivity. Higher values create wider thresholds in volatile markets.
Alert Management: Enable alert cooldown (default 10 bars, recommended) to prevent alert spam. Each alert type has its own cooldown, so you can set different cooldowns for different signal types. For example, use shorter cooldown for synergy signals (high quality) and longer cooldown for crossovers (more frequent). The cooldown system works independently for each signal type, preventing spam while allowing different signal types to fire when appropriate.
Technical Specifications
- Pine Script Version: v6
- Indicator Type: Non-overlay (displays in separate panel below price chart)
- Repainting Behavior: Minimal - all signals are based on confirmed bars, ensuring accurate backtesting results
- Performance: Optimized with caching for ATR and volume calculations. Forecast arrays are dynamically managed to prevent memory accumulation.
- Compatibility: Works on all timeframes (1 minute to 1 month) and all instruments (stocks, forex, crypto, futures, etc.)
- Edge Case Handling: All calculations include safety checks for division by zero, NA values, and boundary conditions. Reset conditions and alert cooldowns handle edge cases where conditions never occurred or values are NA.
- Reset Logic: Separate reset conditions for buy signals (based on bottom conditions) and sell signals (based on top conditions) ensure logical correctness.
- Input Parameters: 60+ customizable parameters organized into logical groups for easy configuration. Configuration presets available for instant setup (Scalping, Day Trading, Swing Trading, Position Trading, Custom).
- Noise Reduction: Comprehensive noise reduction system with multiple filters (signal strength, extreme zone, consecutive bars, zone persistence, RSI slope) to reduce false signals.
- Pivot-Based Divergence: Enhanced divergence detection using actual pivot points for improved accuracy.
- Momentum Confirmation: RSI momentum filter ensures signals only fire when RSI is accelerating in the signal direction.
- Multi-Timeframe Confirmation: Optional higher timeframe RSI alignment for trend confirmation.
- Enhanced Pivot Trendlines: Trendline drawing with strength requirements, confirmation, and trend break detection.
Technical Notes
- All RSI values are clamped to 0-100 range to ensure valid oscillator values
- ATR and Volume SMA are cached for performance, updating on confirmed and real-time bars
- Reset conditions handle edge cases: if a condition never occurred, reset returns true (allows first signal)
- Alert cooldown handles na values: if no previous alert, cooldown allows the alert
- Forecast arrays are dynamically sized based on horizon, with unused lines cleaned up
- Fill logic uses a minimum gap (0.1) to ensure reliable polygon rendering in TradingView
- All calculations include safety checks for division by zero and boundary conditions. Regression functions validate that horizon doesn't exceed array size, and all array access operations include bounds checking to prevent out-of-bounds errors
- The script uses separate reset conditions for buy signals (based on bottom conditions) and sell signals (based on top conditions) for logical correctness
- Background coloring uses a fallback system: dynamic color takes priority, then RSI(6) heatmap, then monotone if both are disabled
- Noise reduction filters are applied after accuracy filters, providing multiple layers of signal quality control
- Pivot trendlines use strength requirements to filter weak pivots, reducing noise in trendline drawing. Historical trendlines are stored in arrays and automatically limited to prevent memory accumulation when "Keep Historical Trendlines" is enabled
- Volume climax and dry-up markers are positioned at the top of the pane for better visibility
- All calculations are optimized with conditional execution - features only calculate when enabled (performance optimization)
- Input Validation: Automatic cross-input validation ensures smoothing lengths are always less than RSI period lengths, preventing configuration errors
- Configuration Presets: Four optimized preset configurations (Scalping, Day Trading, Swing Trading, Position Trading) for instant setup, plus Custom mode for full manual control
- Constants Management: Magic numbers extracted to documented constants for improved maintainability and easier tuning (pivot tolerance, divergence thresholds, fill gap, etc.)
- TradingView Function Consistency: All TradingView functions (ta.crossover, ta.crossunder, ta.atr, ta.lowest, ta.highest, ta.lowestbars, ta.highestbars, etc.) and custom functions that depend on historical results (f_consecutiveBarConfirmation, f_rsiSlopeConfirmation, f_rsiZonePersistence, f_applyAllFilters, f_rsiMomentum, f_forecast, f_confirmPivotLow, f_confirmPivotHigh) are called on every bar for consistency, as recommended by TradingView. Results are then used conditionally when needed. This ensures consistent calculations and prevents calculation inconsistencies.

Quantum Ribbon Lite📊 WHAT IS IT?
Quantum Ribbon Lite is a trend trading indicator built on a 5-layer exponential moving average ribbon system. It analyzes price momentum, volume, and ribbon alignment to generate entry signals with pre-calculated stop loss and take profit levels.
The indicator is designed for traders who want a straightforward approach to trend trading without managing complex configurations.
🔧 HOW IT WORKS
The Ribbon System
The indicator uses 5 pairs of EMAs (10 moving averages total) that create colored "clouds" on your chart:
Blue/Teal ribbons indicate bullish alignment
Red/Pink ribbons indicate bearish alignment
Mixed colors indicate neutral or transitional periods
The ribbon spacing automatically adjusts from a fast EMA (21) to a slow EMA (60), creating layers that show trend strength and direction.
Signal Generation
Signals appear when multiple conditions align:
For LONG signals:
Fast EMAs are above slow EMAs
Price momentum is positive and strong (> 0.5 ATR)
Volume is above average (> 1.1x average)
Ribbon confirms bullish state
Minimum confidence threshold met (filters weak setups)
For SHORT signals:
Fast EMAs are below slow EMAs
Price momentum is negative and strong
Volume is above average
Ribbon confirms bearish state
Minimum confidence threshold met
📈 VISUAL COMPONENTS
Entry Signals
Green "BUY" label = Long entry signal at candle close
Red "SELL" label = Short entry signal at candle close
Signals only trigger on confirmed candle closes (no repainting).
Risk Management Lines
Three lines appear when you have an active position:
White dotted line = Entry price
Red dotted line = Stop loss level
Green dotted line = Take profit target
Performance Dashboard
The stats table shows:
Current position status (In Long/Short or Waiting for signal)
Entry, stop, and target prices when in a trade
Win/loss record
Win rate percentage with color coding
⚙️ SETTINGS
1. Signal Sensitivity (1-10)
Controls the minimum time between signals (cooldown period):
1 = 2 bars between signals (most frequent)
5 = 10 bars between signals (balanced)
10 = 20 bars between signals (most selective)
Lower values generate more signals, higher values filter for better setups.
2. Stop Loss Distance
Determines how stops are calculated using ATR (Average True Range):
Tight = 1.5x ATR from entry
Normal = 2.0x ATR from entry
Wide = 2.5x ATR from entry
ATR adapts to market volatility, so stops are tighter in calm markets and wider in volatile markets.
3. Take Profit Target
Sets your risk-to-reward ratio:
1.5R = Target is 1.5 times your risk
2R = Target is 2 times your risk
3R = Target is 3 times your risk
Example: With a $100 stop distance and 2R setting, your take profit will be $200 away from entry.
4. Show Stats Table
Toggle to show/hide the performance dashboard in the top-right corner.
5. Show Risk Lines
Toggle to show/hide the entry/stop/target lines on the chart.
📋 HOW TO USE
Step 1: Apply to Chart
Add the indicator to your preferred instrument and timeframe (daily recommended).
Step 2: Wait for Signal
A BUY or SELL label will appear on the chart when conditions align.
Step 3: Enter Position
Enter at the close of the signal candle in the indicated direction.
Step 4: Set Risk Parameters Use the displayed lines:
Red line = Your stop loss
Green line = Your take profit
Step 5: Hold Position
Wait for the position to hit either the stop or target. No new signals will appear while you're in a position.
Step 6: Review Results
Check the stats table to track your win rate and adjust settings if needed.
🎯 RISK MANAGEMENT
Stop Loss Calculation
Stops are based on ATR (Average True Range) which measures recent price volatility:
In quiet markets: Stops are placed closer to entry
In volatile markets: Stops are placed further away
This adaptive approach helps prevent stop-hunting while maintaining appropriate risk levels.
Take Profit Calculation
Targets are calculated as a multiple of your stop distance:
If stop is 50 points away and you use 2R, target is 100 points away
Maintains consistent risk-reward ratios across all trades
Required Win Rates To break even after fees:
1.5R requires ~40% win rate
2R requires ~34% win rate
3R requires ~25% win rate
📊 RECOMMENDED USAGE
Timeframes:
Daily charts show strongest performance in testing
4H and 1H timeframes work but may have lower win rates
Lower timeframes generate more signals but reduced quality
Markets:
Works on all instruments: Stocks, Forex, Crypto, Futures, Indices
Best suited for trending markets
May generate false signals in tight ranges or choppy conditions

Correlation Scanner📊 CORRELATION SCANNER - Financial Instruments Correlation Analyzer
🎯 ORIGINALITY AND PURPOSE
Correlation Scanner is a professional tool for analyzing correlation relationships between different financial instruments. Unlike standard correlation indicators that show the relationship between only two instruments, this script allows you to simultaneously track the correlation of up to 10 customizable instruments with a selected base asset.
The indicator is designed for traders working with cross-market analysis, portfolio diversification, and searching for related assets for arbitrage strategies.
🔧 HOW IT WORKS
The indicator uses the built-in ta.correlation() function to calculate the Pearson correlation coefficient between instrument closing prices over a specified period. Mathematical foundation:
1. Correlation Calculation: for each instrument, the correlation coefficient with the base asset is calculated over N bars (default 60)
2. Results Sorting: instruments are automatically ranked by absolute correlation value (from strongest to weakest)
3. Visualization: results are displayed in a table with color coding:
- Green: positive correlation (instruments move in the same direction)
- Red: negative correlation (instruments move in opposite directions)
- Color intensity depends on correlation strength
4. Correlation Strength Classification:
- Very Strong (💪💪💪): |r| > 0.8 — very strong relationship
- Strong (💪💪): |r| > 0.6 — strong relationship
- Medium (💪): |r| > 0.4 — medium relationship
- Weak: |r| > 0.2 — weak relationship
- Very Weak: |r| ≤ 0.2 — very weak relationship
📋 SETTINGS AND USAGE
MAIN PARAMETERS:
• Main Instrument — base instrument for comparison (default TVC:DXY - US Dollar Index)
• Correlation Period — calculation period in bars (10-500, default 60)
• Number of Instruments to Display — number of instruments to show (1-10)
• Table Position — table location on the chart
INSTRUMENT CONFIGURATION:
The indicator allows configuring up to 10 instruments for analysis. For each, you can specify:
• Instrument — instrument ticker (e.g., FX_IDC:EURUSD)
• Name — display name (emojis supported)
VISUAL SETTINGS:
• Show Chart Label with Correlation — display current chart's correlation with base instrument
• Table Header Color — table header color
• Table Row Background — table row background color
💡 USAGE EXAMPLES
1. DOLLAR IMPACT ANALYSIS: set DXY as the base instrument and track how dollar index changes affect currency pairs, gold, and cryptocurrencies
2. HEDGING ASSETS SEARCH: find instruments with strong negative correlation for risk diversification
3. PAIRS TRADING: identify assets with high positive correlation to find divergences and arbitrage opportunities
4. CROSS-MARKET ANALYSIS: track relationships between stocks, bonds, commodities, and currencies
5. SYSTEMIC RISK ASSESSMENT: identify periods of increased correlation between assets, which may indicate systemic risks
⚠️ IMPORTANT NOTES
• Correlation does NOT imply causation
• Correlation can change over time — regularly review the analysis period
• High past correlation doesn't guarantee the relationship will persist in the future
• Recommended to use the indicator in combination with fundamental analysis
🔔 ALERTS
The indicator includes a built-in alert condition: triggers when strong correlation (|r| > 0.8) is detected between the current chart and the base instrument.

Buffett Quality Filter (TTM)//@version=6
indicator("Buffett Quality Filter (TTM)", overlay = true, max_labels_count = 500)
// 1. Get financial data (TTM / FY / FQ)
// EPS (TTM) for P/E
eps = request.financial(syminfo.tickerid, "EARNINGS_PER_SHARE_BASIC", "TTM")
// Profitability & moat (annual stats)
roe = request.financial(syminfo.tickerid, "RETURN_ON_EQUITY", "FY")
roic = request.financial(syminfo.tickerid, "RETURN_ON_INVESTED_CAPITAL", "FY")
// Margins (TTM – rolling 12 months)
grossMargin = request.financial(syminfo.tickerid, "GROSS_MARGIN", "TTM")
netMargin = request.financial(syminfo.tickerid, "NET_MARGIN", "TTM")
// Balance sheet safety (quarterly)
deRatio = request.financial(syminfo.tickerid, "DEBT_TO_EQUITY", "FQ")
currentRat = request.financial(syminfo.tickerid, "CURRENT_RATIO", "FQ")
// Growth (1-year change, TTM)
epsGrowth1Y = request.financial(syminfo.tickerid, "EARNINGS_PER_SHARE_BASIC_ONE_YEAR_GROWTH", "TTM")
revGrowth1Y = request.financial(syminfo.tickerid, "REVENUE_ONE_YEAR_GROWTH", "TTM")
// Free cash flow (TTM) and shares to build FCF per share for P/FCF
fcf = request.financial(syminfo.tickerid, "FREE_CASH_FLOW", "TTM")
sharesOut = request.financial(syminfo.tickerid, "TOTAL_SHARES_OUTSTANDING", "FQ")
fcfPerShare = (not na(fcf) and not na(sharesOut) and sharesOut != 0) ? fcf / sharesOut : na
// 2. Valuation ratios from price
pe = (not na(eps) and eps != 0) ? close / eps : na
pFcf = (not na(fcfPerShare) and fcfPerShare > 0) ? close / fcfPerShare : na
// 3. Thresholds (Buffett-style, adjustable)
minROE = input.float(15.0, "Min ROE %")
minROIC = input.float(12.0, "Min ROIC %")
minGM = input.float(30.0, "Min Gross Margin %")
minNM = input.float(8.0, "Min Net Margin %")
maxDE = input.float(0.7, "Max Debt / Equity")
minCurr = input.float(1.3, "Min Current Ratio")
minEPSG = input.float(8.0, "Min EPS Growth 1Y %")
minREVG = input.float(5.0, "Min Revenue Growth 1Y %")
maxPE = input.float(20.0, "Max P/E")
maxPFCF = input.float(20.0, "Max P/FCF")
// 4. Individual conditions
cROE = not na(roe) and roe > minROE
cROIC = not na(roic) and roic > minROIC
cGM = not na(grossMargin) and grossMargin > minGM
cNM = not na(netMargin) and netMargin > minNM
cDE = not na(deRatio) and deRatio < maxDE
cCurr = not na(currentRat) and currentRat > minCurr
cEPSG = not na(epsGrowth1Y) and epsGrowth1Y > minEPSG
cREVG = not na(revGrowth1Y) and revGrowth1Y > minREVG
cPE = not na(pe) and pe < maxPE
cPFCF = not na(pFcf) and pFcf < maxPFCF
// 5. Composite “Buffett Score” (0–10) – keep it on ONE line to avoid line-continuation errors
score = (cROE ? 1 : 0) + (cROIC ? 1 : 0) + (cGM ? 1 : 0) + (cNM ? 1 : 0) + (cDE ? 1 : 0) + (cCurr ? 1 : 0) + (cEPSG ? 1 : 0) + (cREVG ? 1 : 0) + (cPE ? 1 : 0) + (cPFCF ? 1 : 0)
// Strictness
minScoreForPass = input.int(7, "Min score to pass (0–10)", minval = 1, maxval = 10)
passes = score >= minScoreForPass
// 6. Visuals
bgcolor(passes ? color.new(color.green, 80) : na)
plot(score, "Buffett Score (0–10)", color = color.new(color.blue, 0))
// Info label on last bar
var label infoLabel = na
if barstate.islast
if not na(infoLabel)
label.delete(infoLabel)
infoText = str.format(
"Buffett score: {0}\nROE: {1,number,#.0}% | ROIC: {2,number,#.0}%\nGM: {3,number,#.0}% | NM: {4,number,#.0}%\nP/E: {5,number,#.0} | P/FCF: {6,number,#.0}\nD/E: {7,number,#.00} | Curr: {8,number,#.00}",
score, roe, roic, grossMargin, netMargin, pe, pFcf, deRatio, currentRat)
infoLabel := label.new(bar_index, high, infoText,
style = label.style_label_right,
color = color.new(color.black, 0),
textcolor = color.white,
size = size.small)

Grok/Claude Quantum Signal Pro * Enhanced v2# QSig Pro+ v2 — Dynamic RSI Enhancement
## Release: Quantum Signal Pro Enhanced v2
**Author:** ralis24 (with Claude assistance)
**Version:** 2.0
**Platform:** TradingView (Pine Script v6)
---
## Overview
Version 2 introduces **Trend-Adaptive RSI Thresholds** — a significant enhancement that dynamically adjusts buy and sell levels based on real-time trend strength. This allows the indicator to more effectively capture dips in uptrends and sell bounces in downtrends, rather than waiting for extreme oversold/overbought conditions that rarely occur during strong directional moves.
---
## The Problem v2 Solves
In the original QSig Pro+, RSI thresholds were fixed at 30 (oversold) and 70 (overbought). While these levels work well in ranging markets, they create issues in trending conditions:
- **Strong Uptrends:** Price rarely drops to RSI 30. Pullbacks typically bottom around RSI 40-50, causing missed buy opportunities.
- **Strong Downtrends:** Relief rallies rarely push RSI above 70. Bounces often exhaust around RSI 55-65, causing missed sell opportunities.
The v2 solution: **Let the market's trend strength dictate the appropriate RSI levels.**
---
## New Feature: Dynamic RSI Thresholds
### How It Works
The indicator now detects three distinct market states and applies corresponding RSI thresholds:
| Market State | Detection Criteria | RSI Buy Level | RSI Sell Level |
|--------------|-------------------|---------------|----------------|
| **Strong Uptrend** | +DI > -DI, ADX > 24, ADX rising | < 40 | > 80 |
| **Strong Downtrend** | -DI > +DI, ADX > 24, ADX rising | < 20 | > 60 |
| **Neutral/Ranging** | ADX < 24 or ADX falling | < 30 | > 70 |
### Trend State Detection Logic
```
Strong Uptrend = (+DI > -DI) AND (ADX > threshold) AND (ADX > ADX )
Strong Downtrend = (-DI > +DI) AND (ADX > threshold) AND (ADX > ADX )
Neutral = Neither condition met
```
### Anti-Whipsaw Protection
To prevent rapid switching between threshold sets during choppy transitions, a **confirmation buffer** requires the trend state to persist for a configurable number of bars (default: 2) before the indicator switches regimes.
---
## New Input Parameters
A new input group "**Dynamic RSI Thresholds**" has been added with the following settings:
| Parameter | Default | Range | Description |
|-----------|---------|-------|-------------|
| Enable Trend-Adaptive RSI Levels | ON | toggle | Master switch for the feature |
| ADX Strong Trend Threshold | 24 | 15-40 | ADX must exceed this to qualify as "strong" trend |
| ADX Rising Lookback (bars) | 3 | 1-10 | ADX must be higher than N bars ago to confirm rising |
| Trend Confirmation Bars | 2 | 1-5 | Bars trend must persist before switching thresholds |
| RSI Buy Level (Strong Uptrend) | 40 | 30-55 | Oversold threshold during confirmed uptrends |
| RSI Sell Level (Strong Uptrend) | 80 | 70-90 | Overbought threshold during confirmed uptrends |
| RSI Buy Level (Strong Downtrend) | 20 | 10-30 | Oversold threshold during confirmed downtrends |
| RSI Sell Level (Strong Downtrend) | 60 | 50-70 | Overbought threshold during confirmed downtrends |
| RSI Buy Level (Neutral/Ranging) | 30 | 20-40 | Standard oversold threshold |
| RSI Sell Level (Neutral/Ranging) | 70 | 60-80 | Standard overbought threshold |
---
## Enhanced Info Panel
The information panel now displays two new rows:
1. **Trend State** — Shows current regime: "STRONG UP" (green), "STRONG DOWN" (red), or "NEUTRAL" (gray)
2. **RSI Levels** — Displays the currently active thresholds (e.g., "40 / 80" during uptrends)
Additionally, the **ADX row** now includes a directional arrow (↑ or ↓) indicating whether ADX is rising or falling.
---
## Enhanced Signal Labels
Buy and sell labels on the chart now include contextual information:
**Before (v1):**
```
BUY: 97,234.50
```
**After (v2):**
```
BUY: 97,234.50
STRONG UP | RSI<40
```
This provides immediate visual confirmation of which threshold regime triggered the signal.
---
## Enhanced Alert System
### New Alert Conditions
Three new alerts have been added for trend state changes:
- **🔼 Strong Uptrend Started** — Fires when market transitions to strong uptrend (thresholds shift to 40/80)
- **🔽 Strong Downtrend Started** — Fires when market transitions to strong downtrend (thresholds shift to 20/60)
- **⚖️ Trend Neutralized** — Fires when trend weakens and thresholds reset to 30/70
### Enhanced Webhook JSON
The JSON alert payload now includes additional fields for bot integration:
```json
{
"action": "BUY",
"symbol": "BTC/USDT",
"price": "97234.50",
"rsi": "38.5",
"rsi_threshold": "40",
"adx": "28.3",
"fisher": "-1.87",
"trend_state": "STRONG UP"
}
```
---
## Bonus Enhancement: Dynamic Fisher Thresholds
As an additional refinement, the Fisher Transform thresholds now adjust slightly based on trend state:
| Trend State | Fisher Buy Level | Fisher Sell Level |
|-------------|------------------|-------------------|
| Strong Uptrend | -1.5 (loosened) | -2.0 (standard) |
| Strong Downtrend | -2.0 (standard) | +1.5 (loosened) |
| Neutral | -2.0 (standard) | +2.0 (standard) |
This allows the indicator to trigger signals in strong trends where momentum oscillators rarely reach extreme levels.
---
## Practical Trading Impact
### Strong Uptrend Example (BTC rally)
- **Before:** Waiting for RSI < 30 means missing most pullback entries
- **After:** RSI < 40 triggers buy signals on normal pullbacks within the trend
### Strong Downtrend Example (Bear market bounce)
- **Before:** Waiting for RSI > 70 means holding through entire relief rallies
- **After:** RSI > 60 triggers sell signals on bounce exhaustion
### Ranging Market
- Thresholds remain at traditional 30/70 levels where mean reversion works best
---
## Backward Compatibility
The dynamic RSI feature can be completely disabled by turning off "Enable Trend-Adaptive RSI Levels" in the settings. When disabled, the indicator behaves identically to v1 using the neutral threshold values (30/70).
---
## Summary of Changes
| Component | v1 | v2 |
|-----------|----|----|
| RSI Thresholds | Fixed 30/70 | Dynamic based on trend state |
| Trend State Detection | Not present | +DI/-DI + ADX + Rising confirmation |
| Whipsaw Protection | Not present | Configurable confirmation bars |
| Info Panel Rows | 10 | 12 (added Trend State, RSI Levels) |
| ADX Display | Value only | Value + direction arrow |
| Signal Labels | Price only | Price + Trend State + Threshold |
| Alert Conditions | 10 | 13 (added 3 trend state alerts) |
| Webhook Fields | 5 | 7 (added rsi_threshold, trend_state) |
| Fisher Thresholds | Fixed | Adaptive (subtle adjustment) |
---
## Recommended Settings by Market Type
### Crypto (High Volatility)
- ADX Strong Trend Threshold: 24
- RSI Buy (Uptrend): 40-45
- RSI Sell (Downtrend): 55-60
### Forex (Medium Volatility)
- ADX Strong Trend Threshold: 22
- RSI Buy (Uptrend): 38-42
- RSI Sell (Downtrend): 58-62
### Stocks/Indices (Lower Volatility)
- ADX Strong Trend Threshold: 20
- RSI Buy (Uptrend): 35-40
- RSI Sell (Downtrend): 60-65
---
## Installation
1. Open TradingView and navigate to Pine Editor
2. Remove or rename existing QSig Pro+ indicator
3. Paste the complete v2 code
4. Click "Add to Chart"
5. Configure Dynamic RSI Thresholds in settings as desired
---
*QSig Pro+ v2 — Smarter entries through trend-aware signal generation*
