CCI & EMA_CROSS_PaydarCCI & EMA_CROSS_Paydar
Hello everyone
This indicator is actually a very efficient oscillator,
This system is a unique combination of indicators CCI and EMA, which of course has special settings, these settings are adjusted as much as possible due to signaling.
As you can see in the picture:
CCI: the two colors line, green and red, are actually the same indicator CCI that I set to 20.
*Note that in index CCI I have set the lines +100 and -100 to +75 and -75 for less error and a stronger signal to sell or buy.
EMA: The white line, which is in the form of steps, is in fact the same indicator of EMA, which I have considered as a value of 9.
_________________________________________________________________________________________________________
Instructions
-> areas:
Zone +75 to +200 = positive range or incremental price or bullish
Zone +75 to -75 = Neutral range or almost constant price (no fluctuations or very wet fluctuations)
Zone -75 to -200 = single range or discount price or bearish
->How to use:
Buy = In the bearish range, if line CCI intersects line EMA upwards and goes to the neutral zone.
None = if the index (or index lines) collide in the neutral zone
Sell = In the bullish range, if line CCI intersects line EMA down and goes to the neutral zone.
-> Please comment on this system or if you have a good experience in changing the values of the indicators or it seems to you, please share.
With great respect to:
Who had published the main idea of this system.
Search in scripts for "CCI"

CCI + EMA with RSI Cross StrategyThis strategy uses the CCI + 2 RSIs + 2 EMAs to generate trade signals. Trades are only taken during the normal trading session and all open trades are closed 15 min before the close of the current session. A trailing stop loss is used and is customizable.
Not trading advice, use at your own risk.

CCI with Subjective NormalizationCCI (Commodity Channel Index) with Subjective Normalization
This indicator computes the classic CCI over a user-defined length, then applies a subjective mean and scale to transform the raw CCI into a pseudo Z‑score range. By adjusting the “Subjective Mean” and “Subjective Scale” inputs, you can shift and rescale the oscillator to highlight significant tops and bottoms more clearly in historical data.
1. CCI Calculation:
- Uses the standard formula \(\text{CCI} = \frac{\text{price} - \text{SMA(price, length)}}{0.015 \times \text{mean deviation}}\) over a user-specified length (default 500 bars).
2. Subjective Normalization:
- After CCI is calculated, it is divided by “Subjective Scale” and offset by “Subjective Mean.”
- This step effectively re-centers and re-scales the oscillator, helping you align major lows or highs at values like –2 or +2 (or any desired range).
3. Usage Tips:
- CCI Length controls how far back the script measures average price and deviation. Larger values emphasize multi-year cycles.
- Subjective Mean and Scale let you align the oscillator’s historical lows and highs with numeric levels you prefer (e.g., near ±2).
- Adjust these parameters to fit your particular market analysis or to match known cycle tops/bottoms.
4. Plot & Zero Line:
- The indicator plots the normalized CCI in yellow, along with a zero line for quick reference.
- Positive values suggest price is above its long-term mean, while negative values suggest it’s below.
This approach offers a straightforward momentum oscillator (CCI) combined with a customizable normalization, making it easier to spot historically significant overbought/oversold conditions without writing complex code yourself.

CCI with Zero Signal by Edwin KCCI with Zero Signal by Edwin K is a custom Commodity Channel Index (CCI) indicator designed for traders to analyze market trends and momentum more effectively. It combines the CCI calculation with a visually distinct histogram and color-coded candlestick bars for enhanced clarity and decision-making.
Key Features:
CCI Line:
Plots the CCI line based on the specified length (default: 21).
Helps identify overbought or oversold conditions, momentum shifts, and trend reversals.
Zero Signal Line:
A horizontal line at 0 serves as a reference point to distinguish between bullish and bearish momentum.
Histogram:
Displays a histogram that reflects the CCI's values.
Histogram bars change colors dynamically based on their relation to the zero line and the trend's direction.
Green/Lime: Positive momentum (above zero).
Red/Maroon: Negative momentum (below zero).
Candlestick Coloring:
Automatically paints candlesticks based on the histogram's color.
Provides an intuitive visual cue for momentum shifts directly on the price chart.
Use Cases:
Trend Confirmation: Use the histogram and candlestick colors to confirm the strength and direction of trends.
Momentum Shifts: Identify transitions between bullish and bearish momentum when the CCI crosses the zero line.
Entry and Exit Points: Combine this indicator with other tools to pinpoint optimal trade entries and exits.
This indicator offers a user-friendly yet powerful visualization of the CCI, making it an excellent tool for traders aiming to enhance their technical analysis.

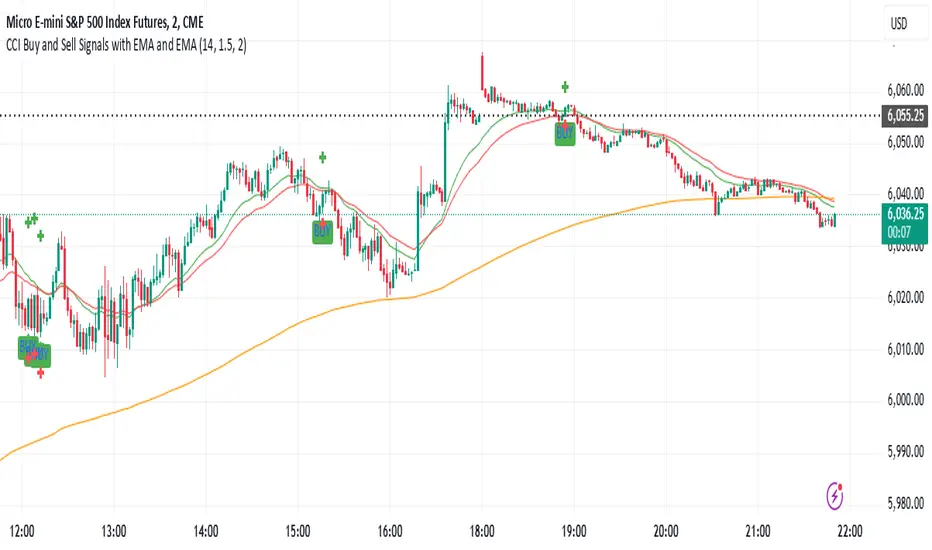
CCI Buy and Sell Signals with 20/30 EMACCI Buy and Sell Signals with EMA and ATR Stop Loss/Take Profit
This indicator is designed to identify buy and sell signals based on a combination of the Commodity Channel Index (CCI) and Exponential Moving Averages (EMA). It also includes an optional ATR-based stop loss and take profit system, which is useful for traders who want to manage their trades with dynamic risk levels.
Features:
CCI Buy and Sell Signals:
Buy Signal: A buy signal is triggered when the CCI crosses up through -100 (from an oversold condition), the 20-period EMA is above the 30-period EMA, and the price is above the 200-period EMA. This suggests that the market is entering an upward trend.
Sell Signal: A sell signal is triggered when the CCI crosses down through +100 (from an overbought condition), the 20-period EMA is below the 30-period EMA, and the price is below the 200-period EMA. This suggests that the market is entering a downward trend.
Exponential Moving Averages (EMA):
The script plots three EMAs:
20-period EMA (Green): Used to identify short-term trends.
30-period EMA (Red): Used to capture medium-term trends.
200-period EMA (Orange): A long-term trend filter, with the price above it generally indicating bullish conditions and below it indicating bearish conditions.
ATR-Based Stop Loss and Take Profit:
Optional Feature: The ATR (Average True Range) indicator can be used to set stop loss and take profit levels based on market volatility.
Stop Loss: Set at a multiple of the ATR below the entry price for long positions and above the entry price for short positions.
Take Profit: Set at a multiple of the ATR above the entry price for long positions and below the entry price for short positions.
Customizable: You can adjust the ATR length, Stop Loss Multiplier, and Take Profit Multiplier through the settings.
Dots: The stop loss and take profit levels are plotted as dots on the chart when the ATR feature is enabled.
Alert Conditions:
Buy Signal Alert: Triggered when a buy signal occurs based on CCI crossing up -100 and other conditions being met.
Sell Signal Alert: Triggered when a sell signal occurs based on CCI crossing down +100 and other conditions being met.
Any Signal Alert: This is a combined alert that triggers for either a buy or sell signal. It helps you stay updated on both types of signals simultaneously.
How to Use:
The indicator will plot buy and sell arrows on the chart, giving clear entry points for trades based on CCI and EMA conditions.
The ATR stop loss and take profit dots (when enabled) provide automatic risk management levels, adjusting dynamically with market volatility.
Traders can customize the ATR settings to fine-tune their stop loss and take profit levels, making this strategy adaptable to different trading styles and market conditions.
CCI - SWIFF KNIFECCI indicator swiff knife.
A lot of different usages of CCI ae possible with this script :
- 2 CCI lines crossovers.
- CCI - 0 Line crossovers
- CCI + Moving Average crossovers (many types of MA are available)
Filters can be added.
CCI can be used as a confirmation indicator, a continuation indicator, an exit indicator, a chopiness indicator .... It can even make coffee, who knows.

CCI Stochastic - YOSI
CCI Stochastic (Pro v6) – MTF, Adaptive Bands & Live Label
What it does
This indicator applies a Stochastic calculation on the CCI (K/D lines) to highlight momentum shifts, overbought/oversold zones, and adaptive market regimes. It comes with optional higher-timeframe confirmation, adaptive volatility bands, a live value label, and built-in alerts.
Key Features
Core Signal: Choose between D or K line of the Stoch-CCI.
Extreme Zones: Customizable OB/OS thresholds (default 80/20) and a midline (50), with dynamic background shading.
Adaptive Bands (optional): Mean ± k·standard deviation of the signal, to capture cyclic extremes.
MTF Confirmation (optional): Fetches the same signal from a higher timeframe via request.security.
Arrows/Signals:
Enter – Cross above OS (Buy) / below OB (Sell).
Center – Cross of the 50 midline (momentum shift).
Exit – Exit from extreme zones.
Alerts: All arrow signals + adaptive band crosses.
Live Value Label: Shows the latest signal value near the last bar, customizable decimals/offset/background colors.
Visuals: Red line above OB, green below OS, gray neutral; adaptive band fills.
Use Cases
Momentum / Reversals: Enter with OS/OB crosses confirmed by MTF.
Trend validation: Combine with moving averages (e.g., EMA200) or support/resistance.
Mean Reversion: Fade extreme zones, especially with adaptive band or OB/OS exit alerts.
Inputs
CCI Period, Stoch Period, Smooth K/D – core calculation.
Overbought / Oversold – thresholds (default 80/20).
Line to plot – K or D.
Show Arrows (Enter, Center, Exit) – visual control.
Adaptive Bands – length and k multiplier.
Higher TF – optional confirmation timeframe.
Live Label – decimals, offset, colors.
Quick Tips
For scalping/short-term setups: tighten OB/OS (e.g., 85/15) to filter noise.
In high volatility: increase adaptLen or decrease k to smooth bands.
Reduce false signals: require local + MTF alignment (e.g., only long if MTF > 50).
Disclaimer
This is a technical analysis tool – not a standalone buy/sell signal. Always use with proper risk management, key levels, and confluence from multiple factors.
מה זה עושה?
האינדיקטור מחשב Stochastic על CCI (קו K/D) ומציג אזורי קיצון, חציות ומשטרי שוק. הוא כולל אופציה לאישור מטיימפריים גבוה, בנדים אדפטיביים, תווית ערך חיה והתרעות מוכנות.
יכולות עיקריות
סיגנל מרכזי: בחירה בין קו D או K של Stoch-CCI.
אזורי קיצון: קווים ניתנים להגדרה (ברירת מחדל 80/20) וקו אמצע 50, עם צביעת רקע דינמית כשנכנסים לקיצון.
Adaptive Bands (אופציונלי): ממוצע ± k·סטיית תקן של הסיגנל—מסייע לזהות overheat ומחזוריות.
אישור MTF (אופציונלי): אותו סיגנל מטיימפריים גבוה באמצעות request.security.
חיצים/סיגנלים:
Enter – חציה מלמטה מעל OS (קנייה) / מלמעלה מתחת OB (מכירה).
Center – חציה של 50 (שינוי מומנטום).
Exit – יציאה מאזורים קיצוניים (OS/OB).
Alerts: לכל הסיגנלים לעיל + כניסה/יציאה לבנדים האדפטיביים.
תווית ערך חיה: מציגה את ערך הסיגנל האחרון ליד הנקודה (ספרות ו־offset ניתנים להגדרה).
עיצוב קריא: צבע קו אדום מעל OB, ירוק מתחת OS, אפור ניטרלי; מילוי אזורים.
שימוש מומלץ
מומנטום/היפוכים: כניסה עם חציה מה-OS/OB ואישור מה-MTF.
ממוצע נע/רמות מחיר: חברו לאימות מגמה (למשל EMA200 או תמיכה/התנגדות).
Mean Reversion: חיפוש חזרה מאזורי קיצון, במיוחד כשיש התרעת יציאה מ-OB/OS או נגיעה בבנד אדפטיבי.
קלטים מרכזיים
CCI Period, Stoch Period, Smooth K/D – פרמטרי חישוב.
Overbought / Oversold – ספי קיצון (ברירת מחדל 80/20).
Line to plot – בחירה בין K או D.
Show Arrows/Center/Exit/Enter – שליטה בתצוגת החיצים.
Adaptive Bands (len, k) – חלון ורגישות לבנדים.
Higher TF – טיימפריים לאישור (אופציונלי).
Live Label – ספרות, היסט ברים, צבעי רקע.
טיפים מהירים
בסקלפים/טווחים קצרים: הקשיחו ספי קיצון (למשל 85/15) להפחתת רעש.
בשוק תנודתי: העלו את adaptLen או הורידו את k כדי לקבל בנדים רגישים פחות.
להקטנת אותות שווא: דרשו התאמה בין הסיגנל המקומי ל-MTF (לדוגמה, לונג רק כשה-MTF מעל 50).
הערה חשובה
זהו כלי ניתוח טכני—לא אות קנייה/מכירה בפני עצמו. שלבו אותו עם ניהול סיכונים (SL/TP), בדיקת רמות מפתח ואימות ממספר אינדיקטורים או טיימפריימים.

CCI SupertrendCCI Supertrend
+ This simple scripts base on CCI level to plot "Supertrend".
+ When CCI move above level 0, SuperTrend lowerBand is plotted.
+ When CCI move below level 0, SuperTrend upperBand is plotted.

CCI and ADX_by RMCCI and ADX
ENTRY:
Buy: When CCI crosses -100 level from -200 level(1hr/15min Time Frame)
Short: When CCI crosses 100 level from 200 level (1hr/15min Time Frame)
Closing of Position : 1:1 OR 1:2 (Or As per Value Zone)

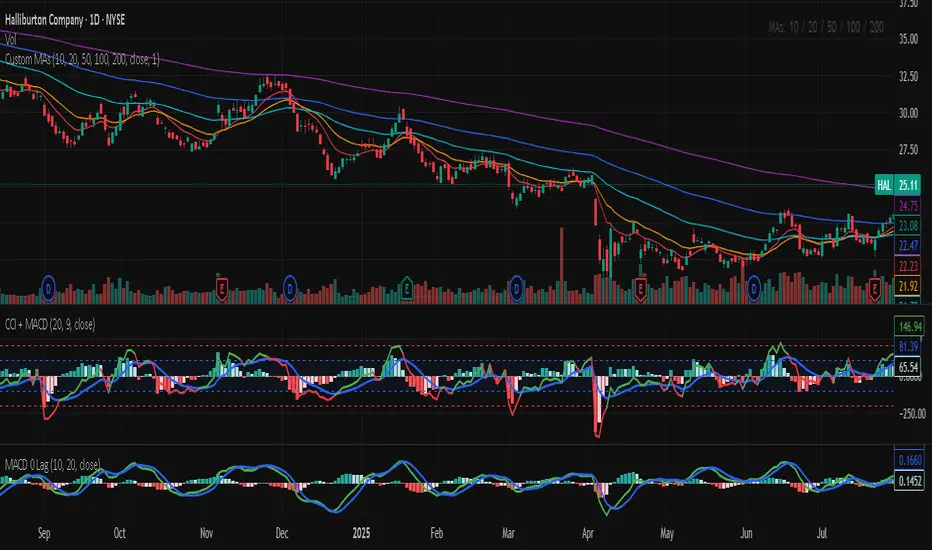
CCI MACDCCI and MACD in one indicator. CCI implementation with MACD like histogram. The result is the same as MACD with zero log.

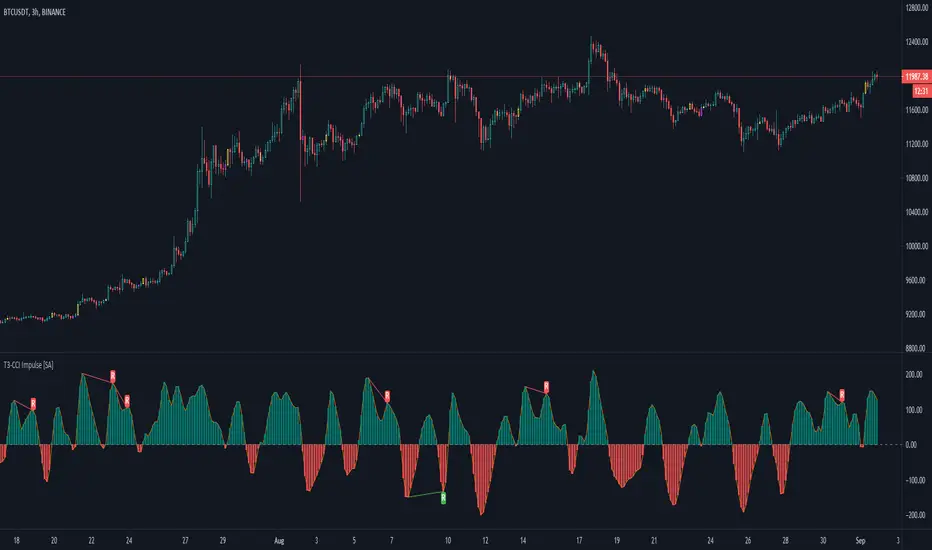
T3-CCI Impulse [SystemAlpha]FX Sniper's T3-CCI indicator modified with bar color and regular divergence.
Also added option to change bar color based on Elder's Impulse System.

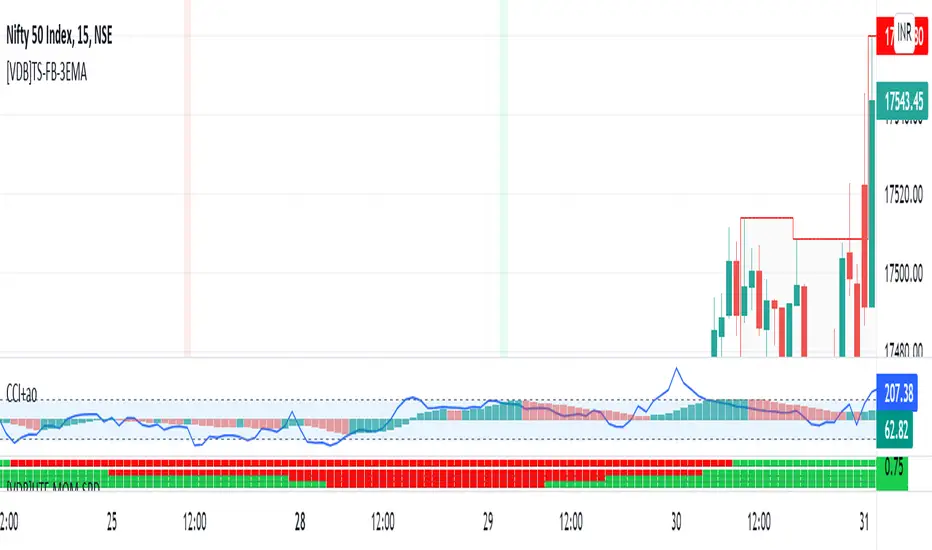
CCI+AO TRCCI indicates over sold and over bought
ao indicates trend
combination of ths two we get good result
CCI 20-200CCI // Period 20. Overbought oversold level 200,-200. Visual confirmation of the intersection of overbought and oversold levels.


CCI / Connectable [Azullian]Sharpen your analysis of market trends with the CCI indicator. Effectively evaluate market cycles and identify potential reversals, enriching your strategic planning.
This connectable CCI indicator is part of an indicator system designed to help test, visualize and build strategy configurations without coding. Like all connectable indicators , it interacts through the TradingView input source, which serves as a signal connector to link indicators to each other. All connectable indicators send signal weight to the next node in the system until it reaches either a connectable signal monitor, signal filter and/or strategy.
█ UNIFORM SETTINGS AND A WAY OF WORK
Although connectable indicators may have specific weight scoring conditions, they all aim to follow a standardized general approach to weight scoring settings, as outlined below.
■ Connectable indicators - Settings
• 🗲 Energy: Energy applies an ATR multiplier to the plotted shapes on the chart. A higher value plots shapes farther away from the candle, enhancing visibility.
• ☼ Brightness: Brightness determines the opacity of the shape plotted on the chart, aiding visibility. Indicator weight also influences opacity.
• → Input: Use the input setting to specify a data source for the indicator. Here you can connect the indicator to other indicators.
• ⌥ Flow: Determine where you want to receive signals from:
○ Both: Weights from this indicator and the connected indicator will apply
○ Indicator only: Only weights from this indicator will apply
○ Input only: Only weights from the connected indicator will apply
• ⥅ Weight multiplier: Multiply all weights in the entire indicator by a given factor, useful for quickly testing different indicators in a granular setup.
• ⥇ Threshold: Set a threshold to indicate the minimum amount of weight it should receive to pass it through to the next indicator.
• ⥱ Limiter: Set a hard limit to the maximum amount of weight that can be fed through the indicator.
■ Connectable indicators - Weight scoring settings
▢ Weight scoring conditions
• SM – Signal mode: Enable specific conditions for weight scoring
○ All: All signals will be scored.
○ Entries only: Only entries will score.
○ Exits only: Only exits will score.
○ Entries & exits: Both entries and exits will score.
○ Zone: Continuous scoring for each candle within the zone.
• SP – Signal period: Defines a range of candles within which a signal can score.
• SC - Signal count: Specifies the number of bars to retrospectively examine and score.
○ Single: Score for a single occurrence
○ All occurrences: Score for all occurrences
○ Single + Threshold: Score for single occurrences within the signal period (SP)
○ Every + Threshold: Score for all occurrences within the signal period (SP)
▢ Weight scoring direction
• ES: Enter Short weight
• XL: Exit long weight
• EL: Enter Long weight
• XS: Exit Short weight
▢ Weight scoring values
• Weights can hold either positive or negative scores. Positive weights enhance a particular trading direction, while negative weights diminish it.
█ CCI - INDICATOR SETTINGS
■ Main settings
• Enable/Disable Indicator: Toggle the entire indicator on or off.
• S - Source: Choose an alternative data source for the CCI calculation.
• T - Timeframe: Select an alternative timeframe for the CCI calculation.
• LE - Length: Define the number of bars or periods used in the CCI calculation.
• OB - Overbought Level: Determine the CCI value at which overbought conditions are met.
• OS - Oversold Level: Specify the CCI value at which oversold conditions are met.
■ Scoring functionality
• The CCI scores long entries when the CCI enters OS: oversold area
• The CCI scores long exits when the CCI exits OS: oversold area
• The CCI scores long zones the entire time the CCI is in OS: oversold area
• The CCI scores short entries when the CCI enters OB: overbought area
• The CCI scores short exits when the CCI exits OB: overbought area
• The CCI scores short zones the entire time the CCI is in OB: overbought area
█ PLOTTING
• Standard: Symbols (EL, XS, ES, XL) appear relative to candles based on set conditions. Their opacity and position vary with weight.
• Conditional Settings: A larger icon appears if global conditions are met. For instance, with a Threshold(⥇) of 12, Signal Period (SP) of 3, and Scoring Condition (SC) set to "EVERY", an CCI signaling over two times in 3 candles (scoring 6 each) triggers a larger icon.
█ USAGE OF CONNECTABLE INDICATORS
■ Connectable chaining mechanism
Connectable indicators can be connected directly to the signal monitor, signal filter or strategy , or they can be daisy chained to each other while the last indicator in the chain connects to the signal monitor, signal filter or strategy. When using a signal filter you can chain the filter to the strategy input to make your chain complete.
• Direct chaining: Connect an indicator directly to the signal monitor, signal filter or strategy through the provided inputs (→).
• Daisy chaining: Connect indicators using the indicator input (→). The first in a daisy chain should have a flow (⌥) set to 'Indicator only'. Subsequent indicators use 'Both' to pass the previous weight. The final indicator connects to the signal monitor, signal filter, or strategy.
■ Set up this indicator with a signal filter and strategy
The indicator provides visual cues based on signal conditions. However, its weight system is best utilized when paired with a connectable signal filter, monitor, or strategy .
Let's connect the CCI to a connectable signal filter and a strategy :
1. Load all relevant indicators
• Load CCI / Connectable
• Load Signal filter / Connectable
• Load Strategy / Connectable
2. Signal Filter: Connect the CCI to the Signal Filter
• Open the signal filter settings
• Choose one of the three input dropdowns (1→, 2→, 3→) and choose : CCI / Connectable: Signal Connector
• Toggle the enable box before the connected input to enable the incoming signal
3. Signal Filter: Update the filter signals settings if needed
• The default settings of the filter enable EL (Enter Long), XL (Exit Long), ES (Enter Short) and XS (Exit Short).
4. Signal Filter: Update the weight threshold settings if needed
• All connectable indicators load by default with a score of 6 for each direction (EL, XL, ES, XS)
• By default, weight threshold (TH) is set at 5. This allows each occurrence to score, as the default score in each connectable indicator is 1 point above the threshold. Adjust to your liking.
5. Strategy: Connect the strategy to the signal filter in the strategy settings
• Select a strategy input → and select the Signal filter: Signal connector
6. Strategy: Enable filter compatible directions
• Set the signal mode of the strategy to a compatible direction with the signal filter.
Now that everything is connected, you'll notice green spikes in the signal filter representing long signals, and red spikes indicating short signals. Trades will also appear on the chart, complemented by a performance overview. Your journey is just beginning: delve into different scoring mechanisms, merge diverse connectable indicators, and craft unique chains. Instantly test your results and discover the potential of your configurations. Dive deep and enjoy the process!
█ BENEFITS
• Adaptable Modular Design: Arrange indicators in diverse structures via direct or daisy chaining, allowing tailored configurations to align with your analysis approach.
• Streamlined Backtesting: Simplify the iterative process of testing and adjusting combinations, facilitating a smoother exploration of potential setups.
• Intuitive Interface: Navigate TradingView with added ease. Integrate desired indicators, adjust settings, and establish alerts without delving into complex code.
• Signal Weight Precision: Leverage granular weight allocation among signals, offering a deeper layer of customization in strategy formulation.
• Advanced Signal Filtering: Define entry and exit conditions with more clarity, granting an added layer of strategy precision.
• Clear Visual Feedback: Distinct visual signals and cues enhance the readability of charts, promoting informed decision-making.
• Standardized Defaults: Indicators are equipped with universally recognized preset settings, ensuring consistency in initial setups across different types like momentum or volatility.
• Reliability: Our indicators are meticulously developed to prevent repainting. We strictly adhere to TradingView's coding conventions, ensuring our code is both performant and clean.
█ COMPATIBLE INDICATORS
Each indicator that incorporates our open-source 'azLibConnector' library and adheres to our conventions can be effortlessly integrated and used as detailed above.
For clarity and recognition within the TradingView platform, we append the suffix ' / Connectable' to every compatible indicator.
█ COMMON MISTAKES, CLARIFICATIONS AND TIPS
• Removing an indicator from a chain: Deleting a linked indicator and confirming the "remove study tree" alert will also remove all underlying indicators in the object tree. Before removing one, disconnect the adjacent indicators and move it to the object stack's bottom.
• Point systems: The azLibConnector provides 500 points for each direction (EL: Enter long, XL: Exit long, ES: Enter short, XS: Exit short) Remember this cap when devising a point structure.
• Flow misconfiguration: In daisy chains the first indicator should always have a flow (⌥) setting of 'indicator only' while other indicator should have a flow (⌥) setting of 'both'.
• Hide attributes: As connectable indicators send through quite some information you'll notice all the arguments are taking up some screenwidth and cause some visual clutter. You can disable arguments in Chart Settings / Status line.
• Layout and abbreviations: To maintain a consistent structure, we use abbreviations for each input. While this may initially seem complex, you'll quickly become familiar with them. Each abbreviation is also explained in the inline tooltips.
• Inputs: Connecting a connectable indicator directly to the strategy delivers the raw signal without a weight threshold, meaning every signal will trigger a trade.
█ A NOTE OF GRATITUDE
Through years of exploring TradingView and Pine Script, we've drawn immense inspiration from the community's knowledge and innovation. Thank you for being a constant source of motivation and insight.
█ RISK DISCLAIMER
Azullian's content, tools, scripts, articles, and educational offerings are presented purely for educational and informational uses. Please be aware that past performance should not be considered a predictor of future results.

CCI+EMA Strategy with Percentage or ATR TP/SL [Alifer]This is a momentum strategy based on the Commodity Channel Index (CCI), with the aim of entering long trades in oversold conditions and short trades in overbought conditions.
Optionally, you can enable an Exponential Moving Average (EMA) to only allow trading in the direction of the larger trend. Please note that the strategy will not plot the EMA. If you want, for visual confirmation, you can add to the chart an Exponential Moving Average as a second indicator, with the same settings used in the strategy’s built-in EMA.
The strategy also allows you to set internal Stop Loss and Take Profit levels, with the option to choose between Percentage-based TP/SL or ATR-based TP/SL.
The strategy can be adapted to multiple assets and timeframes:
Pick an asset and a timeframe
Zoom back as far as possible to identify meaningful positive and negative peaks of the CCI
Set Overbought and Oversold at a rough average of the peaks you identified
Adjust TP/SL according to your risk management strategy
Like the strategy? Give it a boost!
Have any questions? Leave a comment or drop me a message.
CAUTIONARY WARNING
Please note that this is a complex trading strategy that involves several inputs and conditions. Before using it in live trading, it is highly recommended to thoroughly test it on historical data and use risk management techniques to safeguard your capital. After backtesting, it's also highly recommended to perform a first live test with a small amount. Additionally, it's essential to have a good understanding of the strategy's behavior and potential risks. Only risk what you can afford to lose .
USED INDICATORS
1 — COMMODITY CHANNEL INDEX (CCI)
The Commodity Channel Index (CCI) is a technical analysis indicator used to measure the momentum of an asset. It was developed by Donald Lambert and first published in Commodities magazine (now Futures) in 1980. Despite its name, the CCI can be used in any market and is not just for commodities. The CCI compares current price to average price over a specific time period. The indicator fluctuates above or below zero, moving into positive or negative territory. While most values, approximately 75%, fall between -100 and +100, about 25% of the values fall outside this range, indicating a lot of weakness or strength in the price movement.
The CCI was originally developed to spot long-term trend changes but has been adapted by traders for use on all markets or timeframes. Trading with multiple timeframes provides more buy or sell signals for active traders. Traders often use the CCI on the longer-term chart to establish the dominant trend and on the shorter-term chart to isolate pullbacks and generate trade signals.
CCI is calculated with the following formula:
(Typical Price - Simple Moving Average) / (0.015 x Mean Deviation)
Some trading strategies based on CCI can produce multiple false signals or losing trades when conditions turn choppy. Implementing a stop-loss strategy can help cap risk, and testing the CCI strategy for profitability on your market and timeframe is a worthy first step before initiating trades.
2 — AVERAGE TRUE RANGE (ATR)
The Average True Range (ATR) is a technical analysis indicator that measures market volatility by calculating the average range of price movements in a financial asset over a specific period of time. The ATR was developed by J. Welles Wilder Jr. and introduced in his book “New Concepts in Technical Trading Systems” in 1978.
The ATR is calculated by taking the average of the true range over a specified period. The true range is the greatest of the following:
The difference between the current high and the current low.
The difference between the previous close and the current high.
The difference between the previous close and the current low.
The ATR can be used to set stop-loss orders. One way to use ATR for stop-loss orders is to multiply the ATR by a factor (such as 2 or 3) and subtract it from the entry price for long positions or add it to the entry price for short positions. This can help traders set stop-loss orders that are more adaptive to market volatility.
3 — EXPONENTIAL MOVING AVERAGE (EMA)
The Exponential Moving Average (EMA) is a type of moving average (MA) that places a greater weight and significance on the most recent data points.
The EMA is calculated by taking the average of the true range over a specified period. The true range is the greatest of the following:
The difference between the current high and the current low.
The difference between the previous close and the current high.
The difference between the previous close and the current low.
The EMA can be used by traders to produce buy and sell signals based on crossovers and divergences from the historical average. Traders often use several different EMA lengths, such as 10-day, 50-day, and 200-day moving averages.
The formula for calculating EMA is as follows:
Compute the Simple Moving Average (SMA).
Calculate the multiplier for weighting the EMA.
Calculate the current EMA using the following formula:
EMA = Closing price x multiplier + EMA (previous day) x (1-multiplier)
STRATEGY EXPLANATION
1 — INPUTS AND PARAMETERS
The strategy uses the Commodity Channel Index (CCI) with additional options for an Exponential Moving Average (EMA), Take Profit (TP) and Stop Loss (SL).
length : The period length for the CCI calculation.
overbought : The overbought level for the CCI. When CCI crosses above this level, it may signal a potential short entry.
oversold : The oversold level for the CCI. When CCI crosses below this level, it may signal a potential long entry.
useEMA : A boolean input to enable or disable the use of Exponential Moving Average (EMA) as a filter for long and short entries.
emaLength : The period length for the EMA if it is used.
2 — CCI CALCULATION
The CCI indicator is calculated using the following formula:
(src - ma) / (0.015 * ta.dev(src, length))
src is the typical price (average of high, low, and close) and ma is the Simple Moving Average (SMA) of src over the specified length.
3 — EMA CALCULATION
If the useEMA option is enabled, an EMA is calculated with the given emaLength .
4 — TAKE PROFIT AND STOP LOSS METHODS
The strategy offers two methods for TP and SL calculations: percentage-based and ATR-based.
tpSlMethod_percentage : A boolean input to choose the percentage-based method.
tpSlMethod_atr : A boolean input to choose the ATR-based method.
5 — PERCENTAGE-BASED TP AND SL
If tpSlMethod_percentage is chosen, the strategy calculates the TP and SL levels based on a percentage of the average entry price.
tp_percentage : The percentage value for Take Profit.
sl_percentage : The percentage value for Stop Loss.
6 — ATR-BASED TP AND SL
If tpSlMethod_atr is chosen, the strategy calculates the TP and SL levels based on Average True Range (ATR).
atrLength : The period length for the ATR calculation.
atrMultiplier : A multiplier applied to the ATR to set the SL level.
riskRewardRatio : The risk-reward ratio used to calculate the TP level.
7 — ENTRY CONDITIONS
The strategy defines two conditions for entering long and short positions based on CCI and, optionally, EMA.
Long Entry: CCI crosses below the oversold level, and if useEMA is enabled, the closing price should be above the EMA.
Short Entry: CCI crosses above the overbought level, and if useEMA is enabled, the closing price should be below the EMA.
8 — TP AND SL LEVELS
The strategy calculates the TP and SL levels based on the chosen method and updates them dynamically.
For the percentage-based method, the TP and SL levels are calculated as a percentage of the average entry price.
For the ATR-based method, the TP and SL levels are calculated using the ATR value and the specified multipliers.
9 — EXIT CONDITIONS
The strategy defines exit conditions for both long and short positions.
If there is a long position, it will be closed either at TP or SL levels based on the chosen method.
If there is a short position, it will be closed either at TP or SL levels based on the chosen method.
Additionally, positions will be closed if CCI crosses back above oversold in long positions or below overbought in short positions.
10 — PLOTTING
The script plots the CCI line along with overbought and oversold levels as horizontal lines.
The CCI line is colored red when above the overbought level, green when below the oversold level, and white otherwise.
The shaded region between the overbought and oversold levels is plotted as well.

CCI Divergence Detector
A technical analysis tool that identifies divergences between price action and the Commodity Channel Index (CCI) oscillator. Unlike standard divergence indicators, this system employs advanced gradient visualization, multi-layer wave effects, and comprehensive customization options to provide traders with crystal-clear divergence signals and market momentum insights.
Core Detection Mechanism
CCI-Based Analysis: The indicator utilizes the Commodity Channel Index as its primary oscillator, calculated from user-configurable source data (default: HLC3) with adjustable length parameters. The CCI provides reliable momentum readings that effectively highlight price-momentum divergences.
Dynamic Pivot Detection: The system employs adaptive pivot detection with three sensitivity levels (High/Normal/Low) to identify significant highs and lows in both price and CCI values. This dynamic approach ensures optimal divergence detection across different market conditions and timeframes.
Dual Divergence Analysis:
Regular Bullish Divergences: Detected when price makes lower lows while CCI makes higher lows, indicating potential upward reversal
Regular Bearish Divergences: Identified when price makes higher highs while CCI makes lower highs, signaling potential downward reversal
Strength Classification System: Each detected divergence is automatically classified into three strength categories (Weak/Moderate/Strong) based on:
-Price differential magnitude
-CCI differential magnitude
-Time duration between pivot points
-User-configurable strength multiplier
Advanced Visual System
Multi-Layer Wave Effects: The indicator features a revolutionary wave visualization system that creates depth through multiple gradient layers around the CCI line. The wave width dynamically adjusts based on ATR volatility, providing intuitive visual feedback about market conditions.
Professional Color Gradient System: Nine independent color inputs control every visual aspect:
Bullish Colors (Light/Medium/Dark): Control oversold areas, wave effects, and strong bullish signals
Bearish Colors (Light/Medium/Dark): Manage overbought zones, wave fills, and strong bearish signals
Neutral Colors (Light/Medium/Dark): Handle table elements, zero line, and transitional states
Intelligent Color Mapping: Colors automatically adapt based on CCI values:
Overbought territory (>100): Bearish color gradients with increasing intensity
Neutral positive (0 to 100): Blend from neutral to bearish tones
Oversold territory (<-100): Bullish color gradients with increasing intensity
Neutral negative (-100 to 0): Transition from neutral to bullish tones
Key Features & Components
Advanced Configuration System: Eight organized input groups provide granular control:
General Settings: System enable, pivot length, confidence thresholds
Oscillator Selection: CCI parameters, overbought/oversold levels, normalization options
Detection Parameters: Divergence types, minimum strength requirements
Sensitivity Tuning: Pivot sensitivity, divergence threshold, confirmation bars
Visual System: Line thickness, labels, backgrounds, table display
Wave Effects: Dynamic width, volatility response, layer count, glow effects
Transparency Controls: Independent transparency for all visual elements
Smoothing & Filtering: CCI smoothing types, noise filtering, wave smoothing
Professional Alert System: Comprehensive alert functionality with dynamic messages including:
-Divergence type and strength classification
-Current CCI value and confidence percentage
-Customizable alert frequency and conditions
Enhanced Information Table: Real-time display showing:
-Current CCI length and value
-Market status (Overbought/Normal/Oversold)
-Active sensitivity setting
Configurable table positioning (4 corner options)
Visual Elements Explained
Primary CCI Line: Main oscillator plot with gradient coloring that reflects market momentum and CCI intensity. Line thickness is user-configurable (1-8 pixels).
Wave Effect Layers: Multi-layer gradient fills creating a dynamic wave around the
CCI line:
-Outer layers provide broad market context
-Inner layers highlight immediate momentum
-Core layers show precise CCI movement
-All layers respond to volatility and momentum changes
Divergence Lines & Labels:
-Solid lines connecting divergence pivot points
-Color-coded based on divergence type and strength
-Labels displaying divergence type and strength classification
-Customizable transparency and size options
Reference Lines:
-Zero line with neutral color coding
-Overbought level (default: 100) with bearish coloring
-Oversold level (default: -100) with bullish coloring
Background Gradient: Optional background coloring that reflects CCI intensity and market conditions with user-controlled transparency (80-99%).
Configuration Options
Sensitivity Controls:
Pivot sensitivity: High/Normal/Low detection levels
Divergence threshold: 0.1-2.0 sensitivity range
Confirmation bars: 1-5 bar confirmation requirement
Strength multiplier: 0.1-3.0 calculation adjustment
Visual Customization:
Line transparency: 0-90% for main elements
Wave transparency: 0-95% for fill effects
Background transparency: 80-99% for subtle background
Label transparency: 0-50% for text elements
Glow transparency: 50-95% for glow effects
Advanced Processing:
Five smoothing types: None/SMA/EMA/RMA/WMA
Noise filtering with adjustable threshold (0.1-10.0)
CCI normalization for enhanced gradient scaling
Dynamic wave width with ATR-based volatility response
Interpretation Guidelines
Divergence Signals:
Strong divergences: High-confidence reversal signals requiring immediate attention
Moderate divergences: Reliable signals suitable for most trading strategies
Weak divergences: Early warning signals best combined with additional confirmation
Wave Intensity: Wave width and color intensity provide real-time volatility and momentum feedback. Wider, more intense waves indicate higher market volatility and stronger momentum.
Color Transitions: Smooth color transitions between bullish, neutral, and bearish states help identify market regime changes and momentum shifts.
CCI Levels: Traditional overbought (>100) and oversold (<-100) levels remain relevant, but the gradient system provides more nuanced momentum reading between these extremes.
Technical Specifications
Compatible Timeframes: All timeframes supported
Maximum Labels: 500 (for divergence marking)
Maximum Lines: 500 (for divergence drawing)
Pine Script Version: v5 (latest optimization)
Overlay Mode: False (separate pane indicator)
Usage Recommendations
This indicator works best when:
-Combined with price action analysis and support/resistance levels
-Used across multiple timeframes for confirmation
-Integrated with proper risk management protocols
-Applied in trending markets for divergence-based reversal signals
-Utilized with other technical indicators for comprehensive analysis
Risk Disclaimer: Trading involves substantial risk of loss. This indicator is provided for analytical purposes only and does not constitute financial advice. Divergence signals, while powerful, are not guaranteed to predict future price movements. Past performance is not indicative of future results. Always use proper risk management and never trade with capital you cannot afford to lose.

CCI based support and resistance strategy
WARNING:
Commissions and slippage has not been considered! Don’t take it easy adding commissions and slippage could turns a fake-profitable strategy to a real disaster.
We consider account size as 10k and we enter 1000 for each trade.
Less than 100 trades is too small sample community and it’s not reliable, Also the performance of the past do not guarantee future performance. This result was handpicked by author and will differ by other timeframes, instruments and settings.
*PLEASE SHARE YOUR SETTINGS THAT WORK WITH THE COMMUNITY.
Introduction:
The CCI-based dynamic support and resistance is a "Bands and Channels" kind of indicator consisting an upper and lower band. This is a strategy which uses CCI-based (Made by me) indicator to execute trades.
SL and TP are calculated based on max ATR during last selected time period. You can edit strategy settings using "Ksl", "Ktp" and the other button for time period. “KSL” and “KTP” are 2.5 and 5 by default.
Bands are calculated regarding CCI previous high and low pivot. CCI length, right pivot length and left pivot length are 50.
A dynamic support and resistance has been calculated using last upper-cci minus a buffer and last lower-cci plus the buffer. The buffer is 10.
If "Trend matter?" button is on you can detect trend by color of the upper and lower line. Green is bullish and red is bearish! "Trend matter?" is on.
The "show mid?" button makes mid line visible, which is average of upper and lower lines, visible. The button is not active by default.
Reaction to the support could be a buy signal while a reaction to the resistance could interpreted as a sell signal.
How this strategy work?
Donald Lambert, a technical analyst, created the CCI, or Commodity Channel Index, which he first published in 1980. CCI is calculated regarding CCI can be used both as trend-detector or an oscillator. As an oscillator most traders believe in static predefined levels. Overbought and oversold candles which are clear in the chart could be used as sell and buy signals.
During my trading career I’ve noticed that there might be some reversal points for the CCI. I believe CCI could have to potential to reverse more from lately reversal point. Of course, just like other trading strategies we are talking about probabilities. We do not expect a win trade each time.
On price chart
Now this the question! What price should the instrument reach that CCI turns to be equal to our reversing aim for CCI? Imagine we have found last important bearish reversal of CCI in 200. Now, if we need the CCI to be 200 what price should we wait for?
How to calculate?
This is the CCI formula:
CCI = (Typical Price - SMA of TP) / (0.015 x Mean Deviation)
Where, Typical Price (TP) = (High + Low + Close)/3
For probable reversing points, high and low pivots of 50 bars have been used.
So we do have an Upper CCI and a Lower CCI. They are valid until the next pivot is available.
By relocating factors in CCI formula you can reach the “Typical Price”.
“
Typical Price = CCI (0.015 * Mean Deviation) + SMA of TP
So we could have a Support or Resistance by replacing CCI with Upper and Lower CCI.
A buy signal is valid if the trend is bullish (or “trend matter” is off) and lowest low of last 2 candles is lower than support and close is greater than both support and open.
A Sell signal is produced in opposite situation.
There are 2+1 options for trend!
Trend matter box is on by default, which means we’ll just open trades in direction of the trend. It’s available to turn it off.
Other 2 options are cross and slope. Cross calculated by comparing fast SMA and slow SMA. The slope one differentiate slow SMA to last “n” one.
Considering last day and today highest ATR as the ATR to calculating SL and TP is our unique technique.
