Wick to Candle Ratio with Multiple ColorsThe display in question likely provides visual representations or data related to the concept of the dot-based wick-to-body ratio. This ratio is a term often used in financial markets, particularly in the context of candlestick charts.
In candlestick charts, each candlestick represents a specific time period (such as a minute, hour, day, etc.) and provides four pieces of price data: the opening price, closing price, highest price, and lowest price of an asset within that timeframe. The "body" of the candlestick is the area between the opening and closing prices, while the "wicks" (or shadows) are the lines extending from the body, representing the highest and lowest prices during the period.
The dot-based wick-to-body ratio refers to a method of quantifying the relative lengths of the wicks compared to the body using dots or points. In this context, a display illustrating this ratio might show different candlesticks with highlighted dots representing the ratio between the length of the wick and the body. A higher ratio could indicate more volatility in price movements during that timeframe, while a lower ratio might suggest comparatively stable price action.
Search in scripts for "Candlestick"

CRT TBSThe CRT Candle Marker is a custom indicator designed to identify and highlight specific candlestick patterns on a chart. This indicator focuses on detecting candles where the body of the candlestick is larger than the combined size of its wicks (upper and lower). Such candles often indicate strong momentum in the market, making them valuable for traders who rely on price action analysis.
Features
Automatic Detection: The indicator automatically scans all candlesticks on the chart to identify CRT candles.
Visual Marking: Once a CRT candle is detected, it places a label with the text "CRT" above the candlestick for easy identification.
Customizable Design: The label is styled with a blue background and white text, ensuring it stands out clearly on the chart.
Use Case
The CRT Candle Marker is particularly useful for traders who:
Want to identify strong momentum candles that could signal potential trend continuation or reversal points.
Rely on price action strategies and need visual cues to spot significant patterns quickly.
Analyze candlestick behavior to confirm entry or exit points in their trading strategies.
How to Use
Copy the Pine Script code and paste it into the Pine Editor in TradingView.
Click Add to Chart to apply the indicator.
Look for candles marked with the "CRT" label to identify strong momentum candles.
Example Scenario
Imagine you're analyzing a chart and looking for strong bullish momentum. With the CRT Candle Marker, you can easily spot candles where the buyers dominated the session, as indicated by a large body relative to the wicks. Similarly, bearish CRT candles could indicate strong selling pressure.
Conclusion
The CRT Candle Marker is a simple yet powerful tool for traders who want to enhance their candlestick analysis. By highlighting significant momentum candles, this indicator helps traders make more informed decisions and improve their overall trading performance.
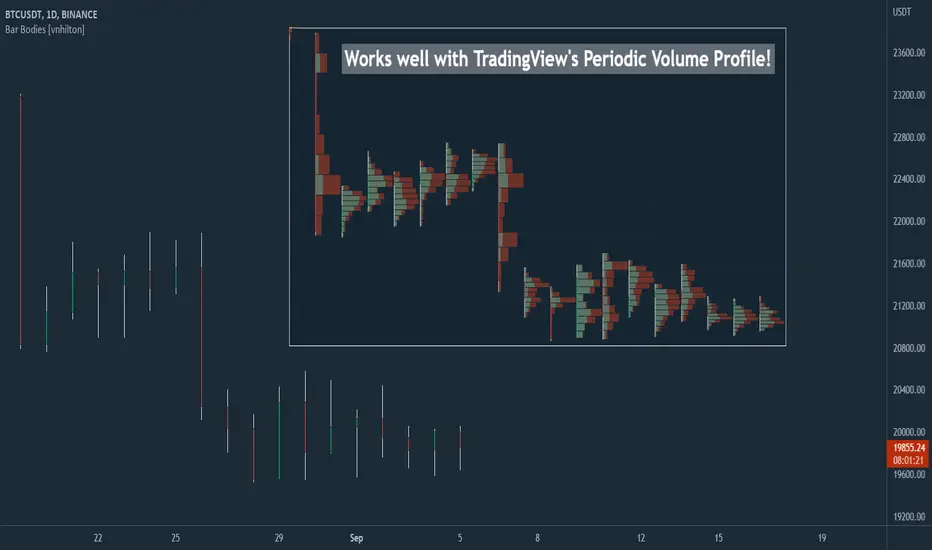
Bar Bodies [vnhilton]Note: Go to "Chart Settings" & hide "Body" & "Borders". Also uncheck "Labels on price scale" & "Values in status line" as they're not needed.
This script plots candlestick bodies with the same thickness as the wicks (similar to the bar chart, but without the horizontal lines to represent the open & close). To do this, it plots an invisible candlestick body with an invisible candlestick border from the high to the close/open for a green/red candle respectively, & uses the low wick as the candlestick body itself by plotting it from the low price to the open/close for a green/red candle respectively.
My personal use for this script is to use it in conjunction with TradingView's Periodic Volume Profile, in order to still see OHLC data without obstructing the candlesticks' volume profiles, as seen in the chart snapshot image above.
Funding Rate On-Hover TooltipFunding Rate On-Hover Tooltip
💡 What it is:
This Pine Script indicator provides a **non-intrusive and dynamic display of the current Funding Rate** for the selected perpetual futures contract. Instead of plotting the rate as a separate line or panel, the value is cleverly integrated into the indicator's name tag (tooltip) when you **hover your mouse over any candlestick** on the chart.
✨ How it's Original and Useful:
Most traders rely on external sources or a separate sub-panel for the Funding Rate, which can clutter the chart or interrupt the flow of analysis. This script offers a superior, **clean-chart solution** by making the rate instantly accessible only when needed. It allows traders to:
* **Quickly gauge market sentiment** (positive rate = long bias, negative rate = short bias) without distraction.
* Keep their main chart focused purely on price action.
* Monitor this crucial derivative metric directly within the TradingView interface.
⚙️ How it Works:
The script uses the built-in Pine functions to fetch the latest available Funding Rate data for the current symbol and resolution. The fetched value is then formatted and displayed dynamically using the **Funding Rate On-Hover Tooltip** function's name/label feature, which updates in real-time as you interact with the chart.
📖 How to Use It:
1. Add the **"Funding Rate On-Hover Tooltip"** indicator to your chart.
2. Move your mouse pointer over any candlestick.
3. The Funding Rate value (e.g., +0.0100% or -0.0250%) will appear next to the indicator's name on the chart's price axis or main window.
4. Use this quick data point as a factor in your entry and exit strategies.

Tradr Engulf
Introduction
"Candlesticks" patterns are used to predict price movements. This is engulfing candlestick pattern that is common and very useful in "technical analysis" in this script to identify itautomatically. The most important advantage of this indicator for users is saving time and high precision in identifying patterns. By using these pattern, you can predict price movements more accurately and therefore make better decisions in your trades.
Engulfing : The Engulfing candlestick pattern is a reversal pattern and consists of at least two candles, where one of them completely engulfs the body of the previous or following candle due to high volatility.
For this reason, the term "engulfing" is used for this pattern. This pattern occurs when the price body of a candle encompasses one or more candles before it. Engulfing candles can be bullish or bearish. Bullish Engulfing forms as a reversal candle at the end of a downtrend.
Bullish Engulfing indicates strong buying power and signals the beginning of an uptrend. This pattern is a bullish candle with a long upward body that completely covers the downward body before it. Bearish Engulfing, as a reversal pattern, is a long bearish candle that engulfs the upward candle before it.
Bearish Engulfing forms at the end of an uptrend and indicates the pressure of new sellers and their strong power. Additionally, forming this pattern at resistance levels and the absence of a lower shadow increases its credibility.

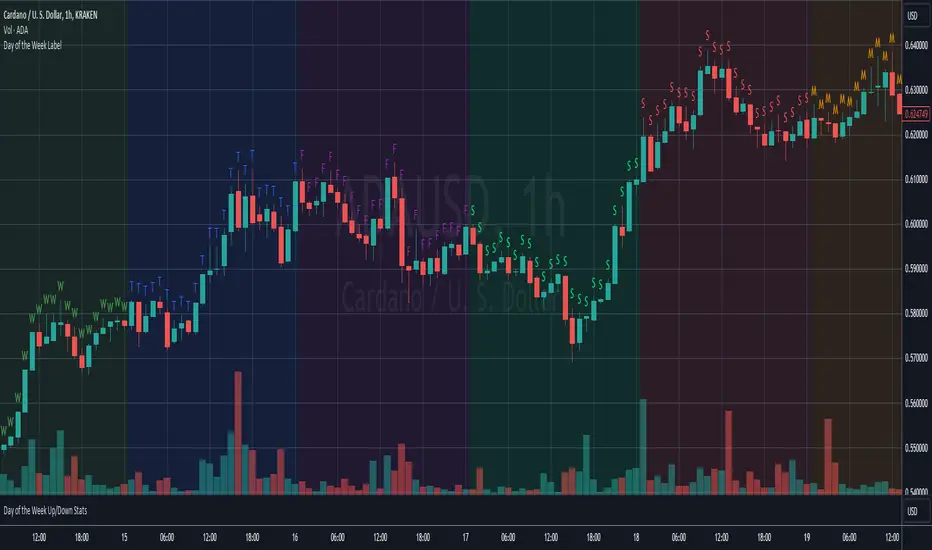
Day of the Week LabelOverview:
The "Day of the Week Label Indicator" is a simple yet powerful tool designed for traders and analysts who use TradingView for chart analysis. This indicator adds a clear visual cue to your charts by displaying the first letter of each day of the week directly above the corresponding candlestick. With this indicator, you can easily identify the day of the week at a glance without cluttering your chart.
Key Features:
Day Identification: Marks each candle with the first letter of the corresponding day of the week (e.g., "M" for Monday, "T" for Tuesday, and so on), providing immediate day recognition.
Color-Coded Labels: Each day is color-coded for better visibility and quick identification. Sundays and Saturdays are distinguished from the trading week, making it easier to spot the beginning and end of the trading week.
Overlay Design: As an overlay, this indicator seamlessly integrates with your existing chart setup, enhancing your analysis without interfering with other technical indicators or chart elements.
Benefits:
Enhanced Chart Analysis: Quickly discern patterns or trends that may be specific to certain days of the week, aiding in the refinement of trading strategies.
Time Management: Helps in planning trading activities or analysis by visually highlighting the days directly on the chart.
User-Friendly: Simple and non-intrusive, this indicator is designed to complement your chart without overwhelming it with information.
How to Use:
Simply add the "Day of the Week Label Indicator" to your chart, and the first letter of each day will automatically appear above the corresponding candlestick. No additional configuration is required, making it suitable for both novice and experienced traders.
Whether you're conducting a detailed market analysis, looking for day-specific patterns, or simply want a clearer visual representation of the time on your charts, this indicator is an essential addition to your TradingView toolkit.
Price Action Patterns DetectorIt's something like "Price Action Candlestick Pattern Detector." That is, it's an indicator that detects not only Pinbars and Engulfing but also all popular candlesticks in Price Action (Doji, Hammer, Shooting Star, Inside Bar, etc.)

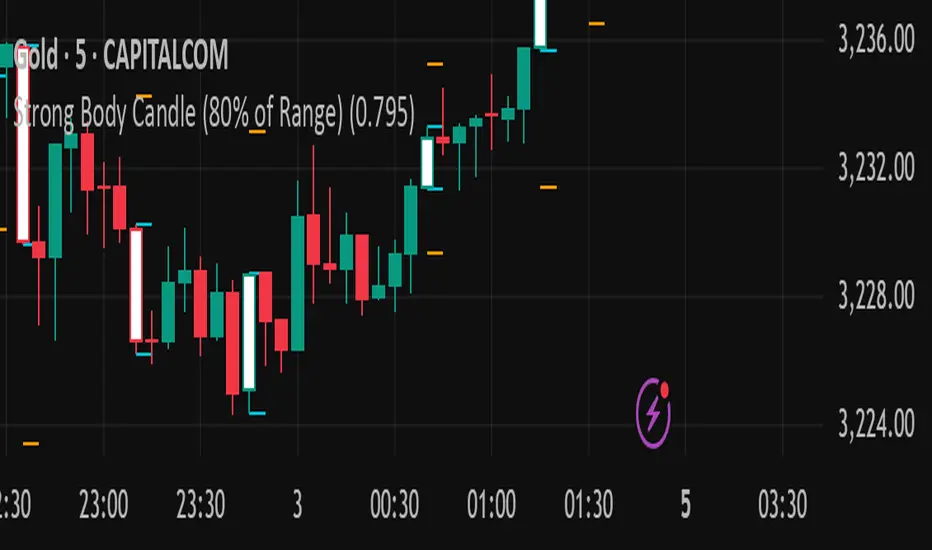
Strong Body Candle (80% of Range)You said:
Strong body candle 80% range
ChatGPT said:
A strong body candle with an 80% range typically refers to a candlestick on a price chart (usually used in technical analysis) where the real body of the candle (the open-to-close price movement) makes up 80% or more of the entire candle’s range (the high-to-low movement).
Breakdown:
Candle Range = High − Low
Body Size = |Close − Open|
Body-to-Range Ratio = (Body Size ÷ Candle Range) × 100
If this ratio is ≥ 80%, the candle is considered to have a strong body.
Interpretation:
A strong bullish candle: Close is near the high, open is near the low — strong buying pressure.
A strong bearish candle: Close is near the low, open is near the high — strong selling pressure.
These candles often signal momentum or trend continuation, especially when occurring after consolidation or at breakout points.
Would you like a script or formula to help detect these on a chart?
2/2
You said:
Yeh indicator banaya hai is ki description Bana ker rain publish kernrehanhun trading view per
ChatGPT said:
Great! Here's a professional and clear description you can use to publish your indicator on TradingView:
🔥 Strong Body Candle (80% Range) — Indicator Description
This indicator highlights candlesticks where the real body constitutes 80% or more of the entire candle's range (High − Low). These candles often represent strong momentum and are useful for identifying potential trend continuations, reversals, or breakout confirmations.
📌 Key Features:
✅ Detects both bullish and bearish strong body candles.
✅ Customizable threshold (default: 80%) for fine-tuning to your strategy.
✅ Visual markers make it easy to spot high-momentum candles on any timeframe.
📊 How It Works:
The script calculates the ratio of the candle's body size (|Close − Open|) to its total range (High − Low). If the ratio is equal to or above 80%, the candle is flagged:
Green Marker = Strong Bullish Candle (Close > Open)
Red Marker = Strong Bearish Candle (Open > Close)
🛠️ Use Cases:
Identify momentum shifts and breakout confirmations.
Use with support/resistance zones or trendlines for stronger signals.
Combine with volume indicators for enhanced precision.
fenxingFractal Sequence Trading System (Final Stable Version) identifies trends formed by two consecutive fractals based on three or five candlesticks.

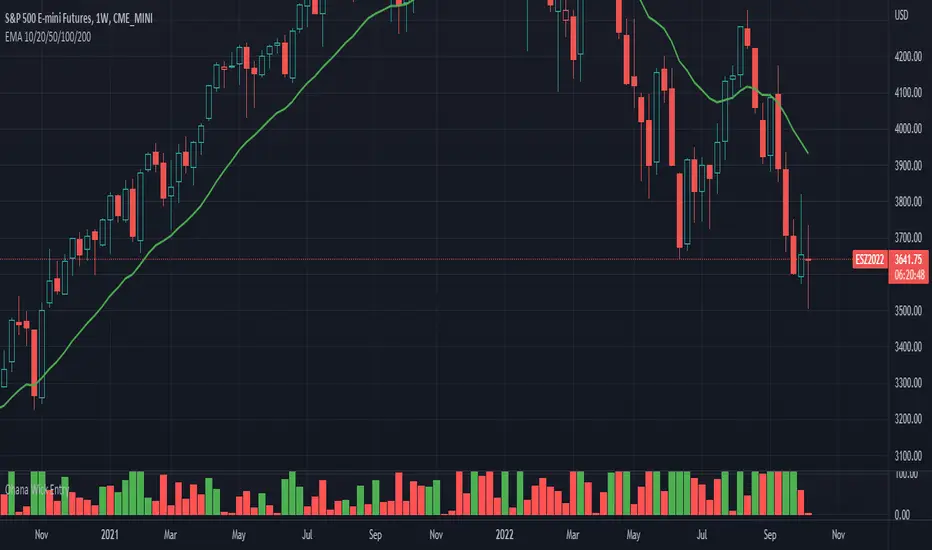
Ohana_Wick_EntryIndicator will change color depending if a wick comprises of less than 35% of the candlestick.
Strategy involves taking trades on stops above a green signal (<35% wick) to a target of the size of the candle body (expressed as the value in the indicator)
掘金社区趋势系统Of course. Here is the English translation of the provided trading system rules:
### Trading System Core Elements Explained
#### 1. Core Indicators and Definitions
* **Bull-Bear Line (Purple Line):** The primary basis for measuring the strength of long and short forces.
* *Example: If the 5-minute chart candlestick is below the Bull-Bear Line, the bears have the advantage. If the candlestick is above it, the bulls have the advantage.*
* **Trading Line (Yellow Line):** The operational line.
* **Opening/Closing Positions:** The Bull-Bear Line and Trading Line are the levels for both opening trades and taking profits.
* *Clarification: We only open or close positions when the price is at or very close to the Trading Line or Bull-Bear Line. If the price is not near these lines, it is not an opportunity for us to open or close a position. Note that the above rules for the Trading Line and Bull-Bear Line apply to all timeframes. Profit targets are scaled up through higher timeframes.*
#### 2. How to Identify a One-Sided Trend
* **Uptrend:** When the ribbon is **green** and positioned **above the Trading Line** and **above the Bull-Bear Line**, it indicates an uptrend on that timeframe.
* **Multi-Timeframe Confirmation (Resonance):** If **three timeframes simultaneously** show this state (green ribbon above both lines), it is a multi-timeframe resonance. The trading strategy then is to **buy on dips to support**, with entry positions being the Trading Line and Bull-Bear Line on the various timeframes.
* **General Rule:** When the price is **above the Bull-Bear Line**, place more trust in emerging **long signals** (e.g., green ribbon) to enter long positions.
* **Downtrend (Conversely):** When the candlestick is **below the Bull-Bear Line**, place more trust in emerging **short signals** (e.g., red ribbon) to enter short positions.
#### 3. Gauging Long/Short Strength
* The primary references for measuring the strength of bulls and bears are:
1. The positional relationship between the **Candlestick**, the **Bull-Bear Line**, and the **Trading Line**.
2. The **color of the ribbon**.
* **During Bearish Advantage:** Place more trust in emerging bearish signals for shorting. Be cautious with long operations.
* **During Bullish Trend:** Place more trust in emerging bullish signals. Focus on long positions and be cautious with shorting.
#### 4. Strong Trending Markets
* **Strong Bullish Market:** A pullback **does not break the lower ribbon**. In a strong, one-sided rally, the pullback **does not break the 5-15 minute Trading Line**.
* **Strong Bearish Market:** A rebound **does not surpass the upper ribbon**. In the strongest one-sided decline, the rebound **does not surpass the 5-15 minute Trading Line**.

始値を前日終値に合わせるローソク足A candlestick chart where each candlestick’s opening price is simply replaced with the previous candlestick’s closing price. Since there are no price gaps, a candlestick that appears to be bearish due to a gap down might actually be bullish, and a candlestick that appears bullish due to a gap up might actually be bearish.
単純に通常のローソク足の始値を前のローソク足の終値にしただけのローソク足。窓開けがなく、前回の終値から見れば窓開け陰線が実は陽線だったり、窓開け陽線が実は陰線だったりします。

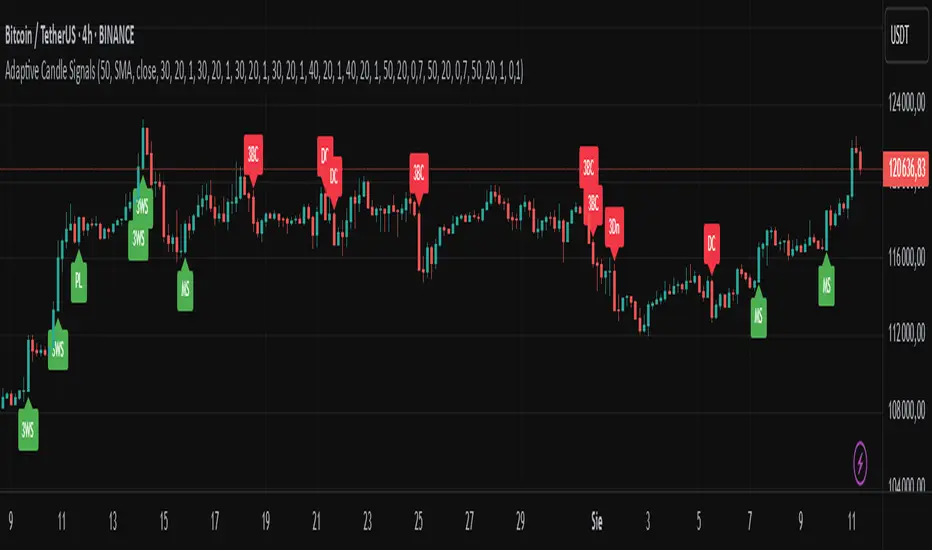
Adaptive Candle Signals█ OVERVIEW
The Adaptive Candle Signals indicator is a Pine Script® tool designed to identify key candlestick patterns on the chart, such as Bullish Engulfing, Bearish Engulfing, Piercing Line, Dark Cloud Cover, Morning Star, Evening Star, Three White Soldiers, Three Black Crows, and Three Inside Up/Down. The indicator allows customization of settings, including a Moving Average (MA) filter, candle size control, and maximum wick percentage, enabling precise adaptation to various trading strategies. Signals are displayed as labels on the chart, and each pattern can trigger alerts for user convenience.
█ CONCEPTS
The indicator is designed with flexibility and readability in mind. Its main features include:
Features
Signal Filtering: Enables the use of a Moving Average (MA) filter to confirm signals based on trend direction. Bullish signals are generated when the price is above the MA, and bearish signals when below.
Pattern Customization: Users can enable or disable individual candlestick patterns and adjust their parameters, such as maximum wick percentage or candle size multiplier. The candle size multiplier applies to the largest candle in the pattern and determines its minimum size relative to the average candle body size over a specified volatility period.
Labels and Colors: Signals are displayed as clear labels with customizable colors for bullish and bearish patterns.
Alerts: Each pattern has a dedicated alert function, facilitating integration with automated trading strategies.
List of Patterns
The indicator recognizes the following candlestick patterns (labels displayed in parentheses):
Bullish Engulfing (BE): Signals a potential upward reversal after a downtrend.
Bearish Engulfing (BE): Indicates a possible downward reversal after an uptrend.
Piercing Line (PL): A bullish pattern suggesting a bounce from support.
Dark Cloud Cover (DC): A bearish pattern indicating a potential downward reversal.
Morning Star (MS): A three-candle bullish pattern signaling an upward reversal.
Evening Star (ES): A three-candle bearish pattern indicating a downward reversal.
Three White Soldiers (3WS): A strong bullish signal based on three large bullish candles.
Three Black Crows (3BC): A strong bearish signal based on three large bearish candles.
Three Inside Up/Down (3Up/3Dn): Patterns indicating trend reversal based on an inside bar structure.
Settings
Settings are organized as follows:
MA Filter: Allows enabling a Moving Average (SMA, EMA, WMA) to filter signals based on trend direction.
Pattern Parameters: Each pattern has its own settings, such as volatility period, candle size multiplier, and maximum wick percentage. The size of the largest candle in the pattern is compared to the average candle body size over the specified volatility period.
Colors and Labels: Users can customize label colors and their distance from candles to improve readability.
█ SETTINGS
Detailed description of the indicator’s settings:
MA Filter:
Use MA Filter: Enables/disables the Moving Average filter.
MA Length: Specifies the period of the Moving Average (default: 50).
MA Type: Choose between SMA, EMA, or WMA.
MA Source: Select the data source (default: close price).
Pattern Settings:
Enable Pattern: Checkbox for each pattern (e.g., Bullish Engulfing, Morning Star).
Maximum Wick Percentage: Defines the maximum allowable wick size as a percentage of the candle body.
Big Candle Filter: Enables/disables checking if the largest candle in the pattern is larger than the average over the specified volatility period.
Volatility Period: Sets the period for calculating the average candle body size.
Candle Multiplier: Multiplier determining the minimum size of the largest candle in the pattern relative to the average candle body size over the specified volatility period.
Appearance:
Signal Text Color: Color of the label text (default: white).
Bullish Label Color: Color for bullish signals (default: green).
Bearish Label Color: Color for bearish signals (default: red).
Label Offset Factor: Controls the distance of labels from candles (from 0.0 to 1.0).
█ HOW TO USE
Add the indicator to your TradingView chart.
Configure the settings in the indicator’s dialog box:
Enable desired candlestick patterns.
Adjust the MA filter parameters to restrict signals to the trend.
Set colors and label offset for better readability.
Enable alerts for selected patterns to receive real-time notifications.
Monitor the labels on the chart and use them alongside other technical analysis tools.
█ LIMITATIONS
The indicator relies on historical price data and may produce false signals in volatile market conditions.
The big candle filter may be less effective on charts with low volatility.
The indicator performs best when combined with other analysis methods, such as support and resistance levels.
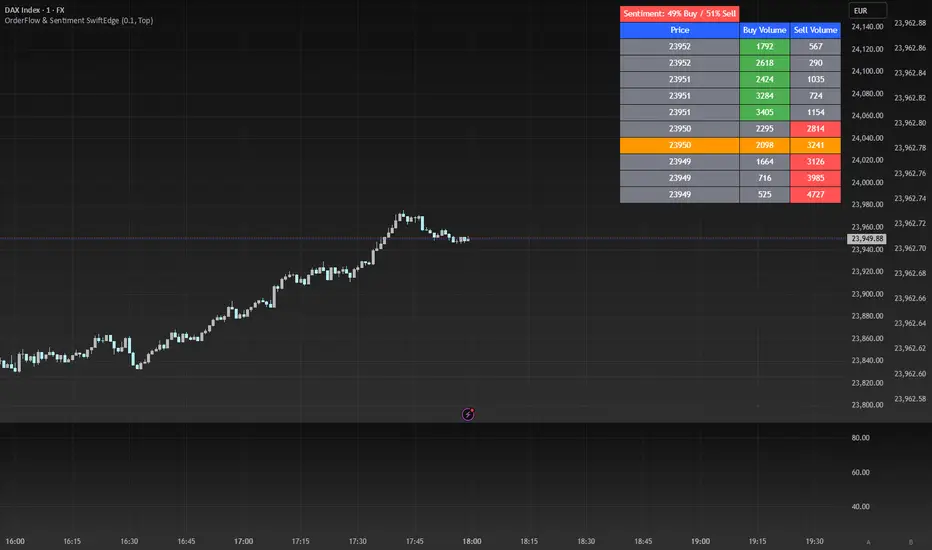
OrderFlow Sentiment SwiftEdgeOrderFlow Sentiment SwiftEdge
Overview
OrderFlow Sentiment SwiftEdge is a visual indicator designed to help traders analyze market dynamics through a simulated orderbook and market sentiment display. It breaks down the current candlestick into 10 price bins, estimating buy and sell volumes, and presents this data in an orderbook table alongside a sentiment row showing the buy vs. sell bias. This tool provides a quick and intuitive way to assess orderflow activity and market sentiment directly on your chart.
How It Works
The indicator consists of two main components: an Orderbook Table and a Market Sentiment Row.
Orderbook Table:
Simulates buy and sell volumes for the current candlestick by distributing total volume into 10 price bins based on price movement and proximity to open/close levels.
Displays the price bins in a table with columns for Price, Buy Volume, and Sell Volume, sorted from highest to lowest price.
Highlights the current price level in orange for easy identification, while buy and sell dominance is indicated with green (buy) or red (sell) backgrounds.
Market Sentiment Row:
Calculates the overall buy and sell sentiment (as a percentage) for the current candlestick based on the simulated orderflow data.
Displays the sentiment above the orderbook table, with the background colored green if buyers dominate or red if sellers dominate.
Features
Customizable Colors: Choose colors for buy (default: green), sell (default: red), and current price (default: orange) levels.
Lot Scaling Factor: Adjust the volume scaling factor (default: 0.1 lots per volume unit) to simulate realistic lot sizes.
Table Position: Select the table position on the chart (Top, Middle, or Bottom; default: Middle).
Default Properties
Positive Color: Green
Negative Color: Red
Current Price Color: Orange
Lot Scaling Factor: 0.1
Table Position: Middle
Usage
This indicator is ideal for traders who want to visualize orderflow dynamics and market sentiment in real-time. The orderbook table provides a snapshot of buy and sell activity at different price levels within the current candlestick, helping you identify areas of high buying or selling pressure. The sentiment row offers a quick overview of market bias, allowing you to gauge whether buyers or sellers are currently dominating. Use this information to complement your trading decisions, such as identifying potential breakout levels or confirming trend direction.
Limitations
This indicator simulates orderflow data based on candlestick price movement and volume, as TradingView does not provide tick-by-tick data. The volume distribution is an approximation and should be used as a visual aid rather than a definitive measure of market activity.
The indicator operates on the chart's current timeframe and does not incorporate higher timeframe data.
The simulated volumes are scaled using a user-defined lot scaling factor, which may not reflect actual market lot sizes.
Disclaimer
This indicator is for informational purposes only and does not guarantee trading results. Always conduct your own analysis and manage risk appropriately. The simulated orderflow data is an estimation and may not reflect real market conditions.
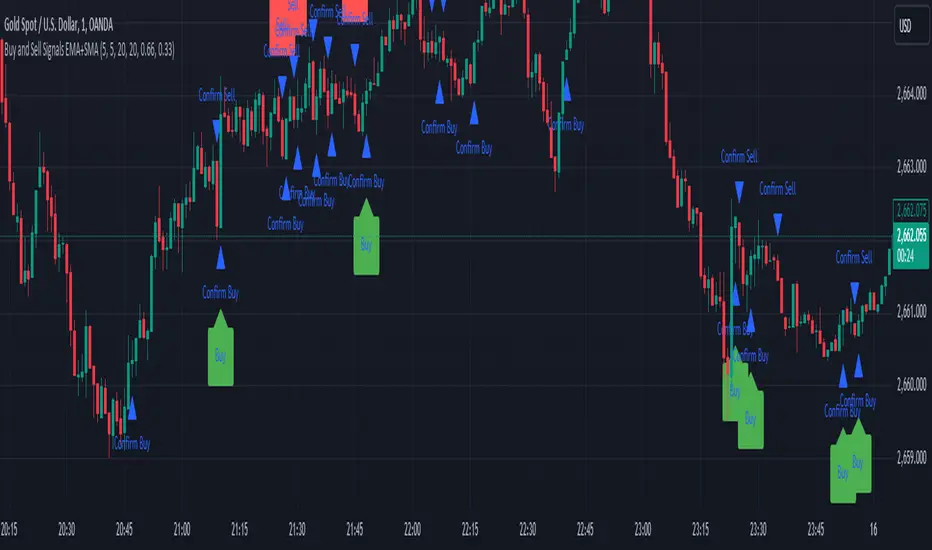
Arrow-SimplyTrade vol1.5-FinalTitle: Arrow-SimplyTrade vol1.5-Final
Description:
This advanced trading indicator is designed to assist traders in analyzing market trends and identifying optimal entry signals. It combines several popular technical analysis tools and strategies, including EMA (Exponential Moving Average), MA (Simple Moving Averages), Bollinger Bands, and candlestick patterns. This indicator provides both trend-following and counter-trend signals, making it suitable for various trading styles, such as scalping and swing trading.
Main Features:
EMA (Exponential Moving Average):
EMA200 is the main trend line that helps determine the overall market direction. When the price is above EMA200, the trend is considered bullish, and when the price is below EMA200, the trend is considered bearish.
It helps filter out signals that go against the prevailing market trend.
Simple Moving Averages (MA5 and MA15):
This indicator uses two Simple Moving Averages: MA5 (Fast) and MA15 (Slow). Their crossovers create buy or sell signals:
Buy Signal: When MA5 crosses above MA15, signaling a potential upward trend.
Sell Signal: When MA5 crosses below MA15, signaling a potential downward trend.
Bollinger Bands:
Bollinger Bands measure market volatility and can identify periods of overbought or oversold conditions. The Upper and Lower Bands help detect potential breakout points, while the Middle Line (Basis) serves as dynamic support or resistance.
This tool is particularly useful for identifying volatile conditions and potential reversals.
Arrows:
The indicator plots arrows on the chart to signal entry opportunities:
Green Arrows signal buy opportunities (when MA5 crosses above MA15 and price is above EMA200).
Red Arrows signal sell opportunities (when MA5 crosses below MA15 and price is below EMA200).
Opposite Arrows: Optionally, the indicator can also display arrows for counter-trend signals, triggered by MA5 and MA15 crossovers, regardless of the price's position relative to EMA200.
Candlestick Patterns:
The indicator detects popular candlestick patterns such as Bullish Engulfing, Bearish Engulfing, Hammer, and Doji.
These patterns are important for confirming entry points or anticipating trend reversals.
How to Use:
EMA200: The main trend line. If the price is above EMA200, consider long positions. If the price is below EMA200, consider short positions.
MA5 and MA15: Short-term trend indicators. The crossover of these averages generates buy or sell signals.
Bollinger Bands: Use these bands to spot overbought/oversold conditions. Breakouts from the bands may signal potential entry points.
Arrows: Green arrows represent buy signals, and red arrows represent sell signals. Opposite direction arrows can be used for counter-trend strategies.
Candlestick Patterns: Patterns like Bullish Engulfing or Doji can help confirm the signals.
Customizable Settings:
Fully customizable colors, line styles, and display settings for EMA, MAs, Bollinger Bands, and arrows.
The Candlestick Patterns feature can be toggled on or off based on user preference.
Important Notes:
This indicator is intended to be used in conjunction with other analysis tools.
Past performance does not guarantee future results.
Polish:
Tytuł: Arrow-SimplyTrade vol1.5-Final
Opis:
Ten zaawansowany wskaźnik handlowy jest zaprojektowany, aby pomóc traderom w analizie trendów rynkowych oraz identyfikowaniu optymalnych sygnałów wejścia. Łączy w sobie kilka popularnych narzędzi analizy technicznej i strategii, w tym EMA (Wykładnicza Średnia Ruchoma), MA (Prosta Średnia Ruchoma), Bollinger Bands oraz formacje świecowe. Wskaźnik generuje zarówno sygnały podążające za trendem, jak i przeciwnym trendowi, co sprawia, że jest odpowiedni do różnych stylów handlu, takich jak scalping oraz swing trading.
Główne Funkcje:
EMA (Wykładnicza Średnia Ruchoma):
EMA200 to główna linia trendu, która pomaga określić ogólny kierunek rynku. Gdy cena znajduje się powyżej EMA200, trend jest uznawany za wzrostowy, a gdy poniżej EMA200, za spadkowy.
Pomaga to filtrować sygnały, które są niezgodne z głównym trendem rynkowym.
Proste Średnie Ruchome (MA5 i MA15):
Wskaźnik używa dwóch Prostych Średnich Ruchomych: MA5 (szybka) oraz MA15 (wolna). Ich przecięcia generują sygnały kupna lub sprzedaży:
Sygnał Kupna: Kiedy MA5 przecina MA15 od dołu, sygnalizując potencjalny wzrost.
Sygnał Sprzedaży: Kiedy MA5 przecina MA15 od góry, sygnalizując potencjalny spadek.
Bollinger Bands:
Bollinger Bands mierzą zmienność rynku i mogą pomóc w identyfikowaniu okresów wykupienia lub wyprzedania rynku. Górna i dolna linia pomagają wykrywać punkty wybicia, a Środkowa Linia (Basis) działa jako dynamiczny poziom wsparcia lub oporu.
Narzędzie to jest szczególnie przydatne w wykrywaniu warunków zmienności i potencjalnych odwróceń trendu.
Strzałki:
Wskaźnik wyświetla strzałki na wykresie, które wskazują sygnały kupna i sprzedaży:
Zielona strzałka wskazuje sygnał kupna (gdy MA5 przecina MA15 i cena jest powyżej EMA200).
Czerwona strzałka wskazuje sygnał sprzedaży (gdy MA5 przecina MA15 i cena jest poniżej EMA200).
Strzałki w przeciwnym kierunku: Opcjonalna funkcja, która pokazuje strzałki w przeciwnym kierunku, uruchamiane przez przecięcia MA5 i MA15, niezależnie od pozycji ceny względem EMA200.
Formacje Świecowe:
Wskaźnik wykrywa popularne formacje świecowe, takie jak Bullish Engulfing, Bearish Engulfing, Hammer oraz Doji.
Formacje te pomagają traderom potwierdzić punkty wejścia i przewidzieć możliwe odwrócenia trendu.
Jak Używać:
EMA200: Główna linia trendu. Jeśli cena jest powyżej EMA200, rozważaj pozycje długie. Jeśli cena jest poniżej EMA200, rozważaj pozycje krótkie.
MA5 i MA15: Śledzą krótkoterminowe zmiany trendu. Przecięcia tych średnich generują sygnały kupna lub sprzedaży.
Bollinger Bands: Używaj tych pasm do wykrywania wykupionych lub wyprzedanych warunków. Wybicia z pasm mogą wskazywać potencjalne punkty wejścia.
Strzałki: Zielona strzałka wskazuje sygnał kupna, a czerwona strzałka sygnał sprzedaży. Strzałki w przeciwnym kierunku mogą być używane do strategii przeciwtrendowych.
Formacje Świecowe: Formacje takie jak Bullish Engulfing czy Doji mogą pomóc w potwierdzaniu sygnałów.
Ustawienia Personalizacji:
W pełni personalizowalne kolory, style linii i ustawienia wyświetlania dla EMA, MAs, Bollinger Bands oraz strzałek.
Funkcja Formacji Świecowych może być włączana lub wyłączana według preferencji użytkownika.
Ważne Uwagi:
Ten wskaźnik powinien być używany w połączeniu z innymi narzędziami analizy rynku.
Wyniki z przeszłości nie gwarantują wyników w przyszłości.

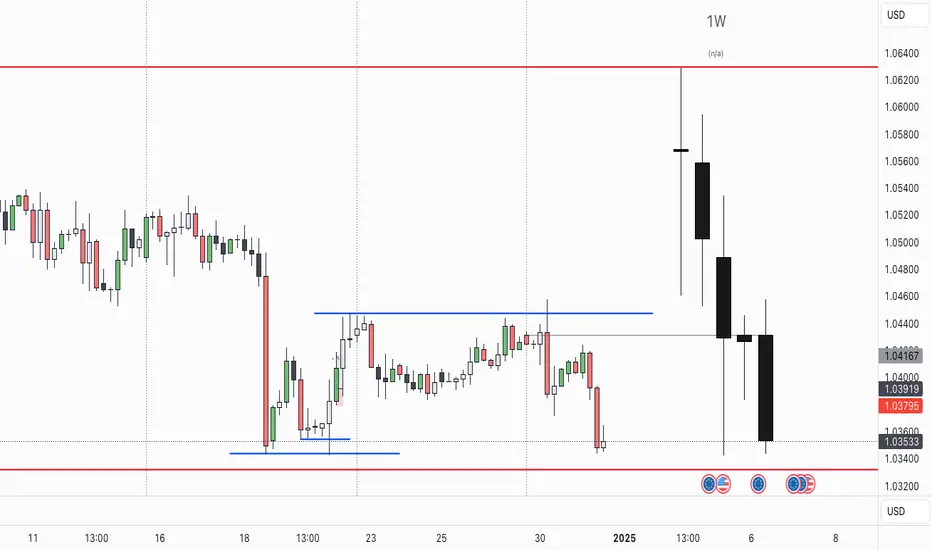
Consecutive Higher/Lower Closes with Breakout LineIndicator Description:
"Four Consecutive Higher/Lower Closes with Auto Breakout Line Timeframe" is a custom TradingView indicator designed to help traders identify key breakout points based on consecutive price action. It combines two main features:
Four Consecutive Higher/Lower Closes – Detects bullish or bearish momentum through consecutive higher or lower closing prices.
Auto Breakout Line – Plots a breakout line that adapts to the timeframe of the chart, helping to visualize potential breakout levels and trends.
Features:
Higher/Lower Close Detection: The indicator tracks and plots lines when there are four consecutive higher closes (bullish) or four consecutive lower closes (bearish). This can signal a trend or momentum in the market.
Breakout Line: It draws an adaptive breakout line that adjusts based on the selected timeframe (i.e., the chart interval), helping traders visually identify breakout levels across different timeframes.
Timeframe Adaptability: The indicator automatically adjusts the breakout line timeframe based on the chart interval (e.g., 15 minutes for lower timeframes and 1 day for higher timeframes).
Customizable Timeframe and Color: The default color for breakout lines is purple, but it is customizable. You can also enable/disable the breakout line through the settings.
How to Use This Indicator for Trading:
1. Trading with Consecutive Higher/Lower Closes:
Bullish Signal: When the indicator detects four consecutive higher closes, it signifies increasing buying momentum. Traders might consider taking long positions when this occurs, especially if the price continues to close higher.
Bearish Signal: When the indicator detects four consecutive lower closes, it signals increasing selling pressure. Traders might consider taking short positions if the price continues to close lower.
Confirmation: The fourth consecutive higher or lower close should be confirmed with additional analysis, such as candlestick patterns, support/resistance levels, or volume.
2. Using the Breakout Line:
The breakout line is designed to help traders identify potential breakout levels. When the price approaches or crosses this line, it could indicate that the market is either breaking out in the direction of the trend or failing to continue the trend.
Bullish Breakout: If the price crosses the breakout line upwards (after four consecutive higher closes), it may confirm that a bullish breakout is in progress. This can be a good opportunity to take a long position.
Bearish Breakout: If the price crosses the breakout line downwards (after four consecutive lower closes), it may confirm that a bearish breakout is occurring. This can be an opportunity to take a short position.
Avoid False Breakouts: It is important not to react to every price move crossing the breakout line. Wait for additional confirmation signals like higher volume, candlestick patterns (e.g., bullish or bearish engulfing), or other technical indicators (e.g., RSI, MACD) to confirm the breakout's validity.
How to Avoid Fake Breakouts:
A fake breakout occurs when the price moves beyond a breakout level but then quickly reverses back inside the range, trapping traders who took positions in the breakout direction.
Here are strategies to avoid fake breakouts:
1. Volume Confirmation:
A valid breakout is often supported by higher volume. If the price crosses the breakout line but the volume is low, it's more likely to be a fake breakout. Always check the volume when a breakout occurs.
Look for volume spikes that accompany the breakout. A surge in volume confirms the market's conviction in the new trend.
2. Candlestick Patterns:
Bullish/bearish engulfing patterns or Doji candles can provide important insights into potential reversals. If a breakout occurs but is immediately followed by a bearish engulfing candle, it's a sign that the breakout may be false.
Also, check for candlestick formations at key support or resistance levels for confirmation.
3. Time Confirmation:
Wait for the close of the current bar to confirm the breakout. A breakout within a single bar without closing above or below a significant level could be a false move.
Sometimes the market will test the breakout level before committing to the direction. This is common in volatile or choppy market conditions.
4. Use of Other Indicators:
RSI (Relative Strength Index): An overbought or oversold condition can indicate a potential reversal after a breakout.
MACD (Moving Average Convergence Divergence): Watch for a MACD crossover that aligns with the breakout direction to confirm the move.
5. Use Stop Losses:
A key rule in avoiding fake breakouts is to always use stop-loss orders. Set your stop-loss just outside the breakout level to avoid excessive losses if the price reverses.
Trailing stops can also help lock in profits if the price moves in your favor but may reverse at a later point.
Summary:
The Four Consecutive Higher/Lower Closes with Auto Breakout Line Timeframe indicator is a valuable tool for identifying strong trends and potential breakouts in the market. By combining consecutive close patterns with dynamic breakout levels, it can help traders spot bullish or bearish momentum and make more informed trading decisions. However, always confirm breakouts with volume, candlestick patterns, and other technical indicators to avoid fake breakouts and reduce the risk of false signals.
By using this indicator along with prudent risk management strategies, traders can improve their chances of entering and exiting trades at the right time while avoiding unnecessary losses from false breakouts.

Sell Signals EMA+SMAIndicator Overview:
This indicator identifies sell signals based on candlestick patterns, volume conditions, and moving average confirmations. It also plots support and resistance levels based on pivot highs and pivot lows. You can configure different settings like pivot lengths, moving average periods, and candlestick pattern conditions for the sell signals.
Configurable Settings:
Pivot High Length: Defines the number of bars used to calculate the resistance levels (pivot highs).
Pivot Low Length: Defines the number of bars used to calculate the support levels (pivot lows).
Volume SMA Length: The period of the simple moving average (SMA) for volume. Used to filter signals based on high volume.
Close SMA Length: The period of the simple moving average (SMA) for the close price. Used for confirmation of sell signals.
Pin Bar High Ratio: The ratio for defining the size of the upper wick in a bearish pin bar.
Pin Bar Low Ratio: The ratio for defining the size of the lower wick in a bearish pin bar.
How It Works:
Support and Resistance:
The indicator plots red lines for resistance (pivot highs) and green lines for support (pivot lows).
These levels are updated as new pivot points are detected based on the configured pivot lengths.
Sell Signal Conditions:
Candlestick Patterns: The indicator checks for two bearish patterns:
Bearish Pin Bar: A candle with a large upper wick and small lower wick where the close is below the open.
Bearish Engulfing: A candle where the current close is lower than the previous low, and the current open is higher than the previous high.
Volume Condition: The volume must be above the configured simple moving average (SMA) of the volume.
Confirmation: A sell signal is confirmed only when the price crosses below the configured SMA for the close price.
Sell Signals:
If all the conditions (candlestick pattern, volume, and confirmation) are met, the indicator will plot a red "Sell" label above the candle.
Additionally, a blue triangle will appear above the candle to indicate that the sell signal has been confirmed.
How to Use:
Adjust the Settings:
Open the settings of the indicator and adjust the parameters like pivot lengths, moving average periods, and candlestick pattern ratios based on your preferences.
Identify Key Levels:
Watch the red resistance and green support lines to identify key levels where price may reverse.
Look for Sell Signals:
When a red "Sell" label appears, it indicates a possible sell opportunity.
Ensure that a blue triangle (confirmation) also appears to validate the sell signal.
Manage Risk:
Use the support and resistance levels along with the sell signals to define your entry, stop-loss, and take-profit levels.
This indicator helps you identify potential bearish reversal points with configurable settings for added flexibility.
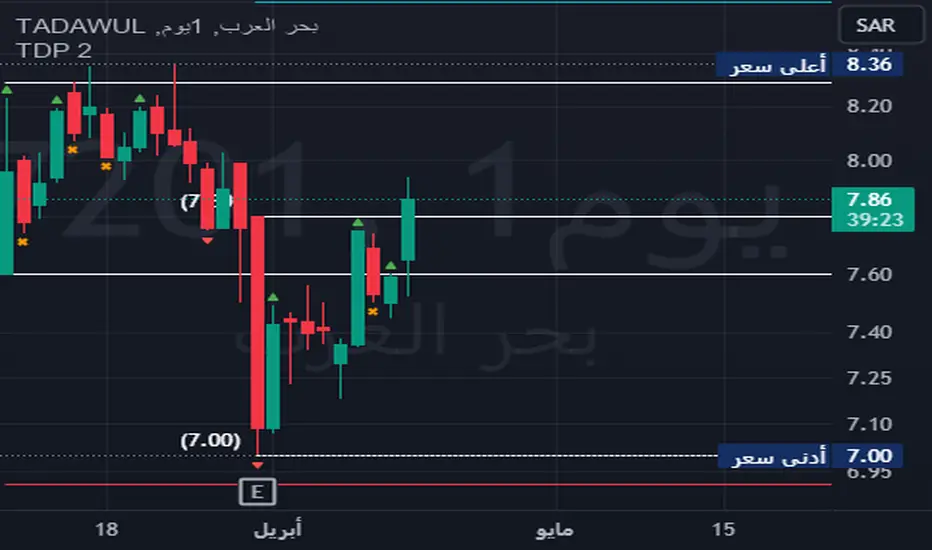
TDP 2Title: Enhanced Candlestick Pattern Identifier with Body Ratio Analysis
Description:
This Pine Script, titled "Enhanced Candlestick Pattern Identifier with Body Ratio Analysis," is designed to aid traders in visualizing key candlestick formations that have significant implications for trend reversals and continuations. It uses the body ratio of candles to identify strong directional movements, enhancing decision-making processes in trading strategies.
Key Features:
Body Ratio Calculation: The script calculates the body ratio of each candle, which is the proportion of the candle's body to its total range. This helps in distinguishing between candles that show decisive market movements versus those with indecision.
Bullish Candle Identification: Identifies bullish candles where the close is greater than the open and the body constitutes at least 55% of the total candle range, indicating strong buying pressure.
Bearish Candle Identification: Flags bearish candles where the open is above the close with a body ratio of 55% or more, highlighting strong selling pressure.
Comparative Analysis: The script not only identifies bearish candles but also categorizes them based on whether they close below the lowest point of the last qualifying bullish candle, offering insights into potential breakdowns or supports.
Visual Markers: Uses distinct shapes and colors to mark each type of candle directly on the chart, making it easy to spot these patterns in real-time trading scenarios.
Utility:
This tool is invaluable for traders who utilize technical analysis to make informed decisions. By providing clear visual cues about significant bullish and bearish candlestick formations, the script facilitates quick interpretations of potential market moves, helping traders to capitalize on trends or protect against losses from reversals.
How to Use:
Simply add this script to your chart, and it will automatically highlight the qualifying candles. Green labels indicate strong bullish candles, red labels signify bearish candles closing below the last bullish candle's low, and orange labels show bearish candles that do not close below the bullish low.
Ideal for use in various markets including forex, equities, and commodities, this script is a must-have tool for both novice and experienced traders aiming to enhance their trading strategy with detailed candlestick pattern analysis.
OW_MTF CandleDescription
Overview The OW_MTF+ indicator allows traders to visualize Higher Timeframe (HTF) candlesticks directly on their current chart. Designed for Price Action and Smart Money Concepts (SMC) traders, this tool helps you perform Top-Down Analysis without switching back and forth between timeframes.
Unlike standard MTF indicators, this script features a Dynamic History Fade system that automatically adjusts the transparency of older candles, keeping your chart clean and focused on recent price action.
Key Features
・Multi-Timeframe Overlay: Display candles from any higher timeframe (e.g., show 4-Hour candles on a 15-Minute chart).
・Real-Time Updates: Uses lookahead=barmerge.lookahead_on to ensure the forming HTF candle updates in real-time with the current market price, allowing for immediate reaction to live price action.
・Dynamic Transparency (Fade Effect): The indicator includes a smart visual management system. It automatically increases the transparency of older historical candles so they do not obscure your chart, while keeping the most recent candles vivid and clear.
・Extended History: Supports displaying up to 500 historical HTF bars, giving you a deep view of past market structure.
・Time-Accurate Positioning: utilizes xloc.bar_time to ensure candles and wicks are perfectly aligned with the correct timestamp, preventing visual misalignment during market gaps.
Settings & Customization
・Timeframe: Select your desired Higher Timeframe (e.g., 240 for 4-Hour, D for Daily).
・History Depth: Choose how many HTF bars to display (Max 500).
Visual Styles: Fully customizable colors for Bullish/Bearish bodies, wicks, and borders.
・Auto Extend Mode: When enabled, this optimizes the transparency of the most recent 50 bars for the best visual experience.
Technical Note This indicator uses lookahead_on to retrieve HTF data. This is intentional to allow the current forming bar to update in real-time. Please note that while the historical closed candles are permanent, the currently active HTF candle will update tick-by-tick until it closes.
概要
OW_MTF Candleは、現在表示しているチャート上に上位足のローソク足を重ねて表示するマルチタイムフレーム・インジケーターです。 プライスアクションやスマートマネーコンセプト(SMC)を用いたトレードにおいて、時間足を切り替えることなくトップダウン分析を行うのに最適です。
通常のMTFインジケーターとは異なり、**「ダイナミック・ヒストリー・フェード(動的透明度調整)」**機能を搭載しています。これにより、過去の古いローソク足の透明度を自動的に上げ、最新のプライスアクションを強調しつつ、チャート全体の視認性を保ちます 。
主な機能
・マルチタイムフレーム表示: 任意の上位足を選択して表示可能です(例:15分足チャートに4時間足のローソクを表示など)。
・リアルタイム更新: request.security で lookahead=barmerge.lookahead_on を使用しているため、現在形成中の上位足もリアルタイムの価格に追従して動きます 。
・動的透明度(フェード効果): 過去の履歴バーがチャートを邪魔しないよう、古い足ほど自動的に透明度を高く調整します。これにより最新の相場状況がクリアに表示されます 。
・拡張履歴: 最大500本までの過去の上位足を表示でき、長期的な市場構造の確認が可能です 。
・正確な位置合わせ: xloc.bar_time(時間座標)を使用しているため、市場の休場やギャップがあってもローソク足とヒゲが正しい時刻に配置されます 。
設定項目
・上位足の時間足 (Timeframe): 表示したい上位足を選択します(デフォルト: 240/4時間足)。
・表示する履歴本数: 過去何本分の上位足を表示するか設定します(最大500本)。
・スタイル設定: 上昇足・下降足の実体色、ヒゲの色、枠線の太さなどを自由にカスタマイズ可能です 。
・自動拡張モード (Auto Extend): 最新の50本に対して最適な透明度調整を自動で行います 。
技術的な注釈
・確定した過去足: リペイントしません(変化しません)。
・現在進行中の足: 確定するまではリアルタイムで形状が変化します。

Wp's Vector CandlesVector Candles are special, color-coded candlesticks that highlight significant market activity, showing intense buying/selling (climax), institutional entry, momentum shifts, or potential reversals by analyzing high volume and large price ranges (spreads). They transform normal charts to instantly spot areas of extreme participation (bullish green/blue, bearish red/violet) versus standard conditions (gray), helping traders see market dynamics beyond just price.

BLACK SWAN SWEEP (DANIELPEREZ)Crt de velas especificas después del sweep buscar la confirmación del order block para tomar una operacio .
Check specific candlesticks after the sweep to find order block confirmation before taking a trade.

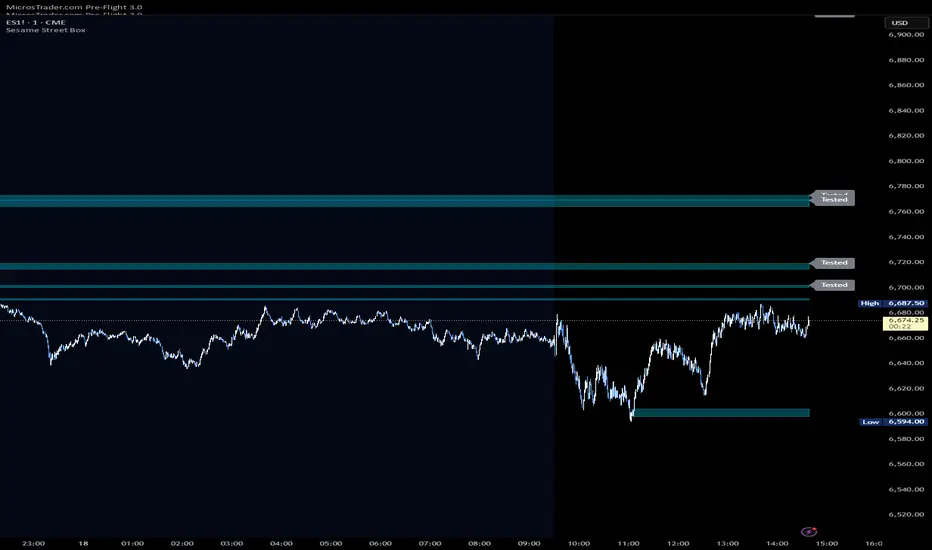
Sesame Street BoxThe Sesame Street Box is a 100% original candlestick pattern by it's creator. ICT invented order blocks, I have invented the Sesame Street Box.
This candlestick pattern draws a retouch box. In particular, in an up trend, it finds one down closed candle that has at least 3 up closed candles before it, and 3 or more up closed candles after it. 3-1-3 candle stick pattern. The 3 or more candles after it MUST leave the candlestick range of the down closed candle for the box to draw. The box is drawn from the low of the down closed candle to the high of the down closed candle and extended to the right. Once price reaches into this box, you would long off the top of the rendered box for continuation.
The reverse is true for shorts. For shorts, there would be 3 or more down closed candles, 1 up closed candle, followed by 3 or more down closed candles that leave the up closed candle's range. If these conditions are met, a box is drawn. The box is drawn from the low of the up closed candle to the high of the up closed candle and extended to the right. Once price reaches into this box, you would short off the bottom of the rendered box for continuation.
This indicator also provides 2 optional time frames to render the same pattern on your active chart. If you do not want to use these, just leave the option set as chart, and only the active timeframe will render.
There is also an option to toggle how to handle the boxes once they are invalidated. Either you can delete them, or choose to have them stop rendering at the candle that invalidated them.
Exciting Candles by BitcoinBailyExciting Candles by BitcoinBaily — is a custom indicator that visually highlights "momentum" or "exciting" candlesticks on the chart.
It helps traders quickly identify candles with strong body-to-range ratios, i.e., candles showing strong price momentum (big move between open and close relative to the high-low range).
If the candle’s body is greater than or equal to the threshold percentage (say 85%), the bar is colored yellow. Otherwise, no color is applied.
Yellow Candle = Exciting Candle
The candle’s body occupies ≥ the set % (e.g., 85%) of the total high-low range.
Indicates strong momentum (buyers or sellers dominated most of that period).
No Color = Neutral / Normal Candle
Price moved both ways (upper & lower wicks), but neither buyers nor sellers fully dominated.
1. Range Breakout: When price breaks a sideways range and a yellow (exciting) candle appears,
it confirms that real momentum has entered — a good time to catch the move early.
2. Trend Pullback: If price dips to a moving average (like 20 or 50 SMA) and then forms a yellow
candle, it signals that buyers are regaining control — often a high-probability trend
continuation entry.
3. Exhaustion Top: A yellow bearish candle near a resistance area shows strong selling pressure
— a warning that the uptrend may be ending.
4. Sideways Market: When no yellow candles appear, the market lacks momentum — best to
stay out and avoid choppy trades.
