Objective Doji Highlight (Range-Relative)This indicator highlights Doji candles using an objective, mathematics-based rule: a bar is Doji when the absolute difference between its open and close is less than or equal to a user-defined fraction (x) of that bar’s high–low range.
How it works:
Compute body size as the absolute difference between open and close.
Compute the bar’s range as high minus low.
Classify as Doji when body size ≤ x × range.
Only Doji candles are colored; non-Doji bars remain unchanged.
Inputs
Doji threshold (x of range): tolerance (0–1) controlling how small the body must be relative to the range.
Doji Candle Color: visual color for detected Doji candles.
Example:
If x = 0.10 and a candle has high = 100 and low = 90 (range = 10), the maximum allowed body is 1.
If the difference between open and close is ≤ 1, the candle is marked as Doji.
Why it can be useful
Doji candles are often studied as signs of market indecision. This tool provides a clear, parameter-based way to identify them consistently across any timeframe, without discretionary interpretation.
Notes & limitations
Works with standard candlesticks (not Heikin Ashi, Renko, or other synthetic bar types).
Visualization and research only: it does not produce buy/sell signals and makes no performance claims.
No repainting from future data; the logic uses only the current bar’s prices.
Search in scripts for "Candlestick"

顶/底分型 指标Top/Bottom Fractal Indicator is a technical analysis tool used to identify potential reversal points in a market trend. It is based on the concept of fractal patterns, which consist of specific candlestick formations that signal local highs (top fractals) or lows (bottom fractals).
A top fractal typically occurs when the high of a middle candlestick is higher than the highs of the two candles on either side. This formation suggests that upward momentum may be weakening and a downward reversal could follow. Conversely, a bottom fractal forms when the low of a middle candlestick is lower than the lows of the two adjacent candles, indicating a potential shift from a downtrend to an uptrend.
This indicator is commonly used to spot market turning points, determine entry or exit signals, and enhance the reliability of other indicators such as Bollinger Bands or MACD. Because of its clear structure and reliable reversal signals, the Top/Bottom Fractal Indicator is also widely applied in wave theory and price action strategies.
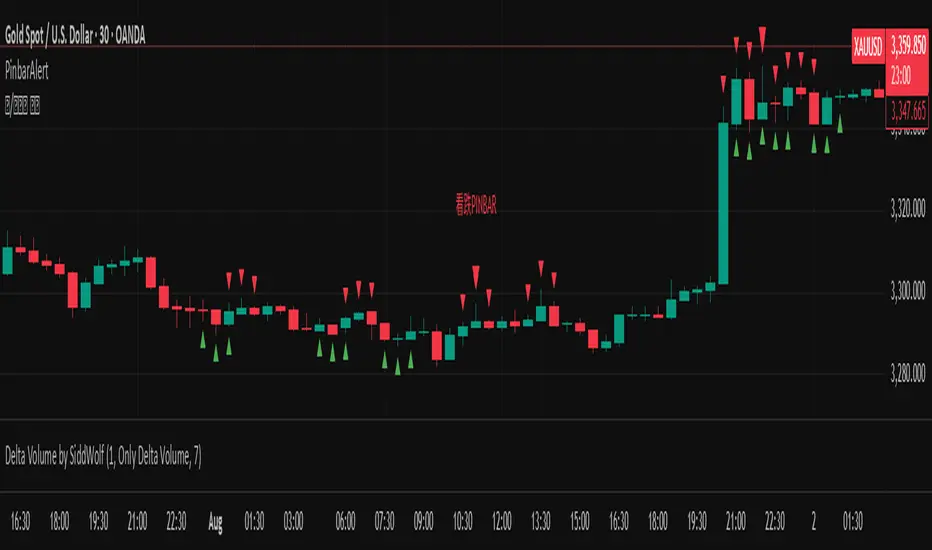
Pinbar DetectorPinbar Detector is original from Naked Candlestick Trading Method
Pinbar Definition: A candlestick where the dominant shadow exceeds 2/3 of the entire candle length
Key Features:
Bearish Pinbar: Red downward triangle when upper shadow exceeds 2/3 of total candle length
Bullish Pinbar: Green upward triangle when lower shadow exceeds 2/3 of total candle length
Background highlighting for easy identification
Alert conditions for both bullish and bearish pinbars
Original candlestick display preserved

Candle Close Location MarkerThis script customizes the appearance of candlesticks by highlighting whether the candle closed in the upper, middle, or lower part of its range — using a small orange marker inside each candle.
It also includes a traditional volume histogram with two simple moving averages (SMA 20 and SMA 50), helping traders detect volume trends and potential reversals.
📌 Useful for identifying strength of momentum and visualizing market sentiment clearly.
Features:
• ✅ Colored candles: green for bullish, black for bearish
• ✅ Orange square shows the position of the close (top, middle, or bottom of the candle)
• ✅ Volume bars with SMA 20 (orange) and SMA 50 (blue)
• ✅ Works on all timeframes
Developed by:
Version: 1.0
Language: Pine Script v5
Another EMA/RSI trend indicatorAnother EMA/RSI trend indicator is a trend-following trade signal and back-testing tool. It leverages EMA, RSI, ATR, volume, and price breakouts to generate and track buy/sell signals, manage trades, and display performance statistics.
EMA (Exponential Moving Average): Used for identifying trend direction.
RSI (Relative Strength Index): Used to confirm momentum.
ATR (Average True Range): Used to calculate Stop Loss (SL) and Take Profit (TP) dynamically.
Volume: Only trades when current volume > average volume.
Price breakout filters: Detects bullish/bearish breakout candlesticks for signals.
Entry Logic
Entry placed slightly above/below current price using an ATR-based buffer.
Configurable SL and TP using ATR multipliers.
Optional: Stop existing trade on a new opposite signal.
Entry filters include price structure checks using highs/lows.
Visual output
Plots Buy/Sell signals on chart
Draws entry, SL, and TP lines for ongoing trades
Displays trade statistics in a table (top-right):
Trade count
Wins/Losses/Stopped
Win rate
Cumulative and average profit/loss
Start date
This is a semi-automated trading signal generator and visual back-tester aimed at helping traders:
Identify trend-based entry opportunities
Automate entry/exit evaluation using standard risk management
Evaluate performance with live stats

Engulfing Logic Candle Consolidation
The "Engulfing Logic Candle Consolidation" indicator is designed to visualize price zones where multiple candlesticks are engulfing each other. When candles meet specific engulfing conditions, the script merges them into a single "virtual" range and displays it using semi-transparent boxes on the chart.
- Engulfing Range Logic : Automatically detects and consolidates groups of candles that are fully engulfed by others, forming clear structural zones.
- Multi-Session Time Highlights : Marks major trading sessions (Asia, Europe, U.S.) with customizable colors and visibility settings, helping traders identify time-based market rhythms.
The indicator uses two engulfing conditions to form virtual zones:
1、 Short-after-Long (right-side engulfing) : If the current candle is engulfed by the previous candle, a virtual box begins from that pair.
2、 Long-after-Short (left-side engulfing) : If the current candle engulfs one or more previous candles (looping backward), it triggers zone formation.
The zone grows as long as new candles are completely inside the range of prior ones. When engulfing ends, the range is boxed and preserved visually.
This tool is ideal for traders who focus on price structure. By consolidating engulfing candles into zones, it filters out noise and emphasizes meaningful price behavior. Works well when combined with trendlines, support/resistance, and volume indicators.
---
中文
<概述>
結合律 K 線整理指標用於視覺化市場中具有「吞噬行為」的價格結構。當多根 K 線出現互相包含的情況時,指標會將它們合併成一個虛擬區間,並以半透明區塊方式在圖表中標示出來。
<功能>
- 吞噬區間邏輯 :自動判斷多根 K 線是否符合「包容」邏輯,將其歸納為單一整理區。
- 多時區背景提示 :標示亞洲、歐洲、美國主要交易時段,並可自由設定顏色與開關,強化交易節奏感知。
<邏輯說明>
此指標使用兩種吞噬條件建立整理區:
短後長(右側包容) :若當前 K 線被前一根吞噬,將該兩根視為起點。
長後短(左側包容) :若當前 K 線吞噬一或多根前方 K 線,則回頭形成區間。
只要後續 K 線繼續落在區間內,就會不斷擴展。直到不再符合條件,該區間會被框選並視覺化標示。
<使用情境>
適合用於進行價格行為結構分析的交易者。它能簡化雜訊,聚焦在關鍵轉折與延續區。可與趨勢線、支撐壓力、成交量指標等搭配使用,提高 K 線策略的判讀效率。

Wick Ratio IndicatorScript Description: Wick Ratio Indicator
This Pine Script indicator identifies candlesticks with dominant upper or lower wicks and visually marks them on the chart. It helps traders spot potential price rejection signals, often used to anticipate trend reversals or breakout opportunities. Key Features
Wick Length Calculation
Upper Wick: high - max(open, close)
(Measures distance from the highest price to the candle body's top)
Lower Wick: min(open, close) - low
(Measures distance from the candle body's bottom to the lowest price)
Comparison Logic
Green Triangle (▲): Plotted above the candle when the upper wick is longer (bearish rejection signal).
Red Triangle (▼): Plotted below the candle when the lower wick is longer (bullish rejection signal).
Visual Simplicity
Non-intrusive design that overlays directly on price action.
Customizable colors and sizes (modifiable in settings).

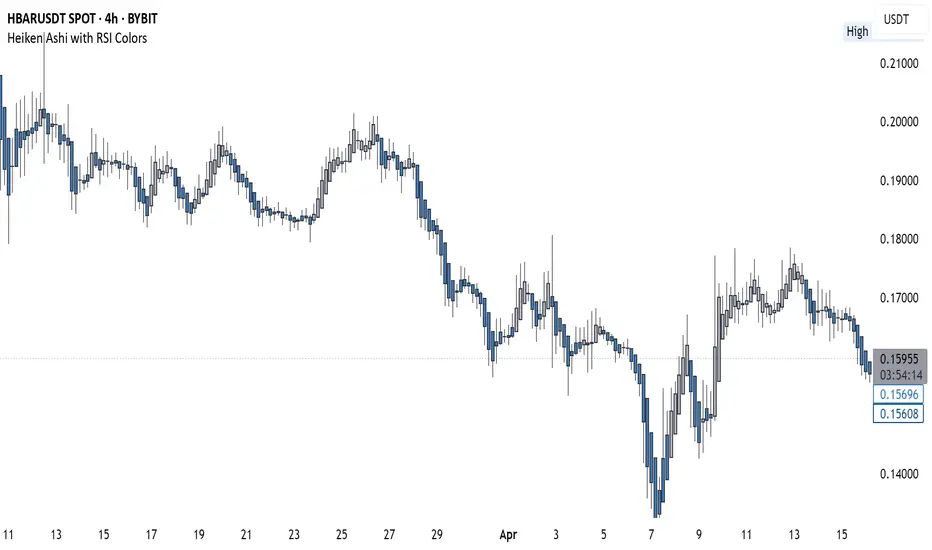
Heiken Ashi with RSI Colors📜 Description:
This indicator blends Heiken Ashi candlesticks with RSI-based color filters to help traders quickly assess both trend structure and momentum extremes in a single glance.
✅ Heiken Ashi Mode: Smooths out price action to highlight clearer trends and suppress noise
✅ RSI Coloring: Applies candle color changes based on whether RSI is overbought, oversold, or neutral
It allows traders to visually spot potential exhaustion zones, continuation trends, or early reversal areas with enhanced clarity.
🔧 Settings:
Use Heiken Ashi Candles: Toggle between standard candles and Heiken Ashi smoothed values
RSI Length: Controls the lookback for RSI calculation (default 14)
Overbought/Oversold Levels: Customize your thresholds for extreme conditions (default: 70/30)
🎨 Candle Color Logic:
Green (Lime): RSI is overbought → price may be overextended upward
Red: RSI is oversold → price may be overextended downward
Gray: RSI is between extremes → neutral momentum
💡 Use Cases:
Confirm trend momentum with Heiken Ashi structure
Spot potential reversal points using RSI extremes
Enhance entry/exit decisions by combining price action and momentum in a single visual
ATR gorizontal vswed
This indicator is based on the Average True Range (ATR) and provides users with a clear visual representation of key volatility metrics for a selected asset. The ATR is calculated using daily candlesticks over a specified period.
🔹 Key Features:
ATR 1D – Average True Range value over the selected period (default: 24 days).
Current ATR – Current relative volatility compared to ATR.
Stop ATR – Suggested stop-loss level based on ATR.
Power Reversal – Difference between ATR and current volatility.
Risk-Reward Ratio (RR) – The ratio between the potential reward and the stop-loss level.
📊 Visual Representation:
The indicator displays data in a compact, horizontal table, positioned at the desired location on the chart (default: bottom-right). The values are color-coded for better readability.
This tool is useful for traders looking to assess market volatility, stop-loss placement, and potential trade opportunities based on ATR calculations.

langshen K-Line CounterEnglish Description:**
This indicator, named “langshen K-Line Counter,” is designed to count the number of K-line bars (candlesticks) during the current trading day. The key functionalities include:
- **Daily Reset**: At the start of a new trading day (detected by the change in daily time), the counter automatically resets to 1.
- **Incremental Counting**: For each new bar within the same trading day, the counter increments by 1, thus recording the sequence number of each K-line.
- **Chart Display**: The current count is displayed as a numerical label above the high of each K-line on the chart. Users can customize the text size and color of these numbers.
This feature enables traders to visually track the number of K-lines and their sequence within the day, which can assist in analyzing market trends and the pace of price movements.
中文介绍:**
此指标名为“langshen K线计数器”,主要用于统计当前交易日内的K线(蜡烛图)数量。指标的核心功能包括:
- **每日计数重置**:在交易所日切换时(即新的一天开始时),计数器自动重置为1。
- **逐根累加**:在同一交易日内,每根新出现的K线都会使计数器加1,从而记录当天的K线序号。
- **图表展示**:计数器的当前值会以数字标签的形式显示在每根K线的最高价上方,用户可自定义数字的显示大小和颜色。
这种功能可以帮助交易者直观地了解当天市场中的K线数量以及K线的序号变化,辅助分析市场的走势和节奏。

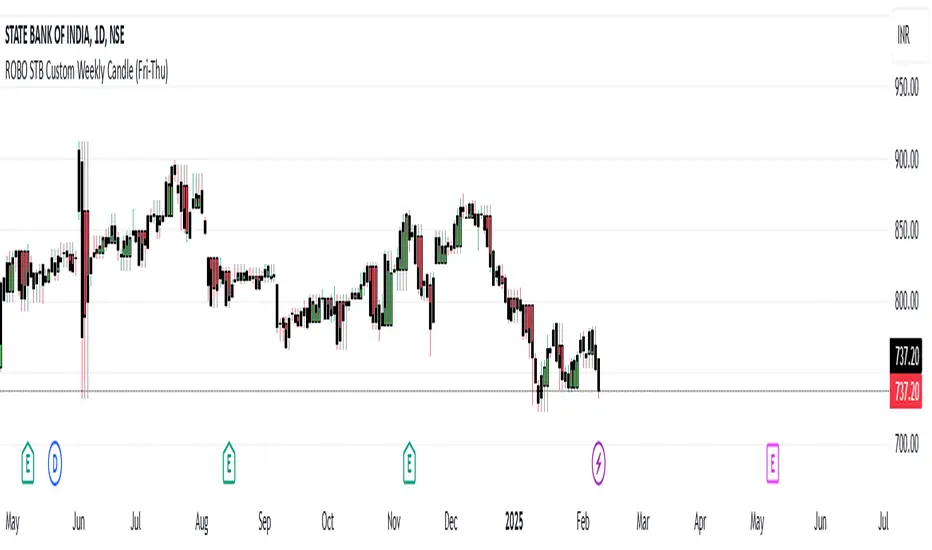
ROBO STB Custom Weekly Candle (Fri-Thu)Description:
This indicator creates custom weekly candles that start on Friday and end on Thursday, instead of the standard Monday–Friday weekly structure in TradingView. It aggregates the open, high, low, and close (OHLC) values from Friday to Thursday and displays them as candlesticks on the chart.
Features:
✅ Custom weekly candles from Friday to Thursday
✅ Dynamic calculation of open, high, low, and close
✅ Works on any timeframe
✅ Helps traders analyze market structure differently
How It Works:
Identifies the custom weekly session based on Friday's start and Thursday's end.
Aggregates OHLC values within this time range.
Resets the values when a new custom week begins.
Plots the calculated weekly candles on the chart.
Use Case:
This indicator is useful for traders who prefer to analyze weekly price movements based on a non-standard start and end day, especially those focusing on forex, crypto, or commodities where trading hours differ.
Notes:
This script does not modify existing candles but overlays new custom weekly candles on the chart.
It does not repaint and updates in real-time.
If you find this useful, like and share! 🚀
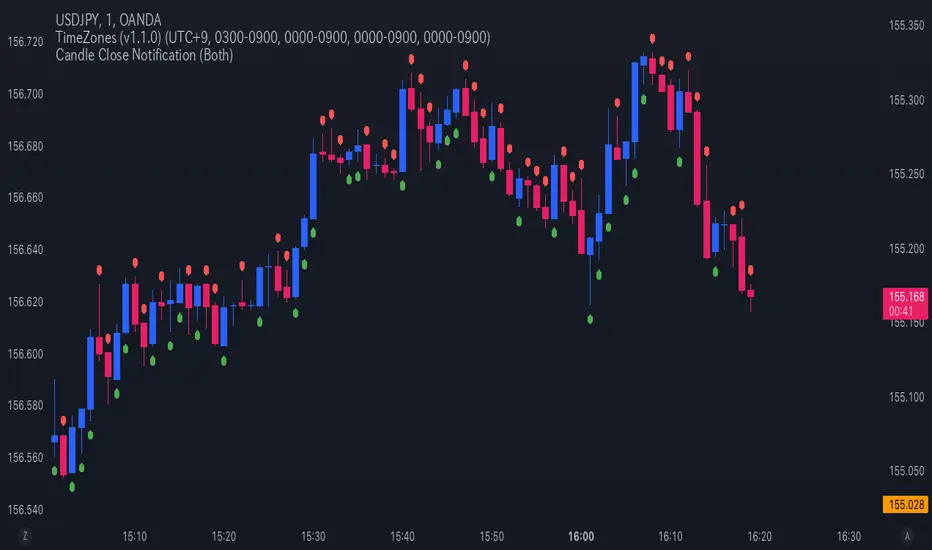
Candle Close NotificationCandle Close Notification Indicator - Specification
1. 概要 (Overview)
本インジケーターは、TradingView 上でローソク足が確定した際に、そのローソク足が陰線(Bearish)または陽線(Bullish)であった場合に通知を送信するものです。
また、該当するローソク足の上または下にマークを表示し、視覚的にも識別しやすくなっています。
This indicator for TradingView sends notifications when a candlestick closes as either a bearish (red) or bullish (green) candle. It also marks the corresponding candles on the chart for visual reference.
2. 機能 (Features)
2.1 通知機能 (Notification Function)
ローソク足の確定時に、以下の条件に基づき アラート(通知) を送信します。
「Both」(両方): 陰線・陽線のどちらでも通知
「Bearish」(陰線のみ): 陰線の時のみ通知
「Bullish」(陽線のみ): 陽線の時のみ通知
When a candlestick closes, an alert notification is sent based on the selected option:
"Both" (Default): Notifies for both bearish and bullish candles.
"Bearish": Notifies only bearish candles.
"Bullish": Notifies only bullish candles.
2.2 チャートマーク表示機能 (Chart Marking Function)
ローソク足が確定した際、以下のルールでマークを表示します。
陰線(Bearish) の場合、赤色の「下向きマーク」を表示(ローソク足の上)
陽線(Bullish) の場合、緑色の「上向きマーク」を表示(ローソク足の下)
When a candlestick closes, a marker appears according to the following rules:
Bearish candle → A red downward marker appears above the candle.
Bullish candle → A green upward marker appears below the candle.
3. 通知オプションの設定 (Setting Notification Options)
スクリプト内の notify_option の値を変更することで、通知の種類を設定できます。
Both(デフォルト) → 陰線・陽線両方通知
Bearish → 陰線のみ通知
Bullish → 陽線のみ通知
Modify the notify_option value in the script to customize notifications:
Both (Default) → Notifies for both bearish and bullish candles.
Bearish → Notifies only bearish candles.
Bullish → Notifies only bullish candles.
TradingView の アラート機能 を有効にすることで、通知を受け取ることができます。
Enable TradingView’s Alert function to receive notifications.
MGR Inside 2The inside bar pattern is characterised by two consecutive candlesticks that often suggest a period of consolidation or indecision in the market. Traders and analysts can find value in identifying the setup as it can provide insights into potential future price movements.

Engulfings/DojiDescription of the Indicator:
The "Engulfings/Doji" indicator, is designed to assist traders in identifying significant candlestick patterns on price charts. This indicator focuses on two primary candlestick patterns: Bullish Engulfing and Bearish Engulfing, as well as the Doji pattern. It provides valuable insights into potential price reversals or continuations. Here's how it works and how to use it:
Concepts Underlying the Calculations:
Bullish Engulfing and Bearish Engulfing Patterns: Bullish Engulfing patterns occur when a candle's open and close prices are lower than the previous candle's open and close, and the current candle completely engulfs the previous one. Bearish Engulfing patterns are the opposite, with the current candle's open and close prices higher than the previous candle's open and close, completely engulfing it.
Doji Pattern: The indicator also detects Doji candles. A Doji is characterized by a small or nearly non-existent body, indicating uncertainty or market indecision.
Time Filtering (Sig_Time): The indicator applies time-based filters to consider these patterns only during specific trading sessions or hours. This helps traders focus on more relevant signals during active market times.
Higher Timeframe (HTF) Engulfing Patterns: Additionally, the indicator can display HTF (Higher Timeframe) Engulfing patterns on the current chart, allowing traders to identify stronger signals occurring on higher timeframes.
How to Use the Indicator:
The indicator identifies and visually represents Bullish Engulfing, Bearish Engulfing, and Doji patterns on the price chart.
The colors of these patterns can be customized based on their significance and the time of occurrence.
Traders can set a maximum allowable body size for Doji patterns using the "Doji's Max Body size" input.
The "Show HTF Engulfings" input allows traders to display HTF Engulfing patterns on the chart.
Traders can choose not to display Doji patterns on the 1-minute (M1) timeframe by enabling the "Don't display Doji on M1" option.
Candlestick patterns and Doji signals are displayed with appropriate symbols and colors to help traders identify potential trading opportunities.
The time-based filtering enhances the relevance of the signals presented by the indicator.
Night Session Background V1.0This script can achieve the following functions:
Select a specified time period, such as the U.S. trading session, and mark this period on the background of the candlestick chart.
The purpose of doing this:
It allows you to more intuitively observe the candlestick patterns during specific time periods, such as the U.S. trading session.

布林带触碰报警-ZHbolling:Alert condition: When a candlestick touches either the upper or lower Bollinger Band, and the amplitude of that candlestick reaches 0.5%. The amplitude is calculated as: (highest point - lowest point) / highest point

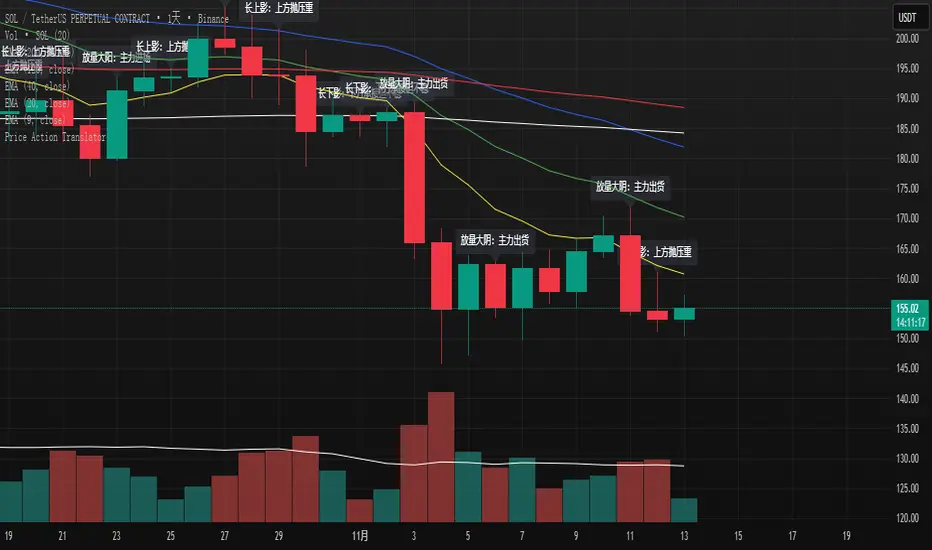
K线语言·国师版 — Price Action TranslatorUnderstand what the market is really saying.
This script automatically translates candlestick and volume behavior into clear, human-readable messages directly on your chart.
Instead of guessing what each bar means, you can hear the market speak.
📈 Green bar with volume → Buyers are in control
📉 Red bar with volume → Sellers are dumping positions
⚖️ Doji → Indecision between buyers and sellers
💡 Long upper wick → Selling pressure from above / Long lower wick → Buyers absorbing below
🧠 Core Concept
Most indicators tell you what happened.
Price Action tells you why it happened.
This script bridges that gap by letting the candles explain the psychology behind every move.
It helps traders:
Visualize market sentiment through candlestick language.
Identify institutional accumulation or distribution.
Build confidence by understanding the story behind price.
⚙️ Main Features
✅ Automatically detects strong volume bars, Doji, long wicks, and reversal patterns.
✅ Displays short contextual messages above or below each bar.
✅ Works on all time frames (Daily / 4H / 1H).
✅ Clean and non-intrusive visual design.
📈 Best For
Traders learning Price Action logic.
Multi-time-frame trend analysts.
Active traders who want to reduce emotional decisions.
🚀 Usage Tips
1️⃣ Use it with your EMA trend system for confirmation.
2️⃣ Watch for volume surges to confirm real momentum.
3️⃣ Do not chase small Doji bars — wait for confirmation candles.
💬 Author’s Note
“Price Action is the language of the market.
Once you understand its voice, you don’t need to guess anymore.”
— Master Edition · Price Action Translator
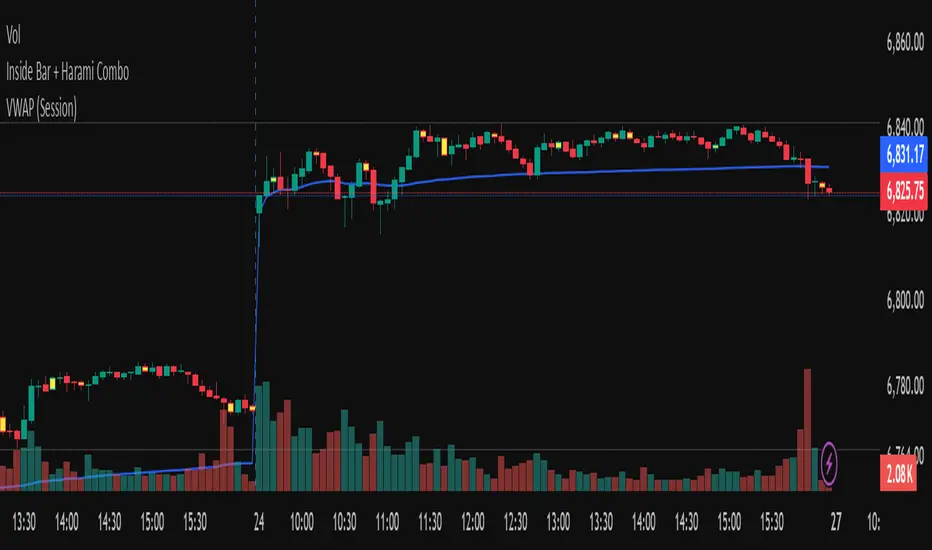
Inside Bar + Harami ComboThis indicator visually highlights Inside Bars, Outside Bars, and Harami candlestick patterns directly on your chart using clean color-coded candles — no labels, no shapes, just visual clarity.
It helps traders quickly identify potential reversal and continuation setups by coloring candles according to the detected pattern type.
🔍 Patterns Detected
🟨 Inside Bar — Current candle’s range is completely inside the previous candle’s range.
Often signals price contraction before a breakout.
💗 Outside Bar — Current candle’s high and low exceed the previous candle’s range.
Indicates volatility expansion and possible trend continuation.
🟩 Bullish Harami — A small bullish candle within the body of a prior bearish candle.
Suggests potential reversal to the upside.
🟥 Bearish Harami — A small bearish candle within the body of a prior bullish candle.
Suggests potential reversal to the downside.
⚙️ Features
Customizable colors for each pattern type.
Simple overlay visualization — no shapes, no labels, just colored candles.
Harami colors automatically override Inside/Outside colors when both occur on the same bar.
Lightweight logic for smooth performance on any timeframe or symbol.
💡 How to Use
Apply the indicator to your chart.
Configure colors in the settings panel if desired.
Watch for highlighted candles:
Inside Bars often precede breakouts.
Harami patterns can mark reversal zones.
Combine with trend tools (like moving averages) to confirm setups.
⚠️ Note
This indicator is for visual pattern detection and educational use only.
Always combine candlestick signals with broader technical or market context before trading decisions.
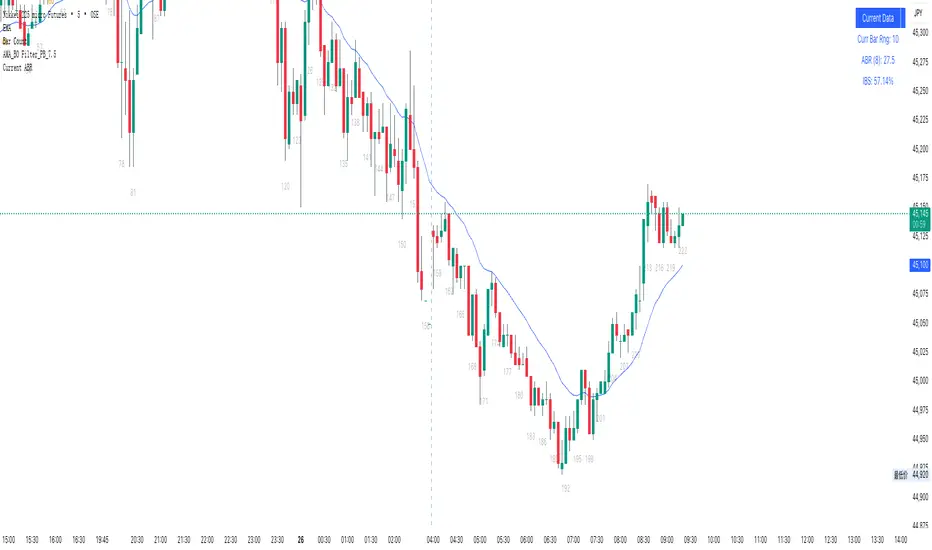
55 ABR Currentcurrent bar range
abr
previous_bar ibs
当前K线范围 (Curr Bar Rng):显示当前正在形成的K线的价格幅度(最高价-最低价)
平均K线范围 (ABR):计算指定周期内(默认8根K线)的平均K线范围,这个数值可以帮助交易者了解市场的平均波动性
内部K线强度 (IBS):显示前一根已完成K线的内部强度百分比
This Pine Script indicator creates a real-time information panel in the top-right corner of TradingView charts, displaying three key trading metrics:Core Features:
Current Bar Range: Shows the price range (high - low) of the currently forming candlestick, providing immediate awareness of intraday volatility.
Average Bar Range (ABR): Calculates the mean candlestick range over a specified lookback period (default: 8 bars). This metric helps traders assess whether current market volatility is above or below recent norms.
Internal Bar Strength (IBS): Displays the previous completed bar's internal strength as a percentage,
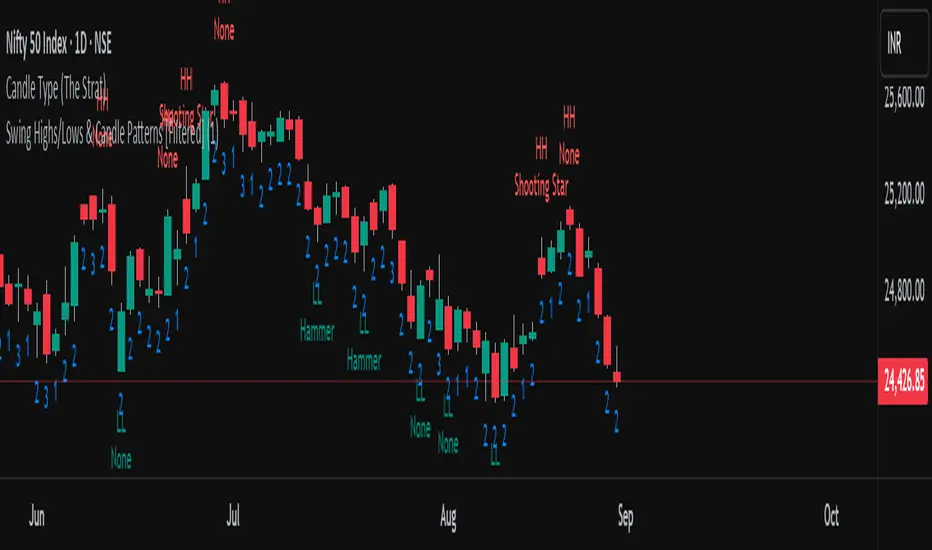
Swing Highs/Lows & Candle Patterns[LuxAlgo] [Filtered]Swing Highs/Lows & Candle Patterns - Tweaked Version
This indicator is a customized and enhanced version of LuxAlgo’s original Swing Highs/Lows & Candle Patterns indicator. It identifies and labels critical swing high and swing low points to help visualize market structure, alongside detecting key reversal candlestick patterns such as Hammer, Inverted Hammer, Bullish Engulfing, Hanging Man, Shooting Star, and Bearish Engulfing.
With added options to selectively display only Lower Highs (LH) and Higher Lows (HL), this tweaked version offers greater flexibility for traders focusing on specific market dynamics. Users can also customize the lookback length and label styling to fit their preferences.
Credit to LuxAlgo for the original concept and foundation of this powerful tool, which this script builds upon to support more tailored technical analysis. Ideal for swing traders and technical analysts seeking improved entry and exit signals through a combination of price swings and candlestick pattern recognition.
Inside Bar Candle Color with Bullish/Bearish AlertTitle:
Inside Bar Candle Color with Bullish/Bearish Alerts
Description:
This indicator highlights Inside Bars based on candlestick structure and colors them according to bullish or bearish sentiment. It also includes real-time alerts for both bullish and bearish inside bars.
Key Features:
Detects inside bars (including equal highs/lows)
Bullish inside bars are highlighted in green (customizable)
Bearish inside bars are highlighted in red (customizable)
Alerts included:
Bullish inside bar alert
Bearish inside bar alert
Works on all timeframes and instruments
What is an Inside Bar?
An inside bar is a candlestick whose high and low are completely within the range of the previous candle. It often signals market consolidation or a potential breakout setup.
How to Use:
Use inside bars as part of a breakout or continuation strategy
Combine with trend direction, support/resistance, or volume for confirmation
Customize the candle colors to match your chart theme
Note: This indicator does not provide buy or sell signals. It's a visual tool designed to support price action traders in identifying low-volatility zones and potential setups.

Doji Signals with Wick ColorThis indicator identifies Doji candlestick patterns on the chart and highlights both the candle body and wicks in yellow for better visibility.
A Doji is defined as a candle where the body size is relatively small compared to the full range (high - low), indicating market indecision. You can adjust the maximum allowed body size as a percentage of the total candle range using the "Doji's Max Body Size" input.
The indicator works by:
Calculating the body size (abs(open - close))
Comparing it to a threshold (precision * (high - low))
Highlighting candles that meet the condition as Doji, coloring both the body and wick in yellow
This visual aid helps traders quickly spot potential reversal or pause areas in price action based on candlestick psychology.
