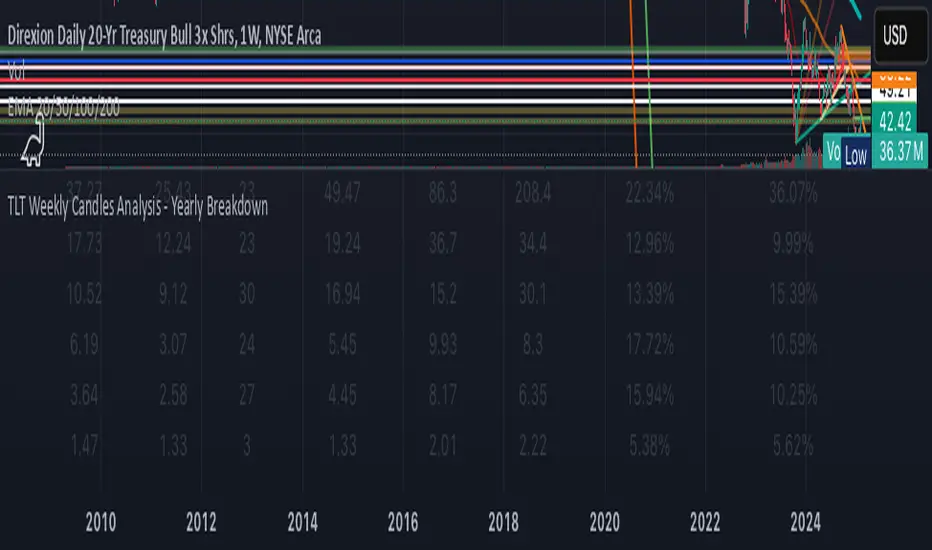
KAI QUANTUM Candles Analysis - Yearly BreakdownThe "KAI QUANTUM Analysis – Yearly Breakdown" indicator offers a comprehensive, year-by-year examination of candlestick behavior, enabling traders and analysts to gauge market dynamics over extended periods. Key features include:
Yearly Aggregation:
The indicator groups candlestick data by year, providing a clear snapshot of market behavior for each period.
Dual-Color Analysis:
It categorizes candles as bullish (green) or bearish (red) and computes statistics separately for each, allowing you to assess both upward and downward market trends.
Average Body Size & Candle Count:
For each year, the indicator calculates the average body size of green and red candles and tracks the total number of each, helping you understand overall market volatility and momentum.
Top 10 Candle Analysis:
It identifies the ten largest candles (by body size) in each year and computes their average size, offering insight into the most significant market moves during that period.
Largest Candle Metrics:
The indicator determines the absolute size of the largest green and red candles in each year.
Percentage Move Calculation:
In addition to absolute values, it computes the largest move as a percentage of the open price for both green and red candles. This allows you to see not only which year experienced the biggest moves but also how those moves compare relative to the opening price.
Clear Tabular Display:
All the computed statistics are organized in an on-chart table, making it easy to compare yearly trends at a glance.
Ideal for daily and higher timeframes, this indicator is a valuable tool for long-term market analysis, enabling you to identify trends, assess volatility, and make informed trading decisions based on historical market behavior.
Search in scripts for "Candlestick"
EMA with Bar Count
---
### **Key Features and Functionalities**
#### 1. **Multi-Timeframe Exponential Moving Averages (EMA)**
- The script calculates and plots EMAs for various timeframes (e.g., 1 minute, 5 minutes, 60 minutes, daily, and custom intervals).
- Users can customize the length and resolution of each EMA using inputs.
- Different colors are assigned to each EMA for easy identification on the chart.
#### 2. **Background Coloring**
- Optional background coloring (`bgcolor`) indicates whether the current price is above or below the 1-hour 20 EMA.
- Green indicates the price is above, and red indicates the price is below the EMA.
#### 3. **Bar Count Labeling**
- The script tracks bar counts and displays labels at specific intervals (e.g., every 3 bars).
- Label size and text color can be customized through user inputs.
#### 4. **Inside and Outside Bar Detection**
- Detects and highlights "Inside Bars" and "Outside Bars" on the chart.
- **Inside Bar**: The current bar's high and low are within the previous bar's range.
- **Outside Bar**: The current bar's range exceeds the previous bar's range.
- These patterns are marked with shapes for visual identification.
#### 5. **Bullish/Bearish Candle Streaks**
- Identifies and marks streaks of three consecutive bullish or bearish candles.
- **Bullish Streaks**: Marked with green shapes above the bar.
- **Bearish Streaks**: Marked with red shapes above the bar.
#### 6. **Time-Based Marking**
- The script includes an option to highlight specific time intervals (e.g., 7:30 AM) with a colored vertical line or background shading.
- Configurable time inputs allow flexibility.
#### 7. **Micro Gap Detection**
- Highlights gaps between the opening price of the current bar and the closing price of the previous bar.
- Blue shapes indicate bullish gaps.
- Purple shapes indicate bearish gaps.
#### 8. **TR (Trading Range) Detection**
- Identifies bars with significant overlap based on a user-defined threshold.
- Displays "TR" labels when overlap conditions are met.
#### 9. **Bar Coloring**
- Optionally colors bars based on specific conditions:
- Green: Bullish breakout (high and low higher than the previous bar, closing above the midpoint).
- Red: Bearish breakout (high and low lower than the previous bar, closing below the midpoint).
#### 10. **50% Midpoint Line**
- Displays a horizontal line at the 50% midpoint of the bar's range, customizable for the current or last bar only.
#### 11. **Pattern Detection**
- Recognizes specific candlestick patterns (e.g., IOI, OII, IOO).
- Provides alerts for detected patterns or predefined thresholds.
#### 12. **Alerts**
- Configurable alerts for:
- Specific patterns (e.g., IOI, OII, IOO).
- Bar range exceeding a user-defined threshold.
- Bullish or bearish streaks.
#### 13. **Gap Detector**
- Identifies gaps between bars and marks them with shaded boxes.
- Bullish gaps are shaded green, while bearish gaps are shaded red.
#### 14. **Advanced Customization**
- Extensive user inputs allow traders to tailor the indicator to their trading style.
- Includes support for various levels of detail (e.g., debug mode, label visibility, etc.).
#### 15. **ZigZag and Wedge Patterns**
- Optional zigzag lines to connect swing highs and lows.
- Detects wedge patterns using customizable settings for pivot points and angle differences.
---
### **Use Case Scenarios**
1. **Trend Identification**: Use multi-timeframe EMAs to confirm overall market direction.
2. **Range Trading**: Trade within ranges using detected inside and outside bars as key levels.
3. **Breakout Trading**: Use patterns like IOI and OII to anticipate breakouts.
4. **Scalping**: Exploit bullish and bearish streaks or micro gaps for quick trades.
5. **Pattern-Based Alerts**: Set up alerts for specific market conditions or candlestick patterns.
### **Why This Indicator Is Useful**
- Combines multiple trading tools into a single, customizable script.
- Saves time by automating complex calculations and pattern detections.
- Improves decision-making with clear visual cues and configurable alerts.
Let me know if you'd like any additional explanations or adjustments!

Sunil's Three 3 Inside Up Down IndicatorThree candlestick Pattern Bullish Reversal- Three Inside Up => Formed by a Bullish Harami pattern followed by a confirmation candle closing above the previous candle.
Three candlestick Pattern Bearish Reversal- Three Inside Down => Formed by a Bearish Harami pattern followed by a confirmation candle closing below the previous candle.

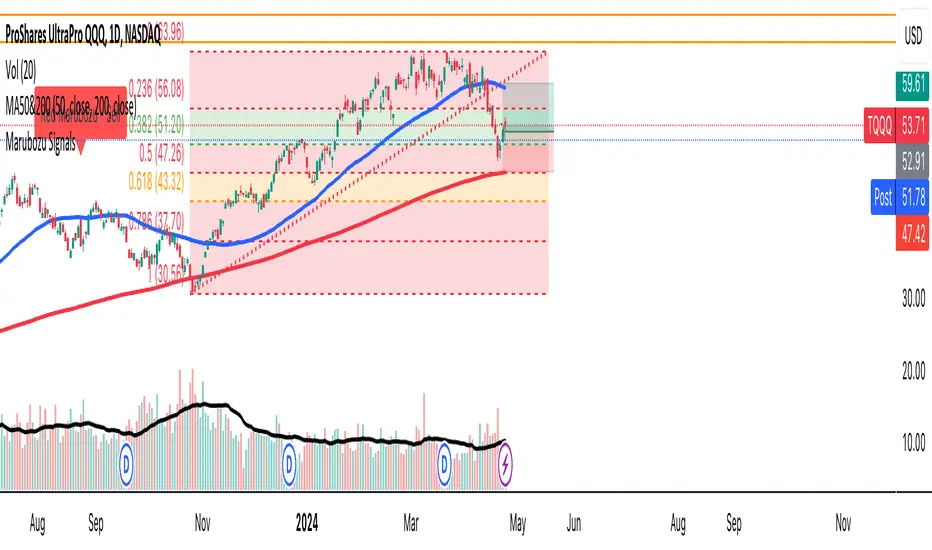
Marubozu SignalsThis Pine Script code is designed to identify and plot Marubozu candlestick patterns on a trading chart. Marubozu candles are characterized by having very small or non-existent wicks (shadows) and a large body, indicating strong buying or selling pressure.
The script first calculates the body size and wick size for both red (bearish) and green (bullish) Marubozu candles. It then defines thresholds for both body and wick sizes based on a percentage of the body size. For example, a red Marubozu candle is identified if its body size is at least 90% of the calculated threshold, and both upper and lower wick sizes are smaller than 5% of the body size.
Similarly, green Marubozu candles are identified using the same logic. If a Marubozu candle of either color is detected, a corresponding label is plotted on the chart indicating the occurrence of the pattern. A "Sell" label is placed above the candle for red Marubozu patterns, while a "Buy" label is placed below the candle for green Marubozu patterns.
This script provides visual cues to traders, helping them quickly identify potential buying or selling opportunities based on Marubozu candlestick patterns. Traders can use these signals as part of their technical analysis to make informed trading decisions.
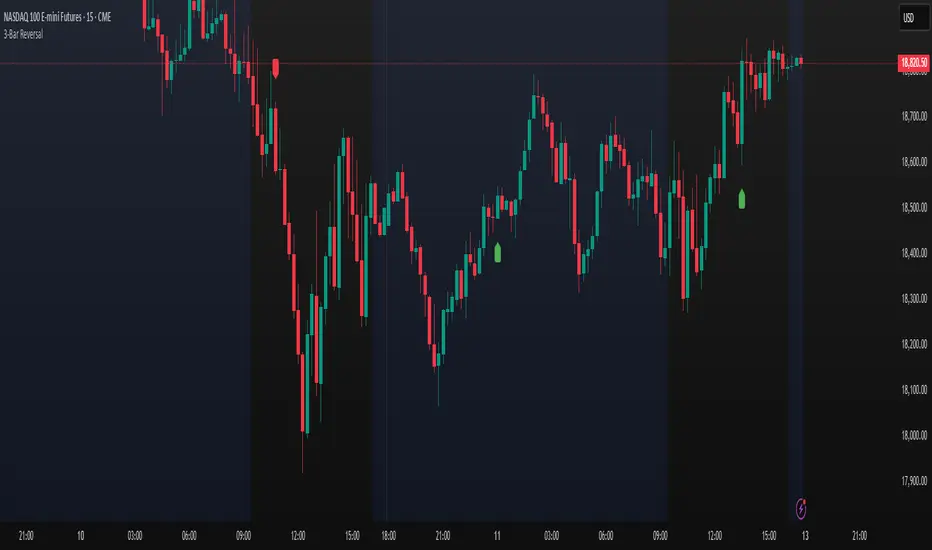
3-Bar ReversalAbout the Script
This script automatically detects and plots a signal when a Three-Bar Reversal pattern appears on the chart, helping traders identify potential trend reversals with ease.
How to Use the Script
1) Add the script to your chart.
2) Customize the visual appearance to match your preferences.
3) Click "OK" to apply the changes.
Once configured, the script will highlight valid Three-Bar Reversal patterns when they form.
How the Script Works
The Three-Bar Reversal pattern consists of three consecutive candlesticks, each playing a crucial role in identifying market shifts:
First Bar: Represents the existing trend.
In a bullish reversal, the first bar is typically bearish (downward).
In a bearish reversal, the first bar is typically bullish (upward).
Second Bar: Indicates indecision or trend exhaustion.
This bar often has a smaller body (such as a doji or spinning top), showing weakening momentum.
It may also feature wicks on both sides, reflecting market uncertainty.
Third Bar: Confirms the reversal.
In a bullish reversal, the third bar closes above the high of the first bar, signaling a potential upward move.
In a bearish reversal, the third bar closes below the low of the first bar, signaling a potential downward trend.
Once the pattern is confirmed, a marker will appear below the third bar, helping traders quickly spot opportunities.
Heikin Ashi Bar ColourHeikin Ashi colour imposed on any chart type (e.g Candlesticks, Bar chart, line chart, etc..).
Allowing chartists to observe the Heikin Ashi momentum change with existing chart type intact.

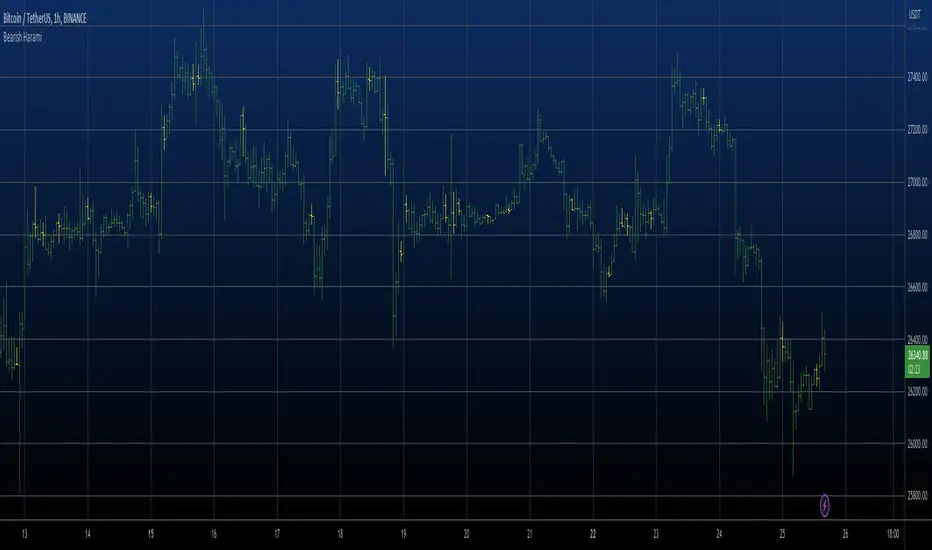
Bearish Harami automatic finding scriptHi
Let me introduce my Bearish Harami automatic finding script.
This is a bearish reversal pattern formed by two candlesticks in which a short
real body is contained within the prior session's long real body. Usually the
second real body is the opposite color of the first real body. The Harami pattern
is the reverse of the Engulfing pattern.
This pattern marked as yellow.
Key Support and ResistanceKEY SUPPORT AND RESISTANCE - USER GUIDE
========================================
OVERVIEW
This indicator automatically identifies and displays key support and resistance levels based on swing highs and swing lows. It uses pivot point detection to mark significant price levels where the market has previously shown reactions, helping traders identify potential entry/exit points and key decision zones.
KEY FEATURES
• Automatic Level Detection: Identifies swing highs (resistance) and swing lows (support) using pivot point analysis
• Dynamic Line Management: Displays only recent levels within a specified lookback period to keep charts clean
• Auto-Extending Lines: Projects support/resistance levels forward to anticipate future price interactions
• Color-Coded Levels: Red lines for resistance, green lines for support for easy visual identification
========================================
PARAMETERS
========================================
Left Bars (Default: 10)
• Minimum: 5 bars
• Number of bars to the left of the pivot point
• Higher values = more significant levels but fewer signals
• Lower values = more sensitive detection but may include minor swings
Right Bars (Default: 10)
• Minimum: 5 bars
• Number of bars to the right of the pivot point
• Must be confirmed by price action before the level is drawn
• Balances between confirmation delay and signal accuracy
Show Last N Bars (Default: 200)
• Minimum: 10 bars
• Only displays support/resistance levels detected within the most recent N bars
• Keeps your chart clean by removing outdated levels
• Adjust based on your trading timeframe and style
Line Extension Length (Default: 48)
• Minimum: 1 bar
• How many bars forward the support/resistance lines extend
• Helps visualize potential future price interactions
• Longer extensions useful for swing trading, shorter for day trading
========================================
HOW TO USE
========================================
FOR SWING TRADERS
1. Use default settings (10/10) or increase to 15/15 for more significant levels
2. Set "Show Last N Bars" to 300-500 to capture longer-term levels
3. Look for price reactions when approaching these levels
4. Combine with volume analysis for confirmation
FOR DAY TRADERS
1. Consider reducing Left/Right Bars to 7-8 for more frequent signals
2. Set "Show Last N Bars" to 100-150 to focus on recent action
3. Reduce "Line Extension Length" to 20-30 bars
4. Watch for intraday bounces or breakouts at these levels
TRADING STRATEGIES
Bounce Trading (Mean Reversion)
• Enter long when price approaches green support lines
• Enter short when price approaches red resistance lines
• Use stop loss just beyond the support/resistance level
• Best in ranging or consolidating markets
Breakout Trading (Trend Following)
• Wait for price to break through resistance (bullish) or support (bearish)
• Confirm with increased volume
• Previous resistance becomes new support (and vice versa)
• Best in trending markets
Multi-Timeframe Analysis
• Check higher timeframe levels for major support/resistance zones
• Use lower timeframe levels for precise entry/exit timing
• Confluence of multiple timeframe levels creates strong zones
========================================
IMPORTANT NOTES
========================================
Line Confirmation Delay
• Lines appear with a delay equal to "Right Bars" parameter
• This delay ensures the pivot point is confirmed
• Real-time level detection requires price action confirmation
Chart Clarity
• Maximum 500 lines can be displayed (TradingView limitation)
• Adjust "Show Last N Bars" if chart becomes too cluttered
• Old lines automatically delete when outside the lookback period
False Signals
• Not all support/resistance levels will hold
• Use additional confirmation (volume, candlestick patterns, other indicators)
• Markets can break through levels, especially during high-impact news
BEST PRACTICES
1. Combine with Other Analysis: Use alongside trend indicators, volume, and price action patterns
2. Context Matters: Consider overall market trend and structure
3. Risk Management: Always use stop losses; don't rely solely on S/R levels
4. Market Conditions: More effective in liquid, actively traded markets
5. Backtesting: Test settings on your specific instrument and timeframe before live trading
TROUBLESHOOTING
Too Many Lines?
• Increase "Left Bars" and "Right Bars" values
• Decrease "Show Last N Bars" value
Too Few Lines?
• Decrease "Left Bars" and "Right Bars" values
• Increase "Show Last N Bars" value
Lines Not Appearing?
• Ensure sufficient price data is loaded on your chart
• Check that "Right Bars" have passed since the last swing point
• Verify indicator is properly loaded (refresh if needed)
TECHNICAL DETAILS
• Uses ta.pivothigh() and ta.pivotlow() functions for level detection
• Implements array-based line management for efficient rendering
• Automatic cleanup of outdated lines to maintain performance
• Overlay indicator - displays directly on price chart
Disclaimer: This indicator is for educational and informational purposes only. It does not constitute financial advice. Always conduct your own research and risk assessment before making trading decisions.
========================================
中文使用指南
========================================
概述
本指標自動識別並顯示基於波段高點和低點的關鍵支撐阻力位。使用樞軸點檢測標記市場先前反應的重要價格水平,幫助交易者識別潛在的進出場點和關鍵決策區域。
主要功能
• 自動水平檢測:使用樞軸點分析識別波段高點(阻力)和波段低點(支撐)
• 動態線條管理:僅顯示指定回看期內的近期水平,保持圖表清晰
• 自動延伸線條:將支撐阻力水平向前投影,預測未來價格互動
• 顏色編碼:紅線表示阻力,綠線表示支撐,便於視覺識別
========================================
參數說明
========================================
左側K棒數(預設:10)
• 最小值:5根K棒
• 樞軸點左側的K棒數量
• 數值越高 = 水平越重要但訊號越少
• 數值越低 = 檢測更敏感但可能包含次要波動
右側K棒數(預設:10)
• 最小值:5根K棒
• 樞軸點右側的K棒數量
• 必須經過價格行為確認後才繪製水平
• 在確認延遲和訊號準確性之間取得平衡
顯示最近N根K棒內的點(預設:200)
• 最小值:10根K棒
• 僅顯示最近N根K棒內檢測到的支撐阻力水平
• 透過移除過時水平保持圖表清晰
• 根據您的交易時間框架和風格調整
線條延伸長度(預設:48)
• 最小值:1根K棒
• 支撐阻力線向前延伸的K棒數
• 幫助視覺化潛在的未來價格互動
• 較長延伸適合波段交易,較短適合當沖交易
========================================
使用方法
========================================
波段交易者
1. 使用預設設定(10/10)或增加至15/15以獲得更重要的水平
2. 將「顯示最近N根K棒」設為300-500以捕捉長期水平
3. 觀察價格接近這些水平時的反應
4. 結合成交量分析進行確認
當沖交易者
1. 考慮將左右側K棒減少至7-8以獲得更頻繁的訊號
2. 將「顯示最近N根K棒」設為100-150以專注於近期行情
3. 將「線條延伸長度」減少至20-30根K棒
4. 觀察日內在這些水平的反彈或突破
交易策略
反彈交易(均值回歸)
• 當價格接近綠色支撐線時做多
• 當價格接近紅色阻力線時做空
• 在支撐阻力水平之外設置止損
• 在區間或盤整市場中效果最佳
突破交易(趨勢跟隨)
• 等待價格突破阻力(看漲)或支撐(看跌)
• 以增加的成交量確認
• 先前的阻力成為新的支撐(反之亦然)
• 在趨勢市場中效果最佳
多時間框架分析
• 檢查更高時間框架的主要支撐阻力區域
• 使用較低時間框架進行精確的進出場時機
• 多個時間框架水平的匯合創造強大區域
========================================
重要注意事項
========================================
線條確認延遲
• 線條出現時會有等於「右側K棒數」參數的延遲
• 此延遲確保樞軸點被確認
• 實時水平檢測需要價格行為確認
圖表清晰度
• 最多可顯示500條線(TradingView限制)
• 如果圖表變得太雜亂,請調整「顯示最近N根K棒」
• 超出回看期的舊線會自動刪除
假訊號
• 並非所有支撐阻力水平都會守住
• 使用額外確認(成交量、K棒型態、其他指標)
• 市場可能突破水平,特別是在重大新聞期間
最佳實踐
1. 結合其他分析:與趨勢指標、成交量和價格行為型態一起使用
2. 背景很重要:考慮整體市場趨勢和結構
3. 風險管理:始終使用止損;不要僅依賴支撐阻力水平
4. 市場條件:在流動性高、活躍交易的市場中更有效
5. 回測:在實盤交易前,在您的特定商品和時間框架上測試設定
故障排除
線條太多?
• 增加「左側K棒數」和「右側K棒數」數值
• 減少「顯示最近N根K棒」數值
線條太少?
• 減少「左側K棒數」和「右側K棒數」數值
• 增加「顯示最近N根K棒」數值
線條未出現?
• 確保圖表上載入了足夠的價格數據
• 檢查自上次波動點以來是否已過「右側K棒數」
• 驗證指標是否正確載入(如需要請刷新)
技術細節
• 使用 ta.pivothigh() 和 ta.pivotlow() 函數進行水平檢測
• 實施基於陣列的線條管理以實現高效渲染
• 自動清理過時線條以保持性能
• 疊加指標 - 直接顯示在價格圖表上
免責聲明:本指標僅供教育和資訊目的。不構成財務建議。在做出交易決策前,請務必進行自己的研究和風險評估。

Jiangnan_BTC_Compare将个别虚拟币走势与BTC的走势进行比较。打开个别币的K线,添加在下方的panel里添加本指标即可。Compare the price movement of individual cryptocurrencies with that of BTC.
Open the candlestick chart of the selected coin and simply add this indicator in the lower panel.

Perfect Opens Perfect BoxesThis approach combines two methods of chart denoising:
1. The underlying chart uses the previous close as the open price for the next candle, which makes candlestick patterns easier to read.
2. The overlay reduces the visual noise of a line chart by representing the price range over a given interval as a box; the “wicks” on this chart are purely cosmetic, indicating that closing prices lay outside the range of the previous interval.

EMCT - Explosion Matrix / Candle TechScript Purpose
The "Explosion Matrix • Micro-Scalp Edition" is a highly aggressive 1-minute scalping indicator designed specifically for Bitcoin (and other crypto) trading. It detects three types of high-probability price action patterns in real time: reversal patterns (trend changes), continuation patterns (trend follow-through), and micro patterns (tiny scalp setups), with a special focus on visually highlighting strong rejection candles like Shooting Stars and Hammers.
Core Detection Logic
The script identifies classic and enhanced candlestick patterns (Shooting Star, Hammer, and large-body "John Wick" candles) by analyzing wick-to-body ratios, close position within the range, and candle size relative to ATR. It classifies each pattern as either reversal (against the trend) or continuation (with the trend) based on EMA alignment (8-21-50) and price position.
Trend & Momentum Context
Uses a triple EMA system (fast=8, mid=21, slow=50) to determine strong/weak trends. Momentum is checked via recent price direction. This context decides whether a rejection candle acts as reversal (at exhaustion) or continuation (pullback in strong trend).
Optional Confirmation Filters
Cumulative Volume Delta (CVD) Z-Score: measures aggressive buying/selling pressure; can be required for signals
Volume surge detection: filters for candles with significantly above-average volume
Scoring & Visual System
Each detected pattern receives a score (2–9+) based on strength, reversal/continuation type, and confirmation filters. Higher scores = brighter, larger, more opaque colored frames drawn around the candle(s). Frames are adaptive in size: largest for reversals, medium for continuations, smallest for micro signals.
Visual Output
Draws colored rectangular "explosion frames" directly on the chart around triggering candles. Labels show direction and type (REV↑, CON↓, ↑/↓) with optional score. Intensity-based coloring ranges from mild to extreme bull/bear.
Additional Features
Includes a separate CVD Z-Score subplot with threshold lines, customizable visual styles (Adaptive/Uniform/Minimal), and built-in alerts that fire separately for reversal and continuation patterns. Optimized for maximum detection frequency in fast-moving 1-minute crypto markets

chanlun缠论 - 笔与中枢Overview
The Chanlun (缠论) Strokes & Central Zones indicator is an advanced technical analysis tool based on Chinese Chan Theory (Chanlun Theory). It automatically identifies market structure through "strokes" (笔) and "central hubs" (中枢), providing traders with a systematic framework for understanding price movements, trend structure, and potential reversal zones.
Theoretical Foundation
Chan Theory is a sophisticated price action methodology that breaks down market movements into hierarchical structures:
Local Extremes: Swing highs and lows identified through lookback periods
Strokes (笔): Valid price movements between opposite extremes that meet specific criteria
Central Hubs (中枢): Consolidation zones formed by overlapping strokes, representing key support/resistance areas
Key Components
1. Local Extreme Detection
Identifies swing highs and lows using a configurable lookback period (default: 5 bars)
Only considers extremes within the specified calculation range
Forms the foundation for stroke construction
2. Stroke (笔) Identification
The indicator applies a multi-stage filtering process to identify valid strokes:
Stage 1 - Extreme Consolidation:
Merges consecutive extremes of the same type (high or low)
Keeps only the most extreme value (highest high or lowest low)
Stage 2 - Stroke Validation:
Ensures minimum bar gap between strokes (default: 4 bars)
Alternative validation: 2+ bars with >1% price change
Eliminates noise and insignificant price movements
Color Coding:
White Lines: Regular up/down strokes
Yellow Lines: Strokes that form part of a central hub
Customizable width and colors for different stroke types
3. Central Hub (中枢) Formation
A central hub forms when at least 3 consecutive strokes have overlapping price ranges:
Formation Rules:
Stroke 1:
Stroke 2:
Stroke 3:
Hub Upper = MIN(High1, High2, High3)
Hub Lower = MAX(Low1, Low2, Low3)
Valid if: Hub Upper > Hub Lower
Hub Extension:
Subsequent strokes that overlap with the hub extend it
Hub ends when a stroke no longer overlaps
Creates rectangular zones on the chart
Visual Representation:
Green rectangular boxes: Mark the time and price range of each central hub
Dashed extension lines: Show the latest hub boundaries extending to the right
Price labels on axis: Display exact hub upper and lower boundary values
4. Extreme Point Markers (Optional)
Red markers for tops (▼)
Green markers for bottoms (▲)
Marks every validated stroke extreme point
Useful for detailed structure analysis
5. Information Table (Optional)
Displays real-time statistics:
Symbol name
Current timeframe
Lookback period setting
Minimum gap setting
Total stroke count
Parameter Settings
Performance Settings
Max Bars to Calculate (3600): Limits historical calculation to improve performance
Local Extreme Lookback Period (5): Bars used to identify swing highs/lows
Min Gap Bars (4): Minimum bars required between valid strokes
Display Settings
Show Strokes: Toggle stroke line visibility
Show Central Hub: Toggle hub box visibility
Show Hub Extension Lines: Toggle dashed boundary lines
Show Extreme Point Marks: Toggle top/bottom markers
Show Info Table: Toggle statistics table
Color Settings
Full customization of:
Up/down stroke colors and widths
Hub stroke colors and widths
Hub border and background colors
Extension line colors
Trading Applications
Trend Structure Analysis
Uptrend: Series of higher highs and higher lows connected by strokes
Downtrend: Series of lower highs and lower lows connected by strokes
Consolidation: Formation of central hubs indicating range-bound movement
Support and Resistance Identification
Central Hub Zones: Act as strong support/resistance areas
Hub Upper Boundary: Resistance level in consolidation, support after breakout
Hub Lower Boundary: Support level in consolidation, resistance after breakdown
Price tends to react at these levels due to market structure memory
Breakout Trading
Bullish Breakout: Price closes above hub upper boundary
Previous resistance becomes support
Entry on retest of upper boundary
Stop loss below hub zone
Bearish Breakdown: Price closes below hub lower boundary
Previous support becomes resistance
Entry on retest of lower boundary
Stop loss above hub zone
Reversal Detection
Hub Formation After Trend: Signals potential trend exhaustion
Multiple Hub Levels: Create probability zones for reversals
Stroke Count: Excessive strokes within hub suggest weakening momentum
Position Management
Use hub boundaries for stop loss placement
Scale out positions at hub edges
Re-enter on retests of broken hub levels
Interpretation Guide
Strong Trending Market
Long, clear strokes with minimal overlap
Few or no central hubs forming
Strokes consistently in same direction
Wide spacing between extremes
Consolidating Market
Multiple central hubs forming
Short, overlapping strokes
Yellow hub strokes dominate the chart
Narrow price range
Trend Transition
Hub formation after extended trend
Stroke direction changes frequently
Hub boundaries being tested repeatedly
Potential reversal zone
Advanced Usage Techniques
Multi-Timeframe Analysis
Higher Timeframe: Identify major hub zones for overall market structure
Lower Timeframe: Find precise entry points within larger structure
Alignment: Trade when lower timeframe strokes align with higher timeframe hub breaks
Hub Quality Assessment
Wide Hubs: Strong consolidation, higher probability support/resistance
Narrow Hubs: Weak consolidation, may break easily
Extended Hubs: More strokes = stronger zone
Isolated Hubs: Single hub = potential pivot point
Stroke Analysis
Stroke Length: Longer strokes = stronger momentum
Stroke Speed: Fewer bars per stroke = explosive moves
Stroke Clustering: Many short strokes = indecision
Best Practices
Parameter Optimization
Adjust lookback period based on timeframe and volatility
Lower periods (3-4): More strokes, more noise, faster signals
Higher periods (7-10): Fewer strokes, cleaner structure, slower signals
Confirmation Strategy
Don't trade on strokes alone
Combine with volume analysis
Use candlestick patterns at hub boundaries
Wait for breakout confirmation
Risk Management
Always place stops outside hub zones
Use hub width to size positions (wider hub = smaller position)
Exit if price re-enters broken hub from wrong direction
Avoid Common Pitfalls
Don't trade within central hubs (range-bound, unpredictable)
Don't ignore higher timeframe hub structures
Don't chase strokes after they've extended far from hub
Don't trust single-stroke hubs (need 3+ strokes for validity)
Performance Considerations
Max Bars Limit: Set to 3600 to balance detail with performance
Safe Distance Calculation: Only draws objects within 2000 bars of current price
Object Cleanup: Automatically removes old drawing objects to prevent memory issues
Efficient Arrays: Uses indexed arrays for fast lookup and processing
Ideal Market Conditions
Best Performance:
Liquid markets with clear structure (major forex pairs, indices, large-cap stocks)
Trending markets with periodic consolidations
Medium to high volatility for clear stroke formation
Less Effective:
Extremely choppy, directionless markets
Very low timeframes (< 5 minutes) with excessive noise
Illiquid instruments with erratic price action
Integration with Other Indicators
Complementary Tools:
Volume Profile: Confirm hub significance with volume nodes
Moving Averages: Use for trend bias within stroke structure
RSI/MACD: Momentum confirmation at hub boundaries
Fibonacci Retracements: Hub levels often align with Fib levels
Advantages
✓ Objective Structure: Removes subjectivity from market structure analysis
✓ Visual Clarity: Color-coded strokes and clear hub zones
✓ Multi-Timeframe Applicable: Works on all timeframes from minutes to months
✓ Complete Framework: Provides entry, exit, and risk management levels
✓ Theoretical Foundation: Based on proven Chan Theory methodology
✓ Customizable: Extensive parameter and visual customization options
Limitations
⚠ Learning Curve: Requires understanding of Chan Theory principles
⚠ Lag Factor: Strokes confirm after price movements complete
⚠ Parameter Sensitivity: Different settings produce significantly different results
⚠ Choppy Market Struggles: Can generate excessive hubs in range-bound conditions
⚠ Computation Intensive: May slow down on lower-end systems with max bars setting
Optimization Tips
Timeframe Selection
Scalping: 5-15 minute charts, lookback period 3-4
Day Trading: 15-60 minute charts, lookback period 4-5
Swing Trading: 4-hour to daily charts, lookback period 5-7
Position Trading: Daily to weekly charts, lookback period 7-10
Volatility Adjustment
High volatility: Increase minimum gap bars to reduce noise
Low volatility: Decrease lookback period to capture smaller moves
Visual Optimization
Use contrasting colors for different market conditions
Adjust line widths based on chart resolution
Toggle markers off for cleaner appearance once familiar with structure
Quick Start Guide
For Beginners:
Start with default settings (5 lookback, 4 min gap)
Enable "Show Info Table" to track stroke count
Focus on identifying clear hub formations
Practice waiting for price to break hub boundaries before trading
For Advanced Users:
Optimize lookback and gap parameters for your instrument
Use hub strokes (yellow) to identify key consolidation zones
Combine with multiple timeframes for confirmation
Develop entry rules based on hub breakout/retest patterns
This indicator provides a complete structural framework for understanding market behavior through the lens of Chan Theory, offering traders a systematic approach to identifying high-probability trading opportunities.

Candle Countdown TimerThis Pine Script indicator displays a real-time countdown timer for the current candlestick on a TradingView chart. It helps traders monitor how much time remains before the current candle closes, which is especially useful for timing entries or exits in fast-moving markets.
🔧 Key Features:
• Time Calculation: Computes the remaining time in the current bar
• Dynamic Label Display: Shows the countdown as a label beside the active candle, updating every tick.

Candle Engulfing DetectorEngulfing Candle:
An engulfing candle is a candlestick pattern that signals a potential reversal in the market. It occurs when the body of the current candle completely “engulfs” the body of the previous candle, ignoring the wicks. This pattern indicates a strong shift in momentum.
Bullish Engulfing | Bull.E:
The current candle is bullish (close > open) and fully engulfs the body of the previous bearish candle (open > close).
Signals potential upward reversal.
Stronger if formed near support levels or after a prolonged downtrend.
Bearish Engulfing | Bear.E:
The current candle is bearish (close < open) and fully engulfs the body of the previous bullish candle (close > open).
Signals potential downward reversal.
Stronger if formed near resistance levels or after a prolonged uptrend.
Feature:
This indicator improves the detection of this pattern by:
Automatically identifying engulfing candles on the chart.
Allowing the user to select how many engulfing patterns should be displayed, which helps avoid chart clutter and focus on recent or relevant signals.

Heikin Ashi BarThis is an indicator that displays the Heikin‑Ashi chart simultaneously with candlestick bars. The Heikin‑Ashis are shown on a bar chart, with bullish bars colored green and bearish bars colored orange.
平均足をロウソク足と同時に表示するインジケータです。平均足はバーチャートで表示されます。陽線は緑色、陰線はオレンジ色で表示されます。

HTF Candle Overlay - PO3HTF Candle Overlay Script Description
This Pine Script indicator creates a visual overlay of higher timeframe (HTF) candles on your chart. It's a useful tool for multi-timeframe analysis that allows you to see higher timeframe price action context directly on your current chart without having to switch between timeframes.
Main Purpose
The primary purpose of this indicator is to display candles from a higher timeframe (like daily or weekly) directly on your lower timeframe chart (like 5-minute or hourly). This provides crucial context about the larger market structure while you're analyzing shorter-term price movements.
Key Features
Higher Timeframe Selection: You can choose any higher timeframe from the available options (1-minute to monthly), allowing you to view price action from any timeframe higher than your current chart.
Customizable Appearance:
Control the number of HTF candles displayed (1-10)
Adjust the spacing between the candles and current price
Modify candle width for better visibility
Customize colors for bullish and bearish candles, wicks, and borders
Real-time Updates: The current (ongoing) HTF candle updates in real-time as new price data comes in, showing you how the higher timeframe candle is developing.
Time Remaining Display: An optional label shows the current HTF period and how much time remains until the candle closes, helping you time your entries and exits.
Visual Warnings: The script warns you if you select a timeframe that matches your current chart timeframe.
How It Works
Data Retrieval: The script fetches both the current developing candle and historical candles from the selected higher timeframe using request.security() calls.
Candle Processing:
It stores candle data (open, high, low, close, and time) in arrays
Handles both the current developing candle and past completed candles
Updates the current candle in real-time as new price data comes in
Visual Rendering:
Draws candle bodies as boxes with appropriate bullish/bearish colors
Creates wicks as lines extending from the candle bodies
Places candles horizontally on your chart with proper spacing
Timing Information:
Calculates and displays the remaining time until the current higher timeframe candle closes
Formats the time remaining in a user-friendly way (days, hours, minutes)
Practical Applications
Context for Trading Decisions: See where price is in relation to higher timeframe support/resistance levels.
Entry and Exit Timing: Time your entries and exits based on higher timeframe candle closings.
Trend Alignment: Ensure your trades align with the higher timeframe trend direction.
Support/Resistance Identification: Easily identify key price levels from higher timeframes.
Candle Pattern Recognition: Spot important higher timeframe candlestick patterns without switching timeframes.
This indicator essentially brings the higher timeframe context directly to your current chart, allowing for more informed trading decisions that consider both short-term and long-term market structures simultaneously.

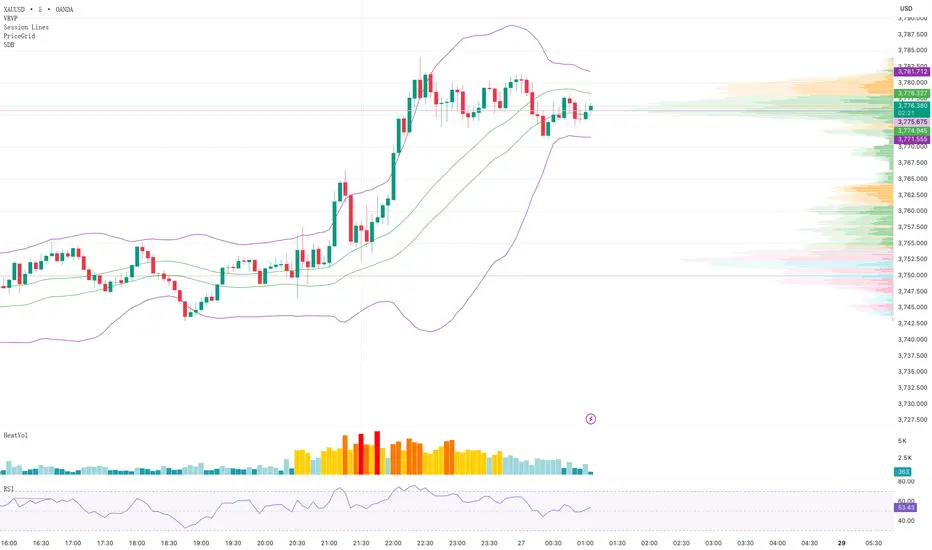
Standard Deviation Bands
## 📊 Standard Deviation Bands (SDB) - Multi-Layer Statistical Channel Indicator
### 🎯 Overview
The Standard Deviation Bands indicator is a sophisticated technical analysis tool based on statistical principles that creates dynamic support and resistance channels by calculating price standard deviations. Unlike traditional Bollinger Bands, this indicator employs a **separate high-low calculation approach**, providing more precise boundary positioning for upper and lower bands.
### ✨ Key Features
**🔹 Separate High-Low Algorithm**
- Upper bands calculated using High price moving averages and standard deviations
- Lower bands calculated using Low price moving averages and standard deviations
- Delivers more accurate price boundary identification
**🔹 Multi-Layer Standard Deviation Levels**
- **±1σ**: Basic standard deviation channel for capturing regular price fluctuations
- **±1σ±2σ**: Dual-layer channels for identifying medium-strength support/resistance
- **±1σ±2σ±3σ**: Triple-layer channels providing complete price volatility analysis framework
**🔹 Flexible Moving Average Options**
- SMA (Simple Moving Average)
- EMA (Exponential Moving Average)
- WMA (Weighted Moving Average)
- RMA (Rolling Moving Average)
- VWMA (Volume Weighted Moving Average)
### 🛠️ Parameter Configuration
| Parameter | Default | Description |
|-----------|---------|-------------|
| Length | 30 | Calculation period length |
| Multiplication Factor | 1.8 | Standard deviation multiplier |
| Top Band Input Data | High | Data source for upper bands |
| Bottom Band Input Data | Low | Data source for lower bands |
| Moving Average Type | SMA | Type of moving average |
| Show Levels | ±1σ | Standard deviation levels to display |
| Show Bands | true | Whether to display channel lines |
| Show Moving Averages | true | Whether to display basis moving averages |
### 📈 Trading Applications
**Support & Resistance Identification**
- Monitor selling opportunities when price approaches upper bands
- Look for buying opportunities when price approaches lower bands
- Multi-layer channels provide different strength support/resistance references
**Trend Strength Assessment**
- Channel width reflects market volatility
- Price breakouts beyond outer channels may signal strong trends
- Price oscillation within inner channels indicates consolidation
**Entry Timing Optimization**
- Combine with candlestick patterns at channel boundaries for reversal signals
- Post-breakout pullbacks provide low-risk entry opportunities
- Enhanced effectiveness when used across multiple timeframes
### 🎨 Visual Design
- Purple 1σ channel lines for clear primary support/resistance identification
- Orange 2σ channel lines marking medium-strength boundaries
- Green 3σ channel lines indicating extreme value boundaries
- Customizable colors and line widths to suit different chart styles
### 💡 Usage Recommendations
1. **Period Selection**: Use 15-30 periods for short-term trading, 50-100 for medium-long term
2. **Multiplier Adjustment**: Increase multiplier for high-volatility instruments, decrease for stable ones
3. **Level Selection**: Beginners should start with ±1σ, advance to multi-layer after gaining experience
4. **Combined Usage**: Enhanced effectiveness when combined with volume, RSI, and other indicators
### 🔧 Technical Advantages
- Built on solid statistical mathematical foundation
- Separate high-low calculations provide more precise boundary positioning
- Multi-layer design adapts to different trading styles
- Flexible parameter adjustment suitable for various market conditions
---
**Applicable Markets**: Stocks, Forex, Cryptocurrencies, Futures, and all financial markets
**Applicable Timeframes**: 1-minute to monthly charts
**Skill Level**: Beginner to advanced traders
*Disclaimer: This indicator is for technical analysis reference only and does not constitute investment advice. Trading involves risks; invest cautiously.*
SmarTrading SmarTrading
This indicator detects and highlights bullish and bearish engulfing candlestick patterns.
It allows switching between the chart’s current timeframe or daily data and visualizes signals with customizable colored boxes.
HTF Candle (gajiev)HTF Candle (gajiev) is a simple and clean TradingView indicator that displays a single candlestick from a higher timeframe (HTF) on the right side of your chart. The candle can update in real time (current forming candle) or show the last completed one, depending on your preference.
Features:
Fixed timeframe options: 1h, 4h, 12h, 1D, 1W, 1M, 6M, 12M.
Customizable body, border, and wick (colors, thickness, visibility).
Option to display either the live candle or the previous closed candle.
Adjustable candle width and right offset for clean placement.
Why it’s useful:
Quickly visualize higher timeframe structure while working on lower charts.
Monitor the real-time development of the current HTF candle.
Use candle highs, lows, and body ranges as reference levels.
--------------------------------------
HTF Candle (gajiev) — простой и наглядный индикатор для TradingView, который отображает одну свечу выбранного старшего таймфрейма (HTF) справа от графика. Свеча обновляется в реальном времени (текущая формирующаяся) или фиксируется на предыдущей завершённой — в зависимости от настроек.
Возможности:
Поддержка фиксированных ТФ: 1ч, 4ч, 12ч, 1д, 1н, 1м, 6м, 12м.
Настройка тела, границ и фитиля свечи (цвета, толщина, отображение).
Отображение текущей или предыдущей свечи.
Настройка ширины свечи и отступа вправо для удобного анализа.
Для чего полезен:
Быстро оценить структуру старшего таймфрейма на младших графиках.
Наблюдать за формированием текущей HTF-свечи онлайн.
Использовать границы и экстремумы свечи как ориентиры для уровней и зон.

نماذج الشموع الإنعكاسيةيكتشف 4 نماذج شموع (C1–C4) ويُلوّن الشموع عند ظهور إشارة.
يرسل تنبيهات جاهزة للشراء/البيع.
لا توجد لِيبِلات مزعجة — تلوين فقط.
كيف أستخدمه؟
اختر الإطار الزمني والسوق.
من الإعدادات، فعِّل/أطفئ النماذج التي تهمك (C1..C4).
(اختياري) فعّل فلاتر الاتجاه والحجم لتقليل الإشارات الضعيفة.
اضبط حساسية الإشارات عبر:
أدنى نسبة جسم الشمعة (bodyPctMin)
تحيز الذيول (tailBiasPct)
قياس القرب (ATR أو نسبة %)
افعل التنبيهات من تبويب Alerts في المنصة.
ألوان الإشارة
شراء: #ddf90a (أصفر مائل للأخضر)
بيع: #05a3ff (أزرق)
الإعدادات (المهم فقط)
C1–C4:
C1 (شراء): استمرارية + بن بار صاعد.
C2 (شراء): هارامي/داخل صاعد (Harami/Inside).
C3 (بيع): استمرارية + شهاب/بن بار هابط.
C4 (بيع): هارامي/داخل هابط.
أدنى نسبة جسم الشمعة (%): ارفعها ⇒ إشارات أقل وأقوى (اقترح 10–20%).
تحيز الذيول (%): يشترط تفوق ذيل على الآخر؛ ارفعها ⇒ انتقائي أكثر (اقترح 20–35%).
قياس القرب من القمم/القيعان:
ATR (مُستحسن): ديناميكي مع التذبذب. استخدم nearK_ATR ≈ 0.20–0.35.
نسبة من المدى: ثابتة. استخدم nearK_Pct ≈ 8–15%.
فلتر الاتجاه: شراء فقط فوق المتوسط وبيع فقط تحته (EMA/SMA، طول 9–20).
فلتر الحجم: يقبل الإشارة فقط إذا كان حجم الشمعة ≥ متوسط حجم محدد (طول 50 شمعه مناسب كبداية).
نصائح سريعة
كثير إشارات؟ ارفع أدنى نسبة الجسم و/أو قلّل nearK_ATR أو nearK_Pct.
سوق هادئ؟ فعِّل فلتر الحجم.
المؤشر يلوّن بعد إغلاق الشمعة لتقليل الضجيج.
ملاحظة لغوية: «Harami» تُنطق هارامي (ومعناها “الحامل”) — ويقابلها غالبًا “شمعة داخلية”.
🇬🇧 Quick User Guide (non-coders)
What it does
Detects 4 candlestick patterns (C1–C4) and colors bars on signals.
Fires ready-made alerts (Buy/Sell).
No labels — coloring only.
How to use
Pick your timeframe/market.
Enable the patterns you care about (C1..C4).
(Optional) Turn on Trend and Volume filters to reduce noise.
Tune sensitivity via:
Min Body % (bodyPctMin)
Tail Bias % (tailBiasPct)
Proximity mode (ATR or % of range)
Create alerts from the platform’s Alerts tab.
Signal colors
Buy: #ddf90a
Sell: #05a3ff
Key settings
Patterns (C1–C4):
C1 (Buy): Continuation + Bullish Pin Bar.
C2 (Buy): Harami/Inside bullish.
C3 (Sell): Continuation + Shooting/Pin bearish.
C4 (Sell): Harami/Inside bearish.
Min Body %: higher ⇒ fewer/stronger signals (suggest 10–20%).
Tail Bias %: require wick dominance; higher ⇒ stricter (suggest 20–35%).
High/Low proximity:
ATR (recommended): dynamic; try nearK_ATR ≈ 0.20–0.35.
% of range: fixed; try nearK_Pct ≈ 8–15%.
Trend filter: Buy above MA, sell below (EMA/SMA, length 9–20).
Volume filter: Accept signals only if volume ≥ its moving average (length ~50).
Quick tips
Too many signals? Increase Min Body % and/or lower nearK_ATR / nearK_Pct.
Quiet markets? Enable Volume filter.
Coloring happens on bar close to keep it cleaner.
Note: “Harami” is the correct term (often equivalent to “Inside” candle).

EMA 24/50/70/99 聚合指标(raysun)Key Features
Multiple EMAs in One Script: Displays EMA 24, EMA 50, EMA 70, and EMA 99 simultaneously.
Customizable Visibility: You can turn each EMA line on or off in the indicator settings.
Color-Coded Lines: Each EMA is assigned a unique color (orange, blue, green, red) for easier visual distinction.
Overlay on Price Chart: Plots directly on the candlestick chart to help identify market trends and momentum shifts.
Usage
Trend Identification:
Shorter EMAs (like EMA 24) are more sensitive to price action, while longer EMAs (like EMA 99) represent broader trends.
Crossovers:
Watching how EMAs cross each other can help spot potential bullish or bearish signals. For example:
EMA 24 crossing above EMA 50/70/99 may suggest an uptrend.
EMA 24 crossing below EMA 50/70/99 may indicate a downtrend.
Support and Resistance:
EMAs often act as dynamic support and resistance levels, especially in trending markets.
Ideal For
Traders who prefer using EMA clusters for decision-making.
Swing traders and intraday traders who monitor multiple timeframes.
Anyone wanting a cleaner setup without cluttering the chart with multiple separate EMA indicators.

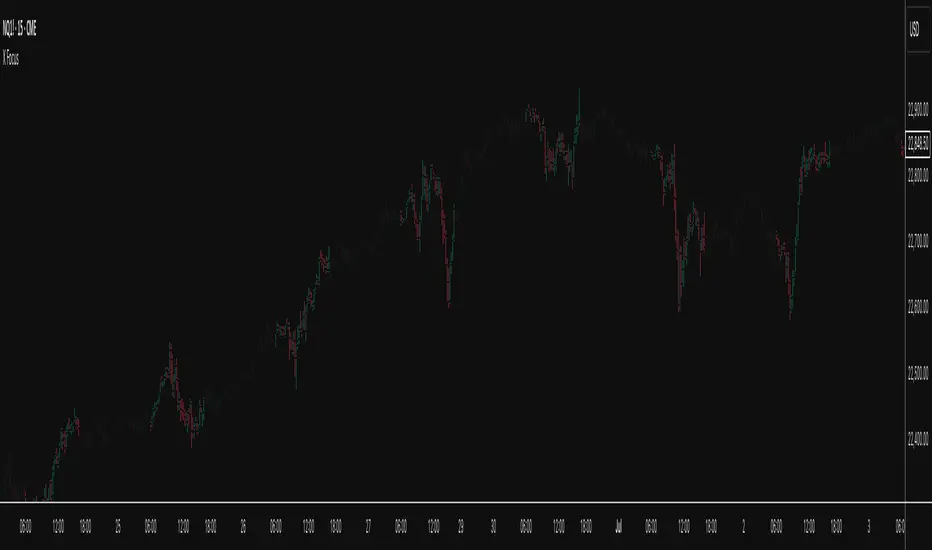
X FocusDesigned to help traders reduce distractions by de-emphasizing specific time ranges on the chart. Instead of highlighting high-activity zones, this tool intentionally applies a muted overlay to selected sessions, allowing traders to concentrate on price action that occurs outside those designated ranges.
Core Purpose
The primary goal of this indicator is to combat the “noise” that often arises during certain periods, such as overnight sessions or pre-market trading. By visually softening those areas, traders can focus on the more relevant trading windows WITHOUT losing any time-based context. Unlike traditional tools that remove data entirely, X Focus preserves all candlestick and price information—ensuring that key levels, gaps, or reference values are still visible.
Key Features
Custom Session Filtering
Users can define up to three time ranges depending on preference. This flexibility allows for tailoring the indicator to different market strategies.
De-Emphasis by Design
Instead of masking or deleting data, the indicator overlays a semi-transparent shading box over the chosen sessions. This ensures traders remain aware of the data while maintaining visual focus on the price action outside of the selected time blocks.
Dual Utility – Highlight or Suppress
While built on the principle of minimizing distractions, the same framework can also be used in reverse to highlight specific areas of interest. This versatility makes it suitable for both noise-reduction and spotlighting critical ranges.
Dark Mode / Light Mode
Adjustable color schemes allow seamless integration into any chart setup, whether the user prefers dark or light backgrounds.
Non-Intrusive Visualization
The shading effect is applied without altering price bars, indicators, or other overlays. This ensures compatibility with existing technical tools and strategies.
Use Case
Traders who find themselves reacting too strongly to inconsequential movements during certain times (such as after-hours or low-volume sessions) can benefit from the X Focus indicator. It helps maintain clarity and discipline by visually guiding attention toward the periods that matter most—without erasing or ignoring potentially useful price references.