Search in scripts for "Candlestick"

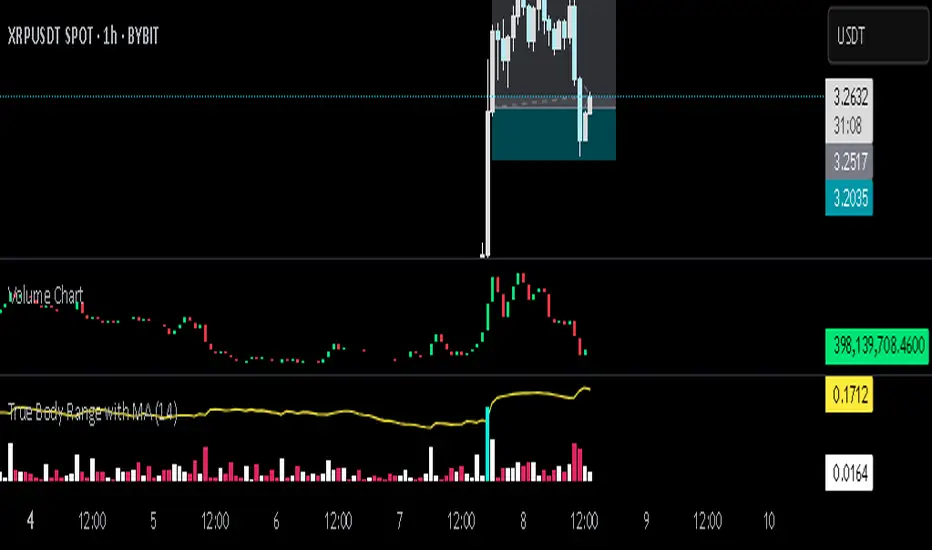
Volume ChartThis Pine Script indicator, written in TradingView’s version 6, visualizes trading volume as a custom candlestick chart instead of a standard histogram. Rather than plotting volume bars, it constructs synthetic candles where each candle’s "open" is set to the previous candle’s "close" (stored in prevClose). The "close" of the synthetic candle moves upward by the volume value if the actual price candle was bullish (close > open) and downward by the volume value if it was bearish, with the "high" and "low" both fixed to the open to create a flat candle body line. This transforms volume into a price-like cumulative visual flow, color-coded green for bullish and red for bearish periods, allowing traders to intuitively track whether volume pressure is accumulating upward or downward over time, as though volume itself were moving like a market price series.
KSL-Fullsystem📊 KSL-Fullsystem
A smart trading analysis system designed for serious traders who value precision and confidence in every entry.
🎯 Key Features:
✅ Detects reversal signals using advanced candlestick shift logic
✅ Confirms signals with a powerful set of indicators: EMA, SMA, LWMA, MACD, AO, and AC
✅ Supports all trading styles: Scalping, Day Trade, Swing, and Trend Following
✅ Automatically calculates Entry, TP1-TP3, and SL based on risk/reward logic
✅ Visualizes support/resistance zones with dynamic colored boxes
✅ Fully customizable filters to match your unique strategy
🧠 This system helps you:
Spot key turning points in the market
Plan risk/reward clearly with calculated levels
Trade with structure and confidence – not guesswork
💬 Interested in using this tool?
Need help setting it up to match your trading style?
📩 Contact us via LINE 👉 @kasalong
Once you try it, you'll never want to trade blindly again. 🚀📈

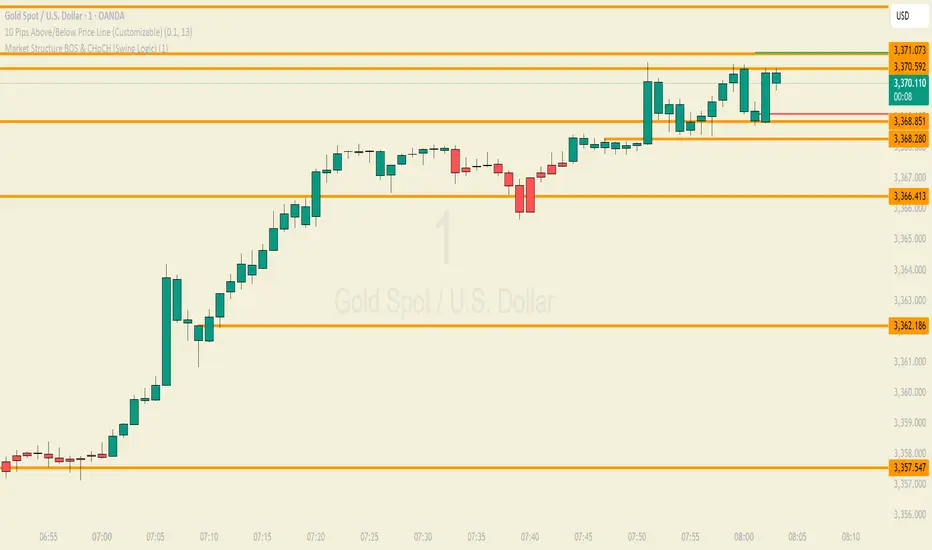
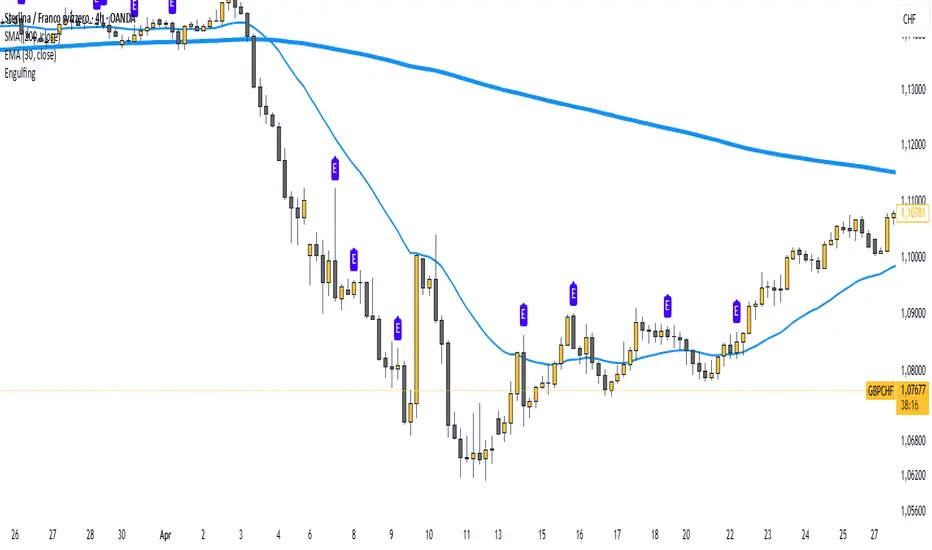
easy Market Structure BOS & CHoCH (Swing Logic)
A trend reversal occurs when the direction of the market changes from an uptrend to a downtrend or vice versa. It is typically confirmed by a shift in price structure, such as a break of key support or resistance, a change in swing highs/lows, or specific candlestick patterns like engulfing or pin bars. Indicators like RSI divergence or moving average crossovers can also support reversal identification. Reversals often follow a strong trend and signal a potential new direction in price movement
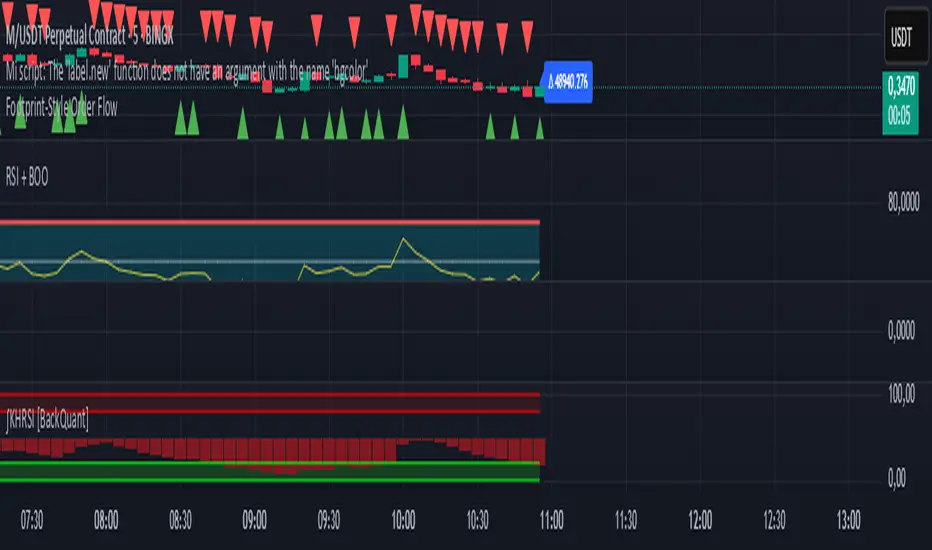
Footprint-Style Order Flow by Kalibea📊 Indicator: "Footprint-Style Order Flow by Kalibea"
Simplified Order Flow Analysis for TradingView
This indicator was created by Kalibea to bring you the power of Order Flow analysis in a clear, practical way—without technical complexity and fully compatible with TradingView.
While TradingView doesn’t support traditional footprint charts, this tool simulates institutional market reading using a smart calculation of estimated volume delta, helping you make more informed trading decisions.
🔍 What does this indicator do?
Estimated Delta: Calculates the difference between buying and selling pressure per candle, based on price movement and volume.
Smart Visual Signals:
🔼 Green Triangle: Potential buy entry (buyer dominance).
🔽 Red Triangle: Potential sell entry (seller dominance).
Delta Histogram: Displays whether each candle was driven more by buyers or sellers.
Live Labels: Shows real-time delta values above each candle for quick interpretation.
🧠 How does it help your trading?
Detects real-time market imbalances (who's in control: buyers or sellers).
Improves entry and exit timing, especially on lower timeframes.
Helps you confirm other strategies such as supply/demand zones, support/resistance, or candlestick patterns.
Provides an institutional-style reading simplified for use within TradingView.
⚙️ Fully Customizable to Your Style
Adjust the delta sensitivity to suit any market: Forex, Crypto, Indices, and more.
Turn on/off visual signals and histogram as needed.
🔑 Recommended by Kalibea for:
✅ Intraday traders and scalpers
✅ Traders looking to take the next step into institutional-style analysis
✅ Those seeking precise entries without overcomplicating their charts
💬 “Order Flow is the market’s internal voice. This indicator helps you hear it—no expensive footprint software required.”
— Kalibea
Body Engulfing Detector🔶 Body Engulfing Detector
This simple but effective indicator identifies candlestick patterns where the entire body of the current candle engulfs the body of the previous one — a classic signal of a potential reversal or momentum continuation.
🔍 What It Does:
Detects when the body (open-close range) of the current candle completely covers the body of the previous candle.
Triggers a visual signal on the chart once the candle is closed, avoiding premature alerts.
Includes a generic alert you can enable from the TradingView alert system, so you’ll be notified as soon as a body engulfing pattern occurs.
📈 Use Case:
This pattern can be interpreted as a shift in market sentiment and may signal a possible entry point depending on the context:
Use it as part of your price action strategy.
Combine it with trend analysis, volume, or other confirmation tools.
⚠️ This indicator focuses only on body engulfing and does not require the candle to be bullish or bearish specifically. If you'd like a version that distinguishes between bullish and bearish engulfing, feel free to request it.
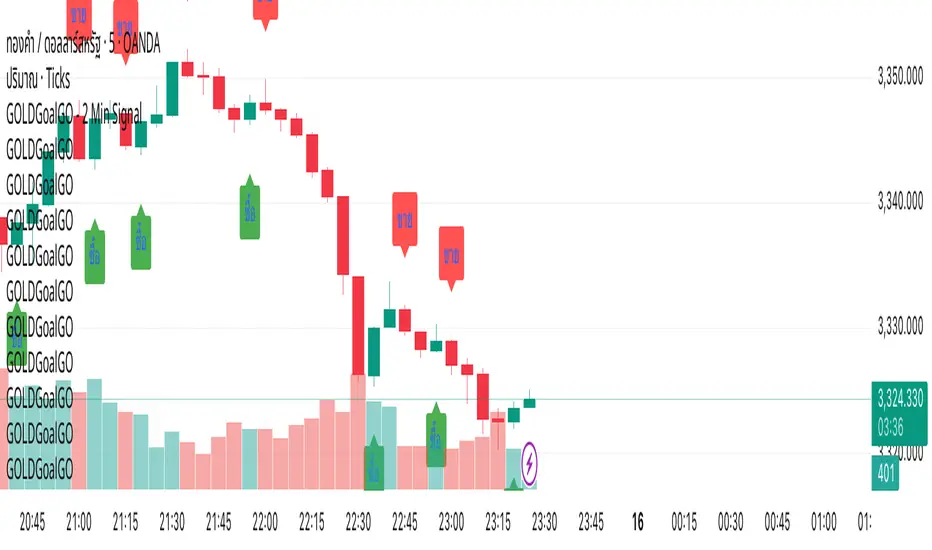
GOLDGoalGO - 2 Min SignalGOLDGoalGO" Indicator for TradingView
Introduction
The "GOLDGoalGO" indicator is designed to assist traders in analyzing short-term price movements of gold (XAUUSD). It provides buy and sell signals every 5 minutes, helping traders identify optimal entry and exit points based on recent price changes.
Concept and Functionality
Primary Goal: To offer clear and timely trading signals by analyzing short-term price trends, specifically tailored for 2-minute intervals.
How It Works: The indicator calculates the change in closing prices compared to the previous bar to generate buy and sell signals. These signals are only active during 2-minute timeframes, ensuring precision in short-term trading.
Signals Provided:
A buy signal (represented by an upward shape) appears when prices show upward momentum.
A sell signal (represented by a downward shape) appears when prices show downward momentum.
Visual Cues: The signals are displayed directly on the chart with intuitive shapes for quick recognition. Additionally, alert notifications are configured to inform you immediately when new signals occur.
How the Indicator Works in Detail
Timeframe Check: It activates only during 2-minute candlestick intervals to ensure signals are relevant for short-term trading.
Price Change Calculation: It compares the current close with the previous close to detect the direction of market movement.
Signal Generation:
If the price is increasing (positive change), a buy signal is generated.
If the price is decreasing (negative change), a sell signal is generated.
Chart Annotations: When a signal occurs, a shape appears on the chart indicating the optimal point for entering a trade.
Automated Alerts: The system sends a Thai-language notification every 2 minutes to alert you of new signals, enabling timely actions even when you're away from the screen.
How to Use
Paste this script into the Pine Editor in TradingView.
Click "Add to Chart" to activate the indicator.
Set up Alert rules:
Choose the alert condition for "Buy Signal" or "Sell Signal".
Select webhook or notification options to receive real-time alerts (for example, to Telegram).
The indicator provides real-time notifications every 2 minutes whenever new signals are generated.
Why Use This Indicator?
Simplicity: Designed for traders who prefer short-term, momentum-based trading strategies.
Timely Alerts: Signals are provided precisely every 2 minutes, helping you capitalize on short-term price movements.
Flexibility: Easily adaptable to other assets by adjusting the script if needed.
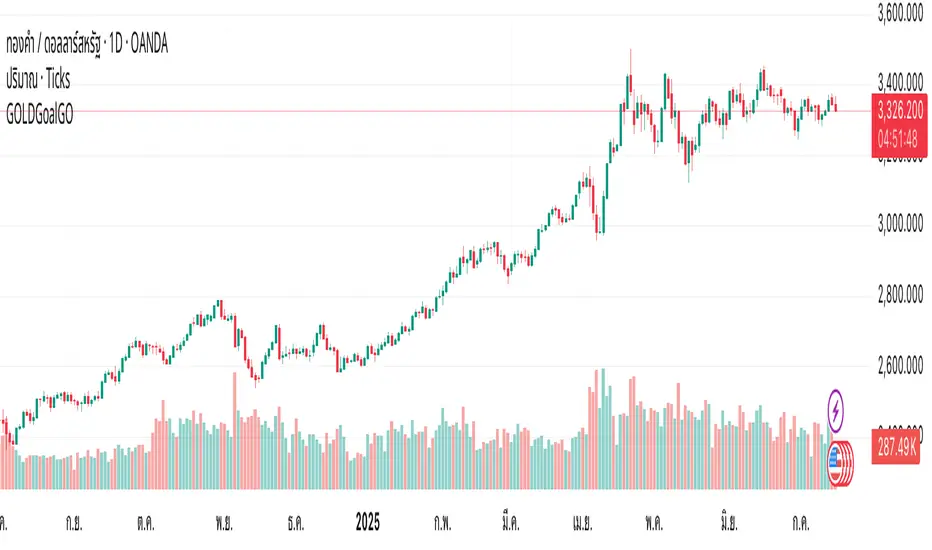
GOLDGoalGO"GOLDGoalGO" Indicator for TradingView
Introduction
The "GOLDGoalGO" indicator is designed to assist traders in analyzing short-term price movements of gold (XAUUSD). It provides buy and sell signals every 5 minutes, helping traders identify optimal entry and exit points based on recent price changes.
Concept and Functionality
Primary Goal: To offer clear and timely trading signals by analyzing short-term price trends, specifically tailored for 5-minute intervals.
How It Works: The indicator calculates the change in closing prices compared to the previous bar to generate buy and sell signals. These signals are only active during 5-minute timeframes, ensuring precision in short-term trading.
Signals Provided:
A buy signal (represented by an upward shape) appears when prices show upward momentum.
A sell signal (represented by a downward shape) appears when prices show downward momentum.
Visual Cues: The signals are displayed directly on the chart with intuitive shapes for quick recognition. Additionally, alert notifications are configured to inform you immediately when new signals occur.
How the Indicator Works in Detail
Timeframe Check: It activates only during 5-minute candlestick intervals to ensure signals are relevant for short-term trading.
Price Change Calculation: It compares the current close with the previous close to detect the direction of market movement.
Signal Generation:
If the price is increasing (positive change), a buy signal is generated.
If the price is decreasing (negative change), a sell signal is generated.
Chart Annotations: When a signal occurs, a shape appears on the chart indicating the optimal point for entering a trade.
Automated Alerts: The system sends a Thai-language notification every 5 minutes to alert you of new signals, enabling timely actions even when you're away from the screen.
How to Use
Paste this script into the Pine Editor in TradingView.
Click "Add to Chart" to activate the indicator.
Set up Alert rules:
Choose the alert condition for "Buy Signal" or "Sell Signal".
Select webhook or notification options to receive real-time alerts (for example, to Telegram).
The indicator provides real-time notifications every 5 minutes whenever new signals are generated.
Why Use This Indicator?
Simplicity: Designed for traders who prefer short-term, momentum-based trading strategies.
Timely Alerts: Signals are provided precisely every 5 minutes, helping you capitalize on short-term price movements.
Flexibility: Easily adaptable to other assets by adjusting the script if needed.
Summary
The "GOLDGoalGO" indicator helps traders stay on top of short-term market trends for gold, giving precise buy and sell signals every 5 minutes. With visual cues on the chart and notifications sent automatically in Thai, it ensures you're always informed of potential trading opportunities and can act swiftly to maximize profit.
Obscure Institutional Candle PatternsThe "Obscure Institutional Candle Patterns" indicator is a specialized tool designed to identify subtle and unconventional candlestick patterns that may signal institutional activity, liquidity grabs, and sophisticated traps. Unlike common patterns like dojis or engulfing candles, this script focuses on nuanced relationships between price, wicks, and volume that often go unnoticed by the average retail trader.
The core idea is that institutional players leave footprints in the market that don't conform to standard textbook patterns. This indicator decodes these footprints, providing traders with potential early warnings or confirmations of significant market moves. Each pattern is plotted with a unique label and color for easy identification, and alerts are available for each signal.
Identified Patterns
Here is a breakdown of the specific patterns this indicator detects:
1. Liquidity Leech
What it is: A candle with an exceptionally long upper or lower wick (more than 3.618 times the body size) that forms on significantly low volume (less than the 20-period average).
Interpretation: This pattern suggests a probe into key price levels. A large institution may be "leeching" liquidity by testing for stop-loss orders without committing significant volume. It can be a precursor to a reversal, as it indicates where liquidity rests.
Plotted as: A small green triangle (Leech).
2. Echo Rejection
What it is: Two consecutive candles that both dip below the midpoint of the previous day's trading range but manage to close above it.
Interpretation: The previous day's midpoint acts as a critical support or resistance level. A single rejection is significant, but a second consecutive rejection—an "echo"—powerfully reinforces the level's strength. This pattern suggests a robust defense of a price level by buyers and can signal the start of a bullish move.
Plotted as: A small orange triangle (Echo).
3. Bleeding Wick Trap
What it is: A series of three consecutive candles, each with a very long lower wick (more than 6.618 times its body size), culminating in a bullish close on the third candle.
Interpretation: This pattern illustrates a sustained battle where sellers repeatedly try to push the price down, but buyers aggressively step in, creating long "bleeding" wicks. The final bullish close suggests the sellers have been exhausted or "trapped," and the buyers have won control, indicating strong accumulation.
Plotted as: A small blue triangle (WickTrap).
4. Time-Shifted Shadow Box
What it is: A bullish reversal candle that occurs after the price retraces into the middle of a bullish candle from two periods ago. This reversal must be accompanied by a massive surge in volume (at least 5 times the 20-period average).
Interpretation: This complex pattern identifies when the market returns to a "shadow" of a previous key level (the midpoint of the candle from two bars back). The aggressive, high-volume reversal from this time-shifted level suggests a powerful institution has stepped in to reverse the short-term retracement with conviction.
Plotted as: A fuchsia label (TS Box).
5. False Containment Body
What it is: A candle that looks like a bullish Harami (body is contained within the prior candle's body) but with two key differences: its entire range (high and low) is also contained, and its body is exceptionally tiny (less than 1/18th the size of the prior candle's body).
Interpretation: While a standard Harami signals indecision or a potential reversal, this pattern suggests a "false" signal designed to deceive. The extremely low volatility and tight range indicate a temporary pause or consolidation with hidden intent, often before a powerful continuation of the previous trend. It traps traders who misinterpret it as a simple reversal signal.
Plotted as: A yellow label (False).
How to Use
Confirmation Tool: Use these signals as a confirmation layer alongside your existing trading strategy. They are not meant to be standalone entry signals.
Context is Key: The effectiveness of these patterns increases significantly when they appear near key support/resistance levels, supply/demand zones, or major moving averages.
Alerts: Enable alerts to be notified in real-time when one of these obscure patterns forms, allowing you to pay closer attention to the price action that follows.

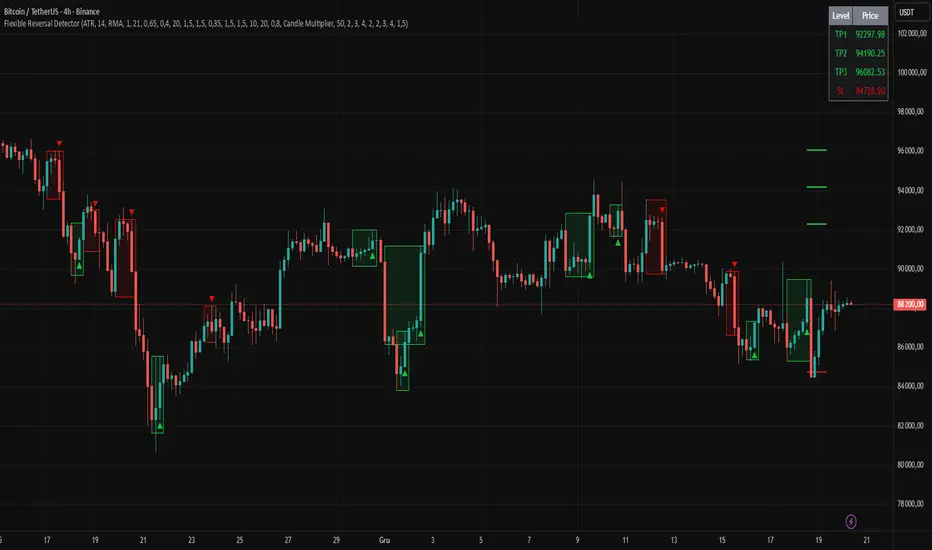
Flexible Reversal DetectorFlexible Reversal Detector
An advanced, fully customizable analytical tool designed to identify local trend reversal zones based on candlestick formations. Users have full control over all logic parameters, making it adaptable to different trading styles and preferences.
Key Features
Adjustable maximum pattern length (number of candles)
Customizable body size ratios for initial, middle, and final candles
Configurable minimum price movement (in %) required before a pattern is considered valid
Colored horizontal lines showing the full length of the pattern – helpful in identifying structure, potential support/resistance zones
Optional volume filter – the volume of the final candle is compared to a volume SMA; multiplier can be adjusted (e.g. 1 = equal to average, 0.8 = 80% of average)
Logic Overview
U Pattern
Each bearish candle is treated as a potential start of a reversal pattern.
Subsequent candles, if small enough and within defined thresholds, form the middle part of the structure.
When a bullish candle with a sufficiently large body appears, it is marked as the final candle of the pattern.
The pattern is considered valid if it was preceded by a defined percentage price drop and – optionally – if the volume condition was met.
∩ Pattern
Each bullish candle may act as the initial candle of a potential reversal pattern in the opposite direction.
Following smaller candles form the middle part, as long as they meet the defined criteria.
The appearance of a strong bearish candle marks the end of the formation.
If this pattern is preceded by a certain price increase (and optionally meets the volume filter), it is highlighted on the chart.
Note: On markets with low volatility or on lower timeframes, it is recommended to reduce the percentage thresholds for signal detection. For more dynamic price action or higher timeframes, consider increasing them accordingly.
Visualization
The final candle of the pattern is marked visually on the chart (depending on direction)
Colored horizontal lines indicate the full span of the pattern – from initial to final candle
Engulfing DetectorThis script detects classic candlestick reversal patterns known as Engulfing formations:
Bullish Engulfing: A green candle fully engulfs the previous red candle.
Bearish Engulfing: A red candle fully engulfs the previous green candle.
🔎 Features:
Works on any time frame or instrument.
Optional filter to ignore overly large or irregular candles.
Visual signals on the chart (BE/SE labels).
Built-in alerts for automation or notification.
✅ Recommended usage:
For intraday trading, this indicator performs best on the 5-minute chart of the Nasdaq (NQ) between 9:45 AM and 1:00 PM ET (15:45–19:00 CET).
💡 Suggested trading approach:
Optimized for scalping with short-term trades and small take-profits around +0.10%.

Trend Exhaustion Counter🔢 How It Works
The Trend Exhaustion Counter consists of two main phases:
1️⃣ Setup
Begins when the close price is greater (or less) than the close 4 bars earlier.
Each bar that meets the condition increments the count.
A complete Setup = 9 consecutive bars that meet the rule:
In an uptrend: close > close
In a downtrend: close < close
Once the 9-count is complete, the market is considered to be in a short-term exhaustion phase.
2️⃣ Trend Exhaustion Counter (Optional Phase)
A secondary phase that counts to 13 (less common in simplified versions).
Confirms potential exhaustion after Setup.
More conservative, but signals stronger reversals.
🟢 Bullish Signal
A 9-count to the downside suggests selling may be exhausted, indicating a potential bottom and reversal upward.
🔴 Bearish Signal
A 9-count to the upside suggests buying may be exhausted, signaling a potential top and reversal downward.
🎯 Usage Tips
Best used in trending markets to identify trend exhaustion.
Works well with support/resistance levels, volume, and candlestick patterns.
Can be combined with other indicators (like RSI or MACD) for confirmation.
📉 Limitations
False signals can occur in choppy, sideways markets.
It doesn’t predict trend direction—only possible exhaustion.

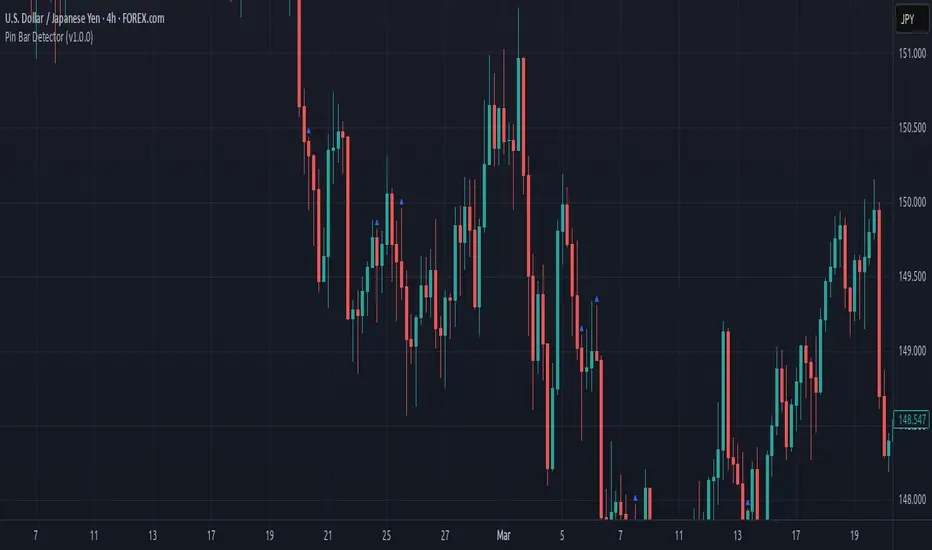
Pin Bar Detector (v1.0.0) Description:
This script detects Pin Bar candlestick patterns based on their shadows and body size.
It analyzes the candle's structure and trend direction using moving averages
to determine valid Pin Bars in an uptrend or downtrend.
The purpose of this script is to help traders identify potential reversal points
by spotting Pin Bar formations in line with the prevailing market trend.
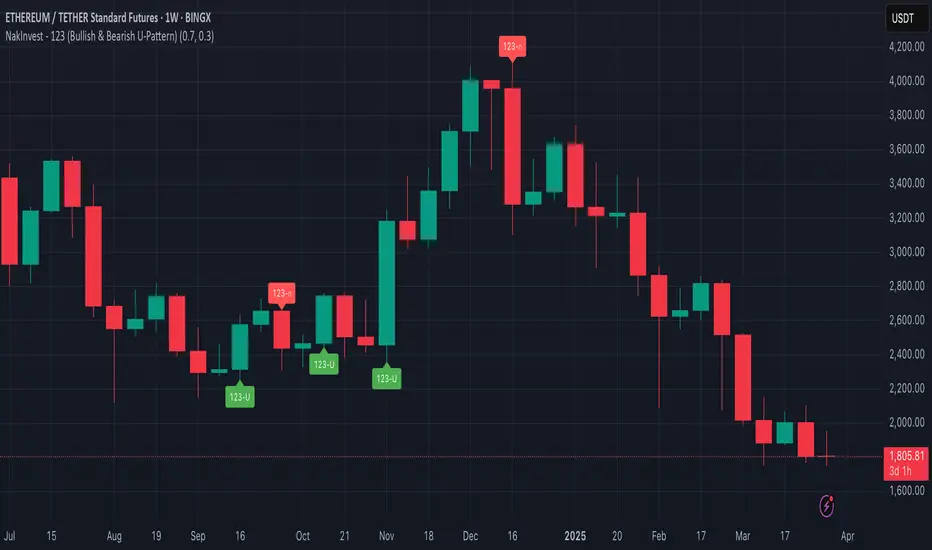
NakInvest - 123 (Bullish & Bearish U-Pattern)📘 Description: U-Shape 123 (Bullish & Bearish Identifier)
This indicator helps you identify the 123 reversal pattern, a powerful yet simple price action setup taught by renowned Brazilian trader Stormer.
I learned this pattern from Lucas Nakata, founder of NakInvest, who was a student of Stormer. Stormer has popularized and refined this setup in the Brazilian trading community, especially for identifying U-shaped reversals that precede strong directional moves.
⸻
🔎 What is the 123 Pattern?
The 123 pattern is a 3-candle formation used to spot bullish or bearish reversals. It forms a “U” or inverted “U” shape and is based purely on candlestick structure — no indicators or lagging signals.
There are two versions:
✅ Bullish 123 (“U” pattern)
• Candle 1: Red candle with a large body (selling pressure).
• Candle 2: Small candle of any color (pause or indecision).
• Candle 3: Green candle with a body at least 70% the size of candle 1 (strong bullish push).
This indicates a potential bullish reversal from a prior downtrend.
❌ Bearish 123 (inverted “U” pattern)
• Candle 1: Green candle with a large body (buying pressure).
• Candle 2: Small candle of any color (pause or indecision).
• Candle 3: Red candle with a body at least 70% the size of candle 1 (strong bearish push).
This indicates a potential bearish reversal from a prior uptrend.
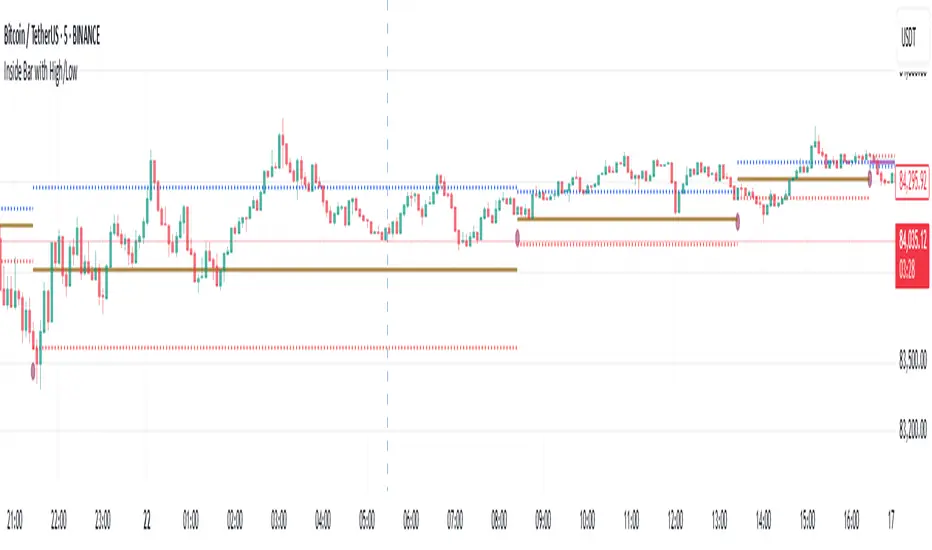
Inside Bar with High/LowInside Bar with High/Low
The indicator plots horizontal mid line between two Inside bars with High / Low with Multi Time Frame Selection by the user which can be traded in trending markets in the direction of the trend, when traded this way they are typically referred to as a ‘Breakout Play’ or an inside bar ‘Price Action Breakout Pattern’ They can also be traded counter-trend, typically from ‘Key Chart Levels’ , when traded this way they are often referred to as ‘Inside Bar Reversals’ .
The classic entry for an inside bar signal is to place a buy stop or sell stop at the high or low of the mother bar, and then when price breakouts above or below the mother bar, your entry order is filled with best time frame preferably more than 1 hour.
Stop loss placement is typically at the opposite end of the mother bar, or it can be placed near the mother bar halfway point (50% level), typically if the mother bar is larger than average.
It’s worth noting that these are the ‘classic’ or standard entry and stop loss placements for an inside bar setup is a useful tool for traders looking to identify potential reversals using the 20/50 EMA and candlestick patterns. However, like any trading tool, it should be used in conjunction with other indicators and analysis techniques for better accuracy
And also this tool is especially useful for day traders who want to track price action during specific times of the day and make informed decisions based on market behavior with more than 60 minutes period
As always, back testing and customization are recommended to optimize performance across different market conditions
In the end, experienced traders may decide on other entries or stop loss placements as they see fit.
Please remember that this indicator is provided for educational purposes only and does not constitute financial advice
Strong Engulfing Candlestick (With Alerts)Detect only Strong Bullish and Strong Bearish Engulfing candle patterns and provide visual signals along with alerts.
Key Features
Bullish Engulfing Detection:
Conditions:
Current candle's close > open (bullish).
Previous candle's close < open (bearish).
Current candle's high ≥ Previous candle's high (includes wicks).
Current candle's low ≤ Previous candle's low (includes wicks).
The body of the current bullish candle is stronger than the previous bearish candle.
Signal: Plots a green upward arrow below the bar when conditions are met.
Bearish Engulfing Detection:
Conditions:
Current candle's close < open (bearish).
Previous candle's close > open (bullish).
Current candle's high ≥ Previous candle's high (includes wicks).
Current candle's low ≤ Previous candle's low (includes wicks).
The body of the current bearish candle is stronger than the previous bullish candle.
Signal: Plots a red downward arrow above the bar when conditions are met.
Alerts:
Custom alerts are included for both bullish and bearish engulfing patterns:
Bullish Alert Message: "Strong Bullish Engulfing detected!"
Bearish Alert Message: "Strong Bearish Engulfing detected!"

ATR 3x Multiplier StrategyBeta version
Volatility and Candle Spikes in Trading
Volatility
Volatility refers to the degree of variation in the price of a financial asset over time. It measures how much the price fluctuates and is often associated with risk and uncertainty in the market. High volatility means larger price swings, while low volatility indicates more stable price movements.
Key aspects of volatility:
Measured using indicators like Average True Range (ATR), Bollinger Bands, and Implied Volatility (IV).
Influenced by factors such as market news, economic events, and liquidity.
Higher volatility increases both risk and potential profit opportunities.
Candle Spikes
A candle spike (or wick) refers to a sudden price movement that forms a long shadow or wick on a candlestick chart. These spikes can indicate strong buying or selling pressure, liquidity hunts, or stop-loss triggers.
Types of candle spikes:
Bullish Spike (Long Lower Wick): Indicates buyers rejected lower prices, pushing the price higher.
Bearish Spike (Long Upper Wick): Suggests sellers rejected higher prices, pushing the price lower.
Stop-Loss Hunt: Market makers may trigger stop-losses by creating artificial spikes before reversing the price.
News-Induced Spikes: Economic data releases or unexpected events can cause sudden price jumps.
Understanding volatility and candle spikes can help traders manage risk, spot entry/exit points, and avoid false breakouts. 🚀📈

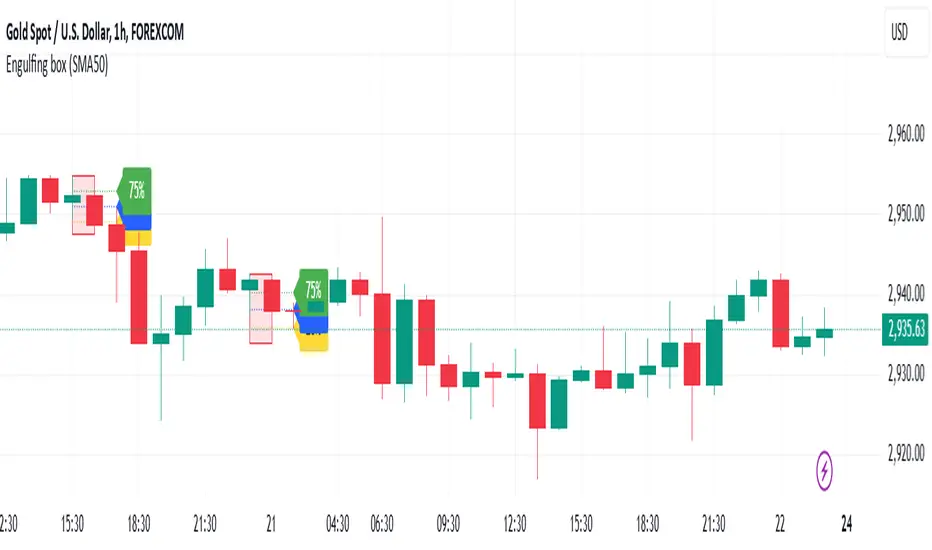
Engulfing BoxEngulfing Day Trading Strategy | Version 1.0
This indicator highlights Bullish and Bearish Engulfing candlestick patterns, designed for day trading strategies. It identifies key market reversals and potential breakout points using simple price action principles.
🔑 Features:
Detects Bullish and Bearish Engulfing patterns based on customizable trend filters.
Automatically draws percentage levels (20%, 50%, and 75%) for target zones.
Bullish Engulfing → Levels drawn top to bottom.
Bearish Engulfing → Levels drawn bottom to top.
Highlights the engulfing candle and previous bar with colored boxes.
Supports trend detection using SMA50 or SMA50 & SMA200.
Alert conditions for both bullish and bearish setups.
Ideal for scalping, day trading, and identifying potential reversals.
📊 How to Use:
Apply the indicator on your preferred time frame (5M, 15M, 1H, etc.).
Wait for the engulfing pattern to form and monitor the drawn levels for potential entry/exit points.
Use in combination with volume or momentum indicators for enhanced confirmation.
⚠️ Disclaimer:
This is a tool for educational purposes and should not be considered financial advice. Always manage your risk and backtest before live trading.
Inside Bars ITInside Bars IT Indicator
The Inside Bars IT indicator is a powerful tool designed to identify Inside Bars and their extended patterns (InsideBar2) on any chart. An Inside Bar is a candlestick pattern where the current candle's high is lower than the previous candle's high, and the current candle's low is higher than the previous candle's low. This pattern often signals market consolidation and potential breakout opportunities.
The indicator extends the concept of Inside Bars by introducing InsideBar2, which uses the high and low of the first Inside Bar as reference levels. Subsequent candles are classified as InsideBar2 if their high is less than or equal to the reference high and their low is greater than or equal to the reference low.

Candle Ratio Alert**Candle Ratio Alert System for Multi-Pair, 5-Minute Charts**
This Pine Script indicator is designed for traders who want to monitor specific candle patterns across multiple assets on a 5-minute timeframe. The tool calculates the ratio of the candle's body size to its total wick size, allowing you to identify significant candles based on their structure. It is ideal for strategies that rely on candlestick analysis, such as breakout or reversal trading.
### Key Features:
1. **Customizable Threshold**: Set the body-to-wick ratio using an input slider, ensuring flexibility to match your strategy.
2. **Visual Alerts**: The script plots a purple marker above candles that meet the specified criteria, making it easy to spot qualifying patterns at a glance.
3. **Dynamic Alerts**: Integrated alert functionality notifies you via email or app when a candle satisfies the ratio condition. Alerts include the asset's ticker and timeframe for quick action.
4. **Multi-Pair Capability**: Compatible with assets like XAUUSD, BTCUSD, EURUSD, and GBPUSD, making it versatile for Forex and cryptocurrency trading.
### How It Works:
The script calculates the body size and total wick size of each candle. If the ratio exceeds the user-defined threshold, the script triggers a visual marker and sends an alert. The 5-minute timeframe ensures rapid identification of trading opportunities in volatile markets.
With its intuitive interface and powerful alert system, this tool streamlines your trading workflow, helping you stay focused on key market movements. Perfect for both beginners and experienced traders seeking precision and efficiency in their analysis.

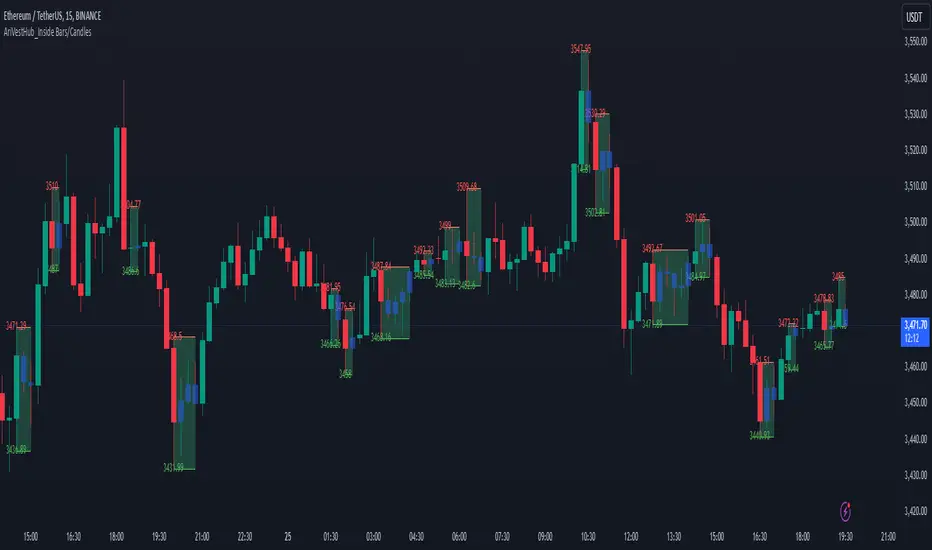
AriVestHub_Inside Bars/Candles
Introduction:
This script identifies and marks inside bars on your TradingView charts. An inside bar pattern is a two-bar candlestick pattern where the second bar is entirely within the range of the first bar. This pattern often signals consolidation and can indicate a potential breakout or trend continuation.
Trading Signals:
Inside bars can indicate potential trading signals. Traders often watch for breakouts above or below the inside bar to identify potential entry points.
Customization:
You can customize the colors, styles, and labels to suit your preferences.
Conclusion
This script is a useful tool for traders looking to identify inside bar patterns on their TradingView charts. By highlighting these patterns, traders can make more informed trading decisions based on potential market consolidations and breakouts.
Bullish Candlestick with No or Small Bottom Wickthis indicator highlights bullish candles with no lower wick of with a very small lower wick. the idea is that when this occurs, price will sooner or later get back to this area. you could use it for a strategy that sets up shorts just below the bullish candle.

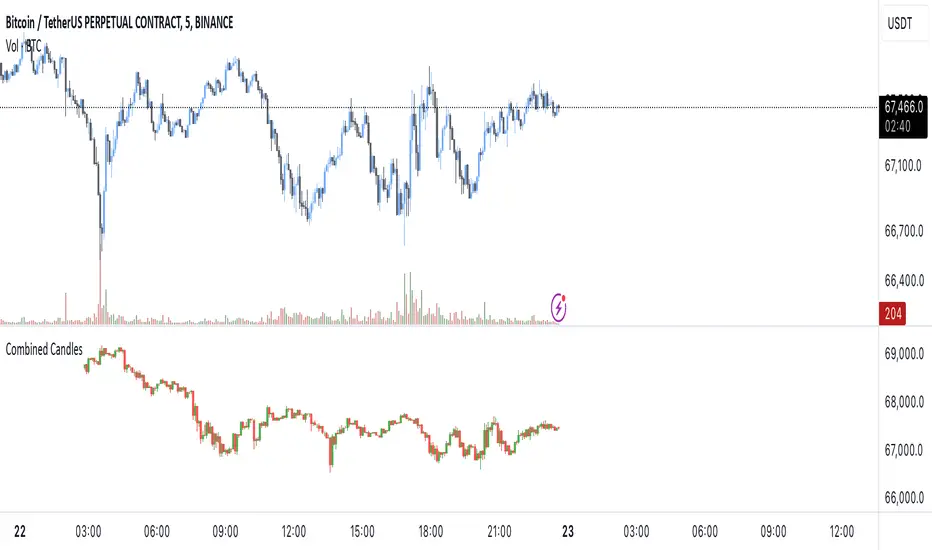
[EmreKb] Combined CandlesThis script combines multiple candlestick patterns into a single, unified candle when they are of the same type (bullish or bearish). Instead of displaying every individual candle on the chart, it merges consecutive candles based on their direction to simplify the visual analysis of price movements.
What It Does:
Combines Candles: If two or more consecutive candles are bullish (close price higher than open price) or bearish (close price lower than open price), the script merges them into a single candle, adjusting the high, low, and close values accordingly.
Displays Merged Candles: The merged candles are drawn on the chart. A green bar represents a bullish period, while a red bar represents a bearish period.
How It Works:
The script tracks whether each candle is bullish or bearish.
If a candle is the same type as the previous one, it updates the combined candle (adjusting the high, low, and close values).
When the type changes (from bullish to bearish or vice versa), it finalizes the current combined candle and starts a new one.
The merged candles are displayed on the chart at the end of the data series.
Use Case:
This script simplifies price action by grouping similar candles together, making it easier to identify trends and spot periods of sustained buying or selling pressure. It can help traders focus on the overall direction of the market rather than being distracted by small fluctuations between individual candles.