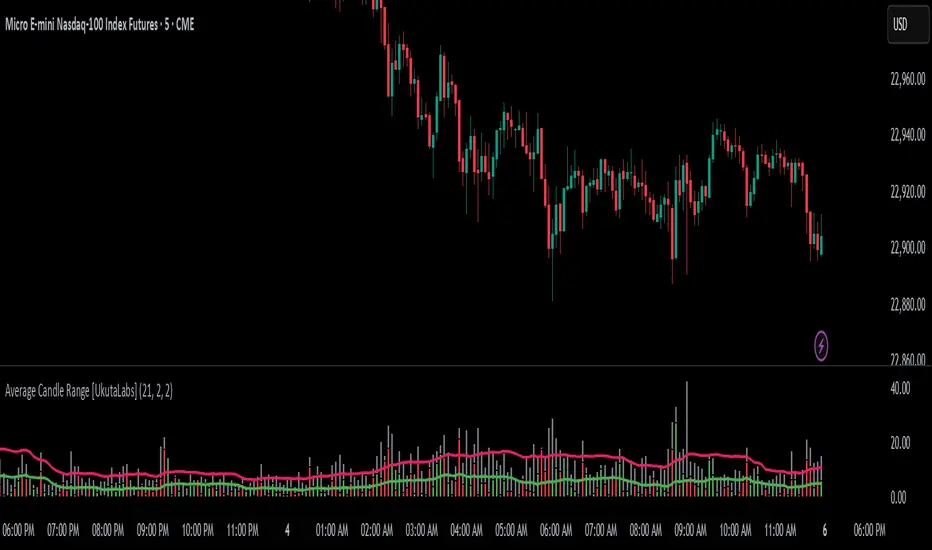
Average Candle Range [UkutaLabs]█ OVERVIEW
The Average Candle Range is a powerful indicator that compares the size of the current bar to past bars. This comparison can be used in a wide variety of trading strategies, allowing traders to understand at a glance the relative size of each candle.
█ USAGE
As each candlestick forms, two bars will be plotted on the indicator. The grey bar represents the total range of the candle from the high to the low, and the second bar represents the body of the bar from the open to the close. Depending on whether the bar is bullish or bearish, the second bar will be colored green or red respectively.
Two averages will also be drawn over these bars that represent the average size of the two bar types over a period that is specified by the user. These averages can be toggled in the indicator settings.
█ SETTINGS
Configuration
• Period: Determines how many bars to use in the calculation of the averages.
• Show Bar Average: Determines whether or not the average for the full bar size is displayed.
• Show Body Average: Determines whether or not the average for the body is displayed.
Search in scripts for "Candlestick"
Morning and Evening Star Patterns with DivergenceMorning and Evening Star Patterns with Divergence
This indicator combines various technical signals to identify potential buy and sell opportunities in the market. It incorporates Morning Star and Evening Star candlestick patterns, along with bullish and bearish divergence signals, to help traders make informed decisions.
Features:
Morning and Evening Star Patterns: The indicator detects Morning Star patterns in downtrends and Evening Star patterns in uptrends, providing visual cues for potential reversals.
Bullish and Bearish Divergence: It highlights instances of bullish and bearish divergence between price and momentum indicators, signaling potential shifts in market direction.
Near Reversal Indication: Identifies periods where the price is close to reversing its trend, aiding in timely entry or exit decisions.
Customizable Thresholds: Users can adjust parameters such as the Money Flow Index (MFI) threshold to suit their trading preferences.
Momentum Plot: The indicator also includes a momentum plot to visualize changes in price momentum over time.
Usage:
Look for Morning Star patterns in downtrends and Evening Star patterns in uptrends as potential reversal signals.
Pay attention to bullish and bearish divergence signals for indications of weakening or strengthening market momentum.
Utilize near reversal indications to anticipate potential trend changes and adjust trading strategies accordingly.
Alerts: The indicator provides customizable alerts for Morning Star patterns, Evening Star patterns, near bullish reversals, near bearish reversals, bullish divergence, and bearish divergence, allowing traders to stay informed of significant market developments even when away from the charts.
Compatibility: Suitable for traders across all timeframes, from short-term scalpers to long-term investors, this indicator offers versatile functionality to adapt to various trading styles and preferences.

+4-4 ChartThis overlay indicator provides a visual representation of momentum and price direction within each bar (or candlestick). It does this by comparing the current bar's open, high, low, and close to the previous bar's values, highlighting the following conditions:
Strong Up (Green): All four components (open, high, low, close) are higher than the previous bar.
Weak Up (Light Green): Three out of four components are higher than the previous bar.
Strong Down (Red): All four components are lower than the previous bar.
Weak Down (Light Red): Three out of four components are lower than the previous bar.
White: None of the strong or weak conditions are met, suggesting possible consolidation or indecision.
How to Use: The +4-4 Chart Indicator can be helpful in identifying potential trend continuation patterns, reversals, or periods of consolidation. Traders might use the predominance of green or red to gauge overall market sentiment. It is most useful to visualise long term daily, weekly, monthly market trends for SPY and QQQ etc.

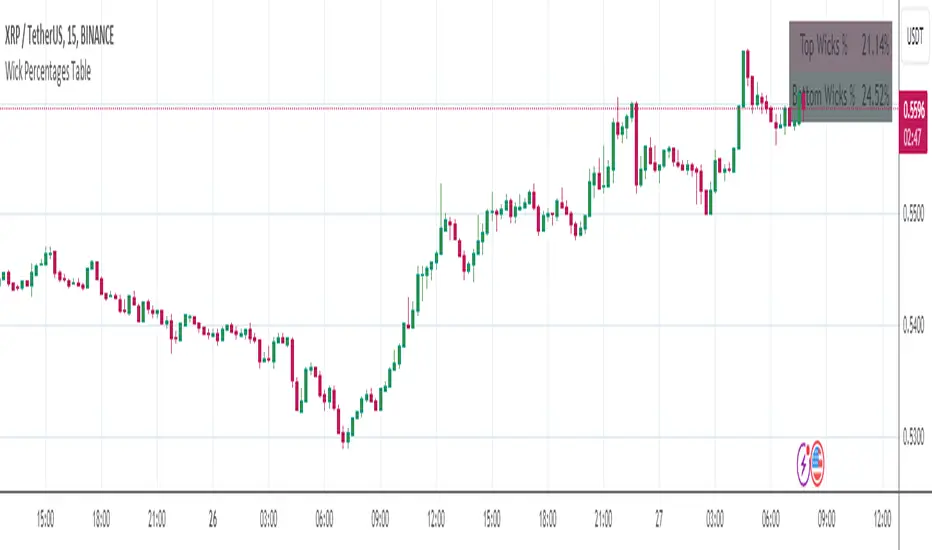
Wick Percentages TableThis script is designed to calculate and display the percentage representation of wick lengths in relation to the total candle range for the last 100 candles on a trading chart. Here's a breakdown of its functionality:
Indicator Initialization: It sets up an indicator named "Wick Percentages Table" (WPT) that overlays on the trading chart.
Variables Initialization: The script initializes variables to store the total lengths of top wicks, bottom wicks, and the total ranges for the last 100 candles.
Wick and Range Calculations: For the past 100 candles, it calculates:
The length of the top wick (the distance between the high and the higher of the open or close).
The length of the bottom wick (the distance between the low and the lower of the open or close).
The total range of each candle (the distance between the high and the low).
Percentage Calculations: It computes the top and bottom wick lengths as percentages of the total candle range across the last 100 candles.
Table Display: It creates or updates a table displayed on the top right of the chart showing these percentages. The table has two rows: one for the "Top Wick %" and another for the "Bottom Wick %", with the corresponding percentages calculated and displayed.
Visibility Maintenance: It plots a dummy variable to ensure the indicator's visibility on the chart.
The purpose of this script is to provide traders with a visual representation of the wick lengths as percentages, offering insights into market behavior and potential price movements based on recent candlestick patterns. It aids in assessing market volatility and trader sentiment through the analysis of wick lengths relative to the total candle sizes.
...
Any improvements to this code would be more then welcome.
I was getting an error in line 30, the only thing I could find was to comment it out.
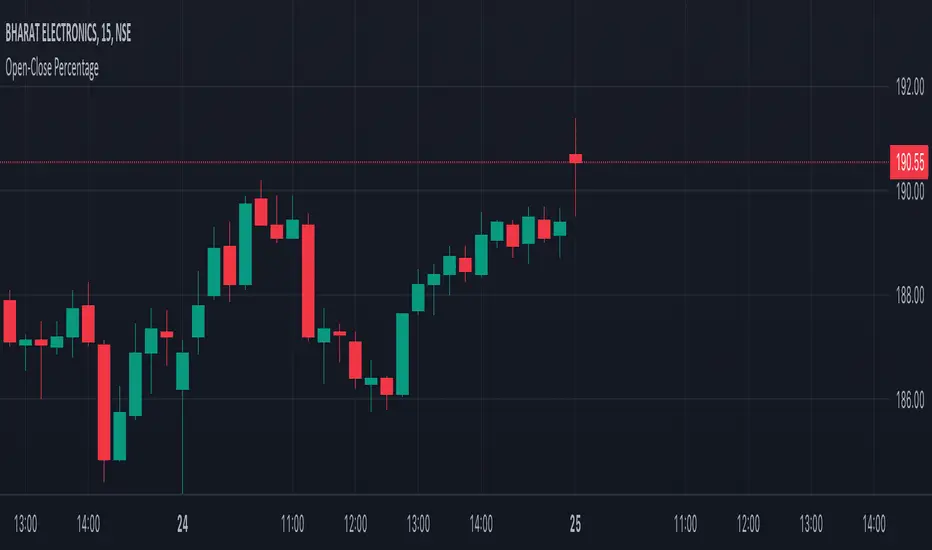
Open-Close PercentageThis indicator will help you to find the body percentage (open close) of the entire candlestick length
Piano Candle SetupPiano Candle Setup is a 3 and 4 Candle Combination Candle Setup.
It is a combination of the following 4 candle patterns:
1. The first set is a Green-Red-Green Setup
- Closing of the 3rd candle should be above the closing of the other 2 candles.
- The low of the first candle should not be breached by either candles
2. The second set is a Green-Red-Red-Green Setup
- Closing of the 4th candle should be above the closing of the other 3 candles
- 2nd and 3rd candles are red candles
- The low of the first candle should not be breached.
3. The third set is a Red-Green-Red Setup
- Closing of the 3rd candle should be below the closing of the other 2 candles
- The high of the first candle should not be breached by the other two candles
4. The fourth set is a Red-Green-Green-Red setup
- Closing of the 4th candle should be below the closing of the other 3 candles
- 2nd and 3rd candle are green candles
- The high of the first candle should not be breached.
The First two patterns help identify a strong bullish strength where the last candle indicates a strong buying bias by closing above it's previous candles. The Last two patterns help identify a strong bearish strength where the last candle indicates a strong selling bias by closing below it's previous candles. In live market the candlestick patterns tend to become white noise therefore this indicator helps overcome that problem.
The pattern works best in 5 minutes and above timeframes

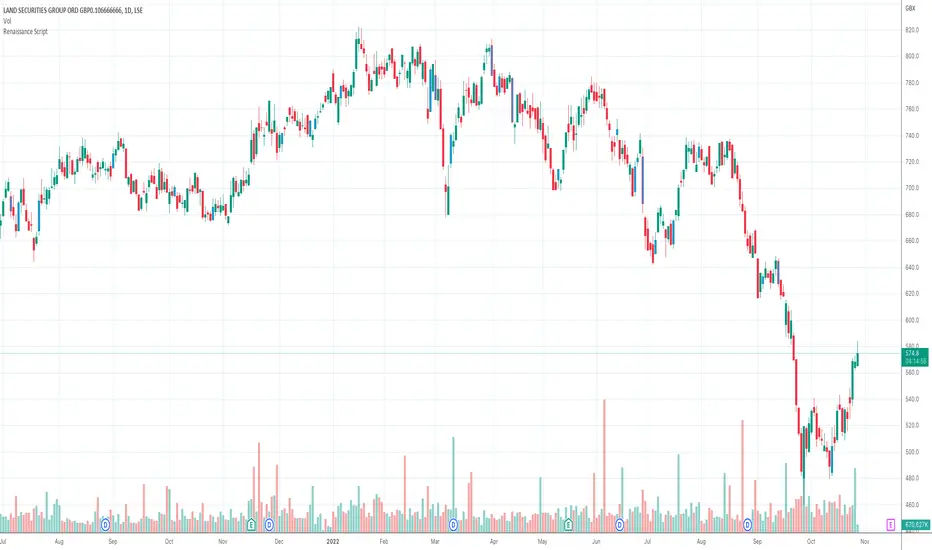
Renaissance ScriptThe Renaissance script is an entry system based on a Morning Star and Evening Star candlestick formation.
Indica-v1Indica will help identify standard CandleStick Patterns over any financial instrument under CandleStick Analysis.
Currently it supports Bullish / Bearish Engulfing and PiercingLine CandleStick Patterns. More Indicators will be added going forward.
It's in beta mode and the script is protected as well, if you need access please reach out to me for private access.
Disclaimer: This script is tested against Indian stocks only for now, no other instruments or other markets were verified by the author. Also the author never recommends any trades on any kind of instruments based on the indicators generated by this script and is not responsible for the outcomes of your actions.

IndicaIndica will help identify standard CandleStick Patterns over any financial instrument under CandleStick Analysis.
Currently it supports Bullish/Bearish Engulfing and PiercingLine CandleStick Patterns. More Indicators will be added going forward.
It's in beta mode and the script is protected as well, if you need access please reach out to me for private access.
Disclaimer: This script is tested against Indian stocks only for now, no other instruments or other markets were verified by the author. Also the author never recommends any trades on any kind of instruments based on the indicators generated by this script and is not responsible for the outcomes of your actions.

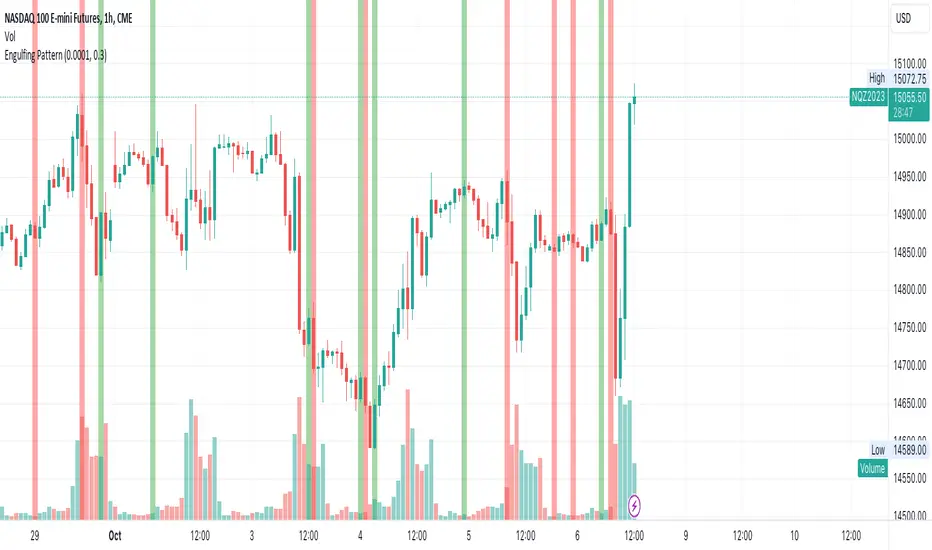
Custom Engulfing PatternThis script identifies bullish and bearish engulfing candlestick patterns based on user-defined criteria. It highlights the engulfing patterns on the chart for easy visualization. The script allows for customization of certain parameters to fine-tune the engulfing pattern detection according to the user's preferences.
Features:
Wick Ratio: Define a ratio to ensure that the body of both the current and previous candles comprises a significant portion of the total candle range.
Opposite Candle Condition: Ensures that the current and previous candles are of opposite types (one bullish and one bearish).
Body Size Relative to Previous Candles: Ensures that the body of the current candle is larger than the average body size of a specified number of previous candles.
Body Size Comparison: Ensures that the body of the engulfing candle is not more than 150% of the body of the previous candle.
Color Highlighting: Highlights bullish engulfing patterns in green and bearish engulfing patterns in red on the chart for easy identification.
Parameters:
tolerance (default: 0.0001): A tolerance value to account for minor price discrepancies when comparing candle open and close prices.
wick (default: 0.5): A ratio to define the significance of the candle body relative to the total candle range.
prevCandles (default: 6): Specifies the number of previous candles to consider when calculating the average body size for the body size relative condition.
Usage:
Adjust the tolerance, wick, and prevCandles parameters as needed to fine-tune the engulfing pattern detection to suit your trading style or the specific characteristics of the asset being analyzed. The script will highlight engulfing patterns on the chart, allowing for quick visual identification of potential trading opportunities based on these classic candlestick patterns.
Please note that this script is intended for educational and illustrative purposes. It should not be used as financial advice. Always conduct your own analysis and consult with a financial advisor before making any trading decisions.
Sunil Spinning Top IndicatorThe spinning top is single candlestick pattern can be used as a reversal pattern.
Long Entry ->
If formed near the support go long on the next candle crossing over the high of the spinning top candle.
Stop Loss = Low of the Spinning Top Candle
If formed near the Resistance go short on the next candle crossing under the low of the spinning top candle.
Stop Loss = High of the Spinning Top Candle
Back test and give your feedback.

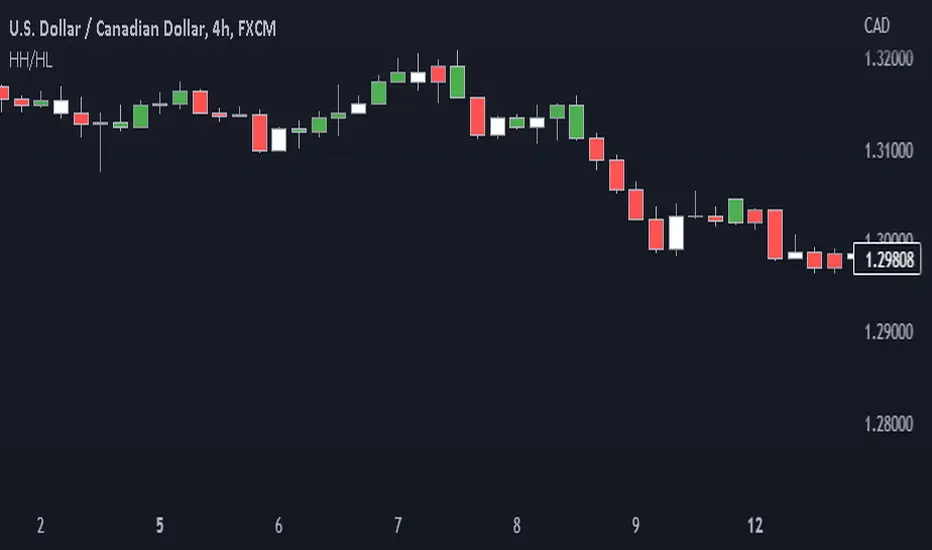
Price action: candlestick trend painter This script paints bars in different colors based on whether they are trending up or down.
It shows you if a candle is bearish or bullish based on the high and low of the previous candle.
Bull candles form higher highs (HH) and higher lows (HL) from the previous candle and are painted green.
Bear candles form lower highs (LH) and lower lows (LL) from the previous candle and are painted red.
Disclaimer
Copyright by Drbondsbody.
The information contained in my scripts/indicators/ideas does not constitute financial advice or a solicitation to buy or sell any securities of any type. I will not accept liability for any loss or damage, including without limitation any loss of profit, which may arise directly or indirectly from the use of or reliance on such information.
All investments involve risk, and the past performance of a security, industry, sector, market, financial product, trading strategy, or individual’s trading does not guarantee future results or returns. Investors are fully responsible for any investment decisions they make. Such decisions should be based solely on an evaluation of their financial circumstances, investment objectives, risk tolerance, and liquidity needs.
My scripts/indicators/ideas are only for educational purposes!
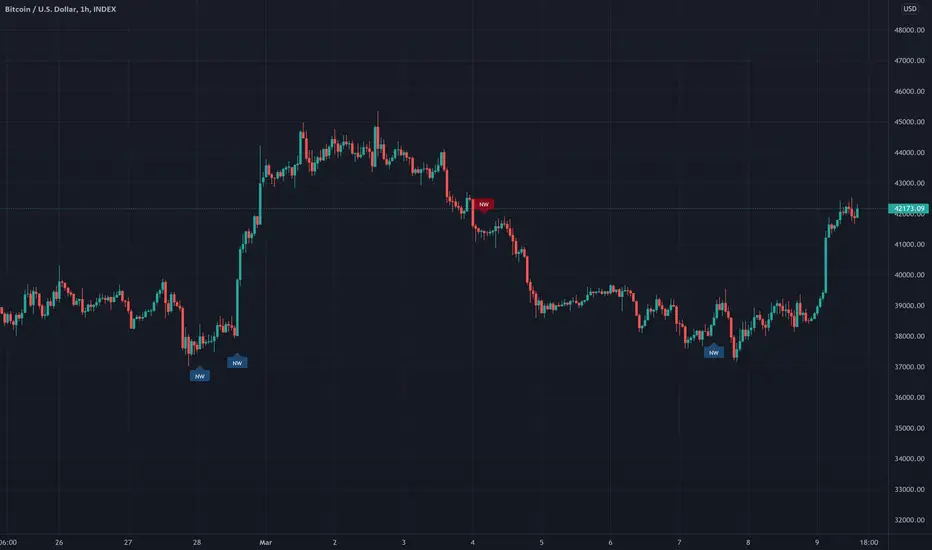
No Wick Candles [LYFTOFF-S]This indicator identifies "no wick" candles and labels them. Simple and effective candlestick analysis. Candles without wicks offer interesting trading opportunities, indicating severe momentum in a particular direction with no opposition. On higher timeframes, these can be consistently profitable signals for trades when paired with other technical analysis.
*LYFTOFF-S is part of the LYFTOFF strategy series, offering profitable and proven indicators that can be paired with our strategy template to automate trading.
Three Stars In The South ScannerAn extremely rare candlestick pattern, that's supposed to be bullish when occurring at the end of a downtrend. Personally, I've only managed to detect partial patterns with candles three and two. After adding the first candle, which is basically a Marubozu, the pattern is impossible to find. This was a request from one of my followers however, so you guys are free to examine the code and go treasure hunting!
I followed the rules from investopedia the best I could, whilst being as lenient as possible - and yet, still no detection. Super rare pattern guys.

B2 Reversal HammerA proprietary candlestick/momentum/trend indicator that spots the highest probability entry points for trades in any asset class.

Price ActionThis script is an alternative version of ChrisMoody's Price Action indicator, which is quite useful.
However, I found it a little intrusive with all the colors. I wanted something more subtle, so I made this.
The only difference is that this one uses shapes to highlight the candlestick patterns, and I dropped the Inside Bar indicator for simplicity.

Doji automatic finding scriptHi
Let me introduce my Doji automatic finding script.
This is a candlestick where the open and close are the same.
Manipulation Model [FB]GENERAL OVERVIEW:
The Manipulation Model indicator is a complete rule-based system that identifies and confirms setups from the Funded Brothers Manipulation Model. It detects large impulsive candles, called Manipulation Candles and Almost Manipulation Candles, that form around key market levels such as session highs/lows, daily, weekly, and monthly levels, or higher timeframe Fair Value Gaps (FVGs). Using this structure, the indicator automatically marks long, short, bulltrap, and beartrap setups with predefined entry, stop loss, and take profit areas.
This indicator was developed by Flux Charts in collaboration with the Funded Brothers.
ATTRIBUTION NOTICE:
This indicator incorporates concepts and source code from the indicator “MCs with Alerts” authored by @hamza_xau on TradingView. We have received full written permission from the original author to use and commercialize this code within this invite-only script.
Original script: MCs with Alerts:
What is the purpose of the indicator?:
The indicator automates detection of the Manipulation Model trading strategy setups by combining candle structure, key levels, session timing, and higher timeframe Fair Value Gaps. It removes discretion by enforcing fixed conditions for valid signals and automatically managing entry, stop-loss, and take-profit logic.
What is the theory behind the indicator?:
The indicator is built on how price interacts with major reference points such as session highs and lows, or daily and weekly levels. These levels are commonly referenced in technical analysis as areas where price previously reversed or consolidated. Manipulation Candles identify moments when price breaks past these reference points on both sides of the prior candle before closing firmly in one direction. When these candles form near higher timeframe Fair Value Gaps, it reflects price reacting inside an area that previously showed directional imbalance. The higher timeframe EMA filter aligns all detected setups with the broader market trend, allowing only signals that match the dominant direction.
MANIPULATION MODEL FEATURES:
Manipulation Candlesticks
Almost Manipulation Candlesticks
Higher Timeframe Fair Value Gaps
Sessions
Key Levels
Signals
Dashboard
Alerts
MANIPULATION CANDLESTICKS:
Manipulation Candlesticks (MCs) are candles that sweep both sides of the previous candle’s range and close outside of it. In the Manipulation Model indicator, these candles form the foundation for the long/short setups. Once one forms, the indicator checks its position relative to sessions, key levels, and higher timeframe Fair Value Gaps to determine if a valid setup exists.
🔹What is a Manipulation Candlestick?
A Manipulation Candlestick (MC) is defined by structure rather than size. It forms when price takes out both the high and low of the previous candle, then closes outside that range.
A bullish Manipulation Candle occurs when price sweeps below the previous candle’s low and then closes above the previous candle’s high.
A bearish Manipulation Candle occurs when price sweeps above the previous candle’s high and then closes below the previous candle’s low.
🔹How to interpret and use Manipulation Candlesticks:
Manipulation Candlesticks show where price made a strong one-sided move after taking both sides of the previous candle’s range. When one forms, it marks an area where buyers or sellers were likely trapped as price moved aggressively in one direction.
A bullish MC shows strong buying after a false move lower. Price sweeps below the prior low, takes out the prior high, and closes above the previous range, confirming buyers are in control.
A bearish MC shows strong selling after a false move higher than the previous candle’s high. Price sweeps above the prior high, drops below the prior low, and closes beneath the previous range, confirming sellers are dominant.
🔹How Manipulation Candlesticks are identified:
The indicator confirms Manipulation Candles using three filters once a candle closes:
Sweep Condition:
Price must take both sides of the previous candle’s range, moving above its high and below its low, before closing outside that range.
Directional Close:
A bullish MC must close above the previous high, and a bearish MC must close below the previous low.
Wick Confirmation:
A bullish MC must have a smaller upper wick (high - close) than lower wick (open - low), and a bearish MC must have a smaller lower wick (close - low) than upper wick (high - open).
Once these conditions are met at candle close, it is confirmed as a bullish or bearish Manipulation Candle.
🔹Bullish Manipulation Candle
A bullish Manipulation Candle forms when price sweeps below the previous candle’s low, then breaks above its high, and closes above it. The lower wick must be larger than the upper wick, showing little pullback as price pushed upward and confirming strong buying pressure.
🔹Bearish Manipulation Candle
A bearish Manipulation Candle forms when price sweeps above the previous candle’s high, then drops below its low, and closes beneath it. The upper wick must be larger than the lower wick, showing little pullback as price moved downward and confirming strong selling pressure.
🔹Manipulation Candle Visuals
When the indicator detects a Manipulation Candle, it automatically changes the candle’s color on the chart. Both bullish and bearish Manipulation Candles use the same color. Users can change this color in the settings by adjusting the “Manipulation Candlestick” option found under the “Style Customization” section.
The candle coloring feature can also be turned off entirely, which only removes the visual highlight from the chart and does not affect the signals or any of the indicator’s underlying logic that uses Manipulation Candlesticks.
ALMOST MANIPULATION CANDLESTICKS:
Almost Manipulation Candlesticks (AMCs) are similar to Manipulation Candles, except they close inside the previous candle’s range instead of outside it. In the Manipulation Model indicator, these candles help identify when price is showing the same sweeping behavior but hasn’t yet confirmed full displacement. They act as early warnings that a manipulation event may be developing. Just like Manipulation Candles, the indicator checks an AMC’s position relative to sessions, key levels, and higher timeframe Fair Value Gaps to determine if a valid setup exists.
🔹What is an Almost Manipulation Candlestick?
An Almost Manipulation Candlestick (AMC) forms when price sweeps both the high and low of the previous candle and closes inside that candle’s range.
A bullish AMC occurs when price sweeps below the previous low, moves above the previous high, and closes within the previous candle’s body instead of above it.
A bearish AMC occurs when price sweeps above the previous high, drops below the previous low, and closes within the previous candle’s body instead of beneath it.
🔹How to Interpret and Use Almost Manipulation Candlesticks:
Almost Manipulation Candles highlight hesitation or early signs of manipulation.
A bullish AMC indicates buyers pushed price up after sweeping lower, but price did not close decisively above the prior high.
A bearish AMC indicates sellers pushed price down after sweeping higher, but price did not close decisively below the prior low.
🔹How Almost Manipulation Candlesticks are identified:
The indicator confirms Almost Manipulation Candles using the same sweep and wick logic as Manipulation Candles, except the candle’s close must remain inside the previous candle’s range:
Sweep Condition:
Price must take both sides of the previous candle’s range, moving above its high and below its low.
Candle Close Location:
The candle’s close must stay within the prior candle’s range.
Wick Confirmation:
For a bullish AMC, the lower wick must be larger than the upper wick. For a bearish AMC, the upper wick must be larger than the lower wick.
Once these conditions are met at candle close, it is confirmed as a bullish or bearish Almost Manipulation Candle.
🔹Bullish Almost Manipulation Candle
A bullish AMC forms when price sweeps below the previous candle’s low, moves above the prior candle’s high, and closes back inside the previous candle’s range. The lower wick must be larger than the upper wick, showing that buyers defended lower prices but the move did not close decisively upward.
🔹Bearish Almost Manipulation Candle
A bearish AMC forms when price sweeps above the previous candle’s high, drops below the previous candle’s low, and closes back inside the previous candle’s range. The upper wick must be larger than the lower wick, showing that sellers rejected higher prices but the candle did not close decisively lower.
🔹Almost Manipulation Candle Visuals
When the indicator detects an Almost Manipulation Candle, it automatically changes the candle’s color on the chart. Both bullish and bearish Almost Manipulation Candles use the same color. Users can change this color in the settings by adjusting the “Almost Manipulation Candlestick” option found under the “Style Customization” section.
The candle coloring feature can also be turned off entirely, which only removes the visual highlight from the chart and does not affect the signals or any of the indicator’s underlying logic that uses Almost Manipulation Candlesticks.
HIGHER TIMEFRAME FAIR VALUE GAPS:
The Manipulation Model indicator automatically plots Fair Value Gaps from two user-selected higher timeframes.
🔹What is a Fair Value Gap?:
A Fair Value Gap (FVG) is an area where the market’s perception of fair value suddenly changes. On your chart, it appears as a three-candle pattern: a large candle in the middle, with smaller candles on each side that don’t fully overlap it. A bullish FVG forms when a bullish candle is between two smaller bullish/bearish candles, where the first and third candles’ wicks don’t overlap each other at all. A bearish FVG forms when a bearish candle is between two smaller bullish/bearish candles, where the first and third candles’ wicks don’t overlap each other at all.
Bullish & Bearish FVGs:
🔹Why are Fair Value Gaps important?:
Fair Value Gaps (FVGs) show where price moved so quickly that one side of the market never got a chance to trade. They represent sudden shifts in what traders believe something is worth, where “fair value” changed. When a large candle drives straight through an area without overlap from the candles before and after it, it means buyers or sellers were so aggressive that the market skipped that price zone entirely.
These gaps matter because they mark the moment when confidence in price changes. If price rallies and never pulls back, it signals that traders accept the new higher prices as fair and are willing to keep buying there. The same logic applies in reverse for bearish gaps. They tell you where the market re-priced aggressively and where value was last accepted.
🔹How are Fair Value Gaps used?:
Higher Timeframe FVGs are used as a confluence for all setups within the Manipulation Model indicator. The indicator automatically detects and plots these imbalances from the chosen higher timeframe onto the current chart. When a Manipulation or Almost Manipulation Candle forms near or inside a higher timeframe Fair Value Gap, it adds context to the setup. They are not trade signals by themselves but act as a supporting element that contextualizes setups.
🔹When are Higher Timeframe Fair Value Gaps mitigated?
A Higher Timeframe Fair Value Gap is considered mitigated when the selected higher timeframe closes above the gap for a bearish FVG or below the gap for a bullish FVG.
🔹Higher Timeframe FVG Settings:
Timeframe 1 / Timeframe 2:
Select up to two higher timeframes to use for Fair Value Gaps. Disabling either one removes it visually from the chart but does not affect signal generation. However, the timeframes you select will be used for signal generation logic.
For example, if you select the 1-hour and 4-hour timeframes, then the 1-hour and 4-hour FVGs will be used for signal generation logic, which is explained in the signals section below.
Combine Zones:
When enabled, overlapping FVGs on the same higher timeframe are merged into a single zone. This keeps the chart clean and prevents duplicate zones from displaying.
Midline:
Adds a center line through each higher timeframe FVG.
Labels:
Displays a “ FVG” label beside each zone. This helps users see which timeframe the FVG is detected from.
Color Customization:
Each timeframe has separate color settings for bullish and bearish FVGs. Users can adjust these colors independently for both timeframes to fit their chart layout.
FVG Display Limit:
Controls how many higher timeframe FVGs are shown at once. Only the nearest X active gaps to current price will appear, helping maintain a clear view of relevant imbalances.
SESSIONS:
The Manipulation Model indicator includes six customizable trading sessions: Asia, London, NY AM, NYSE, London Close, and NY PM. All session times and visuals are fully user-configurable. Each session has adjustable start and end times that can be set to match your preferred schedule. Users can also customize visuals for each session, including the color, opacity, and visibility of session zones.
Session highs and lows are automatically tracked and used within the indicator’s signal logic. When a Manipulation or Almost Manipulation Candle forms near a session high or low, it is recognized within the indicator’s signal detection.
Default times used for each session (in EST):
Asia: 20:00 - 00:00
London: 02:00 - 05:00
NY AM: 08:00 - 09:30
NYSE: 09:30 - 10:00
London Close: 10:00 - 11:00
NY PM: 11:00 - 14:00
🔹Session Settings:
Session Boxes:
Each session has a box that outlines its active time window. These boxes can be toggled on or off independently. When active, they visually separate each part of the trading day. Users can adjust the color and opacity of each session box.
Session Highs/Lows:
Every session can display its own high and low as horizontal lines. Users can customize the line style for session highs/lows, choosing between solid, dashed, or dotted. The color of the lines will match the same color used for the session box.
Labels and Price Display:
Labels can be toggled on for all session highs and lows. Users can adjust label color, text size, and choose whether to show the price next to the label. Users can adjust the text size, choosing between tiny, small, normal, large, and huge.
Extend Levels:
When enabled, each session’s high and low levels can be extended forward by a set number of bars.
Session Titles:
Titles for each enabled session (e.g., “Asia,” “London,” “NY AM”) can be displayed directly on the chart.
Show Last:
The “Show Last” setting allows you to choose how many recent sessions of each type appear on the chart. For example, if you only have the Asia session enabled and have this setting set to 2, the recent two Asia sessions will be displayed.
🔹Sessions Used
Under the “Sessions Used” section in the settings, users can choose which sessions are active for signal generation. Only sessions enabled here will produce signals. For example, if you want setups to form only during the London session, turn off all other sessions in this section.
Disabling a session under the main Sessions section only hides its visuals (boxes, lines, or labels). It does not impact signal detection or logic. However, changing a session’s start and end time in either section will affect signals, since signals are tied to the exact session windows defined by the user. This distinction ensures you have full control over what’s displayed visually versus what contributes to active trade signal logic.
Please Note: Signals are only detected and plotted on your chart during sessions. Signals can not be detected outside of session time windows.
KEY LEVELS:
The Manipulation Model indicator includes 10 key market levels that outline important structural price areas across daily, weekly, and monthly timeframes. These levels include the Daily Open, Previous Day High/Low, Weekly Open, Previous Week High/Low, Monthly Open, Previous Month High/Low, and Midnight Open. The levels can be enabled or disabled and customized in color and line style. These levels are used for the indicator’s signal logic.
🔹Daily Open
The Daily Open marks where the current trading day began.
🔹Previous Day High/Low
The Previous Day High (PDH) marks the highest price reached during the previous regular trading session. It shows where buyers pushed price to its highest point before the market closed. This value is automatically pulled from the daily chart and projected forward onto intraday timeframes.
The Previous Day Low (PDL) marks the lowest price reached during the previous regular trading session. It shows where selling pressure reached its lowest point before buyers stepped in. Like the PDH, this level is retrieved from the prior day’s data and extended into the current session.
🔹Weekly Open
The Weekly Open marks the first price of the current trading week.
🔹Previous Week High/Low
The Previous Week High (PWH) marks the highest price reached during the previous trading week. It shows where buying pressure reached its peak before the weekly close. This value is automatically pulled from the weekly chart and extended forward into the current week for easy reference on intraday timeframes.
The Previous Week Low (PWL) marks the lowest price reached during the previous trading week. It shows where sellers pushed price to its lowest point before buyers regained control. Like the PWH, this level is sourced from the prior week’s data and projected onto the current week’s chart.
🔹Monthly Open
The Monthly Open marks the opening price of the current month.
🔹Previous Month High/Low
The Previous Month High (PMH) marks the highest price reached during the previous calendar month. It represents the point at which buyers achieved the strongest push before the monthly close. This level is automatically retrieved from the monthly chart and extended into the new month on all lower timeframes.
The Previous Month Low (PML) marks the lowest price reached during the previous calendar month. It shows where selling pressure was strongest before buyers stepped back in. Like the PMH, this value is pulled from the prior month’s data and extended into the new month on all lower timeframes.
🔹Midnight Open
The Midnight Open marks the first price of the trading day at 00:00 EST.
🔹Customization Options:
Users can fully customize the appearance of all key levels, including the following:
Daily Levels: Daily Open, PDH, and PDL
Weekly Levels: Weekly Open, PWH, and PWL
Monthly Levels: Monthly Open, PMH, and PML
Midnight Open
Color Settings:
Each group of levels (Daily, Weekly, Monthly) shares a single color for the Open, High, and Low lines. For example, the Daily Open, PDH, and PDL all use the same color. Colors can be changed for each group, but not for individual levels within the same group.
Line Style:
Users can select a global line style, choosing between solid, dashed, or dotted, for all Daily, Weekly, and Monthly levels. This style applies to all levels within those groups. For example, the Weekly Open, PWH, and PWL must all share the same line style.
The Midnight Open has its own independent line style setting and can use a different style from the other key levels.
Show Labels:
When enabled, text labels appear to the right of each key level. Users can adjust label color, but only one label color is applied to all levels for consistency.
🔹Key Levels Used:
Under the “Key Levels Used” section, users can choose which Key Levels and Session Levels (Session Highs/Lows) are factored into signal generation. Only levels enabled here are considered within the logic that confirms setups.
Users can choose between the following levels:
Daily Open
Previous Day High/Low
Weekly Open
Previous Week High/Low
Monthly Open
Previous Month High/Low
Asia Session High/Low
London Session High/Low
NY AM Session High/Low
NY Lunch Session High/Low
NY PM Session High/Low
London Close Session High/Low
Midnight Open
For example, if you only want to see setups that form using the Daily and Weekly levels, you should only enable the Daily Open, Previous Day High/Low, Weekly Open, and Previous Week High/Low.
Disabling a level in the main “Key Levels” section only hides its visuals, while disabling it in “Key Levels Used” removes it entirely from the signal logic. Adjusting or removing any level in this section directly affects how setups are detected since the indicator references these levels when confirming Long, Short, Bulltrap, and Beartrap setups.
SIGNALS:
The Manipulation Model indicator automatically identifies Long, Short, Bulltrap, and Beartrap setups based on the interaction between Manipulation Candles (MCs), Almost Manipulation Candles (AMCs), and two main entry conditions: Key Levels and Fair Value Gaps (FVGs).
Each signal type uses the structure of a Manipulation or Almost Manipulation Candle as its foundation. When one of these candles forms and aligns with the entry conditions, the indicator automatically plots labels for an entry, stop loss (SL), and take profit (TP). Every signal follows a mechanical set of rules and is marked in real time. Once confirmed on a candle close, the signal remains fixed on the chart and does not repaint.
🔹Higher Timeframe Bias Filter
Before a signal is generated, the indicator automatically determines directional bias using the 50-period Exponential Moving Average (EMA) on the 1-hour timeframe.
If price is above the 50 EMA, only bullish setups are allowed.
If price is below the 50 EMA, only bearish setups are allowed.
🔹Stop Loss and Take Profit Logic:
For every setup, the stop loss is placed at the low of the Manipulation or Almost Manipulation Candle for bullish setups, and at the high for bearish setups. The take profit is automatically calculated at a 1:1 risk-to-reward ratio relative to that distance.
Users can adjust both the SL Multiplier and TP Multiplier in the settings, under the “General Configuration” section, to extend or contract these levels. For example, increasing the TP Multiplier to 1.5 sets the take profit at 1.5x the distance between the entry and stop loss.
🔹Signal Input Settings:
Candle Type:
Choose which candle type is used to generate signals. Options include:
Manipulation Candle (MC) only
Almost Manipulation Candle (AMC) only
Both (signals are generated from either candle type)
Entry Method:
Determines whether signals are generated based on:
Key Levels only
Fair Value Gaps only
Both (signals are generated from Key Levels AND Fair Value Gaps)
Setup Types:
You can enable or disable specific setup types. Only the selected setup types will appear on your chart:
Long Setups
Short Setups
Bulltrap Setups
Beartrap Setups
🔹Long Setup – Manipulation Candle + Key Level:
A long setup forms when a bullish Manipulation Candle touches a toggled-on key level under the “Key Levels Used” section and closes above it during a toggled-on session from the “Sessions Used” section. After the candle closes and price is above the 1-hour 50 EMA, the indicator marks:
Entry: At the close of the bullish Manipulation Candle
Stop Loss: At the low of the same candle
Take Profit: Equal distance above the entry, based on TP multiplier
In this example, a bullish MC touches the PDH during the London Session and closes above the level:
🔹Short Setup – Manipulation Candle + Key Level
A short setup forms when a bearish Manipulation Candle touches a toggled-on key level under the “Key Levels Used” section and closes below it during a toggled-on session from the “Sessions Used” section. After the candle closes and price is below the 1-hour 50 EMA, the indicator marks:
Entry: At the close of the bearish Manipulation Candle
Stop Loss: At the high of the same candle
Take Profit: Equal distance below the entry, based on the TP Multiplier
In this example, a bearish MC touches the Daily Open during the NY AM Session and closes below the level:
🔹Trap Confirmation Settings
Two settings control how bulltrap and beartrap setups are confirmed once a Manipulation or Almost Manipulation Candle forms.
Candles Between Confirmation:
This setting defines the maximum number of candles allowed between the initial Manipulation Candle and the confirmation candle that closes back in the opposite direction.
For example, if this value is set to 2, the confirmation candle must appear within two bars of the Manipulation Candle for the setup to remain valid. If too many candles form in between, the bull/bear trap setup is ignored.
Trap Wick-to-Body Ratio:
This input measures the ratio of the confirmation candle’s wick size to its body size for bulltrap and beartrap setups. Lower values require a larger body compared to the wick, meaning the confirmation candle must close more decisively. If the ratio is above the threshold set by the user, the confirmation candle for a bulltrap/beartrap setup is considered valid.
For example, if the wick is 10 points and the body is 10 points, the ratio is 1.0 (10 / 10). If the wick is 10 points and the body is 20 points, the ratio is 0.5 (10 / 20).
🔹Beartrap Setup – Manipulation Candle + Key Level
A beartrap setup forms when a bearish Manipulation Candle touches a toggled-on key level under the “Key Levels Used” section. The candle does not need to close above or below the level, it only needs to touch it. After this bearish MC forms, a confirmation candle must close back above the MC’s high during an enabled session under the “Sessions Used” section. The sweep or initial touch can occur before or outside the session, but the confirmation candle must close within an active session window.
To confirm the setup, the following conditions must be met:
The confirmation candle must close within the limit set by the Candles Between Confirmation input.
Its wick-to-body ratio must be less than or equal to the Trap Wick-to-Body Ratio input
Once these conditions are met and price is above the 1-hour 50 EMA, the indicator marks:
Entry: At the close of the confirmation candle
Stop Loss: At the low of the confirmation candle
Take Profit: Equal distance above the entry, measured 1:1 from the candle’s body and scaled by the TP Multiplier
In this example, a bearish Manipulation Candle touches the Daily Open level before price reverses and a confirmation candle closes above it. The confirmation candle occurs during the Asia Session, has a strong body with minimal wicks, meeting the Trap Wick-to-Body Ratio requirement, and it forms just two candles after the bearish MC which is within the limit set by the Candles Between Confirmation input.
🔹Bulltrap Setup – Manipulation Candle + Key Level
A bulltrap setup forms when a bullish Manipulation Candle touches a toggled-on key level under the “Key Levels Used” section. The MC does not need to close above or below the level, it only needs to touch it. After this bullish MC forms, a confirmation candle must close back below the MC’s low during an enabled session under the “Sessions Used” section. The initial key level touch from the MC can occur before or outside the session, but the confirmation candle must close within an active session window.
To confirm the setup, the following conditions must be met:
The confirmation candle must close within the limit set by the Candles Between Confirmation input.
Its wick-to-body ratio must be less than or equal to the Trap Wick-to-Body Ratio input.
Once these conditions are met and price is below the 1-hour 50 EMA, the indicator marks:
Entry: At the close of the confirmation candle
Stop Loss: At the high of the confirmation candle
Take Profit: Equal distance below the entry, measured 1:1 from the candle’s body and scaled by the TP Multiplier
In this example, a bullish Manipulation Candle touches the Daily Open level before price reverses and a confirmation candle closes below it. The confirmation candle forms during the NY AM Session, has a strong body with minimal wicks that meet the Trap Wick-to-Body Ratio requirement, and it appears two candles after the bullish MC which is within the limit defined by the Candles Between Confirmation input.
🔹Long Setup – Almost Manipulation Candle + Key Level
A long setup forms when a bullish Almost Manipulation Candle (AMC) touches a toggled-on key level under the “Key Levels Used” section and closes above it during a toggled-on session from the “Sessions Used” section. After the candle closes and price is above the 1-hour 50 EMA, the indicator marks:
Entry: At the close of the bullish Almost Manipulation Candle
Stop Loss: At the low of the same candle
Take Profit: Equal distance above the entry, based on the TP Multiplier
In this example, a bullish AMC touches the Daily Open during the NYSE Session and closes above the level.
🔹Short Setup – Almost Manipulation Candle + Key Level
A short setup forms when a bearish Almost Manipulation Candle (AMC) touches a toggled-on key level under the “Key Levels Used” section and closes below it during a toggled-on session from the “Sessions Used” section. After the candle closes and price is below the 1-hour 50 EMA, the indicator marks:
Entry: At the close of the bearish Almost Manipulation Candle
Stop Loss: At the high of the same candle
Take Profit: Equal distance below the entry, based on the TP Multiplier
In this example, a bearish AMC touches the Midnight Open during the NY AM Session and closes below the level.
🔹Beartrap Setup – Almost Manipulation Candle + Key Level
A beartrap setup forms when a bearish Almost Manipulation Candle (AMC) touches a toggled-on key level under the “Key Levels Used” section. The candle does not need to close above or below the level, it only needs to touch it. After this bearish AMC forms, a confirmation candle must close back above the AMC’s high during an enabled session under the “Sessions Used” section. The initial touch can occur before or outside the session, but the confirmation candle must close within an active session window.
To confirm the setup, the following conditions must be met:
The confirmation candle must close within the limit set by the Candles Between Confirmation input.
Its wick-to-body ratio must be less than or equal to the Trap Wick-to-Body Ratio input.
Once these conditions are met and price is above the 1-hour 50 EMA, the indicator marks:
Entry: At the close of the confirmation candle
Stop Loss: At the low of the confirmation candle
Take Profit: Equal distance above the entry, measured 1:1 from the candle’s body and scaled by the TP Multiplier
In this example, a bearish AMC touches the Midnight Open before price reverses and a confirmation candle closes above it. The confirmation candle forms during the London Session, has a large body with minimal wicks that meet the Trap Wick-to-Body Ratio requirement, and appears seven candles after the bearish AMC which is within the Candles Between Confirmation limit (10 by default).
🔹Bulltrap Setup – Almost Manipulation Candle + Key Level
A bulltrap setup forms when a bullish AMC touches a toggled-on key level under the “Key Levels Used” section. The candle does not need to close above or below the level; it only needs to touch it. After this bullish AMC forms, a confirmation candle must close back below the AMC’s low during an enabled session under the “Sessions Used” section. The initial touch can occur before or outside the session, but the confirmation candle must close within an active session window.
To confirm the setup, the following conditions must be met:
The confirmation candle must close within the limit set by the Candles Between Confirmation input.
Its wick-to-body ratio must be less than or equal to the Trap Wick-to-Body Ratio input.
Once these conditions are met and price is below the 1-hour 50 EMA, the indicator marks:
Entry: At the close of the confirmation candle
Stop Loss: At the high of the confirmation candle
Take Profit: Equal distance below the entry, measured 1:1 from the candle’s body and scaled by the TP Multiplier
In this example, a bullish AMC touches the NY Lunch Session Low before price reverses and a confirmation candle closes below it. The confirmation candle forms during the Asia Session, has a strong body with minimal wicks that meet the Trap Wick-to-Body Ratio requirement, and appears six candles after the bullish AMC which is within the Candles Between Confirmation limit.
🔹Long Setup – Manipulation Candle + Fair Value Gap
A long setup forms when a bullish Manipulation Candle touches a bullish higher timeframe Fair Value Gap (FVG) from one of the two higher timeframe inputs under the “Fair Value Gaps” section. The candle must close during an enabled session under the “Sessions Used” section. After the candle closes and price is above the 1-hour 50 EMA, the indicator marks:
Entry: At the close of the bullish Manipulation Candle
Stop Loss: At the low of the same candle
Take Profit: Equal distance above the entry, scaled by the TP Multiplier
In this example, a bullish MC taps into a bullish 1-hour FVG during the Asia Session.
🔹Short Setup – Manipulation Candle + Fair Value Gap
A short setup forms when a bearish Manipulation Candle touches a bearish higher timeframe FVG from one of the two selected higher timeframe inputs under the “Fair Value Gaps” section. The candle must also close during an enabled session under the “Sessions Used” section. After the candle closes and price is below the 1-hour 50 EMA, the indicator marks:
Entry: At the close of the bearish Manipulation Candle
Stop Loss: At the high of the same candle
Take Profit: Equal distance below the entry, scaled by the TP Multiplier
In this example, a bearish MC taps a bearish 1-hour FVG during the Asia Session.
🔹Beartrap Setup – Manipulation Candle + Fair Value Gap
A beartrap setup forms when a bearish Manipulation Candle touches a bullish or bearish higher timeframe FVG from one of the two higher timeframe inputs under the “Higher Timeframe FVG Settings” section. After the bearish MC forms, price must reverse and a confirmation candle must close above the bearish MC’s high during an enabled session under the “Sessions Used” section. The initial touch of the FVG can occur before or outside the session, but the confirmation candle must close within an active session window.
To confirm the setup, the following conditions must be met:
The confirmation candle must close within the limit set by the Candles Between Confirmation input.
Its wick-to-body ratio must be less than or equal to the Trap Wick-to-Body Ratio input.
Once these conditions are met and price is above the 1-hour 50 EMA, the indicator marks:
Entry: At the close of the confirmation candle
Stop Loss: At the low of the confirmation candle
Take Profit: Equal distance above the entry, measured 1:1 from the candle’s body and scaled by the TP Multiplier
In this example, a bearish MC taps a 1-hour bearish FVG, price reverses, and a confirmation candle closes above the bearish MC’s high. The confirmation candle forms during the London Session, has a strong body with minimal wicks that meet the Trap Wick-to-Body Ratio requirement, and appears two candles after the bearish MC which is within the Candles Between Confirmation limit.
🔹Bulltrap Setup – Manipulation Candle + Fair Value Gap
A bulltrap setup forms when a bullish MC touches a bearish or bullish higher timeframeFVG from one of the two higher timeframe inputs under the “Higher Timeframe FVG Settings” section. After the bullish MC forms, price must reverse and a confirmation candle must close below the MC’s low during an enabled session under the “Sessions Used” section. The initial touch of the FVG can occur before or outside the session, but the confirmation candle must close within an active session window.
To confirm the setup, the following conditions must be met:
The confirmation candle must close within the limit set by the Candles Between Confirmation input.
Its wick-to-body ratio must be less than or equal to the Trap Wick-to-Body Ratio input.
Once these conditions are met and price is below the 1-hour 50 EMA, the indicator marks:
Entry: At the close of the confirmation candle
Stop Loss: At the high of the confirmation candle
Take Profit: Equal distance below the entry, measured 1:1 from the candle’s body and scaled by the TP Multiplier
In this example, a bullish MC taps a 4-hour bearish FVG, price reverses, and a confirmation candle closes below the bullish MC’s low. The confirmation candle forms during the NY PM Session, has a strong body with minimal wicks that meet the Trap Wick-to-Body Ratio requirement, and appears six candles after the bullish MC which is within the Candles Between Confirmation limit.
🔹Long Setup – Almost Manipulation Candle + Fair Value Gap
A long setup forms when a bullish AMC touches a bullish higher timeframe FVG from one of the two higher timeframe inputs under the “Fair Value Gaps” section. The candle must close during an enabled session under the “Sessions Used” section. After the candle closes and price is above the 1-hour 50 EMA, the indicator marks:
Entry: At the close of the bullish AMC
Stop Loss: At the low of the same candle
Take Profit: Equal distance above the entry, scaled by the TP Multiplier
In this example, a bullish AMC taps into a bullish 1-hour FVG during the London Session.
🔹Short Setup – Almost Manipulation Candle + Fair Value Gap
A short setup forms when a bearish AMC touches a bearish higher timeframe FVG from one of the two selected higher timeframe inputs under the “Fair Value Gaps” section. The candle must also close during an enabled session under the “Sessions Used” section. After the candle closes and price is below the 1-hour 50 EMA, the indicator marks:
Entry: At the close of the bearish AMC
Stop Loss: At the high of the same candle
Take Profit: Equal distance below the entry, scaled by the TP Multiplier
In this example, a bearish AMC taps a bearish 1-hour FVG during the NY PM Session.
🔹Beartrap Setup – Almost Manipulation Candle + Fair Value Gap
A beartrap setup forms when a bearish AMC touches a bullish or bearish higher timeframe FVG from one of the two higher timeframe inputs under the “Higher Timeframe FVG Settings” section. After the bearish AMC forms, price must reverse and a confirmation candle must close above the bearish AMC’s high during an enabled session under the “Sessions Used” section. The initial touch of the FVG can occur before or outside the session, but the confirmation candle must close within an active session window.
To confirm the setup, the following conditions must be met:
The confirmation candle must close within the limit set by the Candles Between Confirmation input.
Its wick-to-body ratio must be less than or equal to the Trap Wick-to-Body Ratio input.
Once these conditions are met and price is above the 1-hour 50 EMA, the indicator marks:
Entry: At the close of the confirmation candle
Stop Loss: At the low of the confirmation candle
Take Profit: Equal distance above the entry, measured 1:1 from the candle’s body and scaled by the TP Multiplier
In this example, a bearish AMC taps a 4-hour bearish FVG, price reverses, and a confirmation candle closes above the bearish AMC’s high. The confirmation candle forms during the NY PM Session, has a strong body with minimal wicks that meet the Trap Wick-to-Body Ratio requirement, and appears seven candles after the bearish AMC, which is within the Candles Between Confirmation limit.
🔹Bulltrap Setup – Almost Manipulation Candle + Fair Value Gap
A bulltrap setup forms when a bullish AMC touches a bearish or bullish higher timeframe FVG from one of the two higher timeframe inputs under the “Higher Timeframe FVG Settings” section. After the bullish AMC forms, price must reverse and a confirmation candle must close below the AMC’s low during an enabled session under the “Sessions Used” section. The initial touch of the FVG can occur before or outside the session, but the confirmation candle must close within an active session window.
To confirm the setup, the following conditions must be met:
The confirmation candle must close within the limit set by the Candles Between Confirmation input.
Its wick-to-body ratio must be less than or equal to the Trap Wick-to-Body Ratio input.
Once these conditions are met and price is below the 1-hour 50 EMA, the indicator marks:
Entry: At the close of the confirmation candle
Stop Loss: At the high of the confirmation candle
Take Profit: Equal distance below the entry, measured 1:1 from the candle’s body and scaled by the TP Multiplier
In this example, a bullish AMC taps a 1-hour bullish FVG, price reverses, and a confirmation candle closes below the bullish AMC’s low. The confirmation candle forms during the Asia Session, has a strong body with minimal wicks that meet the Trap Wick-to-Body Ratio requirement, and appears six candles after the bullish AMC, which is within the Candles Between Confirmation limit.
🔹Signal Style Customization
The Manipulation Model indicator provides full visual customization for all signal elements, allowing users to easily adjust the appearance of entry, stop loss, and take profit labels.
Label Colors:
Users can customize the label color for Long Setups (Long and Beartrap) and Short Setups (Short and Bulltrap).
Long and Beartrap setups share the same label color.
Short and Bulltrap setups share the same label color.
Label text color can also be customized and applied globally to all signal labels.
Stop Loss (SL) and Take Profit (TP) Labels:
The SL and TP label colors can be customized independently.
Users can toggle SL Labels and TP Labels on or off. When turned off, the corresponding labels are hidden, but their levels remain active on the chart.
Entry, Stop Loss, and Take Profit Lines:
Each of these lines can be individually toggled on or off.
Entry Line: Marks the entry price level.
Stop Loss Line: Displays the SL level derived from each setup’s logic.
Take Profit Line: Displays the TP level calculated using the Take Profit Multiplier setting.
Users can also toggle the labels for each line on or off and adjust the color for each line type independently.
WIN RATE DASHBOARD:
The Win Rate Dashboard gives traders a quick way to see the recent performance of their enabled setups. It automatically calculates and displays win rates for each signal type turned on under the “General Configuration” section, based on the sessions and key levels currently active in the settings.
The dashboard updates in real time, showing both the win rate percentage and total trade count for all enabled signal types combined. It looks back at a set number of bars to calculate results, providing a simple performance snapshot directly on your chart.
How It Works:
When a signal triggers, the indicator tracks whether price first reaches the Take Profit (TP) or Stop Loss (SL) level.
A winning trade is recorded when the take profit is hit before the stop loss.
A losing trade is recorded when the stop loss is hit before the take profit.
The win rate = (Winning Trades / Total Trades) x 100
🔹Dashboard Customization:
Users can adjust the dashboard’s appearance with the following settings:
Background Color
Frame Color
Border Color
Text Color
You can also toggle the dashboard on or off from the settings menu. It appears in the top-right corner of the chart by default and its position cannot be changed.
🔹Disclaimer:
The Win Rate Dashboard provides historical performance data based on the signals and conditions you’ve enabled. These results are calculated from past bars and are not indicative of future performance or profitability.
ALERTS:
The Manipulation Model indicator includes full alert functionality powered by AnyAlert(), allowing users to receive notifications for all major setups and level breaks in real time.
Users can choose exactly which alerts they want to receive under the “Alerts” section of the settings. Once your preferred alerts are toggled on, you can create a TradingView alert using the AnyAlert() condition. This will automatically trigger alerts for all selected events as they occur on your chart.
Available Alerts:
Long Setup
Short Setup
Bulltrap Setup
Beartrap Setup
Manipulation Candle
Almost Manipulation Candle
Previous Day High/Low Break
Current Day Open Break
Previous Week High/Low Break
Current Week Open Break
Previous Month High/Low Break
Current Month Open Break
Asia Session High/Low Break
London Session High/Low Break
NY AM Session High/Low Break
NYSE Session High/Low Break
London Close Session High/Low Break
NY PM Session High/Low Break
Midnight Open Break
To receive alerts:
Open the alert creation window in TradingView
Select “Manipulation Model ” as the condition
Choose AnyAlert() from the dropdown
Create the alert
IMPORTANT NOTES:
TradingView has limitations when running features on multiple timeframes, which can result in the following restriction:
Computation Error:
The computation of using MTF features is very intensive on TradingView. This can sometimes cause calculation timeouts. When this occurs, simply force the recalculation by modifying one indicator’s settings or by removing the indicator and adding it to your chart again.
UNIQUENESS:
The Manipulation Model is unique because every setup type is fully rule-based and tied to strict structural logic. Traders can control exactly how signals form by selecting which candle types are used, which key levels and sessions are active, and whether entries trigger from Key Levels, Fair Value Gaps, or both. All setups use objective rules for confirmation, wick-to-body ratio, and higher timeframe bias. The indicator also provides full customization for visuals, alerts, and trade parameters like TP and SL multipliers. A built-in Win Rate Dashboard tracks real-time performance for all enabled setup types based on the user’s active sessions and signal filters. Together, these features make it a complete, mechanical implementation of the Funded Brothers Manipulation Model and it works across all asset classes including stocks, crypto, forex, and futures.

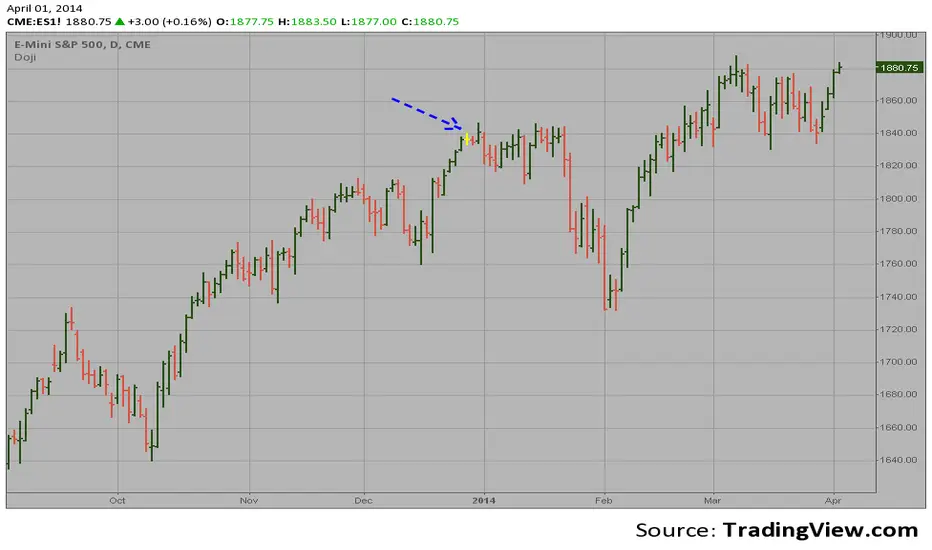
Morning & Evening Star [TradingFinder] Stock Indices Gap Candle🔵 Introduction
In "technical analysis", there are certain reversal patterns that alert us to a potential reversal of a stock's previous trajectory.
Two significant patterns in this regard are the "Morning Star" pattern and the "Evening Star" pattern, which are formed by a combination of three different candlesticks and are considered as reversal patterns.
Here, we will examine how to identify these patterns and how to respond to them.
🟣 Morning Star Pattern
This pattern forms at the end of a downtrend and indicates the beginning of an uptrend.
The pattern consists of three candlesticks in the following order :
1.A large bearish candlestick
2.A candlestick with a short body
3.A bullish candlestick
With the formation of the morning star pattern, it is expected that the stock price will change direction and continue to rise. Therefore, in such situations, it is advisable to enter a long position and follow the uptrend.
Signs of the morning star pattern :
•The first sign of this pattern is the presence of a small-bodied candlestick at the end of the trend, accompanied by a gap from the previous candlestick (a bearish candlestick with a large body). Therefore, the bodies of the first and second candlesticks do not overlap.
•The second candlestick indicates market confusion and uncertainty. The color of the middle candlestick is not significant.
•The third candlestick must be positive and have a higher price than the previous candlestick (i.e., the small-bodied candlestick).
•The closing price of the third candlestick must be higher than half of the first candlestick.
🟣 Evening Star Pattern
This pattern forms at the end of an uptrend and indicates the beginning of a downtrend.
The pattern consists of three candlesticks in the following order :
1.A large bullish candlestick
2.A candlestick with a short body
3.A bearish candlestick
With the formation of the evening star pattern, it is expected that the stock price will change direction and continue to fall. Therefore, in such situations where this pattern is identified, it is advisable to refrain from entering a long position.
If the stock is traded in a two-way market, it is possible to profit by taking a short position after the formation of the evening star pattern.
Signs of the evening star pattern :
•The first sign of this pattern is the presence of a small-bodied candlestick at the end of the trend, accompanied by a gap from the previous candlestick (a bullish candlestick with a large body). Therefore, the bodies of the first and second candlesticks do not overlap.
•The second candlestick indicates market confusion and uncertainty. The color of the middle candlestick is not significant.
•The third candlestick must be negative and have a lower price than the previous candlestick (i.e., the small-bodied candlestick).
•The closing price of the third candlestick must be lower than half of the first candlestick.
🔵 How to Use
The "Filter" and "Market" features are available in the settings section, allowing you to customize the output of the indicator according to your needs.
With the "Filter" feature, you can filter the "Morning Star" and "Evening Star" patterns as "strong" or "weak." The difference between strong and weak patterns lies in their "Candle Body."
In strong patterns, the candle bodies account for more than 80% of the total candle range, while in weak patterns, the bodies comprise between 60% to 80% of the candle range.
If the "Filter" feature is set to "On," only strong patterns will be displayed. If it's set to "Off," all patterns will be displayed. By default, it's set to "Off."
The "Market" feature allows you to include "gaps" in your pattern identification calculations. You can choose between "Forex" and "Stock" modes. In the Forex pattern, calculations are performed without considering gaps since there are fewer gaps in the Forex market.
If gap calculations were to be part of the pattern identification conditions, only a very small number of patterns would be identified. However, in the "Stock" mode, gaps are considered as part of the identification conditions.

3D Candles (Zeiierman)█ Overview
3D Candles (Zeiierman) is a unique 3D take on classic candlesticks, offering a fresh, high-clarity way to visualize price action directly on your chart. Visualizing price in alternative ways can help traders interpret the same data differently and potentially gain a new perspective.
█ How It Works
⚪ 3D Body Construction
For each bar, the script computes the candle body (open/close bounds), then projects a top face offset by a depth amount. The depth is proportional to that candle’s high–low range, so it looks consistent across symbols with different prices/precisions.
rng = math.max(1e-10, high - low ) // candle range
depthMag = rng * depthPct * factorMag // % of range, shaped by tilt amount
depth = depthMag * factorSign // direction from dev (up/down)
depthPct → how “thick” the 3D effect is, as a % of each candle’s own range.
factorMag → scales the effect based on your tilt input (dev), with a smooth curve so small tilts still show.
factorSign → applies the direction of the tilt (up or down).
⚪ Tilt & Perspective
Tilt is controlled by dev and translated into a gentle perspective factor:
slope = (4.0 * math.abs(dev)) / width
factorMag = math.pow(math.min(1.0, slope), 0.5) // sqrt softens response
factorSign = dev == 0 ? 0.0 : math.sign(dev) // direction (up/down)
Larger dev → stronger 3D presence (up to a cap).
The square-root curve makes small dev values noticeable without overdoing it.
█ How to Use
Traders can use 3D Candles just like regular candlesticks. The difference is the 3D visualization, which can broaden your view and help you notice price behavior from a fresh perspective.
⚪ Quick setup (dual-view):
Split your TradingView layout into two synchronized charts.
Right pane: keep your standard candlestick or bar chart for live execution.
Left pane: add 3D Candles (Zeiierman) to compare the same symbol/timeframe.
Observe differences: the 3D rendering can make expansion/contraction and body emphasis easier to spot at a glance.
█ Go Full 3D
Take the experience further by pairing 3D Candles (Zeiierman) with Volume Profile 3D (Zeiierman) , a perfect complement that shows where activity is concentrated, while your 3D candles show how the price unfolded.
█ Settings
Candles — How many 3D candles to draw. Higher values draw more shapes and may impact performance on slower machines.
Block Width (bars) — Visual thickness of each 3D candle along the x-axis. Larger values look chunkier but can overlap more.
Up/Down — Controls the tilt and strength of the 3D top face.
3D depth (% of range) — Thickness of the 3D effect as a percentage of each candle’s own high–low range. Larger values exaggerate the depth.
-----------------
Disclaimer
The content provided in my scripts, indicators, ideas, algorithms, and systems is for educational and informational purposes only. It does not constitute financial advice, investment recommendations, or a solicitation to buy or sell any financial instruments. I will not accept liability for any loss or damage, including without limitation any loss of profit, which may arise directly or indirectly from the use of or reliance on such information.
All investments involve risk, and the past performance of a security, industry, sector, market, financial product, trading strategy, backtest, or individual's trading does not guarantee future results or returns. Investors are fully responsible for any investment decisions they make. Such decisions should be based solely on an evaluation of their financial circumstances, investment objectives, risk tolerance, and liquidity needs.

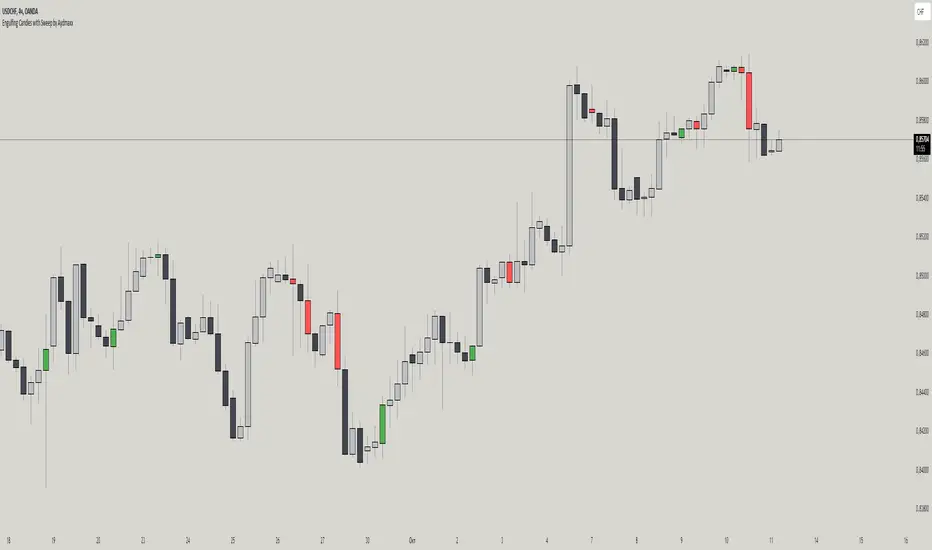
Engulfing Candles with Sweep by AydmaxxEngulfing Candles with Sweep Indicator
The "Engulfing Candles with Sweep" indicator identifies bullish and bearish engulfing candles that exhibit liquidity sweeps. It marks these significant candlestick patterns and draws a 50% Fibonacci retracement line from the high to low of the engulfing candle. The indicator helps traders spot potential reversal points where large market players might be accumulating or distributing positions.
Key Features:
Bullish Engulfing Candle with Sweep:
Identifies when a bullish candle (closing higher than it opened) engulfs the previous bearish candle (closing lower than it opened).
Ensures that the bullish candle’s low is lower than the previous candle’s low, indicating a sweep of liquidity.
Marks the identified bullish candle with a symbol below the candlestick.
Draws a 50% Fibonacci retracement line from the high to the low of the bullish engulfing candle.
Bearish Engulfing Candle with Sweep:
Identifies when a bearish candle (closing lower than it opened) engulfs the previous bullish candle (closing higher than it opened).
Ensures that the bearish candle’s high is higher than the previous candle’s high, indicating a sweep of liquidity.
Marks the identified bearish candle with a symbol above the candlestick.
Draws a 50% Fibonacci retracement line from the high to the low of the bearish engulfing candle.
Customizable Settings:
Fibonacci Line Color: Allows customization of the Fibonacci retracement line color for both bullish and bearish engulfing candles.
Fibonacci Line Style: Provides options to choose the line style (solid, dotted, dashed).
Fibonacci Line Width: Enables adjustment of the line width for better visibility.
Toggle Fibonacci Lines: Option to enable or disable the display of Fibonacci retracement lines.
How to Use:
Apply the indicator to your chart.
Look for symbols below or above the candlesticks, indicating bullish or bearish engulfing candles with liquidity sweeps.
Utilize the 50% Fibonacci retracement lines to identify potential support or resistance levels.
Benefits:
Helps in identifying key reversal patterns in the market.
Provides visual aids with Fibonacci retracement levels for potential entry and exit points.
Enhances trading decisions by confirming engulfing patterns with liquidity sweeps.
Imbalance IndicatorDescription of the "Imbalance Indicator":
The Imbalance Indicator is a technical analysis tool designed to visualize the imbalance between two adjacent candlesticks on a price chart by drawing rectangles. It helps to identify the dominance of buyers or sellers during impulsive price movements within an upward or downward trend.
Here's how the indicator works:
1. It determines the direction of the trend (up or down) based on the closing prices of the last three candlesticks. An upward trend is identified if all three candlesticks close above their opening prices, while a downward trend is identified if they close below.
2. Depending on the direction of the trend, the indicator calculates the imbalance between the candlesticks. The imbalance is expressed as the difference between the low of the next candlestick and the high of the previous one for an upward trend, or between the low of the previous candlestick and the high of the next one for a downward trend. The imbalance value must be greater than 0.
3. If an imbalance is detected, the indicator draws a rectangle on the chart. The rectangle begins on the candlestick with the identified imbalance, with the upper boundary at the upper edge of the imbalance and the lower boundary at the lower edge of the imbalance.
4. The color of the rectangle depends on the direction of the trend: green for an upward trend and red for a downward trend.
5. The rectangle dynamically extends to the right until it is intersected by subsequent candlesticks by 50% or more (by default). The intersection can occur with various combinations (shadow, body, or shadow + body of the candlestick). Once this happens, the rectangle ends on the last overlapping candlestick. The percentage of overlap in height is adjustable within a range of 1 to 100, with a default value of 50%.
Use the Imbalance Indicator to identify areas of probable price reversal. Algorithms tend to cover the imbalance and trade within the range where it formed, creating a potential magnet for the price.
==RUS=======================================
Описание индикатора "Imbalance Indicator":
Imbalance Indicator - это индикатор, предназначенный для визуализации имбаланса между двумя соседними свечами на графике путем рисования прямоугольников. Он помогает определить доминирование покупателей или продавцов во время импульсного движение цены на восходящем или нисходящем тренде.
Вот как работает индикатор:
1. Он определяет направление тренда (вверх или вниз) на основе закрытия последних трех свечей. Тренд вверх определяется, если все три свечи закрылись выше своих открытий, а тренд вниз - если ниже.
2. В зависимости от направления тренда, индикатор вычисляет имбаланс между свечами. Имбаланс выражается в виде разницы между низом следующей свечи и верхом предыдущей свечи для восходящего тренда или между низом предыдущей свечи и верхом следующей свечи для нисходящего тренда. Значение имбаланса должно быть больше 0.
3. Если имбаланс обнаружен, индикатор рисует прямоугольник на графике. Прямоугольник начинается на свече с найденным имбалансом, верхняя граница прямоугольника находится на верхней границе имбаланса, а нижняя граница - на нижней границе имбаланса.
4. Цвет прямоугольника зависит от направления тренда: зеленый для восходящего тренда и красный для нисходящего тренда.
5. Прямоугольник продолжается вправо динамически, пока его не пересекут следующие свечи на 50% или более (по умолчанию). Пересечение может произойти различными комбинациями (тень, тело или тень + тело свечи). Как только это происходит, прямоугольник заканчивается на последней перекрывающей его свече. Процент перекрытия по высоте настраивается в интервале от 1 до 100, по умолчанию значение 50%.
Используйте Imbalance Indicator для определения зон вероятного возврата цены. Алгоритмы стремятся перекрыть имбаланс и проторговать диапазон, в котором он образовался, это потенциальный магнит для цены.

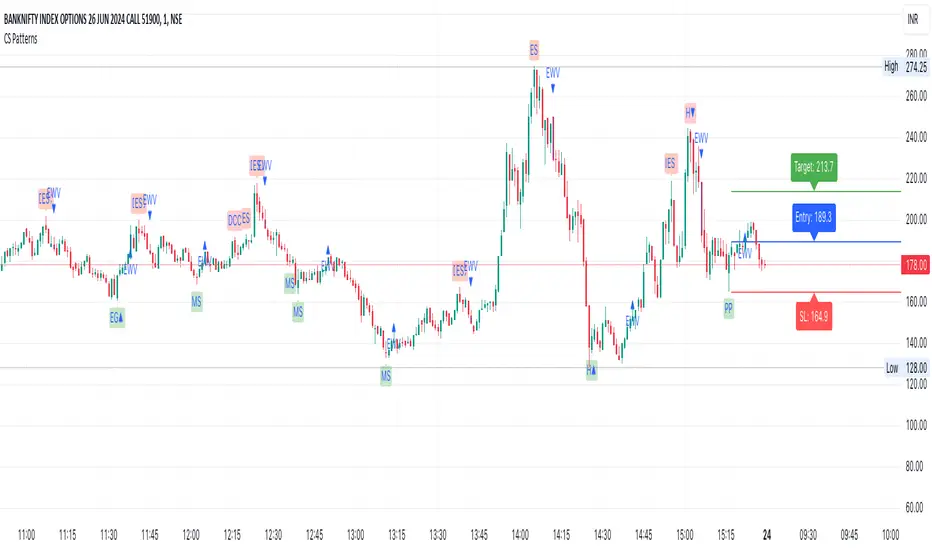
CS PatternsOverview
The CS Patterns indicator is designed to identify and highlight various candlestick patterns on a trading chart. Candlestick patterns are a crucial tool for traders as they help in predicting market movements and potential reversals. This indicator includes single, double, and triple candlestick patterns without revealing the source code, making it an ideal tool for traders who want to utilize advanced pattern recognition while keeping the script proprietary.
Candlestick Patterns Included
Single Candlestick Patterns
Bullish Hammer:
Found at the bottom of a downtrend.
Features a small body, long lower shadow, and little to no upper shadow.
Indicates potential reversal to an uptrend.
Bearish Hanging Man:
Found at the top of an uptrend.
Similar structure to the Bullish Hammer but indicates a potential reversal to a downtrend.
Bullish Inverted Hammer:
Found at the bottom of a downtrend.
Features a small body, long upper shadow, and little to no lower shadow.
Suggests a potential reversal to an uptrend.
Bearish Shooting Star:
Found at the top of an uptrend.
Indicates a potential reversal to a downtrend.
Dragonfly Doji:
Small or non-existent upper shadow and long lower shadow.
Indicates a potential reversal when found at the bottom of a trend.
Gravestone Doji:
Long upper shadow and small or non-existent lower shadow.
Indicates a potential reversal when found at the top of a trend.
Standard Doji:
Very small body, indicates indecision in the market.
Can signal reversals when found at the tops or bottoms of trends.
Long-Legged Doji:
Long upper and lower shadows with a small body.
Indicates a potential market reversal.
Double Candlestick Patterns
Bullish Engulfing:
A smaller bearish candle followed by a larger bullish candle that engulfs it.
Indicates a potential reversal to an uptrend.
Bearish Engulfing:
A smaller bullish candle followed by a larger bearish candle that engulfs it.
Indicates a potential reversal to a downtrend.
Bullish Harami:
A large bearish candle followed by a smaller bullish candle within its range.
Indicates a potential reversal to an uptrend.
Bearish Harami:
A large bullish candle followed by a smaller bearish candle within its range.
Indicates a potential reversal to a downtrend.
Bullish Piercing Line:
A bearish candle followed by a bullish candle that closes above the midpoint of the previous candle.
Indicates a potential reversal to an uptrend.
Bearish Dark Cloud Cover:
A bullish candle followed by a bearish candle that closes below the midpoint of the previous candle.
Indicates a potential reversal to a downtrend.
Bullish Inside Bar:
A smaller bullish or bearish candle completely within the range of the previous bearish candle.
Indicates a potential continuation or reversal to an uptrend.
Bearish Inside Bar:
A smaller bullish or bearish candle completely within the range of the previous bullish candle.
Indicates a potential continuation or reversal to a downtrend.
Triple Candlestick Patterns
Bullish Morning Star:
A bearish candle followed by a smaller-bodied candle (bullish or bearish), and then a larger bullish candle.
Indicates a potential reversal to an uptrend.
Bearish Evening Star:
A bullish candle followed by a smaller-bodied candle (bullish or bearish), and then a larger bearish candle.
Indicates a potential reversal to a downtrend.
How to Use?
Adding the Indicator:
Open TradingView and go to the Pine Script Editor.
Copy and paste the provided code into a new script.
Save and add the script to your chart.
Interpreting the Signals:
The indicator will highlight the patterns on the chart with specific labels.
Use these visual cues to make informed trading decisions based on potential reversals or continuations indicated by the patterns.
Customizing the Settings:
The indicator allows for customization of various settings through input options.
Adjust these settings according to your trading strategy and preferences.