Refined MA + Engulfing (M5 + Confirmed Structure Break)I would like to start by saying that this strategy was put together using ChatGPT, some past trades from myself and some backtested trades, and from my time as a student in Wallstreet Academy under Cue Banks.
I am not profitable yet. I am too jumpy and blow accounts. I'm hoping this strategy (and it's indicator twin) can help me spend less time on the charts, so that I'm not tempted to press buttons as much.
It does fire quite a bit. But, the Strategy Tester tab shows a 30% win rate with our wins being significant to our losses. So, in theory, if you followed the rules of this strategy STRICTLY, you COULD BE profitable.
With that being said, there are times that this strategy has shown to trigger and I ask, "Why?".
I just want to help myself and others, and maybe make some decent\cool stuff along the way. Enjoy
KR
Search in scripts for "Candlestick"

Swing FX Pro Panel v1Description:
"Swing FX Pro Panel v1" is a professional swing trading strategy tailored for the Forex market and other highly liquid assets. The core logic is based on the crossover of two Exponential Moving Averages (EMA), allowing the strategy to detect trend shifts and generate precise entry signals.
The script includes an interactive performance panel that dynamically displays:
initial capital,
risk per trade (%),
the number of trades taken during a selected period (e.g., 6 months),
win/loss statistics,
ROI (Return on Investment),
maximum drawdown,
win ratio.

LANZ Strategy 5.0 [Backtest]🔷 LANZ Strategy 5.0 — Rule-Based BUY Logic with Time Filter, Session Limits and Auto SL/TP Execution
This is the backtest version of LANZ Strategy 5.0, built as a strategy script to evaluate real performance under fixed intraday conditions. It automatically places BUY and SELL trades based on structured candle confirmation, EMA trend alignment, and session-based filters. The system simulates real-time execution with precise Stop Loss and Take Profit levels.
📌 Built for traders seeking to simulate clean intraday logic with fully automated entries and performance metrics.
🧠 Core Logic & Strategy Conditions
✅ BUY Signal Conditions:
Price is above the EMA200
The last 3 candles are bullish (close > open)
The signal occurs within the defined session window (NY time)
Daily trade limit has not been exceeded
If all are true, a BUY order is executed at market, with SL and TP set immediately.
🔻 SELL Signal Conditions (Optional):
Exactly inverse to BUY (below EMA + 3 bearish candles). Disabled by default.
🕐 Operational Time Filter (New York Time)
You can fully customize your intraday window:
Start Time: e.g., 01:15 NY
End Time: e.g., 16:00 NY
The system evaluates signals only within this range, even across midnight if configured.
🔁 Trade Management System
One trade at a time per signal
Trades include a Stop Loss (SL) and Take Profit (TP) based on pip distance
Trade result is calculated automatically
Each signal is shown with a triangle marker (BUY only, by default)
🧪 Backtest Accuracy
This version uses:
strategy.order() for entries
strategy.exit() for SL and TP
strategy.close_all() at the configured manual closing time
This ensures realistic behavior in the TradingView strategy tester.
⚙️ Flow Summary (Step-by-Step)
On every bar, check:
Is the time within the operational session?
Is the price above the EMA?
Are the last 3 candles bullish?
If conditions met → A BUY trade is opened:
SL = entry – X pips
TP = entry + Y pips
Trade closes:
If SL or TP is hit
Or at the configured manual close time (e.g., 16:00 NY)
📊 Settings Overview
Timeframe: 1-hour (ideal)
SL/TP: Configurable in pips
Max trades/day: User-defined (default = 99 = unlimited)
Manual close: Adjustable by time
Entry type: Market (not limit)
Visuals: Plotshape triangle for BUY entry
👨💻 Credits:
💡 Developed by: LANZ
🧠 Strategy logic & execution: LANZ
✅ Designed for: Clean backtesting, clarity in execution, and intraday logic simulation

Pullback Pro Dow Strategy v7 (ADX Filter)
### **Strategy Description (For TradingView)**
#### **Title:** Pullback Pro: Dow Theory & ADX Strategy
---
#### **1. Summary**
This strategy is designed to identify and trade pullbacks within an established trend, based on the core principles of Dow Theory. It uses market structure (pivot highs and lows) to determine the trend direction and an Exponential Moving Average (EMA) to pinpoint pullback entry opportunities.
To enhance trade quality and avoid ranging markets, an ADX (Average Directional Index) filter is integrated to ensure that entries are only taken when the trend has sufficient momentum.
---
#### **2. Core Logic: How It Works**
The strategy's logic is broken down into three main steps:
**Step 1: Trend Determination (Dow Theory)**
* The primary trend is identified by analyzing recent pivot points.
* An **Uptrend** is confirmed when the script detects a pattern of higher highs and higher lows (HH/HL).
* A **Downtrend** is confirmed by a pattern of lower highs and lower lows (LH/LL).
* If neither pattern is present, the strategy considers the market to be in a range and will not seek trades.
**Step 2: Entry Signal (Pullback to EMA)**
* Once a clear trend is established, the strategy waits for a price correction.
* **Long Entry:** In a confirmed uptrend, a long position is initiated when the price pulls back and crosses *under* the specified EMA.
* **Short Entry:** In a confirmed downtrend, a short position is initiated when the price rallies and crosses *over* the EMA.
**Step 3: Confirmation & Risk Management**
* **ADX Filter:** To ensure the trend is strong enough to trade, an entry signal is only validated if the ADX value is above a user-defined threshold (e.g., 25). This helps filter out weak signals during choppy or consolidating markets.
* **Stop Loss:** The initial Stop Loss is automatically and logically placed at the last market structure point:
* For long trades, it's placed at the `lastPivotLow`.
* For short trades, it's placed at the `lastPivotHigh`.
* **Take Profit:** Two Take Profit levels are calculated based on user-defined Risk-to-Reward (R:R) ratios. The strategy allows for partial profit-taking at the first target (TP1), moving the remainder of the position to the second target (TP2).
---
#### **3. Input Settings Explained**
**① Dow Theory Settings**
* **Pivot Lookback Period:** Determines the sensitivity for detecting pivot highs and lows. A smaller number makes it more sensitive to recent price swings; a larger number focuses on more significant, longer-term pivots.
**② Entry Logic (Pullback)**
* **Pullback EMA Length:** Sets the period for the Exponential Moving Average used to identify pullback entries.
**③ Risk & Exit Management**
* **Take Profit 1 R:R:** Sets the Risk-to-Reward ratio for the first take-profit target.
* **Take Profit 1 (%):** The percentage of the position to be closed when TP1 is hit.
* **Take Profit 2 R:R:** Sets the Risk-to-Reward ratio for the final take-profit target.
**④ Filters**
* **Use ADX Trend Filter:** A master switch to enable or disable the ADX filter.
* **ADX Length:** The lookback period for the ADX calculation.
* **ADX Threshold:** The minimum ADX value required to confirm a trade signal. Trades will only be placed if the ADX is above this level.
---
#### **4. Best Practices & Recommendations**
* This is a trend-following system. It is designed to perform best in markets that exhibit clear, sustained trending behavior.
* It may underperform in choppy, sideways, or strongly ranging markets. The ADX filter is designed to help mitigate this, but no filter is perfect.
* **Crucially, you must backtest this strategy thoroughly** on your preferred financial instrument and timeframe before considering any live application.
* Experiment with the `Pivot Lookback Period`, `Pullback EMA Length`, and `ADX Threshold` to optimize performance for a specific market's characteristics.
---
#### **DISCLAIMER**
This script is provided for educational and informational purposes only. It does not constitute financial advice. All trading involves a high level of risk, and past performance is not indicative of future results. You are solely responsible for your own trading decisions. The author assumes no liability for any financial losses you may incur from using this strategy. Always conduct your own research and due diligence.

Multi-Confluence Swing Hunter V1# Multi-Confluence Swing Hunter V1 - Complete Description
Overview
The Multi-Confluence Swing Hunter V1 is a sophisticated low timeframe scalping strategy specifically optimized for MSTR (MicroStrategy) trading. This strategy employs a comprehensive point-based scoring system that combines optimized technical indicators, price action analysis, and reversal pattern recognition to generate precise trading signals on lower timeframes.
Performance Highlight:
In backtesting on MSTR 5-minute charts, this strategy has demonstrated over 200% profit performance, showcasing its effectiveness in capturing rapid price movements and volatility patterns unique to MicroStrategy's trading behavior.
The strategy's parameters have been fine-tuned for MSTR's unique volatility characteristics, though they can be optimized for other high-volatility instruments as well.
## Key Innovation & Originality
This strategy introduces a unique **dual scoring system** approach:
- **Entry Scoring**: Identifies swing bottoms using 13+ different technical criteria
- **Exit Scoring**: Identifies swing tops using inverse criteria for optimal exit timing
Unlike traditional strategies that rely on simple indicator crossovers, this system quantifies market conditions through a weighted scoring mechanism, providing objective, data-driven entry and exit decisions.
## Technical Foundation
### Optimized Indicator Parameters
The strategy utilizes extensively backtested parameters specifically optimized for MSTR's volatility patterns:
**MACD Configuration (3,10,3)**:
- Fast EMA: 3 periods (vs standard 12)
- Slow EMA: 10 periods (vs standard 26)
- Signal Line: 3 periods (vs standard 9)
- **Rationale**: These faster parameters provide earlier signal detection while maintaining reliability, particularly effective for MSTR's rapid price movements and high-frequency volatility
**RSI Configuration (21-period)**:
- Length: 21 periods (vs standard 14)
- Oversold: 30 level
- Extreme Oversold: 25 level
- **Rationale**: The 21-period RSI reduces false signals while still capturing oversold conditions effectively in MSTR's volatile environment
**Parameter Adaptability**: While optimized for MSTR, these parameters can be adjusted for other high-volatility instruments. Faster-moving stocks may benefit from even shorter MACD periods, while less volatile assets might require longer periods for optimal performance.
### Scoring System Methodology
**Entry Score Components (Minimum 13 points required)**:
1. **RSI Signals** (max 5 points):
- RSI < 30: +2 points
- RSI < 25: +2 points
- RSI turning up: +1 point
2. **MACD Signals** (max 8 points):
- MACD below zero: +1 point
- MACD turning up: +2 points
- MACD histogram improving: +2 points
- MACD bullish divergence: +3 points
3. **Price Action** (max 4 points):
- Long lower wick (>50%): +2 points
- Small body (<30%): +1 point
- Bullish close: +1 point
4. **Pattern Recognition** (max 8 points):
- RSI bullish divergence: +4 points
- Quick recovery pattern: +2 points
- Reversal confirmation: +4 points
**Exit Score Components (Minimum 13 points required)**:
Uses inverse criteria to identify swing tops with similar weighting system.
## Risk Management Features
### Position Sizing & Risk Control
- **Single Position Strategy**: 100% equity allocation per trade
- **No Overlapping Positions**: Ensures focused risk management
- **Configurable Risk/Reward**: Default 5:1 ratio optimized for volatile assets
### Stop Loss & Take Profit Logic
- **Dynamic Stop Loss**: Based on recent swing lows with configurable buffer
- **Risk-Based Take Profit**: Calculated using risk/reward ratio
- **Clean Exit Logic**: Prevents conflicting signals
## Default Settings Optimization
### Key Parameters (Optimized for MSTR/Bitcoin-style volatility):
- **Minimum Entry Score**: 13 (ensures high-conviction entries)
- **Minimum Exit Score**: 13 (prevents premature exits)
- **Risk/Reward Ratio**: 5.0 (accounts for volatility)
- **Lower Wick Threshold**: 50% (identifies true hammer patterns)
- **Divergence Lookback**: 8 bars (optimal for swing timeframes)
### Why These Defaults Work for MSTR:
1. **Higher Score Thresholds**: MSTR's volatility requires more confirmation
2. **5:1 Risk/Reward**: Compensates for wider stops needed in volatile markets
3. **Faster MACD**: Captures momentum shifts quickly in fast-moving stocks
4. **21-period RSI**: Reduces noise while maintaining sensitivity
## Visual Features
### Score Display System
- **Green Labels**: Entry scores ≥10 points (below bars)
- **Red Labels**: Exit scores ≥10 points (above bars)
- **Large Triangles**: Actual trade entries/exits
- **Small Triangles**: Reversal pattern confirmations
### Chart Cleanliness
- Indicators plotted in separate panes (MACD, RSI)
- TP/SL levels shown only during active positions
- Clear trade markers distinguish signals from actual trades
## Backtesting Specifications
### Realistic Trading Conditions
- **Commission**: 0.1% per trade
- **Slippage**: 3 points
- **Initial Capital**: $1,000
- **Account Type**: Cash (no margin)
### Sample Size Considerations
- Strategy designed for 100+ trade sample sizes
- Recommended timeframes: 4H, 1D for swing trading
- Optimal for trending/volatile markets
## Strategy Limitations & Considerations
### Market Conditions
- **Best Performance**: Trending markets with clear swings
- **Reduced Effectiveness**: Highly choppy, sideways markets
- **Volatility Dependency**: Optimized for moderate to high volatility assets
### Risk Warnings
- **High Allocation**: 100% position sizing increases risk
- **No Diversification**: Single position strategy
- **Backtesting Limitation**: Past performance doesn't guarantee future results
## Usage Guidelines
### Recommended Assets & Timeframes
- **Primary Target**: MSTR (MicroStrategy) - 5min to 15min timeframes
- **Secondary Targets**: High-volatility stocks (TSLA, NVDA, COIN, etc.)
- **Crypto Markets**: Bitcoin, Ethereum (with parameter adjustments)
- **Timeframe Optimization**: 1min-15min for scalping, 30min-1H for swing scalping
### Timeframe Recommendations
- **Primary Scalping**: 5-minute and 15-minute charts
- **Active Monitoring**: 1-minute for precise entries
- **Swing Scalping**: 30-minute to 1-hour timeframes
- **Avoid**: Sub-1-minute (excessive noise) and above 4-hour (reduces scalping opportunities)
## Technical Requirements
- **Pine Script Version**: v6
- **Overlay**: Yes (plots on price chart)
- **Additional Panes**: MACD and RSI indicators
- **Real-time Compatibility**: Confirmed bar signals only
## Customization Options
All parameters are fully customizable through inputs:
- Indicator lengths and levels
- Scoring thresholds
- Risk management settings
- Visual display preferences
- Date range filtering
## Conclusion
This scalping strategy represents a comprehensive approach to low timeframe trading that combines multiple technical analysis methods into a cohesive, quantified system specifically optimized for MSTR's unique volatility characteristics. The optimized parameters and scoring methodology provide a systematic way to identify high-probability scalping setups while managing risk effectively in fast-moving markets.
The strategy's strength lies in its objective, multi-criteria approach that removes emotional decision-making from scalping while maintaining the flexibility to adapt to different instruments through parameter optimization. While designed for MSTR, the underlying methodology can be fine-tuned for other high-volatility assets across various markets.
**Important Disclaimer**: This strategy is designed for experienced scalpers and is optimized for MSTR trading. The high-frequency nature of scalping involves significant risk. Past performance does not guarantee future results. Always conduct your own analysis, consider your risk tolerance, and be aware of commission/slippage costs that can significantly impact scalping profitability.

Aftershock Playbook: Stock Earnings Drift EngineStrategy type
Event-driven post-earnings momentum engine (long/short) built for single-stock charts or ADRs that publish quarterly results.
What it does
Detects the exact earnings bar (request.earnings, lookahead_off).
Scores the surprise and launches a position on that candle’s close.
Tracks PnL: if the first leg closes green, the engine automatically re-enters on the very next bar, milking residual drift.
Blocks mid-cycle trades after a loss until the next earnings release—keeping the risk contained to one cycle.
Think of it as a sniper that fires on the earnings pop, reloads once if the shot lands, then goes silent until the next report.
Core signal inputs
Component Default Purpose
EPS Surprise % +0 % / –5 % Minimum positive / negative shock to trigger longs/shorts.
Reverse signals? Off Quick flip for mean-reversion experiments.
Time Risk Mgt. Off Optional hard exit after 45 calendar days (auto-scaled to any TF).
Risk engine
ATR-based stop (ATR × 2 by default, editable).
Bar time stop (15-min → Daily: Have to select the bar value ).
No pyramiding beyond the built-in “double-tap”.
All positions sized as % of equity via Strategy Properties.
Visual aids
Yellow triangle marks the earnings bar.
Diagnostics table (top-right) shows last Actual, Estimate, and Surprise %.
Status-line tool-tips on every input.
Default inputs
Setting Value
Positive surprise ≥ 0 %
Negative surprise ≤ –5 %
ATR stop × 2
ATR length 50
Hold horizon 350 ( 1h timeframe chart bars)
Back-test properties
Initial capital 10 000
Order size 5 % of equity
Pyramiding 1 (internal re-entry only)
Commission 0.03 %
Slippage 5 ticks
Fills Bar magnifier ✔ · On bar close ✔ · Standard OHLC ✔
How to use
Add the script to any earnings-driven stock (AAPL, MSFT, TSLA…).
Turn on Time Risk Management if you want stricter risk management
Back-test different ATR multipliers to fit the stock’s volatility.
Sync commission & slippage with your broker before forward-testing.
Important notes
Works on every timeframe from 15 min to 1 D. Sweet spot around 30min/1h
All request.earnings() & request.security() calls use lookahead_off—zero repaint.
The “double-tap” re-entry occurs once per winning cycle to avoid drift-chasing loops.
Historical stats ≠ future performance. Size positions responsibly.

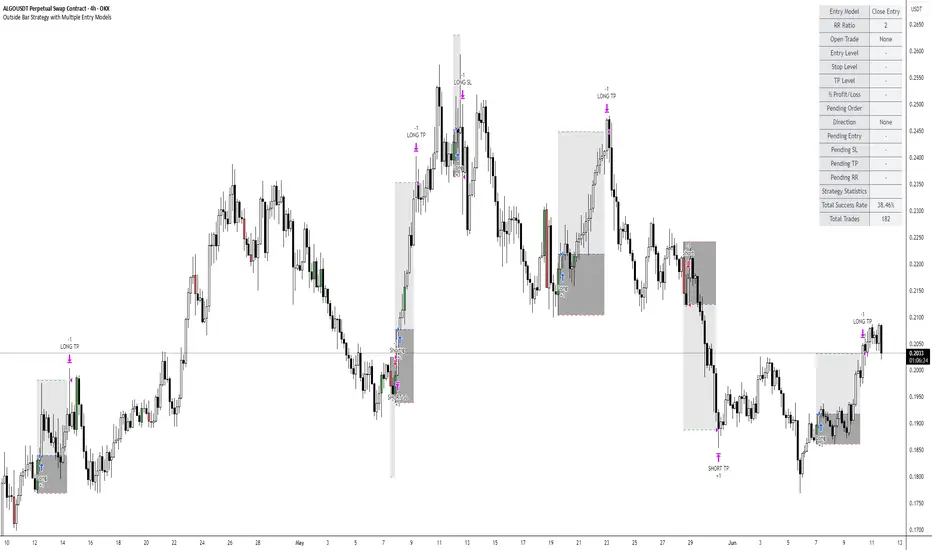
Outside Bar Strategy with Multiple Entry ModelsOutside Bar Strategy with Multiple Entry Models
This Pine Script strategy implements a versatile trading system based on the Outside Bar pattern, offering three distinct entry models: Close Entry, High/Low Entry, and Midpoint Entry. Designed for traders seeking flexibility, the strategy includes customizable risk/reward ratios, an optional EMA trend filter, and enhanced visualization with line fills.
Key Features:
Entry Models:
Close Entry: Enters a long position when the current candle closes above the high of the previous outside bullish bar . For short, it enters when the candle closes below the low of the previous outside bearish bar.
High/Low Entry: Enters a long position when the price crosses above the high of the previous outside bullish bar . For short, it enters when the price crosses below the low of the previous outside bearish bar .
Midpoint Entry: Places a limit order at the midpoint of the previous outside bar, entering when the price reaches this level.
EMA Trend Filter: Optionally filters signals based on the alignment of EMAs (7 > 25 > 99 > 200 for long, 7 < 25 < 99 < 200 for short). Can be toggled via the Use EMA Filter input.
Risk/Reward Management: Configurable risk/reward ratio (default 2.0) with stop-loss set at the low/high of the outside bar and take-profit calculated based on the bar's range multiplied by the ratio.
Visualization:
Lines for entry, stop-loss, and take-profit levels (dashed for active trades, solid for pending Midpoint Entry orders).
Line fills: Red between entry and stop-loss, green between entry and take-profit.
Previous lines and fills persist on the chart for historical reference (line deletion disabled).
Pending limit orders for Midpoint Entry extend dynamically to the right until triggered or canceled.
Information Table: Displays real-time trade details (entry model, RR ratio, open trade status, entry/stop/take-profit levels, profit/loss percentage) and strategy statistics (success rate, total trades). For Midpoint Entry, pending order details are shown.
Inputs:
Entry Model: Choose between Close Entry, High/Low Entry, or Midpoint Entry (default: Close Entry).
Risk/Reward Ratio: Set the RR ratio (default: 2.0, step: 0.5).
Use EMA Filter: Enable/disable the EMA trend filter (default: true).
Line Colors and Style: Customize colors for entry, stop-loss, and take-profit lines, and select line style (solid or dashed).
Table Settings: Adjust table text color, size (small/normal/large), and position (right top/middle/bottom).
Disclaimer: This strategy is for educational purposes only. Backtest thoroughly and use at your own risk. Past performance is not indicative of future results.
SDR Market Structure (liv3) 1.0🧠 SDR Market Structure (LIV3) v1.0
Precision-Based Market Structure & Momentum Scalping
Strategy Type: Market Structure-Based Scalping
Built For: Intraday, Scalping, Trend-Following or Reversal entries with confirmation filters
Assets: All (optimized for FX and indices)
Timeframes: 1min to 15min (ideal for scalping); higher TFs can be used for structure alignment
🎯 Strategy Overview
SDR Market Structure is a robust scalping strategy that combines structural market context (Change-of-Character, Break of Structure) with a modular system of technical filters that advanced traders can toggle on/off. The strategy is adaptable and surgical, designed to find high-probability trade entries during momentum shifts, liquidity grabs, and trend continuations.
This script supports fine-tuned risk management, multiple confirmation layers, and intraday session filtering, allowing experienced traders to tailor it for precision-based trading in varying volatility regimes.
🔍 Core Logic: CHoCH and Market Structure
At the heart of SDR Scalper is Change-of-Character (CHoCH) detection:
Bullish CHoCH: Occurs when price breaks above a recent swing high (pivot) after making a lower low, implying a potential reversal or continuation.
Bearish CHoCH: Triggers when price breaks below a recent swing low after making a higher high.
Once a CHoCH is identified:
Entry is confirmed only if all selected filters pass, ensuring high-confidence setups.
SL is placed at the most recent swing low/high or an optional looser SL based on fractals.
Break-even logic moves SL to entry upon hitting 1R.
Risk-Reward ratio is fully customizable.
🛠️ Advanced Filter Modules
Each filter module below can be toggled independently, allowing for custom filtering strategies based on trading conditions.
1️⃣ HTF EMA Filter
Purpose: Confirms trend bias using a higher timeframe EMA (e.g., 55 EMA on 15-min TF).
Logic:
Longs: Entry only allowed if price > HTF EMA
Shorts: Entry only allowed if price < HTF EMA
Why Use It: Prevents counter-trend trades. Excellent when used during trending sessions.
Best Paired With: EMA crossover filter or RSI for intraday trend alignment.
2️⃣ EMA Crossover Filter
Inputs: Fast EMA (default 10), Slow EMA (default 50)
Logic:
Longs: Fast EMA must be above Slow EMA
Shorts: Fast EMA below Slow EMA
Enhancement: Adds a moving average structure filter to CHoCH. Good for filtering false breakouts during sideways markets.
Combo Tip: Use alongside RSI/MACD filters to confirm trend momentum.
3️⃣ RSI Filter
Default Period: 14
Logic:
Longs: RSI > threshold (default 50)
Shorts: RSI < threshold
Edge: Useful for momentum confirmation in trending conditions.
Advanced Use:
Raise thresholds to 60/40 in strong trends.
Combine with MACD to filter momentum exhaustion.
4️⃣ MACD Histogram Filter
MACD Histogram > 0: Long entries only
MACD Histogram < 0: Short entries only
Purpose: Measures positive/negative momentum shifts, helpful in volatile breakouts.
Pro Tip: Combine with ROC filter in fast-moving markets for maximum edge.
5️⃣ Rate of Change (ROC) Filter
Default: 9-period
Logic:
Longs: ROC > threshold (default 0.0)
Shorts: ROC < threshold
Why It Works: Captures short bursts of momentum often missed by other lagging indicators.
Combos That Work:
MACD + ROC: Double momentum filter
ROC + EMA crossover: Catch high-speed trend continuations
6️⃣ Stochastic RSI Filter
Parameters: Customizable %K and %D smoothing
Logic:
Longs: StochRSI > threshold and K > D
Shorts: StochRSI < threshold and K < D
Use Case: Effective for mean-reversion and momentum crossovers near S/R zones.
Advanced Tip: Use in ranging markets or to fade extended trends.
7️⃣ Time Filter
Customize Start/End Time: Default is 09:30 - 16:00 (New York session)
Supports Time Zones: Input via string (e.g., GMT+0, EST, etc.)
Visual Aid: Background shading for valid sessions.
Benefits:
Avoids low-liquidity or overnight trading periods.
Prevents false signals in pre/post-market sessions.
8️⃣ Loose Stop-Loss Option
If Enabled: SL placed 1 fractal beyond the last pivot.
Why: Helps in volatile assets like crypto where swing points are commonly breached before reversals.
Note: Should be used with tight risk controls or lower position sizing.
💼 Risk Management & Break-Even Logic
Risk-to-Reward Ratio: Adjustable via input
Auto TP & SL: Based on defined RR and recent structure
Break-Even Feature: Moves SL to entry after 1R is reached to protect capital
📈 Strategy Display Elements
CHoCH & BoS Labels: Visual confirmation of structure breaks
Liquidity Sweep (✖): Optional display for potential stop hunts
Trend Color Candles: Highlights bullish or bearish candle clusters
Session Overlay: Displays active time window on chart
⚙️ Recommended Configurations
Objective Suggested Filters
Trend Scalping HTF EMA + EMA Crossover + RSI
Volatility Breakouts ROC + MACD Histogram + Time Filter
Mean Reversion Stochastic RSI + RSI
Structure-Only Mode Disable all filters except Time Filter
Conservative Mode Enable all filters with tightened thresholds
📌 Final Notes
This script is highly modular and is not a one-size-fits-all strategy. It is a framework that allows advanced traders to apply contextual judgment and optimize entries based on confluence. Extensive backtesting per asset and timeframe is highly recommended.
🛠️ Strategy Parameters Summary
✅ Market Structure Entry (CHoCH)
✅ Smart SL & Break-Even Logic
✅ Modular Momentum Filters (RSI, MACD, ROC, StochRSI)
✅ Trend Filters (HTF EMA, EMA Cross)
✅ Session Filtering & Visualization
✅ Liquidity Sweeps (optional)
pinescript version5

Supply/Demand Zones + Engulfment-based ExecutionSupply/Demand Zones + Engulfment-Based Execution
Strategy Overview
This strategy combines institutional trading concepts—supply/demand zones and engulfing candle patterns—to generate high-probability long and short trade setups. The system uses aggregated price action to identify potential reversal zones and confirms entries with engulfing candle patterns, ensuring trades are only taken when market structure shows commitment in the direction of the trade.
Core Concepts
• Supply & Demand Zones: These are automatically detected by analyzing aggregated bullish and bearish candle structures over user-defined intervals. Supply zones are formed after bearish continuation patterns; demand zones appear after bullish continuation patterns.
• Engulfing Entries: Once price enters a zone, the strategy waits for a bullish engulfing pattern (in a demand zone) or a bearish engulfing pattern (in a supply zone) before executing a trade. This adds confirmation and reduces false signals.
• Risk Management: Stop-loss is placed at the low (for long trades) or high (for short trades) of the engulfed candle. Take-profit can be calculated using a fixed R-multiple (risk-to-reward ratio) or a user-defined target price.
Key Features
Fully customizable aggregation factor for zone detection
Visual zone boxes, entry/SL/TP boxes, and engulfing pattern labels
Optional removal of mitigated zones for cleaner charting
Configurable trade mode (Long only, Short only, or Both)
Support for trading sessions and date filtering
Alerts for price entering supply or demand zones
How to Use
Select Aggregation Factor: Choose how many candles to group together for identifying key zones (e.g., 4x timeframe).
Enable Zones: Turn on supply and/or demand zones as needed.
Set Execution Parameters:
– Choose R-multiple (e.g., 2:1 risk-reward)
– Or use a fixed take-profit price
Define Trade Time Window:
– Set the date and time ranges to restrict execution
– Use Start Hour and End Hour to limit trades to specific sessions (e.g., London/New York)
Run on Desired Timeframe: Typically used on 15m–4H charts, depending on your strategy and the asset’s volatility.
Ideal For
• Traders using Smart Money Concepts (SMC)
• Those who value high-confluence entries
• Intraday to swing traders looking for structure-based automation
⚠️ Important Notes
• The strategy requires engulfing confirmation within the zone to enter a position.
• This script does not repaint and executes trades on a bar close basis.
• Backtest results may vary based on session filters and aggregation factor.
© Attribution
This strategy was developed by The_Forex_Steward and is licensed under the Mozilla Public License 2.0.
You are free to use, modify, and distribute it under the terms of that license.

Grid TLong V1The “Grid TLong V1” strategy is based on the classic Grid strategy, but in the mode of buying and selling in favor of the trend and only on Long. This allows to take advantage of large uptrend movements to maximize profits in bull markets. For this reason, excessively sideways or bearish markets may not be very conducive to this strategy.
Like our Grid strategies in favor of the trend, you can enter and exit with the balance with controlled risk, as the distance between each grid functions as a natural and adaptable stop loss and take profit. What differentiates it from bidirectional strategies is that Short uses a minimum amount of follow-through, so that the percentage distance between the grids is maintained.
In this version of the script the entries and exits can be chosen at market or limit , and are based on the profit or loss of the current position, not on the percentage change in price.
The user may also notice that the strategy setup is risk-controlled, because it risks 5% on each trade, has a fairly standard commission and modest initial capital, all in order to protect the strategy user from unrealistic results.
As with all strategies, it is strongly recommended to optimize the parameters for the strategy to be effective for each asset and for each time frame.

Algoway V4.2📌 Algoway V4.2 — Multi-layered Strategy Powered by ADX, MACD & PSO
Overview
Algoway V4.2 is a layered algorithmic strategy designed for volatility-rich assets like cryptocurrencies. While some core components (such as PSO, MACD, and ADX oscillators) are adapted from known indicator models, the original logic, state tracking, and Candle Strength Oscillator (CSO) are fully custom-developed.
This strategy is not a simple combination of tools — it implements a conditional entry-exit logic system based on ADX zone transitions, momentum structure, and MACD/PSO signal synchronization, enhanced by custom-built CSO filtering.
🧠 Key Modules and How They Work Together
PSO (Premium Stochastic Oscillator)
Used to confirm local oversold/overbought pressure. Acts as a directional filter.
MACD (Normalized)
Volatility-normalized MACD values allow consistent signal detection even on volatile pairs. It triggers entries when momentum begins shifting.
ADX Zonal Logic
Divides the market into Range / MidRange / Trend Peak zones. Entries are allowed only under specific transitions — e.g., long entries only in yellow (low volatility) zones or in trend climax zones under certain pullbacks.
CSO (Candle Strength Oscillator) — Custom Module
Designed to measure real candle momentum and price structure consistency. It avoids false breakouts and filters trend fatigue.
🔁 How Logic Works
Strategy maintains state variables to track entry type and zone.
Exit conditions depend on the entry origin: entries from "Range" exit in "Peak", while "Peak" entries exit during pullbacks or mid-strength trend reversals.
Additional logic prevents entries when signals are not aligned across modules, minimizing noise.
Optional CSO module acts as a final microstructure confirmation before executing MACD-based midpoint entries.
📊 Example Parameters (for 5M crypto scalping)
Each module is tuned to respond to 5-minute crypto volatility:
Stochastic: fast response, tight thresholds
MACD: shortened EMAs, normalized
ADX: traditional smoothing, custom thresholds for zone switching
CSO: candle-based dynamic filter with visual zone mapping
🧪 Conclusion
Algoway V4.2 is not a script merger — it is a custom logic engine using familiar technical components but governed by a proprietary decision model, with additional filters and dynamic variable tracking.
It’s suitable for scalping or swing setups, and the internal logic is optimized for real trading conditions, not just visual backtests.

Antony.N4A -NQ ORB Quartile Str v6.3Antony.N4A – NQ ORB Quartile Strategy v6.3
A precision-engineered intraday breakout system built for the Nasdaq futures market, combining the Opening Range Breakout (ORB) logic with dynamic standard deviation targets, structural filters, and multi-layer risk management.
🧠 Key Features
Opening Range Breakout (ORB):
Automatically defines a breakout window (default: 09:30–09:45) and triggers entries when price breaks the high or low of that range.
Standard Deviation Profit Targets:
Supports SD0.5, SD1.0, SD1.5, and SD2.0 targets relative to the ORB range.
EMA Filtering (200-period):
Filters trades based on EMA direction and price position to validate breakout direction and avoid false entries.
Range Filtering:
Detects directional bias and volatility trends using smoothed range logic.
Momentum Triggering:
Validates breakout momentum and allows entries when directional momentum is positive and increasing.
⚙️ User Inputs
ORB Settings: Timeframe, session, and timezone customization
Entry Window: Define when trades are allowed to trigger
Day Filters: Enable/disable trading by weekday
SD Targets: Configure exit % and active levels (SD0.5 – SD2.0)
EMA Filter & Sensitivity
Cross Filter (Anti-chop logic)
Range Filter Parameters
Visual Toggles: ORB range, SD levels, EMA clouds
🎯 Trade Management Rules
Entry:
Triggered at the close of a 5-minute candle confirming a breakout of the ORB range.
Stop Loss:
Defined by structural invalidation (quartile boundaries & mid-range buffers).
Take Profit Strategy:
75% closed at SD1.0 level
Remaining 25% trailed to further SD2 target
SL is moved to breakeven after partial exit
Execution Controls:
No pyramiding
No re-entries (cooldown enforced)
🔧 Trading Modes
✅ Safe Mode
EMA Filter: Enabled
EMA Sensitivity: 19
Range Filter: Disabled
Ideal for conservative setups and reduced noise environments
🔥 Aggressive Mode
EMA Filter: Enabled
EMA Sensitivity: 5
Range Filter: Disabled
Suited for high-frequency setups and faster breakouts
📊 Backtest Performance (7-Month Sample)
Safe Mode:
Win Rate: 66%
Total Trades: 29
Net PnL: +21.79R (~$4,357 with R = $200)
Max Red Days: 3
Max Drawdown: -$663
Best Month: +9R, Worst Month: -2R
Aggressive Mode:
Win Rate: 63%
Total Trades: 52
Net PnL: +30R (~$6,080)
Max Red Days: 6
Max Drawdown: -$1,357
Best Month: +12R, Worst Month: -3.2R
👨💻 Developed by Antony.N4A
This tool is crafted for strategic intraday traders, system developers, and backtesters.
For access, customization, or licensing options, contact the developer directly.
Protected script. Redistribution or reuse without permission is prohibited.
Hammer + EMA Strategy with Tick-based SL/TPWhat This Script Does:
Detects Hammer (bullish reversal) and Inverted Hammer (bearish reversal) patterns
Requires a simple trend context (using 2 bars back)
Confirms price position relative to EMA 50
Applies tick-based SL and TP
Plots buy/sell signals on chart with emoji labels

Bias Ratio-ETH-3H @CTTC5108Most of the code of this strategy should be my own original.
This Ethereum 3-hour time cycle strategy can be traced back to February 24, 2023. Although the profit and winning rate are not high, it is still relatively stable.
This strategy uses the deviation rate to enter the market. Invest 10% of the principal each time.
The limit start time adopts a rolling design (should be original).
Real-time retracement and maximum retracement are accurately calculated (should be original).
Adopt segmented stop profit (optional) design.
Open source for learning and other use.
ORB 5M + VWAP + Braid Filter + TP 2R o Niveles PreviosORB 5-Minute Breakout Strategy Summary
Strategy Name:
ORB 5M + VWAP + Braid Filter + TP 2R or Previous Levels
Timeframe:
5-minute chart
Trading Window:
9:35 AM to 11:00 AM (New York time)
✅ Entry Conditions:
Opening Range: Defined from 9:30 to 9:35 AM (first 5-minute candle).
Breakout Entry:
Long trade: Price breaks above the opening range high.
Short trade: Price breaks below the opening range low.
Confirmation Filters (All must be met):
Strong candle (green for long, red for short).
VWAP in the direction of the trade.
Braid Filter by Mango2Juice supports the breakout direction (green for long, red for short).
📉 Stop Loss:
Placed at the opposite side of the opening range.
🎯 Take Profit (TP):
+2R (Risk-to-Reward Ratio of 2:1),
or
Closest of the following: previous day’s high/low or premarket levels.
⚙️ Additional Rules:
Only valid signals between 9:35 and 11:00 AM.
Only one trade per breakout direction per day.
Filter out "trap candles" (very small or indecisive candles).
Avoid trading after 11:00 AM.
📊 Performance Goals:
Maintain a high Profit Factor (above 3 ideally).
Focus on tickers with good historical performance under this strategy (e.g., AMZN, PLTR, CVNA).

Liquidity Grab Strategy (Volume Trap)🧠 Strategy Logic:
Liquidity Grab Detection:
The script looks for a sharp drop in price (bearish engulfing or breakdown candle).
However, volume remains flat (within 5% of the 20-period moving average), suggesting the move is manipulated, not genuine.
Fair Value Gap Confirmation (FVG):
It confirms that a Fair Value Gap exists — a gap between recent candle bodies that price is likely to retrace into.
This gap represents a high-probability entry zone.
Trade Setup:
A limit BUY order is placed at the base of the FVG.
Stop Loss (SL) is placed below the gap.
Take Profit (TP) is placed at the most recent swing high.
📈 How to Use It:
Add the strategy to your TradingView chart (1–5 min or 15 min works well for intraday setups).
Look for green BUY labels and plotted lines:
💚 Green = Entry price
🔴 Red = Stop loss
🔵 Blue = Take profit
The script will automatically simulate entries when conditions are met and exit either at TP or SL.
Use TradingView’s Strategy Tester to review:
Win rate
Net profit
Risk-adjusted performance

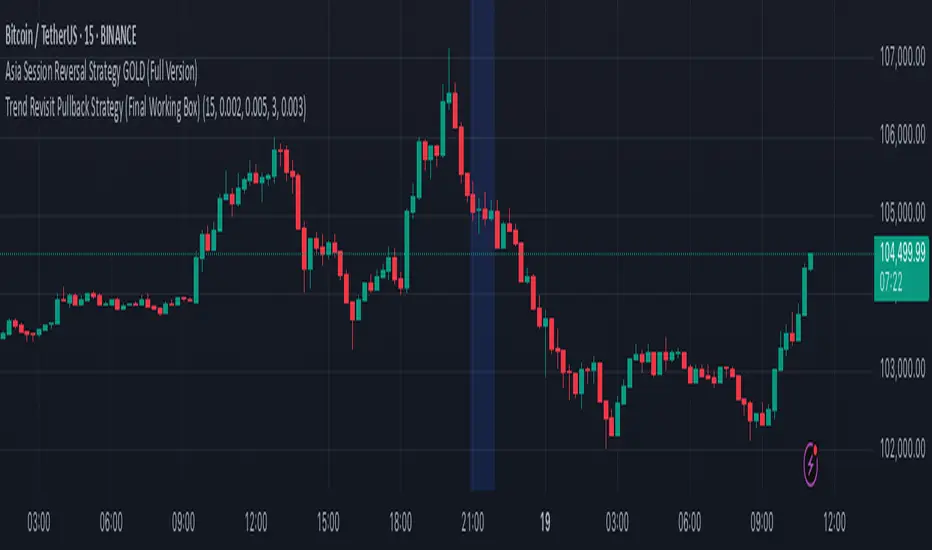
Trend Revisit Pullback Strategy (Final Working Box)📈 Trend Revisit Pullback Strategy
This TradingView Pine Script strategy identifies strong trend breakouts and accounts for natural pullbacks by:
Entering long or short on strong 1-bar breakouts
Allowing for pullback averaging if price retraces after entry
Expecting a revisit to the original entry price within 15 bars
Automatically exiting at break-even or using a custom TP/SL
Drawing a visual trade zone (entry → SL → revisit window) for easy reference
Optional labels and color-coded boxes to track each trade’s lifecycle
Ideal for trend traders who anticipate a pullback and prefer to manage risk with break-even exits or reward-to-risk parameters.
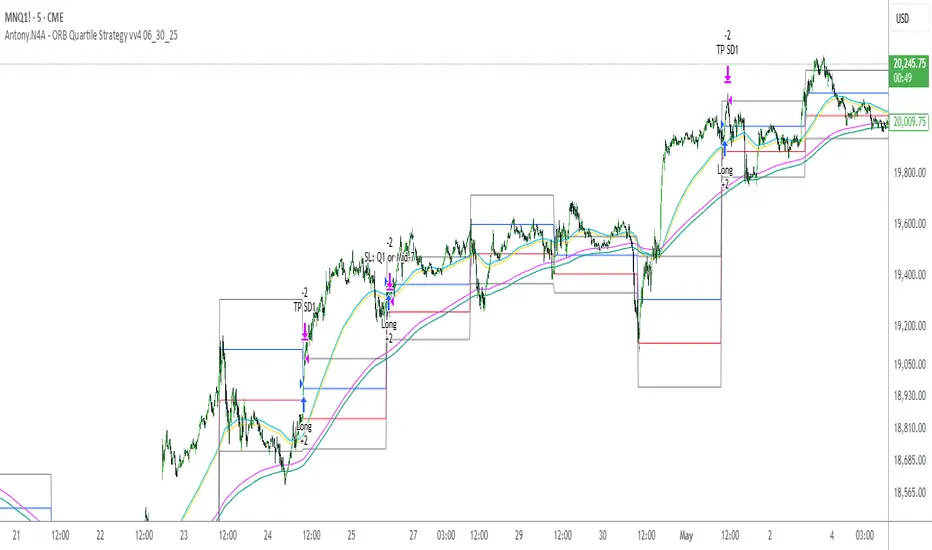
Antony.N4A - ORB Quartile Strategy vv4 06_30_25📌 Antony.N4A - ORB Quartile Strategy vv4
This script implements a fully automated Opening Range Breakout (ORB) trading strategy, engineered for precision execution within predefined market windows. It is compatible with both New York and London sessions, and integrates advanced internal logic including trend validation, breakout confirmation, position scaling, and risk-defined stop/target management.
🧠 Core Logic Overview:
ORB Range Calculation: Based on configurable session time (default: 09:30–09:45 EST)
Entry Window: Trade initiations are permitted only within a defined intraday range
Trend Validation Filters: Proprietary EMA-based mechanisms to confirm directional bias
Contract Sizing Engine: Dynamically adjusts trade size to respect a per-trade risk ceiling
Risk Parameters: Designed to cap maximum loss per trade at approximately $300–400
🎯 Trade Management Rules:
Entry:
Triggered at the close of a 5-minute candle that confirms a directional breakout of the ORB
Stop Loss:
Enforced via structural breakout invalidation levels (Quartile boundaries and mid-range buffer)
Profit Targeting:
- 75% of position is closed at the first standard deviation (SD1) level
- Remaining 25% is trailed to extended targets, with stop-loss adjusted to breakeven post-partial
No pyramiding, re-entries are limited by cooldown logic and session controls
📊 Backtest Performance (Oct 2024 – Apr 2025):
Total Trades: 36
Win Rate: 64%
Worst Losing Streak: 4 consecutive trades
Worst Month: January 2025 (-1.49R)
Net Performance: +21.5R
Strategy tested on NQ futures with NY session breakout configuration
This strategy is intended for disciplined intraday traders seeking a structured, semi-mechanical approach to volatility expansion. It is best used in high-liquidity markets and news-driven sessions.
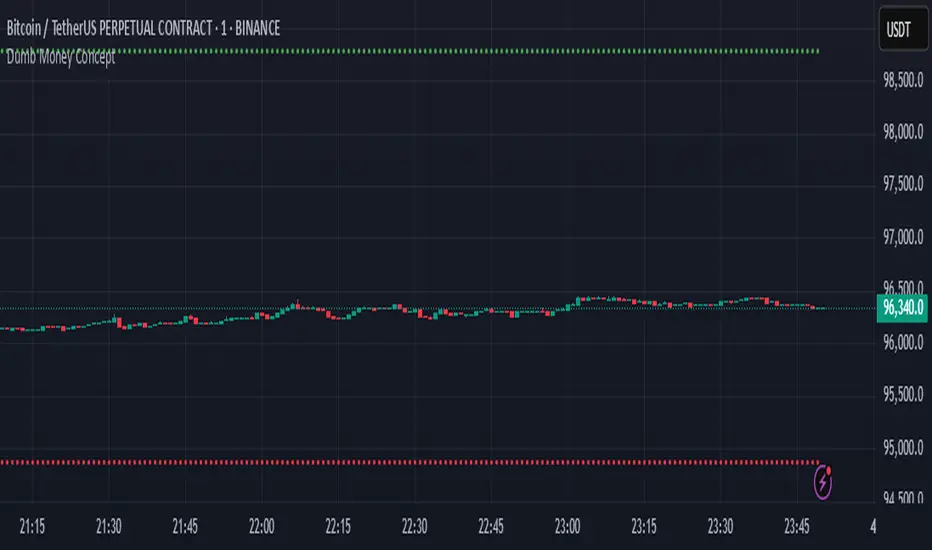
Dumb Money ConceptUse in 1 minute timeframe
1. Strategy setup
Name & sizing: Trades 25% of your account on each signal, assumes 0.04% commission + 2‑tick slippage, starts with a notional 10 million.
Timing: Only makes decisions at each 1‑minute bar close, and processes orders at bar‑close.
2. Optional filters (both default to off)
Volatility filter : when on, requires that yesterday’s ATR (average true range) ≥ your threshold before even placing an entry.
Trend filter : when on, only allows a “long” if yesterday’s close was above its daily MA, or a “short” if below.
You can toggle each filter on/off and adjust ATR period, ATR threshold, and MA length through the inputs at the top.
3. Signal logic (“dumb money” wicks)
At today’s first minute, the script pulls yesterday’s open, high, low, close, ATR and MA—using only completed daily bars so nothing repaints.
It measures the size of yesterday’s upper wick (close→high) vs. lower wick (open→low).
If the upper wick was longer, that sets a long bias (“dumb money” got shaken out at the top). Otherwise it sets a short bias.
4. Calculate where to place orders
On that same first minute of day:
Entry: a limit order at half of yesterday’s range away from today’s open (below the open for longs, above for shorts).
Stop‑loss: one full‑range (×1.0) below today’s open for longs (and above for shorts).
Take‑profit: 1.236× yesterday’s range above today’s open for longs (and below for shorts).
5. Apply filters before sending entry
Before actually placing that limit order, it checks:
Volatility: if enabled, requires yesterday’s ATR ≥ your “Min Daily ATR.”
Trend: if enabled, requires yesterday’s close to lie on the same side of its daily MA as your signal.
If either filter fails, no order is sent.
6. Give the limit order up to 24 hours to fill
The code remembers the bar‑index when the order went live.
If 1440 one‑minute bars pass (≈24 h) without a fill, it automatically cancels the unfilled entry—so stale orders don’t hang around.
7. Once filled, TP/SL manage the trade
As soon as your limit order executes, two opposite orders are placed:
A take‑profit at the 1.236× range level
A stop‑loss at the –1.0× range level
One cancels the other when triggered.
8. No overnight risk
On the very first minute of the next daily bar, any position still open is force‑closed (“Time Exit”)
Momentum Pull Back Stratergy"Master Pull Back Strategy" is a highly detailed momentum and volume-based trading system designed for Trading View. It visually annotates the chart, detects buy/sell signals, tracks market phases, and evaluates retracements and confirmations. Below is a full breakdown of its logic and components:
🔷 1. Volume Profile Highlights (Arrow Emojis)
Purpose: Show volume strength vs. average using color-coded arrows.
Calculates average volume over a user-defined period (length = 10).
Divides current volume by average volume to get volRatio.
Based on volRatio, plots small arrows (acting like diamonds) in various colors:
Low volume (black, navy, blue...) to high volume (yellow, red, purple).
Visual Purpose: Give a quick sense of how "loud" or "quiet" a candle's volume is.
📈 2. Highs of Day Tracking
Purpose: Track the high price reached during different trading sessions.
Defines pre-market, regular, and post-market sessions.
Tracks the highest price (high) in each session.
Plots colored lines:
Orange: Pre-market high
Red: Regular market high
Blue: Post-market high
🟩 3. Green Candle Pattern Detection
Purpose: Detect bullish patterns formed by consecutive green candles.
Key Conditions:
Count green candles (greenCount) until a red candle appears or 10 candles max.
Require at least 1 silver-or-above volume candle (volRatio >= 1.0).
Must have ≥3% price gain during the green sequence.
Must accumulate >20,000 volume during the green run.
If Valid:
Locks the pattern.
Records important values:
patternStartPrice, patternEndPrice, totalPatternVolume, patternHigh, patternBars
Marks the bar after which red starts (redStartBar)
⬇️ 4. Retracement Monitoring
Purpose: Track retracement from the pattern high after it locks.
Defines retracement percentage:
(greenPatternHigh - low) / (greenPatternHigh - greenPatternLow)
If retracement exceeds 80%, it invalidates the pattern.
Buy signal is disabled if pattern retraces too far.
✅ 5. Buy Signal Logic
Purpose: Fire a buy signal after pattern lock if price breaks above local high.
Conditions:
Pattern is locked (patternLocked).
Price breaks above a short-term high (triggerBreak).
It's not the first red candle.
Price is within 8.5% above EMA9.
Buy signal fires and:
Sets buyActive = true
Tracks highest price after buy
Stores buyPrice = close
❌ 6. Sell Signal Logic
Purpose: Exit signal after retracement from post-buy high.
While buy is active:
If price retraces ≥3% from the post-buy high → sellSignal = true
Resets buyActive, trackedHigh, and buyPrice
Plots a red "SELL" label above the bar.
🎨 7. Buy Signal Visual Color Coding
Purpose: Color buy signal based on how deep the retracement is.
Uses retracement percentage:
≥65% → Red (high risk)
45–65% + MACD bullish → Yellow (moderate)
<45% + MACD bullish → Green (ideal)
Plots BUY label below bar in the respective color.
🔻 8. Retracement Triangle Visuals
Purpose: Shows retracement progression while pattern is locked.
If pattern is locked and not ready for buy:
Plots triangle below bar in the buyColor for visual tracking.
⭐ 9. Star Markers Above Lock Candle
Purpose: Confirmations when pattern locks.
First Star:
Plotted above the first red candle after green pattern lock.
Second Star (⭐⭐):
Additional confirmations:
Volume OK (less than previous)
MACD bullish
Price > VWAP
VolAtLock > 100K
Price up >6% from first green candle
Price below 75% of daily EMA200 or above EMA200
Third Star (⭐⭐⭐):
Even stricter confirmations:
Volume < 60% of previous
High <= previous high
VolAtLock > 500K
Price > $3
Gain >9% from first green
Price < 50% of daily EMA200 or above EMA200
📊 10. Bar Coloring
Purpose: Visually highlight bars based on pattern phase and MACD.
Gray: MACD Bearish
Light Green: Part of active green pattern
Blue: In locked phase but no buy triggered
🔄 11. Reset Logic
Purpose: Clears all tracking variables once a buy signal fires or pattern is invalidated.
Also resets if:
Retracement is too deep
10 candles pass post-lock without a trigger
⛰️ 12. Double Top Detection
Purpose: Basic visual marker when current high == previous high.
Plots a gray triangle if current and previous bar highs match.
📌 Summary: What This Strategy Shows
Buy Opportunities: Based on high-volume green runs and confirmed breakouts.
Sell Triggers: Once a retracement from peak exceeds 3%.
Visuals for Confirmation:
Diamonds for volume
Stars for lock confidence
Colors for retracement strength
Risk Management:
Retracement filtering
Time limits on locked phases
Volume filters
Market Context: Tracks pre/regular/post market highs and daily EMA 200.

Rawstocks 15 Minute ModelRawstocks 15-Minute Model
The Rawstocks 15-Minute Model is a precision intraday trading strategy designed for the US stock market (9:30 AM - 4:00 PM ET), optimized for the 15-minute timeframe. It combines institutional order flow concepts with Fibonacci retracements to identify high-probability reversal setups while enforcing strict risk management and session-based rules.
Key Features
Time-Based Execution
Trading Hours: 9:30 AM - 4:00 PM ET (no new entries after 4:00 PM)
Force Close: All positions auto-exit at 4:30 PM ET (prevents overnight risk)
Entry Logic
Order Block + Fib Confluence:
Identifies institutional order blocks (previous swing highs/lows)
Requires price pullback to 61.8% or 79% Fibonacci level
Liquidity Confirmation:
Waits for stop runs (liquidity sweeps) before reversal entries
Exit Rules
Stop Loss: 1x ATR (14) from entry
Take Profit: 2:1 Risk-Reward (adjustable)
Visual Signals
Green Triangle: Valid long setup (pullback to bullish OB + Fib)
Red Triangle: Valid short setup (pullback to bearish OB + Fib)
Blue/Purple Background: Highlights active trading vs. close period
How It Works
Identify the Setup
Wait for a strong impulse move (break of structure)
Mark the order block (institutional zone)
Confirm Pullback
Price must retrace to 61.8% or 79% Fib level
Must occur within trading hours (9:30 AM - 4:00 PM)
Enter on Confirmation
Long: Break of pullback candle high (stop below recent swing low)
Short: Break of pullback candle low (stop above recent swing high)
Manage the Trade
Trail stop or exit at 2R (risk-to-reward)
All positions close at 4:30 PM sharp

Price Flip StrategyPrice Flip Strategy with User-Defined Ticker Max/Max
This strategy leverages an inverted price calculation based on user-defined maximum and minimum price levels over customizable lookback periods. It generates buy and sell signals by comparing the previous bar's original price to the inverted price, within a specified date range. The script plots key metrics, including ticker max/min, original and inverted prices, moving averages, and HLCC4 averages, with customizable visibility toggles and labels for easy analysis.
Key Features:
Customizable Inputs: Set lookback periods for ticker max/min, moving average length, and date range for signal generation.
Inverted Price Logic: Calculates an inverted price using ticker max/min to identify trading opportunities.
Flexible Visualization: Toggle visibility for plots (e.g., ticker max/min, prices, moving averages, HLCC4 averages) and last-bar labels with user-defined colors and sizes.
Trading Signals: Generates buy signals when the previous original price exceeds the inverted price, and sell signals when it falls below, with alerts for real-time notifications.
Labeling: Displays values on the last bar for all plotted metrics, aiding in quick reference.
How to Use:
Add to Chart: Apply the script to a TradingView chart via the Pine Editor.
Configure Settings:
Date Range: Set the start and end dates to define the active trading period.
Ticker Levels: Adjust the lookback periods for calculating ticker max and min (e.g., 100 bars for max, 100 for min).
Moving Averages: Set the length for exponential moving averages (default: 20 bars).
Plots and Labels: Enable/disable specific plots (e.g., Inverted Price, Original HLCC4) and customize label colors/sizes for clarity.
Interpret Signals:
Buy Signal: Triggered when the previous close price is above the inverted price; marked with an upward label.
Sell Signal: Triggered when the previous close price is below the inverted price; marked with a downward label.
Set Alerts: Use the built-in alert conditions to receive notifications for buy/sell signals.
Analyze Plots: Review plotted lines (e.g., ticker max/min, HLCC4 averages) and last-bar labels to assess price behavior.
Tips:
Use in trending markets by enabling ticker max for uptrends or ticker min for downtrends, as indicated in tooltips.
Adjust the label offset to prevent overlapping text on the last bar.
Test the strategy on a demo account to optimize lookback periods and moving average settings for your asset.
Disclaimer: This script is for educational purposes and should be tested thoroughly before use in live trading. Past performance is not indicative of future results.

RSI Divergence Strategy - AliferCryptoStrategy Overview
The RSI Divergence Strategy is designed to identify potential reversals by detecting regular bullish and bearish divergences between price action and the Relative Strength Index (RSI). It automatically enters positions when a divergence is confirmed and manages risk with configurable stop-loss and take-profit levels.
Key Features
Automatic Divergence Detection: Scans for RSI pivot lows/highs vs. price pivots using user-defined lookback windows and bar ranges.
Dual SL/TP Methods:
- Swing-based: Stops placed a configurable percentage beyond the most recent swing high/low.
- ATR-based: Stops placed at a multiple of Average True Range, with a separate risk/reward multiplier.
Long and Short Entries: Buys on bullish divergences; sells short on bearish divergences.
Fully Customizable: Input groups for RSI, divergence, swing, ATR, and general SL/TP settings.
Visual Plotting: Marks divergences on chart and plots stop-loss (red) and take-profit (green) lines for active trades.
Alerts: Built-in alert conditions for both bullish and bearish RSI divergences.
Detailed Logic
RSI Calculation: Computes RSI of chosen source over a specified period.
Pivot Detection:
- Identifies RSI pivot lows/highs by scanning a lookback window to the left and right.
- Uses ta.barssince to ensure pivots are separated by a minimum/maximum number of bars.
Divergence Confirmation:
- Bullish: Price makes a lower low while RSI makes a higher low.
- Bearish: Price makes a higher high while RSI makes a lower high.
Entry:
- Opens a Long position when bullish divergence is true.
- Opens a Short position when bearish divergence is true.
Stop-Loss & Take-Profit:
- Swing Method: Computes the recent swing high/low then adjusts by a percentage margin.
- ATR Method: Uses the current ATR × multiplier applied to the entry price.
- Take-Profit: Calculated as entry price ± (risk × R/R ratio).
Exit Orders: Uses strategy.exit to place bracket orders (stop + limit) for both long and short positions.
Inputs and Configuration
RSI Settings: Length & price source for the RSI.
Divergence Settings: Pivot lookback parameters and valid bar ranges.
SL/TP Settings: Choice between Swing or ATR method.
Swing Settings: Swing lookback length, margin (%), and risk/reward ratio.
ATR Settings: ATR length, stop multiplier, and risk/reward ratio.
Usage Notes
Adjust the Pivot Lookback and Range values to suit the volatility and timeframe of your market.
Use higher ATR multipliers for wider stops in choppy conditions, or tighten swing margins in trending markets.
Backtest different R/R ratios to find the balance between win rate and reward.
Disclaimer
This script is for educational purposes only and does not constitute financial advice. Trading carries significant risk and you may lose more than your initial investment. Always conduct your own research and consider consulting a professional before making any trading decisions.
