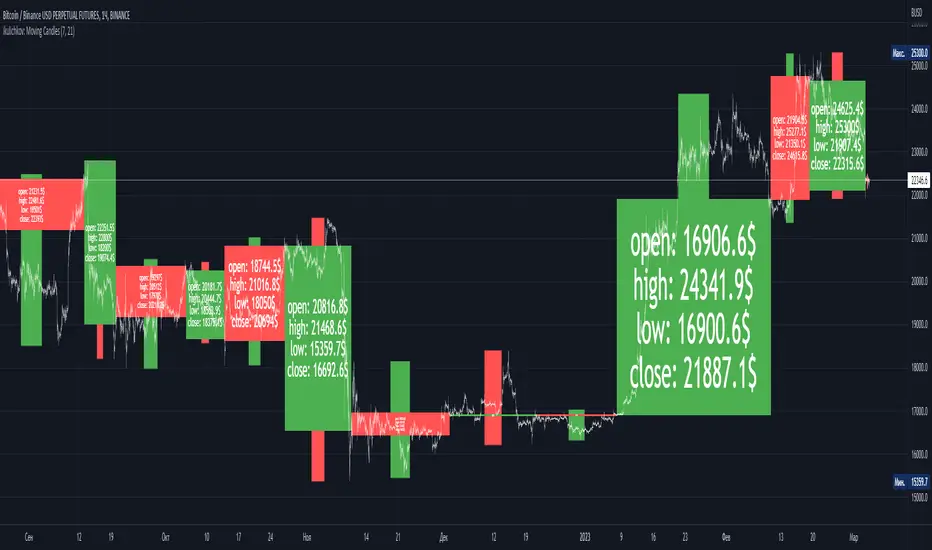
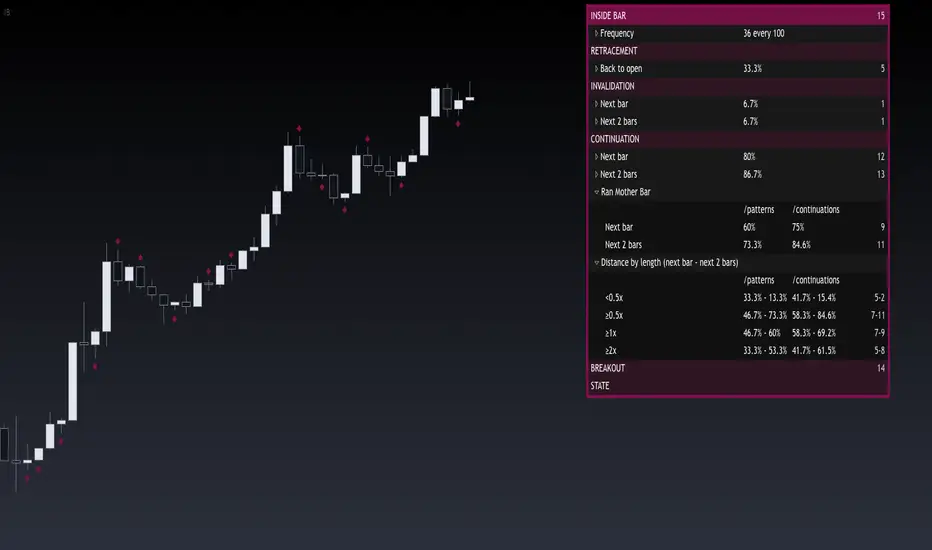
Inside BarThis indicator provides a statistical report on the Inside Bar candlestick pattern. Based on the chart's bars, it can improve your edge on any markets and timeframes.
The Inside Bar pattern refers to a candle that makes a lower high and a higher low.
The report is broken down into the different following sections: retracement , invalidation , continuation and breakout .
Each of them provides hindsights about the pattern price behavior and brings answers to questions such as: How often does price retrace? Does the pattern often invalidate? If it doesn't then does it break in the pattern's direction? How far does price go? What are the odds of a false breakout?
While there are many ways to make use of the metrics, my favorite use case is for developing directional and daily/weekly biases while refining my stop/entry/target positioning.
Miscellaneous
Highlights patterns on the chart;
Supports bar to bar analysis and replay functionalities;
Provides counts on the `Data Window` panel for debugging or computing your own metrics;
Settings
Show/hide for toggling different sections;
Report coloring and offset on the x axis;
Gaining Access
This is a private indicator and is available only for my Patrons. You can reach my Patreon page below from the link in my signature.
Search in scripts for "Candlestick"
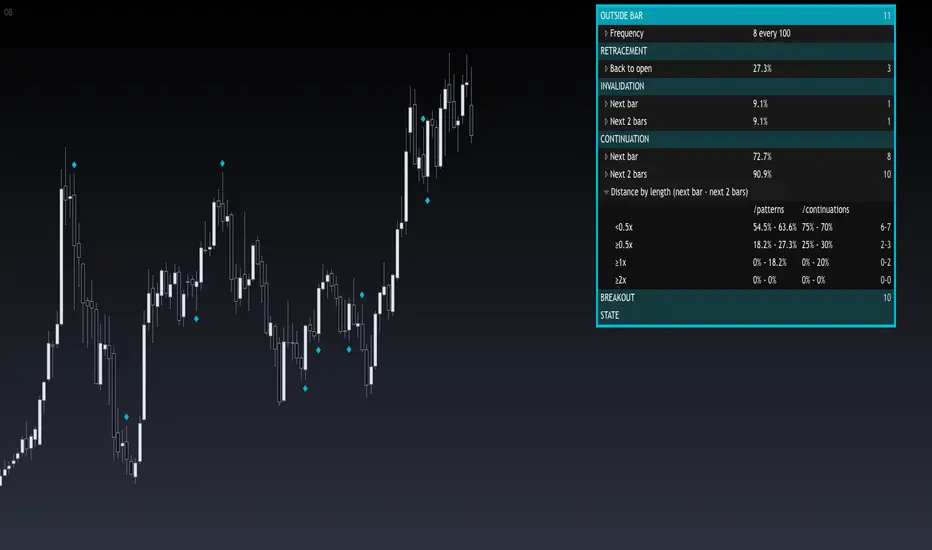
Outside BarThis indicator provides a statistical report on the Outside Bar candlestick pattern. Based on the chart's bars, it can improve your edge on any markets and timeframes.
Knowing there are many definitions about the Outside Bar pattern, here we're strictly referring to one bar's extremes beyond one other.
The report is broken down into the different following sections: retracement , invalidation , continuation and breakout .
Each of them provides hindsights about the pattern price behavior and brings answers to questions such as: How often does price retrace? Does the pattern often invalidate? If it doesn't then does it break in the pattern's direction? How far does price go? What are the odds of a false breakout?
While there are many ways to make use of the metrics, my favorite use case is for developing directional and daily/weekly biases while refining my stop/entry/target positioning.
Miscellaneous
Highlights patterns on the chart;
Supports bar to bar analysis and replay functionalities;
Provides counts on the `Data Window` panel for debugging or computing your own metrics;
Settings
Option for filtering patterns that close outside previous bar;
Show/hide for toggling different sections;
Report coloring and offset on the x axis;
Gaining Access
This is a private indicator and is available only for my Patrons. You can reach my Patreon page below from the link in my signature.
Engulfing BarThis indicator provides a statistical report on the Engulfing candlestick pattern. Based on the chart's bars, it can improve your edge on any markets and timeframes.
Knowing there are many definitions about the Engulfing pattern, here we're strictly referring to one bar's body that get engulfed by one other.
The report is broken down into the different following sections: retracement , invalidation , continuation and breakout .
Each of them provides hindsights about the pattern price behavior and brings answers to questions such as: How often does price retrace? Does the pattern often invalidate? If it doesn't then does it break in the pattern's direction? How far does price go? What are the odds of a false breakout?
While there are many ways to make use of the metrics, my favorite use case is for developing directional and daily/weekly biases while refining my stop/entry/target positioning.
Miscellaneous
Highlights patterns on the chart;
Supports bar to bar analysis and replay functionalities;
Provides counts on the `Data Window` panel for debugging or computing your own metrics;
Settings
Option for filtering patterns that close outside previous bar;
Show/hide for toggling different sections;
Report coloring and offset on the x axis;
Gaining Access
This is a private indicator and is available only for my Patrons. You can reach my Patreon page below from the link in my signature.

<50% Body CandleScript to identify candlesticks with less than 50% body of total high low candlestick. Places a dot inside the candle. Make sure indicator is moved in the top of Objects Tree so the dot will not be hidden behind the candlebar.

Power Bar SMA Directional (Trade Your Edge)GENERAL OVERVIEW:
The Power Bar SMA Directional (Trade Your Edge) indicator identifies high-momentum Power Bars and uses a structured SMA-based breakout model to generate Long and Short trading signals. Once a signal appears, the indicator automatically places a Stop-Loss and three Take-Profit levels, with an optional dynamic trailing stop-loss. Alerts are available for every trade event.
This indicator was developed by Flux Charts in collaboration with Steven Adams (Trade Your Edge).
What is the purpose of the indicator?:
The purpose of the Power Bar SMA Indicator is to turn an unusually strong candle (Power Bar) into a complete, rule-based trade setup. The indicator does three main things, very specifically:
It spots “power bars”. These are candles where the body is both large compared to the candle’s own range and large compared to nearby candles.
It only cares about power bars when they align with the trend’s direction: bullish or bearish.
When that happens, the indicator gives a buy or sell signal with an entry at the signal candle, a stop-loss at the low/high of the power bar, and three take-profit targets placed at fixed multiples of the entry to stop-loss distance. You can also have the stop move up/down after each target is hit with the trailing stop-loss feature.
What’s the theory behind the indicator?:
The theory behind this indicator is that large, one-sided candles often mark the start of directional strength. When a candle’s body takes up most of its total range and exceeds the average size of recent candlesticks, it shows clear control from either buyers or sellers. The indicator combines this concept with a simple moving average to confirm trend direction, ensuring signals only align with the current bias. It then checks if price breaks a recent swing high or low to confirm momentum is continuing rather than consolidating inside a range. By combining three core elements: trend bias, momentum identification, and confirmation that price has room for new discovery beyond prior ranges, the indicator can focus on finding trade setups that have multiple market factors in alignment.
POWER BAR SMA DIRECTIONAL FEATURES:
The Power Bar SMA Directional indicator includes 4 main features:
Power Bars
Trend Bias
Long / Short Signals + Risk Management
Alerts
POWER BARS:
🔹What are Power Bars?:
Power Bars are large, high-momentum candles that show strength in one direction of the market. They form when a candle’s body (the distance between open and close) dominates most of the candle’s total range (the distance between high and low), meaning price moved strongly in one direction with little to no pullback. To qualify, the candle must also be large relative to nearby candles. This size difference confirms that the candle is a burst of momentum.
🔹How to interpret and use Power Bars:
When a Power Bar forms, it signals that price has just made a strong directional move with little to no pullback. Traders can use these bars to identify momentum shifts and potential trade setups.
A bullish Power Bar means buyers controlled the entire candle, marking the start of upward momentum. A bearish Power Bar means sellers were in control of the entire candle, signaling the start of downwards momentum. In the Power Bar SMA Directional indicator, these candles are only used for signals when they align with the market trend and satisfy other entry requirements, mentioned later on.
Bullish Power Bars forming above the Simple Moving Average (SMA) can signal potential long opportunities.
Bullish Power Bars forming below the SMA can signal potential short opportunities.
🔹How are Power Bars identified:
Power Bars are detected and confirmed only after the candle closes, ensuring that the full candlestick body and range can be measured. The indicator does not repaint or change past bars. Once a Power Bar is confirmed, it stays fixed on the chart. Power Bars can be detected on any timeframe or symbol that produces standard candlestick data.
The indicator identifies Power Bars using two user-defined inputs: Sensitivity and Body %.
◇ Sensitivity:
The Sensitivity setting determines how large a candle’s body must be relative to nearby candles. It uses the Average True Range (ATR) to compare the current candle’s size with recent candles, and the Sensitivity value acts as a multiplier of that ATR. A higher Sensitivity value means the candle must be much larger than recent candles to qualify, so fewer Power Bars will form. A lower value makes the filter less strict, allowing more candles to qualify.
◇ Body %:
The Body % setting controls what percentage of the candle’s total range must be body rather than Wick. A higher value requires the body to take up more of the candle’s total range, so fewer candles pass the filter. A lower value allows candles with more wick to qualify, so more Power Bars will form.
Body % Example:
If Body % is set to 50, the candle body must cover at least half of the candle’s total range. For example, if a candle’s high is $11, its low is $10, its open is $10.20, and its close is $10.80, then the total range is $1 ($11 - $10) and the body is $0.60 ($10.80 - $10.20). Body % = (Body / Total Range) * 100 = (0.60 ÷ 1.00 × 100) = 60%. Since 60% is greater than the input of 50%, this candle passes the Body % criteria.
Once a candlestick closes and it meets both the Sensitivity and Body % requirements, it will be plotted in a different color, using barcolor() function. Users can adjust the bullish/bearish colors of Power Bars by adjusting the ‘Candle Coloring’ setting. The Power Bar candle coloring is purely visual and does not affect signal logic or strategy calculations.
TREND BIAS:
The indicator uses a Simple Moving Average (SMA) to determine overall trend direction and ensure that long/short signals align with the market bias.
When the SMA is sloping upward and price is trading above it, the market is considered to be in a bullish trend. In this case, only long setups are allowed. When the SMA is sloping downward and price is below it, the market is considered bearish, and only short setups are valid. This filtering ensures that every signal follows the current trend rather than fighting it.
Within the settings, the SMA length can be customized to match different trading styles. A shorter SMA period reacts more quickly to price changes, making it better suited for scalping or lower timeframes where traders want faster entries and exits. A longer SMA period responds more slowly, which smooths out smaller fluctuations and is more useful for day traders or swing traders who focus on larger trends. By default, the SMA length is set to 20.
Signals on SEED_ALEXDRAYM_SHORTINTEREST2:NQ 5-minute timeframe with a 10 SMA vs. 100 SMA:
🔹Why does the indicator include a trend filter?:
This indicator is built around the assumption that markets tend to continue moving in their current direction. Thus, if the trend is bullish, it’s assumed that price will continue moving higher. If the trend is bearish, it’s assumed that price will continue moving lower. By combining the SMA filter with the momentum logic of the power bars, the indicator avoids countertrend setups. This keeps signals focused on continuation setups where both the trend and short-term strength (momentum) are in agreement.
LONG/SHORT SIGNALS:
This indicator identifies potential trade setups by combining momentum, trend alignment, and structural confirmation. It detects when a Power Bar candle appears, and then looks for confirmation that the move is valid through trend alignment and a structure break.
There are three long setups and three short setups:
Momentum Breakout
Proximity Breakout
Delayed Breakout
All setups require:
A valid Power Bar forming in the correct context relative to the SMA.
A break of nearby structure (defined by the Swing Length setting).
🔹Signal Settings:
◇ SMA Distance:
This setting defines how close a Power Bar must be to the SMA to qualify for the proximity breakout setup type. It measures the maximum allowed distance between the Power Bar’s open price and the SMA, expressed as a multiple of the Average True Range (ATR).
This setting only affects Setup #2 (Proximity Breakout) and sometimes Setup #3 (Delayed Breakout). Setup #1 does not use this filter because its logic depends on price crossing the SMA or confirming later. In proximity setups, the power bar candle must both open and close on the same side of the SMA (bullish or bearish) while still being within the allowed SMA Distance range. This condition prevents signals when price is stretched too far away from the SMA, which could indicate exhaustion or a potential pullback rather than continuation.
A lower SMA Distance value tightens this filter, allowing only Power Bars that form very close to the SMA, resulting in fewer but more conservative signals. A higher SMA Distance value gives wiggle room and allows setups that form farther from the SMA, generating more frequent signals.
In the example below, when the SMA Distance is set to 0.5 (left chart), the bullish Power Bar does not trigger a long signal because its opening price is too far from the SMA. When the SMA Distance is increased to 1.0 (right chart), the same candle now falls within the allowed range, making the setup valid and displaying a long signal label.
◇ Swing Length:
The Swing Length setting defines how the indicator identifies recent structure levels used for breakout confirmation. These structure levels are swing highs and swing lows, which represent points where price reversed direction over a specified number of bars. The indicator uses these high/low levels to determine whether price has broken past a meaningful area of prior support or resistance before confirming a trade setup.
The Swing Length value determines how far back the indicator looks when calculating these points. Internally, it uses the Highest/Lowest method, scanning the last N bars (where N is the Swing Length input) to find the highest high and lowest low within that range.
The highest high becomes the immediate resistance level for potential long setups.
The lowest low becomes the immediate support level for potential short setups.
A lower Swing Length value makes the indicator reference closer levels. This increases the number of potential signals because nearby highs and lows are easier for price to reach.
A higher Swing Length value references farther structure levels, typically major swing points, which reduces signal frequency.
Every setup requires a structure break for confirmation. The Swing Length setting directly affects how strict or lenient the entire indicator behaves for each setup type.
In Setup #1 (Baseline Momentum Breakout) and Setup #2 (Trend-Aligned Proximity Breakout), the Power Bar must break the structure level during or immediately after its formation.
In Setup #3 (Delayed Breakout Confirmation), the same Swing Length level is referenced for a limited number of candles defined by the Candles Between Confirmation setting.
◇ Candles Between Confirmation:
The Candles Between Confirmation setting defines how long the indicator will wait for price to confirm a breakout after a qualifying Power Bar forms. It represents the maximum number of bars allowed between the Power Bar’s close and the moment when price breaks the nearby structure level, which is derived from the Swing Length setting. The structure level is defined as the most recent swing high (for long setups) or swing low (for short setups).
If a structure break occurs within the specified window, a valid signal is triggered, and the Long or Short label is plotted at the close of the breakout candle. If price fails to break through the level within a certain number of candles, the setup is invalidated. This ensures that signals only appear when momentum follows through promptly, and not when price stalls or consolidates for an extended period.
Lower values make confirmations stricter, capturing only quick momentum breakouts. Higher values allow more time for slower markets or higher timeframes to complete structure breaks. Adjust this setting based on market volatility and trading style.
In the example below, when Candles Between Confirmation is set to 10, no signal appears because price breaks the swing high after 15 bars, which is greater than the allowed limit. When the setting is increased to 15, the same move qualifies, and a long signal is triggered as price breaks the swing high 15 candles after the initial bullish Power Bar that crossed the SMA.
🔹Long Setups:
Long Setup #1: Momentum Breakout
A bullish Power Bar opens below the SMA, and closes above it, showing buyer strength.
A breakout must occur during this bullish Power Bar candle through a nearby resistance level derived from the Swing Length setting.
When this breakout occurs, a Long Signal appears at bar close.
After a signal appears, three take-profit levels and one stop-loss level are also plotted.
Stop-Loss: Placed at the Power Bar’s low.
Take-Profit 1: Set using a 1:1 risk distance from the Stop-Loss to entry.
Take-Profit 2: Extends to 1:1.5 risk-to-reward.
Take-Profit 3: Extends to 1:2 risk-to-reward.
(Power Bars are white in this image)
Long Setup #2: Proximity Breakout
A bullish Power Bar opens and closes above the SMA, but is still close enough to it to show price hasn’t extended too far. (Refer to SMA Distance setting). As long as the opening of that candle is within the SMA Distance threshold, the setup remains valid.
The bullish Power Bar candle must break through the recent swing high (refer to Swing Length setting).
A Long Signal triggers when that breakout is confirmed.
After a signal appears, three take-profit levels and one stop-loss level are also plotted, similar to Long Setup #1.
(Power Bars are white in this image)
Long Setup #3: Delayed Breakout
A bullish Power Bar appears in a valid location (Refer to Long Setup #1 or Long Setup #2), but structure is not broken immediately.
The indicator waits for confirmation within the maximum Candles Between Confirmation window. If price breaks structure within that time, a Long Signal appears. If price fails to break structure in time, the setup is discarded.
Risk Management:
Same Stop-Loss, TP 1, TP 2, and TP 3 logic as Long Setup #1
(Power Bars are white in this image)
🔹Short Setups:
Short Setup #1: Momentum Breakout
A bearish Power Bar opens above the SMA, and closes below it, showing seller strength.
A breakout must occur during this bearish Power Bar candle through a nearby support level derived from the Swing Length setting.
When this breakout occurs, a Short Signal appears at bar close.
After a signal appears, three take-profit levels and one stop-loss level are also plotted.
Stop-Loss: Placed at the Power Bar’s high.
Take-Profit 1: Set using a 1:1 risk distance from the Stop-Loss to entry.
Take-Profit 2: Extends to 1:1.5 risk-to-reward.
Take-Profit 3: Extends to 1:2 risk-to-reward.
(Power Bars are white in this image)
Short Setup #2: Proximity Breakout
A bearish Power Bar opens and closes below the SMA, but is still close enough to it to show price hasn’t extended too far. (Refer to SMA Distance setting). As long as the opening of that candle is within the SMA Distance threshold, the setup remains valid.
The bearish Power Bar candle must break through the recent swing low (refer to Swing Length setting).
A Short Signal triggers when that breakout is confirmed.
After a signal appears, three take-profit levels and one stop-loss level are also plotted, similar to Short Setup #1.
(Power Bars are white in this image)
Short Setup #3: Delayed Breakout
A bearish Power Bar appears in a valid location (Refer to Short Setup #1 or Short Setup #2), but structure is not broken immediately.
The indicator waits for confirmation within the maximum Candles Between Confirmation window. If price breaks structure within that time, a Short Signal appears. If price fails to break structure in time, the setup is discarded.
Risk Management:
Same Stop-Loss, TP 1, TP 2, and TP 3 logic as Long Setup #1
(Power Bars are white in this image)
🔹Trailing Stop-Loss Feature:
When the Trailing Stop-Loss setting is enabled, the Stop-Loss (SL) automatically adjusts as price reaches take-profit levels. This feature helps secure profits while keeping the trade logic completely rule-based and non-discretionary.
Here’s exactly how it works step-by-step:
Initial Stop-Loss placement:
For a Long trade, the initial SL is set at the low of the bullish Power Bar that triggered the setup.
For a Short trade, the initial SL is set at the high of the bearish Power Bar that triggered the setup.
This level stays fixed until one of the Take-Profit targets is reached.
After TP 1 is hit:
The SL automatically moves to the entry price (breakeven).
After TP2 is hit:
The SL automatically moves to TP 1
Final exit condition:
The trade is considered complete once either the trailing Stop-Loss or TP 3 is reached.
🔹Visualization:
Users can enable or disable:
Long Signals
Short Signals
Take-Profit Lines
Take-Profit Labels
Stop-Loss Lines
Stop-Loss Labels
Signal Line
SMA
◇ Signal Line:
The Signal Line is an optional visual feature that helps users see exactly which structure level the indicator is using to confirm a breakout. It does not change how signals are generated. It only displays the reference point on the chart.
Users can customize the Signal Line style (Dashed, Dotted, Solid) and choose different colors for bullish and bearish signal lines. The Signal Line can also be turned off completely. When disabled, signals will not be affected.
ALERTS:
The indicator supports alerts, so you never miss a key market move. You can choose to receive alerts for each of the following conditions:
Long Signal
Short Signal
TP 1 (Take-Profit 1)
TP 2 (Take-Profit 2)
TP 3 (Take-Profit 3)
SL (Stop-Loss)
UNIQUENESS:
This indicator automates a strategy that is normally managed manually using multiple steps: identifying large momentum candles, validating trend direction, confirming breakout strength through structure, and then projecting clean risk-based targets. The SMA Distance filter, confirmation window, and swing structure rules work together to ensure signals only trigger when momentum (Power Bars) aligns with technical levels. This indicator turns Power Bars into complete trade ideas with real-time SL/TP management and alerts.

PO3 Price action with target levels *Overview
The PO3 Price Action V2 is a sophisticated multi-timeframe trading indicator that combines advanced price action analysis with Fibonacci retracement levels, trend detection, and comprehensive risk management features. this tool provides clear visual signals and structured trading setups.
*Possible trend change arrow signals:
The indicator identifies valid candlesticks (those with a body larger than 55% of the total candlestick range) and Candlesticks with significant tails (long wicks)
Possible uptrend is identified by a blue arrow below the candle that close above bearish valid (strong) candle while possible downtrend is identified by a red arrow above the candle that close below bullish valid (strong) candle
(onedrive.live.com)] (onedrive.live.com)
*Trend detection line and dynamic stop loss
The use of ATR (default: 1.5) in this indicator provides a dynamic and volatility-adjusted method for determining trend direction and setting stop loss levels. This approach helps in following trends while managing risk according to market conditions.
(onedrive.live.com)] (onedrive.live.com)
* Entry Confirmation and Targets detection by Fibonacci levels :
After trend detection by the ATR line , Fibonacci Levels: Six key levels (0%, 61.8%, 100%, 127%, 161.8%, 227%) with dynamic coloring are automatically drawn based on the swing high before buy signal and subsequent swing low
• 61.8% level acts as confirmation - trade only active when breached (turns blue and thick when price closes above it)
• Four profit targets for partial taking: Gold Lines: Key Target levels (127%, 161.8%) - become green when touched and Higher extensions (227%) for extended trends
(onedrive.live.com)] (onedrive.live.com)
(onedrive.live.com)] (onedrive.live.com)
Bright target table is an active trade
Non-bright target table (Grayed Out) is last completed trade (non-active)
(onedrive.live.com)] (onedrive.live.com)
(onedrive.live.com)] (onedrive.live.com)
*Multi-time frame table
(onedrive.live.com)] (onedrive.live.com)
Best Buy Entry Conditions:
1- The higher time frame in MTF table is Positive
2- Start of uptrend (ATR) line and SL label
3- Change of fibo 0.618 level into thick blue line
Example of buy entry condition in day timeframe trading
(onedrive.live.com)] (onedrive.live.com)
Volume detection by candle colors;
(onedrive.live.com (onedrive.live.com

Heikinashi laguerreThis Pine Script indicator called "Heikinashi Laguerre" combines the Heikin Ashi candlestick technique with the Laguerre Moving Average (Laguerre MA) to provide a smooth, trend-following trading tool. It is designed for traders to better identify trend direction, filter noise, and generate buy and sell signals with clear visual cues.
Trading description and usage of this combined approach:
Heikin Ashi Candles smooth price data by averaging price points, providing clearer visualization of trends with fewer false signals compared to traditional candlesticks. Bullish Heikin Ashi candles appear as translucent green and bearish as translucent black, helping traders spot uptrends and downtrends with greater clarity.
The Laguerre Moving Average (Laguerre MA) is an advanced type of moving average known for its responsiveness and smoothness, filtering out market noise while staying adaptive. Traders can adjust the sensitivity via the alpha parameter.
The indicator computes Heikin Ashi prices on a user-selected timeframe, independent of the chart’s timeframe, allowing multi-timeframe analysis within the same chart.
Trend Identification and Filtering: The buy signal is triggered when the Heikin Ashi candle is bullish (close > open) and the price closes above the Laguerre MA, signaling a strong uptrend continuation. Conversely, the sell signal triggers when the Heikin Ashi candle is bearish (close < open) and the price closes below the Laguerre MA.
Visual aids on chart include:
Colored Heikin Ashi candles for immediate trend recognition.
Subtle background coloring to distinguish bullish (green) and bearish (red) trends.
Optional arrow markers to flag bullish and bearish candles.
Buy (green) and sell (red) labels placed below or above bars when their conditions are met, which helps recognize entry points easily.
Date Range Filter helps restrict signals to a specific trading period as defined by the user, offering customized historical or forward-looking trade analysis.
This fusion of Heikin Ashi candles and Laguerre MA is suited for traders looking for a balance between smoothing price data and maintaining timely trend responsiveness, typically useful in swing and trend-following strategies.

Blue Ocean BOATS 24/5 US Market DataThis script utilizes Blue Ocean's ATS (Alternative Trading System) and U.S. exchange market data to create a continuous candlestick chart. The continuous data has the option to be used as an indicator or strategy source.
Requirements
The main chart symbol (which can be unrelated to the user-input Ticker Symbol) needs to be a 24/7 chart. An example symbol is CRYPTO:BTCUSD. CME_MINI:ES1! and FX:SPX500 work too, but are not truly 24/5 and will miss ~4 hours of the total trading week from the extended U.S. session.
The main chart's timeframe needs to be intraday. Because the script's output is currently inconsistent on daily or higher timeframes, it will disable itself.
The Ticker Symbol chosen should be a ticker that is traded on U.S. exchanges. This will provide both U.S. extended session data and a BOATS equivalent.
Usage & configuration
This script visualizes the 24-hour Monday-Friday chart of a U.S. exchange ticker. Going a step further, it can be used to compare the performance indices or cryptocurrencies to stock constituents of indices, cryptocurrency treasury stocks or holding ETFs.
The script's output, candlesticks, can be overlaid on the main chart or used as is. A "Price Source" plot is used for indicators or strategies.
Ticker Symbol: The U.S. ticker you'd like to view extended session and Blue Ocean ATS session data for.
Price Source: Price source that can be used for indicators or strategies.
Highlight Sessions: Highlight the different trading sessions.
Last Price Line: Show a horizontal line at the last traded price.
Ticker Symbol Check: Plots a label that will display only if the selected Ticker Symbol is not detected as a U.S. exchange traded ticker.
Earnings Label: Creates a label at the time of past earnings of the chosen Ticker Symbol. The time that the earnings are plotted is approximate. Because of this, the label is meant as an explanation for price action.
What this script does and how it works
It creates OHLC candlesticks by merging Blue Ocean's ATS market data and U.S. exchange data. From the OHLC data of both, a single output can be used for indicators or strategies.
References and further information
www.tradingview.com
The Blue Ocean ATS allows trading from 20:00 to 4:00 Eastern Time, Sunday through Thursday. This critical timeframe bridges the eight-hour overnight gap when major U.S. exchanges are closed.
blueocean-tech.io
Blue Ocean ATS, LLC is a US broker dealer which operates the alternative trading system BOATS. Our trading platform offers electronic access, price discovery, compliant regulatory reporting requirements, and standard clearing and settlement processes.
www.nyse.com
Hours mentioned are in Eastern Time.
Overnight trading remains far less active than extended hours trading. The hour with the highest overnight volume is 9:00PM, which averages 2.94 million shares per day and coincides with several Asian market opens. This volume is a fraction of the last hour of extended hours trading, which averages 43.22 million shares. The first hour of pre-core reported volume averages 113.30 million shares per day.
Overnight executions, in addition to the peak in the 9:00PM hour, also exhibits a smaller peak at 3:00AM, of 2.35 million shares. This coincides with several Asian bourses’ end of their regular trading day.
Example of using the script in the main chart window and the difference in how RSI may be calculated.
Note: ATS is not the name of the 20:00 to 4:00 ET session itself, and the term refers to a broader definition of trading systems that include dark pools, which can be different.
24/5 Monday-Friday really means NY time Sunday night to Friday afternoon.

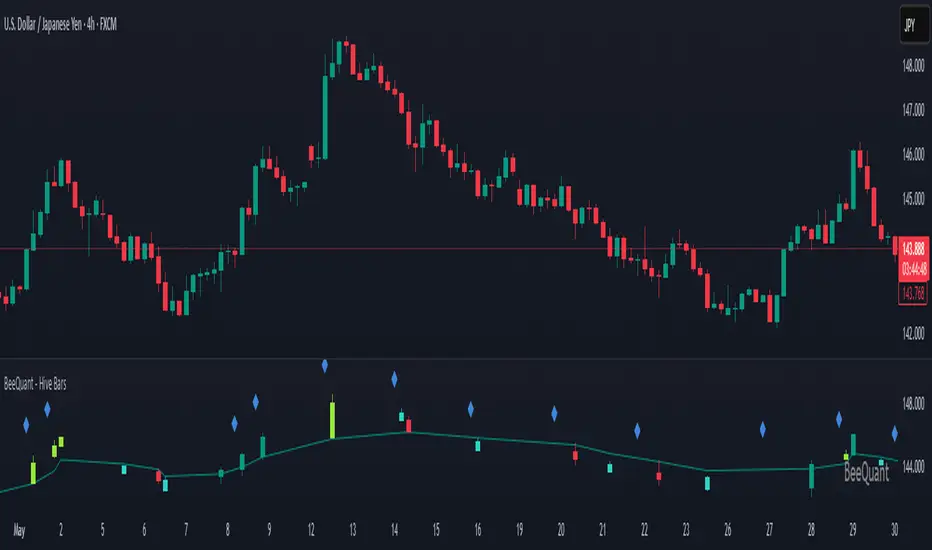
BeeQuant - Hive Bars🔶 OVERVIEW
The "Hive Bars" indicator is a truly revolutionary analytical instrument, meticulously engineered to transcend the limitations of conventional price charting and unveil the profound, underlying essence of market dynamics. Imagine possessing a sophisticated visual engine that intelligently reconstructs raw price data into unique, dynamically consolidated "Hive Bars." These specialized constructs intuitively reveal the dominant market momentum and highlight high-conviction signals often obscured by the ubiquitous noise of traditional candlesticks. This indicator acts as a precision filter, illuminating exactly when pivotal shifts are occurring by coloring these reconstructed units with an adaptive, unparalleled accuracy. It is expertly crafted for the discerning trader seeking an undeniable analytical advantage, offering a fresh, meticulously refined perspective that enables the discernment of concealed patterns, fostering more decisive and confident trading actions. Crucially, "Hive Bars" now feature proactive, real-time alert capabilities, ensuring no critical market inflection point ever goes unnoticed.
__________________________________________________________________________
🧠 CONCEPTS
At its intellectual core, the "Hive Bars" indicator operates upon an advanced, proprietary framework that fundamentally reinterprets market data. It presents this refined information through its unique "Hive Bars"—specialized visual constructs that dynamically encapsulate the consolidated spirit and true directional bias of price action, delivering unparalleled clarity.
⬜ Smart Bar Reconstruction: Hive Bars don’t follow time, they follow the market. They are derived through a sophisticated, multi-faceted internal process that precisely captures the dominant price influence and momentum over variable periods. This structure adapts dynamically to changing conditions, letting you see the real pressure behind price moves with consistency that time-based candles can’t match. This proprietary reconstruction creates a new, inherently consistent, and highly focused visual narrative of underlying market flow, effectively stripping away extraneous "noise" and revealing the market's authentic directional intent.
⬜ Multi-Layered Internal Analysis: A dynamic and live, adaptive line powers the core of Hive Bars. It recalibrates constantly, tracking market structure in real time. Every bar is formed in relation to this internal baseline, giving immediate context to price behavior. You choose the data that drives this line—open, close, high, low, or custom blends—to match your style.
⬜ Intelligent Bar Formation Sequences: Bars are created when the market speaks, not when the clock ticks. A built-in pattern engine reads the flow and waits for real structure to form. This allows the indicator to autonomously consolidate price action, presenting a cleaner, more coherent visualization of trend development as it truly unfolds, rather than fragmented snapshots based on time.
⬜ Visual Signal Precision: "Hive Bars" spring to life with an intuitively powerful coloring system. While primary colors (Green for upward bias, Red for downward bias) denote the prevailing market direction, the "Hive Bars" indicator introduces distinctively colored "Signal Hive Bars". These specialized bars emerge when the market price exhibits a particularly robust, high-conviction interaction with the adaptive internal baseline, standing out instantly and often mark key turning points or breakouts you want to act on.
⬜ Daily Reset Option: For intraday traders, there’s a reset feature that clears the internal build-up at the start of each new trading day. This ensures fresh, unbiased perspectives that are meticulously tailored to the distinct market dynamics and cyclic rhythms of the current trading day.
⬜ Adjustable Sensitivity: With Hive Smoothing, you’re in full control. This setting lets you fine-tune how sensitive the bars are to price movement. Want tighter, faster signals? Dial it down. Prefer broader, more filtered setups? Turn it up. You decide when a new Hive Bar forms—and when a Signal Bar confirms. It’s all based on how you trade and how your asset moves. No guesswork, no one-size-fits-all defaults. Hive Bars adapts to your strategy and trading style, not the other way around.
__________________________________________________________________________
✨ FEATURES
The "Hive Bars" indicator is equipped with a comprehensive suite of cutting-edge features, designed for unparalleled clarity, adaptive responsiveness, augmented analytical depth, seamless interoperability with your broader analytical toolkit, and proactive real-time notifications:
🔹Proprietary Hive Bar Reconstruction
Experience a uniquely advanced visual representation of price action that dynamically consolidates market data, leading to enhanced trend and momentum clarity that goes beyond standard charting and candlestick data.
🔹Customizable Internal Analysis Line
Gain precise control over the underlying adaptive baseline's calculation by selecting various internal price source options, ensuring its alignment with your specific analytical focus.
🔹 Smart Alerts for Key Events 🔔
Get notified in real time when:
◦ A new Hive Bar completes – signaling a fresh structural range reset
◦ A new Signal Hive Bar closes – identifying a potential overbought or oversold condition
Built-in alert conditions make it easy to stay ahead of shifts without watching every candle manually.
🔹Intelligent Bar Formation Sequencing
Diamond-shaped markers clearly indicate the start of the indicator's internal combination logic for enhanced visual understanding.
🔹High-Conviction "Signal Hive Bars" (Distinct Colors)
Receive specialized, uniquely colored visual alerts when Hive Bars exhibit strong, decisive movements relative to the adaptive baseline, indicating moments of heightened market conviction and potential opportunity.
🔹Session-Based Reconstruction
Opt for the "Daily New Start" to intelligently reset the indicator's perspective with each new trading day, providing fresh, session-aligned insights tailored for intraday precision.
🔹Unrivaled External Indicator Collaboration
A truly unique and powerful advantage of "Hive Bars" is its capability to seamlessly integrate and profoundly enhance the performance of other external indicators. By outputting clean, smoothed price data, it lets you feed a higher-quality source into tools like RSI, MACD, moving averages etc. Use close for indicators like RSI, and close for moving averages. The result is better clarity, fewer false signals, and a stronger edge across your setup. Hive Bars isn’t just an indicator, it’s an upgrade for everything you use.
🔹Non-Repainting Historical Integrity
Hive Bars never repaints. Each bar is locked in only after all internal conditions are fully met. This means you can trust every historical signal—it won’t shift or vanish after the fact. What you see in hindsight is exactly what was shown in real time.
🔹Universal Timeframe Compatibility
Whether you're scalping on the 1-minute chart or analyzing multi-month trends, Hive Bars delivers consistent, clean insights. Its architecture adapts to any timeframe without losing fidelity, making it a reliable tool for any strategy or style.
🔹Cross-Market Versatility
Hive Bars is engineered to perform with precision across all major markets—whether you're trading forex, commodities, stocks, or indices. Its adaptive logic automatically aligns with the unique volatility and structure of each asset class, delivering consistently reliable insights no matter where you trade.
__________________________________________________________________________
⚙️ USAGE
Integrating the "Hive Bars" indicator into your daily analytical regimen is an intuitive process that will profoundly enhance your ability to discern crucial market dynamics and spot high-conviction opportunities with unprecedented clarity:
💁 Effortless Application
Simply add the "Hive Bars" indicator to any chart within your TradingView platform. Note that it plots on a separate panel below your main price chart to provide its unique visual output without obscuring the primary price action.
📊 Strategic Calibration
Access the indicator's comprehensive settings panel to meticulously calibrate its powerful engines and unlock its full potential:
⚙ "Internal EMA Config"
Configure the internal adaptive baseline by choosing its source (e.g., CLOSE, HL/2) and its specific EMA length. This shapes the core reference point for the dynamic formation of the "Hive Bars."
🤖 "CONFIG Group"
Here, you decide if you want "Daily New Start" for session-based analytical resets (particularly beneficial for intraday strategies). The "Hive Smoothing" input allows you to control a further layer of consolidation for the "Hive Bars."
🟩🟥 "Color": Customize the appearance of both standard "Hive Bars" and "Signal Hive Bars" to suit your visual preferences, enhancing their immediate interpretability.
🧭 Empirical Exploration
Experimentation with these parameters is paramount. Dedicate time to exploring different combinations across various assets and timeframes to discover the optimal configuration that resonates with your unique trading methodology and the inherent volatility of the market being analyzed.
👀 Interpreting the Unveiled Market Reality: Once calibrated, the "Hive Bars" will present a strikingly clear and actionable picture of market dynamics:
+ Green/Red Hive Bars: These visually denote the consolidated directional bias of the market over the reconstructed period. A sustained sequence of Green "Hive Bars" suggests pervasive bullish pressure and an upward path of least resistance, while a series of Red "Hive Bars" indicates dominant bearish control and a clear downward momentum.
+ "Signal Hive Bars" (Distinct Colors): Pay close attention to these specially colored "Hive Bars." They signify critical moments where the reconstructed price action exhibits a particularly strong, high-conviction interaction with its adaptive internal baseline. These often precede or confirm significant market movements and serve as your clearest, most reliable visual triggers for potential shifts in market control.
⛓️ Intermittent Appearance: Observe that "Hive Bars" do not necessarily appear for every single native time unit of your chart. They are intelligently reconstructed and consolidated representations of price action, appearing only when specific internal conditions are met to present a coherent, high-impact view of distinct market phases.
🔗 Harnessing Advanced External Synergy: To unlock a new dimension of analytical power, profoundly enhance your existing indicator suite by integrating the output of "Hive Bars" as the data source for other external indicators. When adding or configuring indicators such as RSI, Stochastic Oscillators, various Moving Averages (EMA, SMA), or any other indicator that prompts for a 'source' input, you can now select the purified output of the "Hive Bars" as your desired data stream.
For oscillators (e.g., RSI, MACD), select the close or a similar relevant output from "Hive Bars" as your source. This allows the oscillator to react to the purified, consolidated momentum of the "Hive Bars" rather than the potentially noisy raw price data, leading to smoother and more meaningful oscillator signals.
For moving averages (e.g., EMA, SMA), utilize the close or other pertinent "Hive Bar" output as your source. This provides an exceptionally smooth, highly responsive, and less choppy average that precisely tracks the true underlying trend as identified by "Hive Bars." This unique capability allows for the construction of powerfully layered and synergistic trading strategies.
📢 Setting Up Proactive Alerts for Critical Events: Leverage the newly incorporated alert capabilities to maintain real-time awareness of pivotal market developments, even when not actively monitoring your charts.
You can now choose to be alerted specifically when a "New Hive Bar Closed" (signifying the definitive completion of a major market phase as identified by the indicator) or when a "New Signal Hive Bar Closed" (highlighting a high-conviction market event that warrants immediate attention due to its pronounced significance).
__________________________________________________________________________
⚠️ LIMITATIONS
While the "Hive Bars" indicator is an incredibly powerful and advanced tool for dissecting market dynamics, it is vital to understand its inherent design parameters and the prevailing platform-specific constraints for optimal and informed utilization:
👉 Visual Gaps in Plotting: Due to current platform limitations pertaining to custom candle plotting functionality, you may occasionally observe visual gaps or intermittent non-contiguous plotting between "Hive Bars" on the chart. They’re not missing data, but a result of strict plotting rules. A bar is only drawn when all internal conditions are met. This ensures accuracy, even if the chart shows some spacing.
👉 Complementary Tool: This indicator excels at providing high-conviction directional insights and identifying significant market phases. However, it is fundamentally designed as a sophisticated complementary tool to a broader trading strategy, not as a standalone, all-encompassing system. Its true power is unlocked when integrated with other analytical methods.
👉 Input Calibration Essential: The efficacy and depth of insights derived from the "Hive Bars" are highly dependent on the careful and thoughtful calibration of its input parameters, including the "Internal EMA Config," "Hive Smoothing" setting. Optimal results necessitate empirical user experimentation and fine-tuning to discover the configurations best suited for specific assets, analytical objectives, and market conditions.
👉 Exclusion of Auxiliary Data: The "Hive Bars" indicator's primary focus is exclusively on transforming and presenting price data. It does not natively incorporate other vital market information such as fundamental economic data, or news events. Integrating these additional analytical layers remains an essential aspect of constructing a truly comprehensive and robust trading strategy.
█ ▒▒▒▒▒▒▒▒▒▒▒▒▒▒▒▒▒▒▒▒▒▒▒ 『•••• ✎ ••••』 ▒▒▒▒▒▒▒▒▒▒▒▒▒▒▒▒▒▒▒▒▒▒▒▒ █
🎯 CONCLUSION
The "Hive Bars" indicator offers an unparalleled, intuitively accessible, and highly adaptable framework for instantly grasping true price momentum and direction through its intelligent, non-repainting reconstruction of market data. By transforming chaotic raw data into strikingly clear, high-conviction "Hive Bars" and dynamic signals, and now with proactive alerts to highlight critical moments, it empowers you to cut through distractions and identify market currents with unprecedented ease. Think of it as a custom lens for the market. It filters out the clutter and shows you the real structure—bars formed not by time, but by intent. It's about seeing the unseen, with enhanced clarity and a deeper understanding of market forces, now with the power to supercharge all your other tools and keep you informed. No fluff. No hype. Just an edge you can actually see—and use.
▣▣▣▣▣▣▣▣▣▣▣▣▣▣▣▣▣▣▣▣▣▣▣▣▣▣▣▣▣▣▣▣▣▣▣▣▣▣▣▣▣▣▣▣▣▣▣▣▣▣▣
🚨 RISK DISCLAIMER
Engagement in financial market speculation inherently carries a substantial degree of inherent risk, and the potential for capital diminution, potentially exceeding initial deposits, is a pervasive and non-trivial consideration. All content, algorithmic tools, scripts, articles, and educational materials disseminated by "Hive Bars" are exclusively purposed for informational and pedagogical objectives, strictly for reference. Historical performance data, whether explicitly demonstrated or implicitly suggested, offers no infallible assurance or guarantee of future outcomes. Users bear sole and ultimate accountability for their individual trading decisions and are emphatically urged to meticulously assess their financial disposition, risk tolerance parameters, and conduct independent due diligence prior to engaging in any speculative activity.
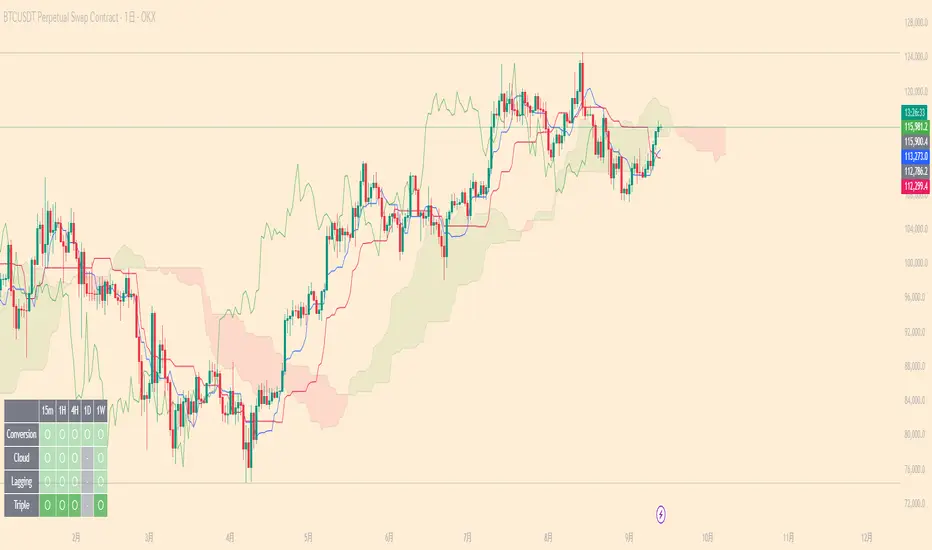
Ichimoku Multi-Timeframe Status[nakano]### Ichimoku Multi-Timeframe Status
---
#### Overview
This indicator is a sophisticated multi-timeframe analysis tool specializing in the "Sanyaku Kouten" (Three Bullish Signals) and "Sanyaku Gyakuten" (Three Bearish Signals) of the Ichimoku Kinko Hyo.
The status panel, displayed in the bottom-right corner of the screen, allows you to simultaneously monitor the Ichimoku conditions across up to eight different timeframes. This enables you to grasp the trend direction from short-term to long-term at a glance and helps you not to miss entry opportunities.
Through extensive trial, error, and debugging, the signal determination logic has been crafted to achieve a high degree of precision.
---
#### Key Features
1. **Multi-Timeframe Status Panel**
* **Monitor Multiple Timeframes at Once**: Displays the status of up to seven different timeframes (defaulting to 1m, 5m, 15m, 1h, 4h, 1D, and 1W) in a single list, in addition to the current chart's timeframe.
* **Detailed Status Display**: For each timeframe, it clearly displays whether the "Tenkan-sen," "Kumo (Cloud)," and "Chikou Span" components are in a "Bullish," "Bearish," or "— (Neutral)" state, color-coded for intuitive understanding.
* **Overall Judgment**: It comprehensively evaluates the state of each component to display a final signal of "Sanyaku Kouten" or "Sanyaku Gyakuten" in the panel.
2. **High-Precision Signal Logic**
* **Cloud Breakout**: Adopts a stricter logic, judging "Bullish" or "Bearish" breakouts only when the **real body** of the candlestick has completely broken out of the Kumo, not just the wicks.
* **Lagging Span (Chikou Span)**: Determines if the Chikou Span has clearly broken above/below the **real body** of the past candlestick. By consistently comparing it to the top/bottom of the real body, regardless of whether the candle is bullish or bearish, it captures more accurate signals.
* **Display Accuracy**: The common one-period display lag seen in many Ichimoku indicators for the Chikou Span and Kumo has been precisely corrected in both calculation and plotting.
3. **Alert Functionality**
* You can create TradingView alerts that trigger the moment a "Sanyaku Kouten" or "Sanyaku Gyakuten" is confirmed on the current timeframe. This allows you to receive notifications of opportunities without being tied to your chart.
4. **High Customizability**
* **Toggle Displays**: The status panel and the "Bullish"/"Bearish" labels on the chart can be easily toggled on or off from the settings menu. (Signal labels are off by default).
* **Complete Color Settings**: You can freely set the colors for all plotted elements, including the Tenkan-sen, Kijun-sen, Chikou Span, Kumo border lines, and Kumo background (for up and down clouds), allowing you to match your personal chart theme.
---
#### How to Use
1. **Add the indicator to your chart.**
2. **Open the settings menu.**
* **Display Settings**: Toggle the visibility of the on-chart signal labels and the status panel.
* **Timeframe Settings**: Freely configure up to seven timeframes you wish to monitor in the status panel.
* **Ichimoku Parameters**: Adjust the periods for the Tenkan-sen, Kijun-sen, etc., to fit your analysis.
* **Line Color Settings**: Customize the colors of the Ichimoku lines and the Kumo to your preference.
3. **Setting Up Alerts**
* Open the TradingView alert creation dialog.
* For "Condition," select this indicator (`Ichimoku Multi-Timeframe Status `).
* Choose either the "Sanyaku Kouten" or "Sanyaku Gyakuten" alert condition and configure your notification settings.
I hope this tool serves as a valuable aid in your market analysis and trading.
---
---
---
### Ichimoku Multi-Timeframe Status
---
#### 概要
このインジケーターは、一目均衡表の「三役好転・三役逆転」に特化した高機能なマルチタイムフレーム分析ツールです。
画面の右下に表示されるステータスパネルにより、最大8つの異なる時間足における一目均衡表の状況を同時に監視できます。これにより、短期から長期までのトレンドの方向性を一目で把握し、エントリーチャンスを逃しません。
多くの試行錯誤とデバッグを経て、シグナル判定のロジックは高い精度を持つように作り込まれています。
---
#### 主な機能
1. **マルチタイムフレーム・ステータスパネル**
* **複数時間足の一括監視**: 現在のチャートの足に加えて、最大7つの異なる時間足(デフォルトでは1分、5分、15分、1時間、4時間、日足、週足)の状況を一覧表示します。
* **詳細な状態表示**: 各時間足について、「転換線」「雲」「遅行スパン」の各要素が「好転」「逆転」「−(どちらでもない)」のいずれの状態にあるかを色付きで分かりやすく表示します。
* **総合判断**: 各要素の状態を総合的に判断し、最終的なシグナルとして「三役好転」または「三役逆転」をパネルに表示します。
2. **精度の高いシグナル判定ロジック**
* **雲抜け**: ローソク足のヒゲではなく、**実体が完全に雲を抜けた**場合のみ「好転」「逆転」と判定する、より厳密なロジックを採用しています。
* **遅行スパン**: 遅行スパンが、過去のローソク足の**実体**を明確に上抜け/下抜けしたかを判定します。陰線・陽線に関わらず、常に実体の上限/下限と比較するため、より正確なシグナルを捉えます。
* **表示の正確性**: 多くのインジケーターで見られる遅行スパンや雲の1期間の表示ズレを、計算と描画の両面で正確に補正しています。
3. **アラート機能**
* 現在のチャートの時間足で「三役好転」または「三役逆転」が成立した瞬間に、TradingViewのアラートを発生させることができます。これにより、チャンスを逃さず通知を受け取ることが可能です。
4. **高いカスタマイズ性**
* **表示の切り替え**: ステータスパネルや、チャート上に表示される「好転」「逆転」のラベルは、設定画面から表示/非表示を簡単に切り替えられます。(シグナルラベルはデフォルトで非表示)
* **完全なカラー設定**: 転換線、基準線、遅行スパン、雲の縁取り線、雲の背景色(上昇/下降)など、描画されるすべての要素の色を自由に設定でき、ご自身のチャートテーマに合わせることが可能です。
---
#### 使い方
1. **インジケーターをチャートに追加します。**
2. **設定画面を開きます。**
* **表示設定**: チャート上のシグナルラベルや、ステータスパネルの表示/非表示を切り替えます。
* **時間足設定**: ステータスパネルで監視したい時間足を最大7つまで自由に設定します。
* **一目均衡表パラメータ**: ご自身の分析に合わせて、転換線や基準線などの期間設定を変更できます。
* **ラインカラー設定**: チャートに表示される一目均衡表の各ラインや雲の色を、お好みの色にカスタマイズします。
3. **アラートの設定**
* TradingViewのアラート作成画面を開きます。
* 「条件」でこのインジケーター(`Ichimoku Multi-Timeframe Status `)を選択します。
* 「三役好転」または「三役逆転」のいずれかのアラート条件を選択し、通知設定を行ってください。
環境認識の補助ツールとして、皆様のトレードの一助となれば幸いです。
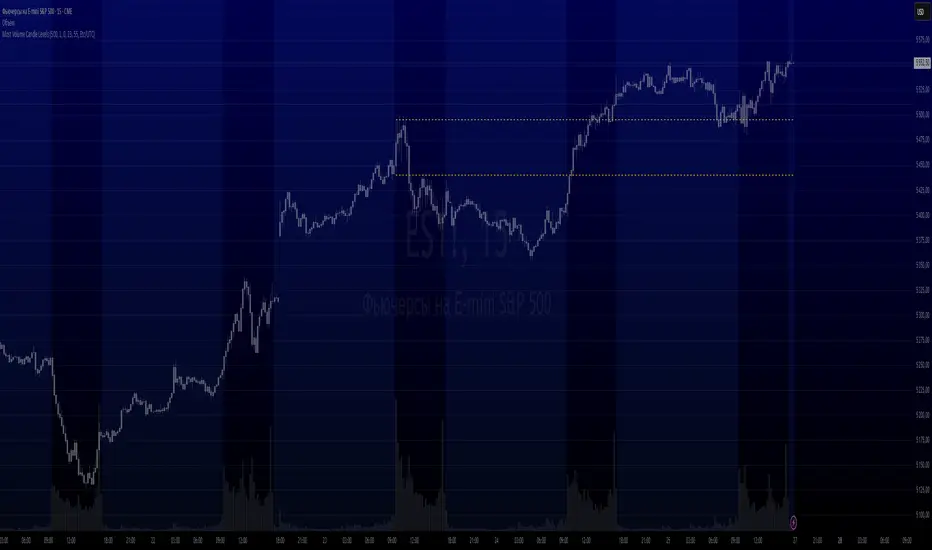
Most Volume Candle LevelsThe script finds the candlestick with the maximum volume in the specified period (20 bars by default).
Draws levels on high and low of this candlestick.
You can set the color of the lines (yellow by default).
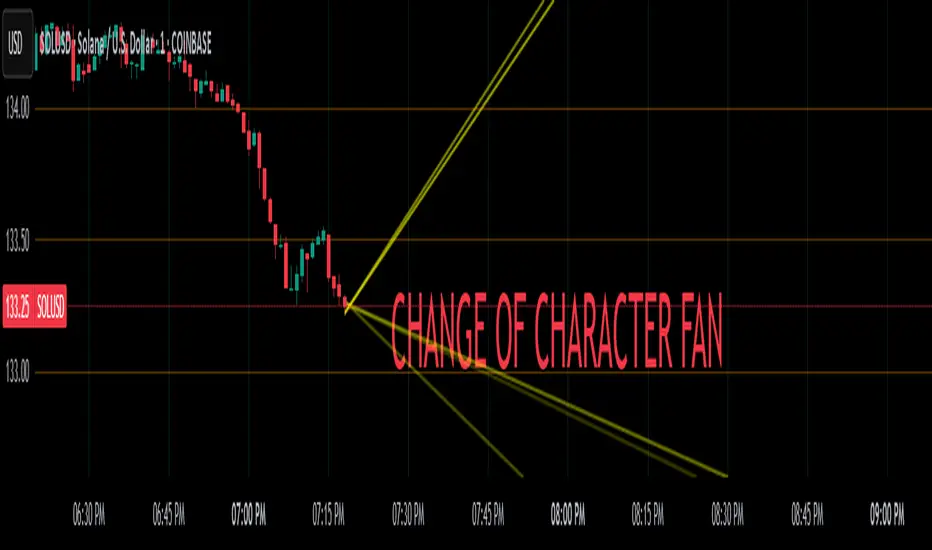
Change of Character FanChange of Character Fan
Overview
The Change of Character Fan is designed to help traders detect shifts (changes of character) in market direction and sentiment before they become fully visible through traditional candlestick analysis. Instead of relying solely on the shape or close of candlesticks, this indicator offers a direct, real-time look at the internal price action occurring within a single bar. This visibility into intrabar dynamics can potentially allow traders to enter or exit trades earlier, minimize false signals, and reduce their dependence on multiple lower-timeframe charts.
How it Works:
The indicator plots a "fan" consisting of five distinct slope lines within the current bar. Each line represents the internal trend of price movement based on user-defined lower timeframe data intervals.
By default, these intervals are set to 3, 5, 8, 13, and 21 samples from 1-second timeframe data.
Each line only appears when it has collected the minimum required number of intrabar data points.
The fan lines use a progressive opacity scale (lighter to darker), visually highlighting the confidence level or probability of directional continuation within the current bar.
At the open of every new bar, the fan disappears completely and gradually reappears as new data is gathered, ensuring clarity and eliminating outdated signals.
Understanding the Mathematics: Linear Regression Model
This indicator is built around the concept of a linear regression model. Linear regression is a statistical technique used to model and analyze relationships between variables—in this case, time (independent variable) and price (dependent variable).
How Linear Regression Works:
Linear regression fits a straight line (called a "line of best fit") through a set of data points, minimizing the overall distance between each point and the line itself.
Mathematically, this is achieved by minimizing the squared differences (errors) between the observed values (actual prices) and the predicted values (prices on the line).
The linear model used here can be expressed in the form:
y = mx + b
where:
𝑦
y is the predicted price,
𝑥
x represents time (each data sample interval),
𝑚
m is the slope of the line, representing the direction and velocity of the trend,
𝑏
b is the intercept (the theoretical price when x=0).
Why a Linear Model is Beneficial in this Indicator:
Simplicity and Reliability: Linear regression is simple, robust, and widely accepted as a baseline predictive model. It requires minimal computational resources, providing instant updates in real-time trading conditions.
Immediate Directional Feedback: The slope derived from linear regression immediately communicates the directional tendency of recent price action. A positive slope indicates upward pressure, and a negative slope signals downward pressure.
Noise Reduction: Even when price fluctuations are noisy or erratic, linear regression summarizes overall direction clearly, making it easier to detect genuine directional shifts (change of character) rather than random price noise.
Intrabar Analysis: Traditional candlestick analysis relies on fully formed candles, potentially delaying signals. By using linear regression on very short-term (intrabar) data, traders can detect shifts in momentum more quickly, providing an earlier signal than conventional candle patterns alone.
Practical Application:
This indicator helps traders to visually identify:
Early Trend Reversals: Intrabar analysis reveals momentum shifts potentially signaling reversals before they become obvious on conventional candles.
Momentum Continuations: Confidence is gained when all lines in the fan are clearly pointing in the same direction, indicating strong intrabar conviction.
Reduced False Signals: Traditional candlestick signals (e.g., hammer candles) sometimes produce false signals due to intrabar noise. By looking directly into intrabar dynamics, traders gain better context on whether candle patterns reflect genuine directional change or merely noise.
Important Requirements and Recommendations:
Subscription Requirements:
A TradingView subscription that supports sub-minute data (e.g., 1-second or 5-second resolution) is strongly recommended.
If your subscription doesn't include this data granularity, you must use a 1-minute lower timeframe, significantly reducing responsiveness. In this scenario, it's best suited for a 15-minute or higher chart, adjusting intervals to shorter periods.
Live Data Essential:
Real-time market data subscription is essential for the accuracy and effectiveness of this indicator.
Using delayed data reduces responsiveness and weakens the indicator's primary advantage.
Recommended Settings for Different Chart Timeframes:
1-minute chart: Use 1-second lower timeframe intervals (default intervals: 3, 5, 8, 13, 21).
5-minute chart: Adjust to a 5- or 10-second lower timeframe, possibly reducing intervals to shorter periods (e.g., 3, 5, 8, 10, 12).
15-minute or higher charts: Adjust lower timeframe to 1-minute if granular data is unavailable, with reduced interval lengths to maintain responsiveness.
Conclusion:
The Change of Character Fan empowers traders with early insight into directional shifts within each candle, significantly enhancing reaction speed, signal accuracy, and reducing dependency on multiple charts. Built on robust linear regression mathematics, it combines clarity, responsiveness, and ease-of-use in a powerful intrabar analysis tool.
Trade smarter, see sooner, and react faster.
RSI Disparity SignalRSI Disparity Signal Indicator
Overview:
This TradingView indicator detects when the RSI is significantly lower than its RSI-based moving average (RSI MA). Whenever the RSI is 20 points or more below the RSI MA, a signal (red dot) appears above the corresponding candlestick.
How It Works:
Calculates RSI using the default 14-period setting.
Calculates the RSI-based Moving Average (RSI MA) using a 14-period simple moving average (SMA).
Measures the disparity between the RSI and its MA.
Generates a signal when the RSI is 20 points or more below the RSI MA.
Plots a red circle above the candlestick whenever this condition is met.
Customization:
You can modify the RSI length and MA period to fit your trading strategy.
Change the plotshape() style to use different symbols like triangles or arrows.
Adjust the disparity threshold (currently set at 20) to make the signal more or less sensitive.
Use Case:
This indicator can help identify potentially oversold conditions where RSI is significantly below its average, signaling possible price reversals.

Three Bar Reversal Pattern [ActiveQuants]This indicator identifies bullish and bearish three-bar reversal patterns , offering traders a visual tool to spot potential trend reversals. By analyzing consecutive candlesticks, volume trends, and candlestick morphology, it highlights signals while filtering out false patterns. Ideal for traders using price action strategies, it simplifies pattern recognition and enhances decision-making with customizable parameters.
█ KEY FEATURES
Pattern Detection Logic :
Bullish Reversals : Detects two consecutive bearish candles followed by a bullish candle that closes above the open of the first bearish candle .
Bearish Reversals : Identifies two consecutive bullish candles followed by a bearish candle that closes below the open of the first bullish candle .
Volume Confirmation :
Filters signals using a Volume SMA (user-defined length) to ensure reversals occur with above-average volume, adding validity to the pattern.
Candlestick Filtering :
Shooting Star Filter : Discards bullish patterns if the third candle is a Shooting Star (body confined to the lower portion of the candle’s range, adjustable via Shooting Star Body Limit ).
Hammer Filter : Discards bearish patterns if the third candle is a Hammer (body confined to the upper portion of the candle’s range, adjustable via Hammer Body Limit ).
Customizable Display :
Toggle visibility of bullish/bearish patterns and customize their colors.
Adjust the Show Last parameter to limit plotted labels to recent bars.
Alerts Integration :
Separate Bullish/Bearish Alerts : Generate independent alerts for bullish and bearish patterns. Traders can selectively enable one or both alerts via TradingView’s alert system.
Real-time notifications ensure you never miss a potential reversal signal.
█ CONCLUSION
The Three Bar Reversal Pattern Indicator streamlines the identification of reversal setups by combining candlestick patterns, volume analysis, and customizable filters. Its focus on price action dynamics makes it invaluable for traders seeking to capitalize on trend exhaustion or market sentiment shifts.
█ IMPORTANT NOTES
⚠ Use with Confluence : Reversal signals should be validated with additional tools like support/resistance levels, trendlines, or momentum oscillators.
⚠ Adapt Parameters : Adjust Volume SMA Length , Show Last , and body limits ( Shooting Star Body Limit and Hammer Body Limit ) to suit your timeframe and asset volatility.
█ RISK DISCLAIMER
Trading involves significant risk, and you may lose capital. Past performance is not indicative of future results. This tool provides informational signals only and does not constitute financial advice. Use it at your own risk and consult a qualified financial professional before making trading decisions.
Incorporate this indicator into your strategy to refine reversal entries, manage risk, and align with market momentum.
📈 Happy trading! 🚀

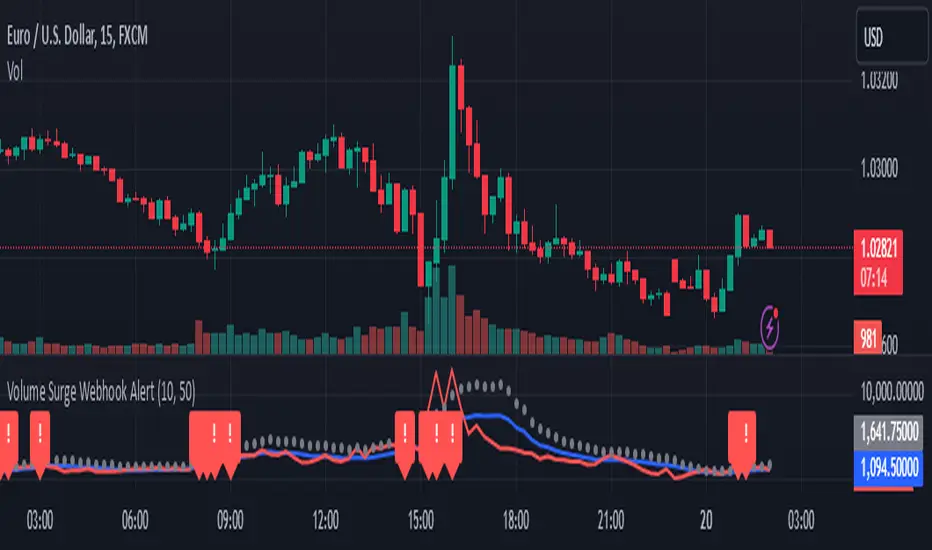
Volume Surge Webhook AlertThis TradingView indicator, named "Volume Surge Webhook Alert," is designed to find significant increases in trading volume and send out alerts with key information. It works by looking back at the volume over a certain number of past candlesticks, which you can set using the "Lookback Period" input. The indicator calculates the average volume during this period. Then, it sets a threshold for what counts as a "volume surge." This threshold is a percentage increase over the average volume, and you can adjust this percentage using the "Volume Surge Threshold (%)" input.
When the current candlestick's volume is higher than this threshold, the indicator considers it a volume surge. To help you see this visually, the indicator plots three lines on a separate chart: the average volume (in blue), the current volume (in red), and the threshold volume (in gray circles).
If a volume surge happens, the indicator creates a webhook alert. This alert sends a message in a structured format (like a digital envelope) that contains the following information: the symbol of the stock or cryptocurrency, the timeframe of the chart you're looking at, the current volume, the average volume, the threshold volume, and a simple message saying a volume surge was detected. This alert is sent only once when the candlestick closes with a volume surge.
Additionally, when a volume surge is detected, a small red exclamation mark "!" will appear above that candlestick on the main price chart.
Essentially, this indicator helps traders spot times when trading volume is unusually high, which can sometimes be a sign of important price movements. You can customize how sensitive the indicator is by changing the "Lookback Period" and the "Volume Surge Threshold (%)". The webhook alerts allow you to be notified automatically when these surges occur, so you don't have to constantly watch the charts.
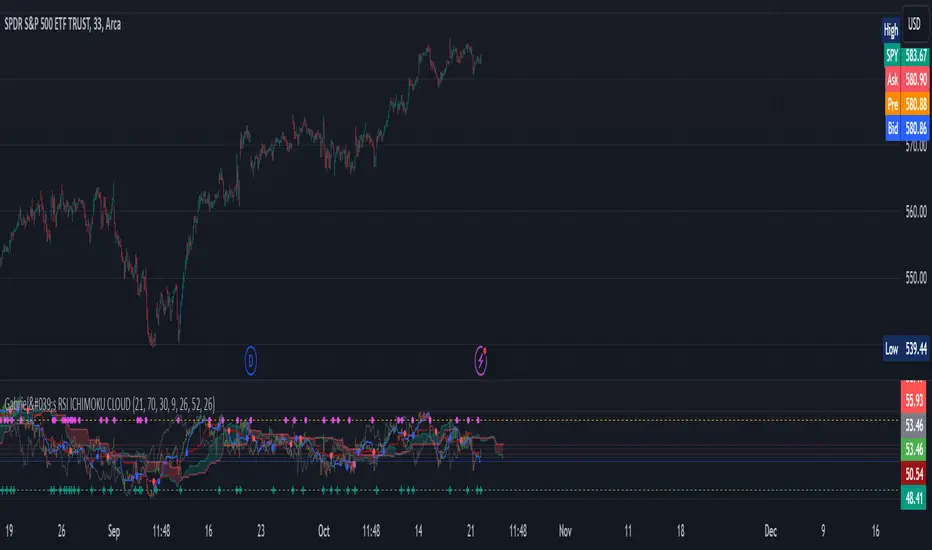
Gabriel's RSI ICHIMOKU CLOUDThe RSI Ichimoku Cloud combines the strengths of the Relative Strength Index (RSI) with the Ichimoku Cloud, offering a robust visualization of momentum and trend signals. This indicator helps traders identify potential trend reversals and key support/resistance levels by blending RSI with the Ichimoku Cloud components.
Key Features:
RSI Component:
Uses a customizable RSI length (default: 21) to detect overbought and oversold conditions.
Upper and Lower Bands (70 and 30) are plotted as dashed lines, highlighting critical zones of strength and weakness.
Bullish (green) and Bearish (red) cross signals are provided when RSI crosses key levels.
Ichimoku Cloud:
Conversion Line (Tenkan Sen): A 9-period Donchian channel (default), representing short-term price movements. Plotted in blue.
Base Line (Kijun Sen): A 26-period Donchian channel (default), representing mid-term price movements. Plotted in red.
Leading Span A (Senkou Span A): The average of the Conversion Line and Base Line, projected forward (displacement: 26). Plotted in green with transparency.
Leading Span B (Senkou Span B): A 52-period Donchian channel (default), projected forward (displacement: 26). Plotted in red with transparency.
The cloud fill between Senkou Span A and B changes color based on bullish (green) or bearish (red) cloud conditions.
Candlestick Overlay:
The indicator uses RSI values to color-code candlesticks. Bullish candles (RSI > Conversion Line) are green, and bearish candles (RSI < Conversion Line) are red.
Signal Crossovers:
RSI-Based Signals: Bullish and Bearish RSI crossovers with the Base Line trigger visual markers.
Ichimoku Signals: Bullish and Bearish crossovers between the Conversion Line and Base Line provide additional trade signals.
Alerts:
Alerts are triggered based on crossovers, allowing traders to set notifications for key trend changes.
This indicator is ideal for traders looking for a powerful blend of momentum (RSI) and trend-following (Ichimoku) tools in one place, with customizable settings for precise trade entry and exit signals.
Median Speed BarThe "Median Speed Bar" is a custom trading indicator designed to classify market candlesticks based on their volatility relative to historical price ranges. It calculates two median price ranges: a short-term median using a customizable period and a long-term median over a much larger timeframe. These medians are based on either the difference between the opening and closing prices or the high and low prices of the candlesticks, depending on user input. The percentage ratio of the short-term median to the long-term median is used to categorize the current candlestick into one of four types: EXTREME, FAST, NORMAL, or SLOW. Each category is linked to customizable thresholds, which are set by the user as percentages.
The script then displays the classification of the current bar in a table at the bottom right corner of the chart, offering an easily readable overview of current market conditions. If the bar's percentage exceeds the extreme threshold, it's classified as "EXTREME" and highlighted in red. Other categories—FAST, NORMAL, and SLOW—are visually distinguished by different colors (orange, green, and blue, respectively). This allows traders to quickly assess volatility and make informed decisions based on how the current price action compares to historical medians.

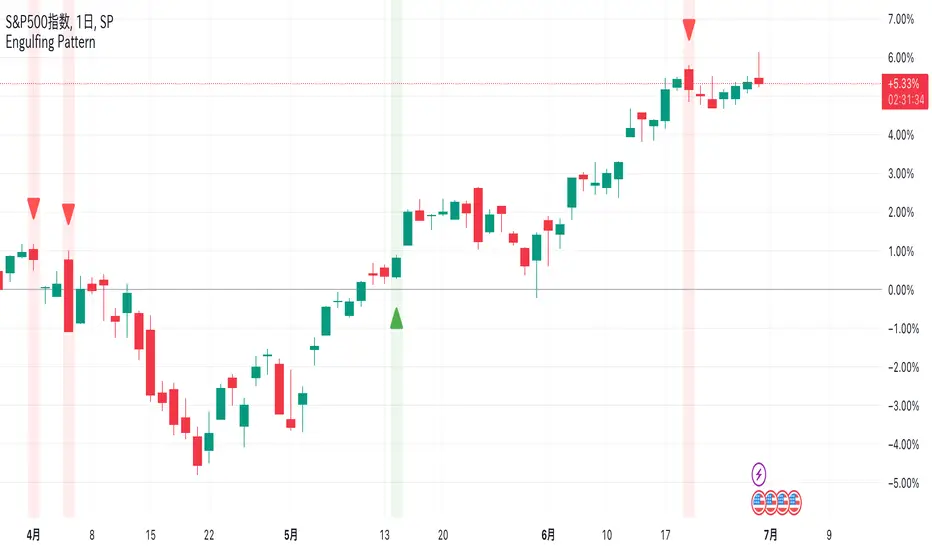
Engulfing Pattern @Ray_SP500NISAEngulfing Patterns
Bullish and bearish hugging candlesticks are powerful reversal formations that generate signals of potential reversals. These patterns are popular candlestick patterns because they are easy to spot and trade.
When the second candlestick completely wraps around the previous candlestick, it is a signal for a market reversal. A positive line encircled by a negative line may indicate a decline, while a negative line encircled by a positive line may indicate an upturn.
The system is simple enough to display these signs in red for a negative line and in green for a positive line. We hope this helps you in your investment life.
Translated with DeepL.com (free version)
Williams %R OB/OS Candle Coloring### Description for TradingView Publication
**Title:** Williams %R OB/OS Candle Coloring
**Description:**
This Pine Script indicator enhances the visibility of market conditions by changing the color of the candlesticks based on the Williams %R values. It helps traders quickly identify overbought and oversold conditions without the need to display the Williams %R line or any additional bands.
**How It Works:**
- The script calculates the Williams %R value using a specified lookback period (default is 14 days).
- It then compares the Williams %R value against predefined overbought and oversold levels.
- **Overbought Condition:** When the Williams %R value is greater than the upper band level (-20 by default), the candlestick color changes to blue.
- **Oversold Condition:** When the Williams %R value is less than the lower band level (-80 by default), the candlestick color changes to yellow.
**How to Use:**
1. **Input Parameters:**
- **Length:** The lookback period for calculating Williams %R (default is 14).
- **Upper Band Level:** The threshold for overbought conditions (default is -20).
- **Lower Band Level:** The threshold for oversold conditions (default is -80).
2. **Candlestick Coloring:**
- Blue candles indicate potential overbought conditions.
- Yellow candles indicate potential oversold conditions.
This indicator is designed to provide a visual cue directly on the price chart, making it easier for traders to spot extreme market conditions at a glance.
**Concepts Underlying the Calculation:**
Williams %R, developed by Larry Williams, is a momentum indicator that measures overbought and oversold levels. It compares the current closing price to the highest high and lowest low over a specified period. By using color-coded candles, traders can quickly assess market conditions and make informed decisions without the need to interpret an additional indicator line.
This script is particularly useful for traders who prefer a clean chart but still want to leverage the insights provided by the Williams %R indicator.
---
### ภาษาไทย:
**คำอธิบาย:**
สคริปต์ Pine Script ตัวนี้ช่วยเพิ่มการมองเห็นสภาวะตลาดโดยการเปลี่ยนสีของแท่งเทียนตามค่าของ Williams %R ช่วยให้เทรดเดอร์สามารถระบุสภาวะการซื้อเกินและขายเกินได้อย่างรวดเร็วโดยไม่ต้องแสดงเส้น Williams %R หรือเส้นระดับเพิ่มเติมใดๆ
**วิธีการทำงาน:**
- สคริปต์คำนวณค่าของ Williams %R โดยใช้ช่วงเวลาที่กำหนด (เริ่มต้นที่ 14 วัน)
- จากนั้นเปรียบเทียบค่าของ Williams %R กับระดับการซื้อเกินและขายเกินที่กำหนดไว้
- **สภาวะการซื้อเกิน:** เมื่อค่าของ Williams %R มากกว่าระดับ Upper Band (-20 เริ่มต้น) สีของแท่งเทียนจะเปลี่ยนเป็นสีน้ำเงิน
- **สภาวะการขายเกิน:** เมื่อค่าของ Williams %R น้อยกว่าระดับ Lower Band (-80 เริ่มต้น) สีของแท่งเทียนจะเปลี่ยนเป็นสีเหลือง
**วิธีการใช้งาน:**
1. **ค่าพารามิเตอร์:**
- **Length:** ช่วงเวลาที่ใช้คำนวณ Williams %R (เริ่มต้นที่ 14)
- **Upper Band Level:** ระดับการซื้อเกิน (เริ่มต้นที่ -20)
- **Lower Band Level:** ระดับการขายเกิน (เริ่มต้นที่ -80)
2. **การเปลี่ยนสีแท่งเทียน:**
- แท่งเทียนสีน้ำเงินระบุถึงสภาวะการซื้อเกิน
- แท่งเทียนสีเหลืองระบุถึงสภาวะการขายเกิน
อินดิเคเตอร์นี้ถูกออกแบบมาเพื่อให้สัญญาณภาพตรงบนกราฟราคาช่วยให้เทรดเดอร์สามารถมองเห็นสภาวะตลาดได้อย่างชัดเจนและทำการตัดสินใจได้ง่ายขึ้น
**แนวคิดที่อยู่เบื้องหลังการคำนวณ:**
Williams %R ที่พัฒนาโดย Larry Williams เป็นอินดิเคเตอร์โมเมนตัมที่วัดระดับการซื้อเกินและขายเกิน มันเปรียบเทียบราคาปิดปัจจุบันกับราคาสูงสุดและต่ำสุดในช่วงเวลาที่กำหนด โดยใช้แท่งเทียนที่มีการเปลี่ยนสี เทรดเดอร์สามารถประเมินสภาวะตลาดและทำการตัดสินใจได้อย่างรวดเร็วโดยไม่ต้องตีความเส้นอินดิเคเตอร์เพิ่มเติม
สคริปต์นี้มีประโยชน์โดยเฉพาะสำหรับเทรดเดอร์ที่ต้องการกราฟที่สะอาดแต่ยังต้องการใช้ข้อมูลเชิงลึกจากอินดิเคเตอร์ Williams %R

Momentum spotter(FogWalkerTrader) This a trend following indicator using simple moving averages and price close,high and low of recent candles to plot a buy or sell signal.
IMPORTANT - this indicator does not repaint.Traders need to wait untill the the closing of the candle though as the signal is dependant of the close of the period.
Buy Signal: Price closes above the 20, 50, and 200 simple moving averages (SMAs), with the 50 SMA above the 200 SMA, indicating a strong uptrend. The last 4 prices had their lows below the 5 SMA and highs above it.Plus, the current close is higher than the high from 4 periods ago, further suggesting a bullish move.
BUY = blue labelup plotted below candlestick
Sell Signal: Price closes below the 20, 50, and 200 SMAs, with the 50 SMA below the 200 SMA, signaling a strong downtrend. The last 4 prices had their highs above the 5 SMA and lows below it Plus, the current close is lower than the low from 4 periods ago, further suggesting a bearish move.
SELL = red labeldown plotted above candlestick.
IMPORTANT
It’s important to note that, like any trading tool, this isn't foolproof. The market can be unpredictable, leading to false signals. The logic behind these signals is sound, but due to the complexity and volatility of the market, there are times when the signals may not lead to the expected outcome. It's a useful tool, but it's wise to use it alongside other analyses to make more informed decisions.

[AlbaTherium] MTF Internal Ranges Analysis - IRA-Phoenix for SMCIntroduction:
The MTF Internal Ranges Analysis - IRA - Phoenix acts as an extension to the original main SMC Indicator by AlbaTherium . This add-on provides insights into multi-timeframe internal structure points, swing structure points, POIs (Points of Interest), and order blocks (OB). By integrating this enhancement, your multi-timeframe analyses become more streamlined, expediting the process and minimizing chart workload .
This tool represents an advanced smart money technical analysis aimed at enhancing your trading experience. It introduces four pivotal concepts:
Main Features:
Multiple Timeframes and Confluences,
SCOB Internal Order Block.
Demand to Supply (D2S) or Supply to Demand (S2D) across Multiple timeframes
SCOB on LTF and SCM on HTF across same Candle
By combining these concepts all in one, traders can find confluences zones across multiple timeframes and gain a comprehensive understanding of market dynamics, theses confluences zones empower order block skills and potentiality, showcasing them as essential, crucial, powerful, strategic, and pivotal, one of the pillars in smart money concepts trading strategy to make more informed decisions.
Settings Overview:
Select timeframe {Select or current chart}
Inside bar ranges
Internal structure as Internal zigzag {turn on/ off / unconfirmed(live) zigzag}
Single Candle Mitigation Pattern {turn on/ off / confirmed / unconfirmed}
Single Candle Order Block Pattern {turn on/ off / confirmed / unconfirmed}
Demands and Supplies (D&S) {turn on/ off / confirmed / unconfirmed}
OB Mitigation {touch/ extended}
Understanding the Features:
Chapter 1: Multiple Timeframes and Confluences
Our Multi-timeframe analysis approach enables traders to analyze market trends and volatility across different timeframes. Confluences, where signals align across multiple timeframes, provide strong indications for trading opportunities.
Practical Example:
- With MTF IRA - Phoenix , traders can seamlessly transition between different timeframes while maintaining a cohesive analysis. For instance, traders can monitor the M15, H1, or M5 charts while focusing on entry on the M1 timeframe, enabling a holistic view of market trends and opportunities .
Chapter 2: SCOB Internal Order Block across Multiple Timeframe
SCOB Internal Order Block (SCOB IOB) highlights critical zones in price action, showcasing the dominance of aggressive buyers or sellers on orders blocks. As confluences accumulate across multiple timeframes, the strength of the order block intensifies, presenting entry opportunities.
Practical Example:
You have the ability to detect zones where price ranges have formed; these areas are highly sought after for taking buying as well as selling positions, especially when these areas are reflected across 1 or 3 timeframes.
The only practical way to see theses confluences is to use this Indicator, see the example below
Chapter 03: Demand to Supply (D2S) or Supply to Demand (S2D) across Multiple timeframes
The Demand to Supply or Supply to Demand feature within MTF Internal Ranges Analysis - IRA - Phoenix offers a nuanced analysis of price action dynamics across various timeframes. By identifying shifts in supply and demand zones, traders gain valuable insights into market sentiment and potential price reversals.
This feature enables traders to anticipate changes in market direction by recognizing the interplay between demand and supply across different timeframes. By understanding how price reacts at key support and resistance levels, traders can make informed decisions and capitalize on emerging trends.
The Demand to Supply or Supply to Demand feature enhances the indicator's usefulness by providing traders with actionable information to navigate complex market conditions effectively. With this comprehensive analysis, traders can better manage risk and optimize trading strategies across multiple timeframes.
Real-world Example:
Chapter 04: SCOB on LTF and SCM on HTF across same Candle
with MTF Internal Ranges Analysis - IRA - Phoenix , explores the concepts of SCOB (Single Candle Order Block) on Lower Timeframes (LTF) and SCM (Single Candle Mitigation) on Higher Timeframes (HTF).
SCOB on LTF refers to the identification and analysis of single candle order blocks within shorter timeframes. These blocks represent critical price levels where significant buying or selling activity occurred within a single candlestick. By recognizing SCOB patterns, traders can pinpoint key areas of market interest and anticipate potential price movements.
On the other hand, SCM on HTF involves analyzing single candle mitigation entries within longer timeframes. This technique aims to capitalize on price reversals or shifts in market sentiment indicated by single candlestick patterns. By incorporating SCM analysis, traders can gain insights into broader market trends and make strategic trading decisions accordingly.
the intricacies of SCOB on LTF and SCM on HTF, offering traders valuable tools to enhance their analysis and decision-making processes across different timeframes. Through a comprehensive understanding of these concepts, traders can identify high-probability trading opportunities and navigate the markets with confidence.
Real-world Example:
SCOB on M5 and SCM on M15 generate a powerful order block.
Conclusion:
MTF Internal Ranges Analysis - IRA - Phoenix for Smart Money Concepts is a valuable asset for traders seeking to add more insights in today's dynamic markets especially for Intraday Traders. By focusing on concepts like "Multiple timeframes and Confluences, with one single timeframe u can analyze all timeframes", "SCOB Internal Order Block. With its innovative features and user-friendly interface, whether you're a seasoned trader or just starting your journey, MTF IRA - Phoenix can help you navigate through the complexities of price action and make more informed trading choices.
This document provides an extensive overview of MTF Internal Ranges Analysis - IRA - Phoenix, emphasizing its importance in comprehending market dynamics and utilizing essential smart money concepts trading principles.

Bollinger Bands Inside barthe indicator name is Bollinger Band inside bar because it uses Bollinger Band and inside bar to take counter-trend positions in the market. whenever this pattern is formed then it can be used to take an entry into the market. the candlestick pattern recognizes 3 candle candlestick. first the mother bar i.e. the medium to the big size candle that intersects with the upper and the lower levels of the Bollinger band. the second candle should be an inside bar i.e. the high and low of the current bar should be less than the previous bar. finally, the last bar who's low should be less than the mother bar in case of the mother bar is at upper levels and if the mother bar is at lower levels then the candle's high should be more than the mother bar. the stop-loss should be high and low of the mother bar respectively. entry should be taken as soon as the low and high of the mother bar is taken out respectively. target should be 1:1 or 20 sma or lower Bollinger band in case the entry is taken from the top. works best if there is a trend and the market takes a pullback and this pattern is formed.
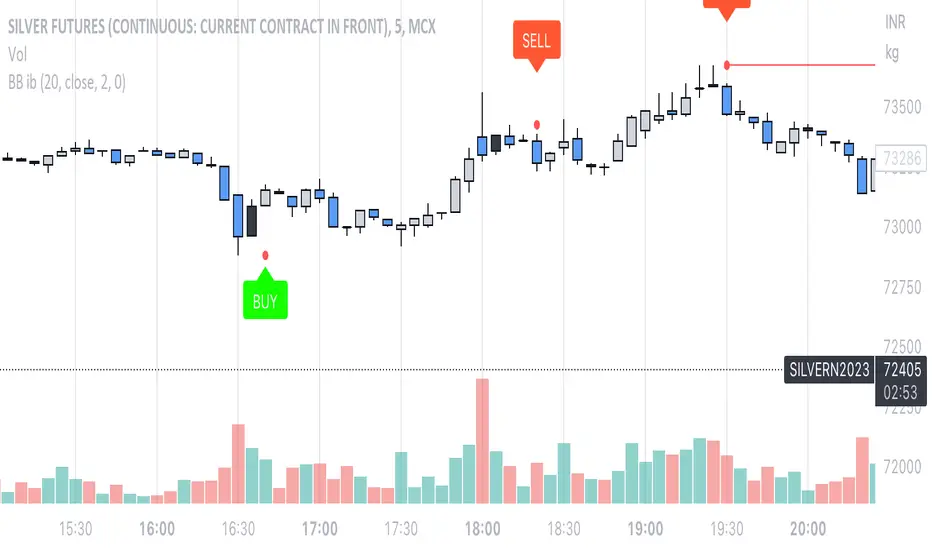
ikulichkov: Moving CandlesIntroduction:
Moving Candles is an indicator developed by TradingView user ikulichkov, designed to provide a new perspective on price action. The Moving Candles indicator works by creating unique candlesticks that incorporate both box and line elements. The box element is used to represent the price range of each candle, while the line element represents the opening and closing prices. This provides traders with a visual representation of the relationship between the opening and closing prices and the overall trend of the market.
Indicator Overview:
Moving Candles indicator is based on the simple moving average (SMA), which is calculated for two periods. The indicator displays the fast and slow SMAs on the chart, allowing traders to identify potential trend reversals. The indicator creates unique candlesticks that incorporate both box and line elements. The box element is used to represent the price range of each candle, while the line element represents the opening and closing prices.
The color of the candle created by the indicator reflects the direction of the trend. When the fast SMA is above the slow SMA, the color of the candle is green, indicating an uptrend. When the fast SMA is below the slow SMA, the color of the candle is red, indicating a downtrend. The color of the line (wick) reflects the position of the closing price relative to the opening price of the unique candlestick created by the indicator.
Moving Candles indicator allows traders to customize the style of the candles and change the periods of the moving averages to find optimal results.
Conclusion:
Moving Candles is a useful indicator for traders who want to visualize price action and identify potential trend reversals. By incorporating both box and line elements, the Moving Candles indicator provides traders with a unique perspective on the market. The indicator is easy to use and allows traders to customize the style of the candles and change the periods of the moving averages to find optimal results. Moving Candles is a valuable tool for traders looking to improve their trading strategies and gain a deeper understanding of the market.