Taiwan Pagoda Chart (Triple) Indicator Name
Taiwan Pagoda Chart
This is a technical analysis charting method similar to candlesticks but with different logic, designed to filter market noise and identify trend reversal points.
Key Features
Dynamic Pagoda Line Plotting
Unlike traditional candlesticks that plot every bar, the Pagoda line only updates when the price breaks above the previous high or below the previous low by a certain threshold.
Bullish (rising) bars are shown in green; bearish (falling) bars in red.
Multiple Optional Filters
T-value filter: Sets a minimum price change threshold to avoid signals from minor fluctuations.
Price percentage filter: Dynamically adjusts sensitivity based on a percentage of the previous Pagoda bar’s range.
ATR volatility filter: Uses Average True Range (ATR) to widen the threshold during high volatility and tighten it during low volatility.
Visual Design
Semi-transparent Pagoda structure for better visual context.
A bold central trend line to clearly show the underlying market direction.
Trading Signal Alerts
Bullish reversal (turning green): Potential buy signal.
Bearish reversal (turning red): Potential sell signal.
Optional on-chart labels (B / S) and support for TradingView alert notifications.
Highly Customizable
Users can freely adjust colors, line width, filtering rules, and signal visibility—making it adaptable to various trading styles.
Ideal Use Cases
Trend following
Reducing false breakouts
Helping medium-to-long-term traders identify high-probability entry and exit points
Search in scripts for "Candlestick"

AMHA + 4 EMAs + EMA50/200 Counter + Avg10CrossesDescription:
This script combines two types of Heikin-Ashi visualization with multiple Exponential Moving Averages (EMAs) and a counting function for EMA50/200 crossovers. The goal is to make trends more visible, measure recurring market cycles, and provide statistical context without generating trading signals.
Logic in Detail:
Adaptive Median Heikin-Ashi (AMHA):
Instead of the classic Heikin-Ashi calculation, this method uses the median of Open, High, Low, and Close. The result smooths out price movements, emphasizes trend direction, and reduces market noise.
Standard Heikin-Ashi Overlay:
Classic HA candles are also drawn in the background for comparison and transparency. Both HA types can be shifted below the chart’s price action using a customizable Offset (Ticks) parameter.
EMA Structure:
Five exponential moving averages (21, 50, 100, 200, 500) are included to highlight different trend horizons. EMA50 and EMA200 are emphasized, as their crossovers are widely monitored as potential trend signals. EMA21 and EMA100 serve as additional structure layers, while EMA500 represents the long-term trend.
EMA50/200 Counter:
The script counts how many bars have passed since the last EMA50/200 crossover. This makes it easy to see the age of the current trend phase. A colored label above the chart displays the current counter.
Average of the Last 10 Crossovers (Avg10Crosses):
The script stores the last 10 completed count phases and calculates their average length. This provides historical context and allows traders to compare the current cycle against typical past behavior.
Benefits for Analysis:
Clearer trend visualization through adaptive Heikin-Ashi calculation.
Multi-EMA setup for quick structural assessment.
Objective measurement of trend phase duration.
Statistical insight from the average cycle length of past EMA50/200 crosses.
Flexible visualization through adjustable offset positioning below the price chart.
Usage:
Add the indicator to your chart.
For a clean look, you may switch your chart type to “Line” or hide standard candlesticks.
Interpret visual signals:
White candles = bullish phases
Orange candles = bearish phases
EMAs = structural trend filters (e.g., EMA200 as a long-term boundary)
The counter label shows the current number of bars since the last cross, while Avg10 represents the historical mean.
Special Feature:
This script is not a trading system. It does not provide buy/sell recommendations. Instead, it serves as a visual and statistical tool for market structure analysis. The unique combination of Adaptive Median Heikin-Ashi, multi-EMA framework, and EMA50/200 crossover statistics makes it especially useful for trend-followers and swing traders who want to add cycle-length analysis to their toolkit.
The Bravo KitThe Bravo Suite is an all-encompassing toolset that provides traders with various indicators and technical analysis tools. It is designed for ease of use, with simple inputs and intuitive visuals, to assist the average trader in making informed decisions. This guide will provide an overview of the different features included in the Bravo Suite and delve into some of the more intricate details.
Features of the Bravo Suite
Bravo Candles
These candles provide a unique way of visualizing price action by color-coding the candles based on their angle relative to the past price. Users have the option to enable or disable the Bravo Candles theme.
As shown below purple shades start to appear when price is overextended - leveraging the trend angle calculation:
Bravo Sequential
The Bravo Sequential system is a unique take on the traditional 9 count system that aims to identify potential trend exhaustion points. The major difference in the Bravo Sequential is that it uses the trend angle once again, instead of the generic method of counting candlesticks. By incorporating trend angle, it can potentially provide better insights into the momentum behind the current price trend and identify trend exhaustion points more effectively.
This approach allows the Bravo Sequential system to take into account not only the number of consecutive price increases or decreases but also the strength of these movements. Consequently, it can provide a more accurate depiction of the underlying trend, especially if the momentum of the price action is changing.
While the traditional 9 count system only counts the number of sequential candles based on consecutive higher or lower closes, the Bravo Sequential system uses the angle of the trend to identify if the trend is losing strength. It displays a 9 count when it detects a possible trend exhaustion point, accompanied by an optional label for better visibility on the chart.
+ Icons are also produced at the custom 9 count levels making it clearer to see these potential exhaustion zones.
Bravo Fibonacci Bands
The Bravo Fibonacci Bands are an advanced and innovative feature of the Bravo Suite, specifically designed to offer a more precise and dynamic price channel using a custom blend of Fibonacci numbers and weighted averages. This powerful combination allows traders to observe potential support and resistance levels, providing valuable insights into market direction and price movements.
Fibonacci numbers are a well-known and incredibly important concept in mathematics, with various applications in trading and technical analysis.
The Bravo Suite harnesses the power of Fibonacci numbers in the Bravo Fibonacci Bands by building a custom low lag weighted average from the input length. This is achieved by applying the metallic mean (also known as the "golden mean" or "silver mean") to the input series. By leveraging Fibonacci numbers in this manner, the weighted average effectively shifts more weight to the most recent values, emphasizing the importance of the current market trend.
The Bravo Fibonacci Bands dynamically adjust to the ever-changing market conditions, offering the trader an powerful level of precision in identifying crucial price levels. This approach blends the best of both worlds.
The end result is a reliable, easy-to-read price channel that gives traders the confidence to make informed decisions no matter what the market throws their way.
Moving Averages
The Bravo 9 Moving Average is included in the suite, alongside other useful Moving Averages for various timeframes, such as 200-day Moving Average, and 200-week Moving Average. Traders can toggle the visibility of each Moving Average. These are custom designed lower lag moving averages designed as assistive and supporting features in the toolkit.

Neural Network Buy and Sell SignalsTrend Architect Suite Lite - Neural Network Buy and Sell Signals
Advanced AI-Powered Signal Scoring
This indicator provides neural network market analysis on buy and sell signals designed for scalpers and day traders who use 30s to 5m charts. Signals are generated based on an ATR system and then filtered and scored using an advanced AI-driven system.
Features
Neural Network Signal Engine
5-Layer Deep Learning analysis combining market structure, momentum, and market state detection
AI-based Letter Grade Scoring (A+ through F) for instant signal quality assessment
Normalized Input Processing with Z-score standardization and outlier clipping
Real-time Signal Evaluation using 5 market dimensions
Advanced Candle Types
Standard Candlesticks - Raw price action
Heikin Ashi - Trend smoothing and noise reduction
Linear Regression - Mathematical trend visualization
Independent Signal vs Display - Calculate signals on one type, display another
Key Settings
Signal Configuration
- Signal Trigger Sensitivity (Default: 1.7) - Controls signal frequency vs quality
- Stop Loss ATR Multiplier (Default: 1.5) - Risk management sizing
- Signal Candle Type (Default: Candlesticks) - Data source for signal calculations
- Display Candle Type (Default: Linear Regression) - Visual candle display
Display Options
- Signal Distance (Default: 1.35 ATR) - Label positioning from price
- Label Size (Default: Medium) - Optimal readability
Trading Applications
Scalping
- Fast pace signal detection with quality filtering
- ATR-based stop management prevents signal overlap
- Neural network attempts to reduces false signals in choppy markets
Day Trading
- Multi-timeframe compatible with adaptation settings
- Clear trend visualization with Linear Regression candles
- Support/resistance integration for better entries/exits
Signal Filtering
- Use A+/A grades for highest probability setups
- B grades for confirmation in trending markets
- C-F grades help identify market uncertainty
Why Choose Trend Architect Lite?
No Lag - Real-time neural network processing
No Repainting - Signals appear and stay fixed
Clean Charts - Focus on price action, not indicators
Smart Filtering - AI reduces noise and false signals
Flexible and customizable - Works across all timeframes and instruments
Compatibility
- All Timeframes - 1m to Monthly charts
- All Instruments - Forex, Crypto, Stocks, Futures, Indices
Risk Disclaimer
This indicator is a tool for technical analysis and should not be used as the sole basis for trading decisions. Past performance does not guarantee future results. Always use proper risk management and never risk more than you can afford to lose.

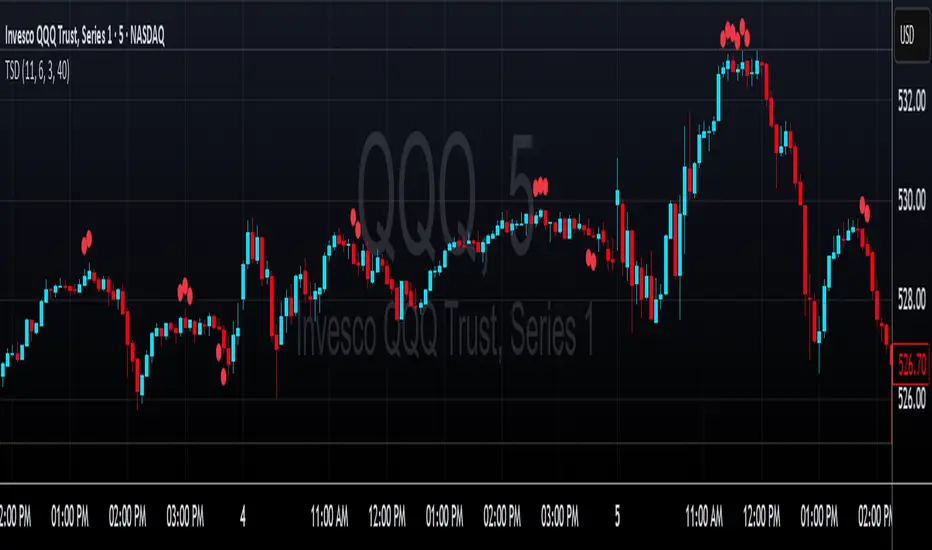
LRHA Trend Shift DetectorLRHA Trend Shift Detector (TSD)
The LRHA Trend Shift Detector is an advanced momentum exhaustion indicator that identifies potential trend reversals and changes by analyzing Linear Regression Heikin Ashi (LRHA) candle patterns. TSD focuses on detecting when strong directional moves begin to lose momentum.
🔬 Methodology
The indicator employs a three-stage detection process:
LRHA Calculation: Applies linear regression smoothing to Heikin Ashi candles, creating ultra-smooth trend-following candles that filter out market noise
Extended Move Detection: Identifies sustained directional moves by counting consecutive bullish or bearish LRHA candles
Momentum Exhaustion Analysis: Monitors for significant changes in candle size compared to recent averages
When an extended move shows clear signs of momentum exhaustion, the indicator signals a potential trend shift with red dots plotted above or below your candlesticks.
⚙️ Parameters
Core Settings
LRHA Length (11): Linear regression period for smoothing calculations. Lower values = more responsive, higher values = smoother trends.
Minimum Trend Bars (4): Consecutive candles required to establish an "extended move." Higher number detects longer term trend changes.
Exhaustion Bars (3): Number of consecutively smaller candles needed to signal exhaustion. Lower is more sensitive.
Size Reduction Threshold (40%): Percentage decrease in candle size to qualify as "exhaustion." Lower is more sensitive.
Trend Trading
Pullback Entries: Identify exhaustion in counter-trend moves for trend continuation
Exit Strategy: Recognize when main trend momentum is fading
Position Sizing: Reduce size when seeing exhaustion in your direction
🎛️ Optimization Tips
For More Signals (Aggressive)
- Decrease LRHA Length (7-9)
- Reduce Minimum Trend Bars (2-3)
- Lower Size Reduction Threshold (25-35%)
For Higher Quality (Conservative)
- Increase LRHA Length (13-18)
- Raise Minimum Trend Bars (5-6)
- Higher Size Reduction Threshold (45-55%)
⚠️ Important Notes⚠️
- **Not a Complete Strategy**: Use as confluence with other analysis methods
- **Market Context Matters**: Consider overall trend direction and key support/resistance levels
- **Risk Management Essential**: Always use proper position sizing and stop losses
- **Backtest First**: Optimize parameters for your specific trading style and instruments
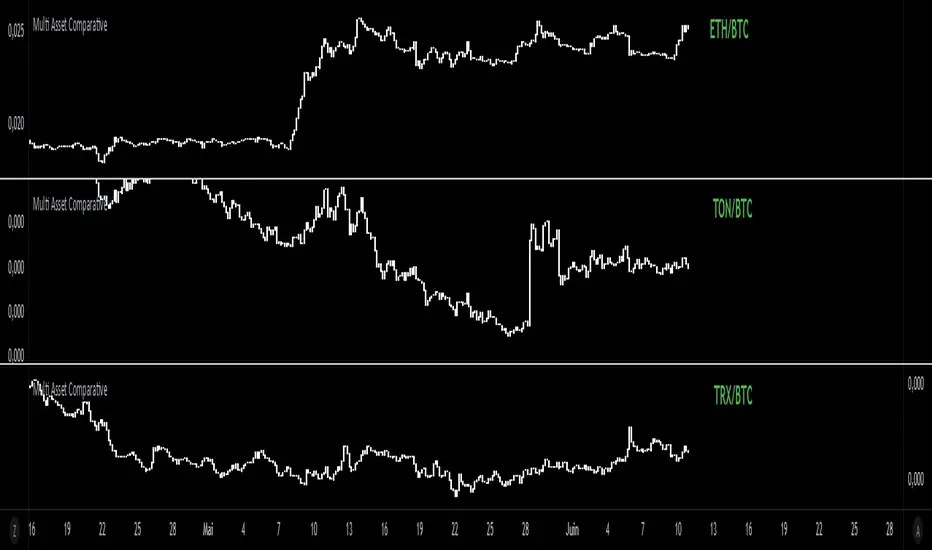
Multi Asset Comparative📊 Multi Asset Comparative – Compare Baskets of Cryptos Visually
This indicator allows you to compare the performance of two groups of cryptocurrencies (or any assets) over time, using a clean and intuitive chart.
Instead of looking at each asset separately, this tool gives you a global view by showing how one group performs relative to another — all displayed in the form of candlesticks.
🧠 What This Tool Is For
Markets constantly shift, and capital rotates between sectors or tokens. This script helps you visually track those shifts by answering a key question:
"Is this group of assets getting stronger or weaker compared to another group?"
For example:
Compare altcoins vs Bitcoin
Track the DeFi sector vs Ethereum
Analyze your custom portfolio vs the market
Spot moments when money flows from majors to smaller caps, or vice versa
🧩 How It Works (Simplified)
You select two groups of assets:
Group 1 (up to 20 assets) — the one you want to analyze
Group 2 (up to 5 assets) — your comparison baseline
The indicator then creates a single line of candles that represents the performance of Group 1 compared to Group 2. If the candles go up, it means Group 1 is gaining strength over Group 2. If the candles go down, it's losing ground.
This lets you see market dynamics in one glance, instead of switching charts or running calculations manually.
🚀 Why It's Unique
Unlike many indicators that just show data from one asset, this one provides a bird's-eye view of multiple assets at once — condensed into a simple visual ratio.
It’s:
Customizable (you choose the assets)
Visual and intuitive (no need to interpret tables or formulas)
Actionable (helps with trend confirmation, macro views, and market rotation)
Whether you're a swing trader, a macro analyst, or building your own strategy, this tool can help you spot opportunities hidden in plain sight.
✅ How to Use It
Choose your two groups of assets (e.g., altcoins vs BTC/ETH)
Watch the direction of the candles:
Uptrend = Group 1 gaining strength over Group 2
Downtrend = Group 1 weakening
Use it to confirm market shifts, anticipate rotations, or analyze sector strength
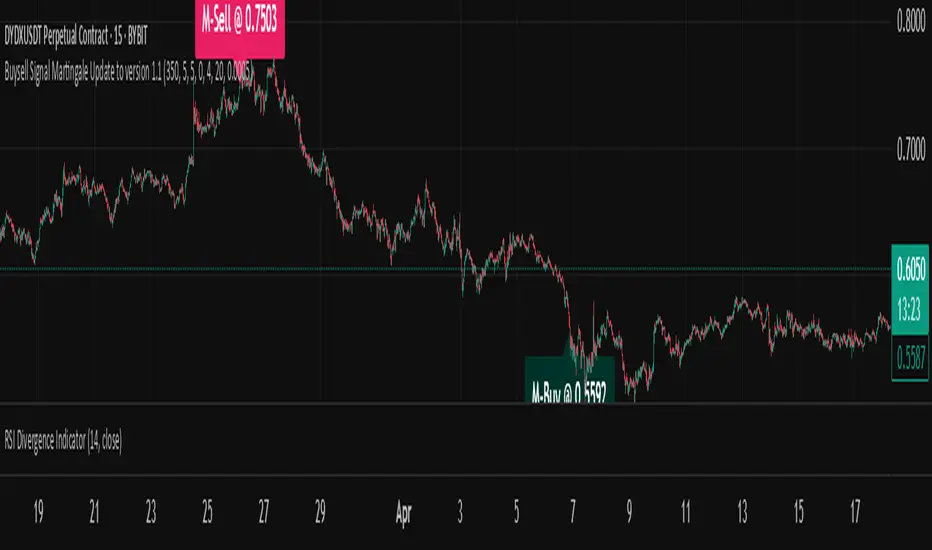
Buysell Martingale Signal - CustomBuysell Martingale Signal - Custom Indicator
Introduction:
This indicator provides a dynamic buy and sell signal system incorporating an adaptive Martingale logic. Built upon the signalLib_yashgode9/2 library, it is designed for use across various markets and timeframes.
Key Features:
Primary Buy & Sell Signals: Identifies initial buy and sell opportunities based on directional changes derived from the signalLib.
Martingale Signals:
For Short (Sell) Positions: A Martingale Sell signal is triggered when the price moves against the existing short position by a specified stepPercent from the last entry price, indicating a potential opportunity to average down or increase position size.
For Long (Buy) Positions: Similarly, a Martingale Buy signal is triggered when the price moves against the existing long position by a stepPercent from the last entry price.
On-Chart Labels: Displays clear, customizable labels on the chart for primary Buy, Sell, Martingale Buy, and Martingale Sell signals.
Customizable Colors: Allows users to set distinct colors for primary signals and Martingale signals for better visual distinction.
Adjustable Sensitivity: Features configurable parameters (DEPTH_ENGINE, DEVIATION_ENGINE, BACKSTEP_ENGINE) to fine-tune the sensitivity of the underlying signal generation.
Webhook Support (Static Message Alerts): This indicator provides alerts with static messages for both primary and Martingale buy/sell signals. These alerts can be leveraged for automation by external systems (such as trading bots or exchange-provided Webhook Signal Trading services).
Important Note: When using these alerts for automation, an external system is required to handle the complex Martingale logic and position management (e.g., tracking steps, PnL calculation, hedging, dynamic quantity sizing), as this indicator solely focuses on signal generation and sending predefined messages.
How to Use:
Add the indicator to your desired chart.
Adjust the input parameters in the indicator's settings to match your specific trading symbol and timeframe.
For automation, you can set up TradingView alerts for the Buy Signal (Main/Martingale) and Sell Signal (Main/Martingale) conditions, pointing them to your preferred Webhook URL.
Configurable Parameters:
DEPTH_ENGINE: (e.g., 30) Controls the depth of analysis for the signal algorithm.
DEVIATION_ENGINE: (e.g., 5) Defines the allowable deviation for signal generation.
BACKSTEP_ENGINE: (e.g., 5) Specifies the number of historical bars to look back.
Martingale Step Percent: (e.g., 0.5) The percentage price movement against the current position that triggers a Martingale signal.
Labels Transparency: Adjusts the transparency of the on-chart signal labels.
Buy-Color / Sell-Color: Sets the color for primary Buy and Sell signal labels.
Martingale Buy-Color / Martingale Sell-Color: Sets the color for Martingale Buy and Sell signal labels.
Label size: Controls the visual size of the labels.
Label Offset: Adjusts the vertical offset of the labels from the candlesticks.
Risk Warning:
Financial trading inherently carries significant risk. Martingale strategies are particularly high-risk and can lead to substantial losses or even complete liquidation of capital if the market moves strongly and persistently against your position. Always backtest thoroughly and practice with a demo account, fully understanding the associated risks, before engaging with real capital.
Candle/Keltner Channels BUY SELLWhy Use Candlesticks?
They help traders visualize price action
Used in technical analysis and price pattern recognition (e.g., Doji, Engulfing, Hammer)
Assist in determining entry and exit points
Why Traders Use Keltner Channels?
Keltner Channels are widely used by traders for identifying trends, detecting volatility, and spotting trade opportunities.
1. Trend Identification
The middle line (EMA) shows the general trend.
If price consistently stays above the middle line, it indicates a strong uptrend.
If price stays below, it signals a downtrend.
Use: Traders follow the trend direction to enter trades in line with momentum.
2. Volatility Measurement
The width of the channel expands and contracts based on Average True Range (ATR).
Wider channels = high volatility, tighter channels = low volatility.
Use: Helps traders decide when to expect breakouts or calm periods.
3. Breakout Signals
A break above the upper band can signal a bullish breakout.
A break below the lower band can signal a bearish breakout.
Use: Traders use this for momentum trading and breakout entries.
4. Overbought/Oversold Conditions
Price touching or crossing the upper band may suggest it's overbought.
Price touching or crossing the lower band may suggest it's oversold.
Use: Traders combine this with RSI or MACD to confirm reversal setups.
5. Trade Entry and Exit
When price pulls back to the middle EMA during a trend, it may present a buy/sell opportunity.
Exits can also be planned if price returns inside the bands after a breakout.
Use: Helps with precise entry and exit timing.
6. Combines Well With Other Indicators
Commonly used with:
RSI (for confirmation)
MACD (for momentum)
Candlestick patterns (for price action signals)
Combining Candlestick Patterns with Keltner Channels gives traders a powerful method to confirm entries, spot reversals, and improve accuracy. Here’s why this combination works so well:
1. Context for Candlestick Signals
Candlestick patterns (like doji, engulfing, or pin bars) show potential price reversals, but they need context to be reliable. Keltner Channels provide that context:
A bullish candlestick near the lower band suggests a stronger buy signal.
A bearish candlestick near the upper band strengthens a sell signal.
2. Filtering False Signals
Candlestick patterns occur frequently, and not all are meaningful.
The location within the Keltner Channel helps filter out weak or false patterns.
Example: A bullish engulfing candle outside the lower band = high-probability reversal.
3. Improved Entry Timing
Traders wait for a candlestick pattern confirmation when price touches or crosses a Keltner band.
This avoids premature entries and allows tighter stop-losses.
4. Better Risk-Reward Setup
Candlestick entry near channel extremes (upper/lower band) lets traders place stop-losses just beyond recent highs/lows.
The target can be the opposite side of the channel or the middle EMA.
5. Visual Simplicity
Keltner Channels + Candles are visually intuitive.
Even beginner traders can easily recognize:
Overextended candles near channel edges.
Confirmed breakouts or reversals.
This Timeframe 5 min : XAUUSD

AQPRO Pattern Map
📝 INTRODUCTION
AQPRO Pattern Map is a comprehensive trading tool designed to automate the detection of 27 most popular candlestick patterns across any financial asset, making it a powerful tool for traders who use strategies, which are based on candlestick patterns.
This indicator not only identifies candlestick patterns but also incorporates multi-timeframe (MTF) analysis , risk management tools like Take-Profit (TP) and Stop-Loss (SL) , and labeled visual cues for effortless chart reading. Below is the complete list of patterns it supports:
📜 Patterns scanned by the indicator:
One-candle patterns:
Hammer;
Shooting Star;
Marubozu (Bullish/Bearish);
Doji.
Two-candle patterns:
Belt Hold (Bullish/Bearish);
Engulfing (Bullish/Bearish);
Harami (Bullish/Bearish);
Harami Cross (Bullish/Bearish);
Kicker (Bullish/Bearish);
Window (Rising/Falling Gap);
Piercing Line / Dark Cloud Cover.
Three-candle patterns:
Outside Up / Down Bar;
Inside Up / Down Bar;
Morning Star / Evening Star;
Three White Soldiers / Three Black Crows;
Advance Block / Descent Block;
Tasuki Gap (Upside/Downside);
Side-by-Side White Lines.
Multi-candle patterns:
Rising One / Falling One;
Rising Two / Falling Two;
Rising Three / Falling Three;
Rising Four / Falling Four;
Rising Five / Falling Five;
Breakaway Two / Three / Four / Five (Bullish/Bearish);
Fakey (Bullish/Bearish).
With this tool, traders can visually and systematically track key candlestick setups across multiple timeframes simultaneously, making it an all-in-one solution for identifying actionable patterns.
🎯 PURPOSE OF USAGE
The primary goal of the "AQPRO Pattern Map" is to equip traders with a highly efficient way of identifying significant candlestick patterns across different timeframes, making the decision-making process stronger in a sense of both quality and quantity of presented information.
Specifically, this indicator addresses the following needs:
Automation of pattern detection.
Nobody likes searching for patterns on the chart "by hand", because it takes too much time and mental energy. With this screener you can forget about this problem: automatic scanning for 27 of the most commonly used patterns will save your tens, if not hundreds of hours of time, so you can focus on what really matters;
Multi-timeframe (MTF) analysis.
This one is one of the most unique features of this indicator, because after conducting product research in library of open-source scripts alike this screener, almost none of reviewed indicators had MTF analysis feature embedded in them. This feature is important for the simplest of reasons: you see candlestick data from other timeframes without jumping from one timeframe to another . Needless to say how much time it will save for traders over the years of trading. See description below to learn more on exact functionality of our MTF analysis;
Risk management automation.
Humans tend to overestimate risk, when matters are about earning money from "financially-dangerous" activities and trading is no exception. To help traders better understand what they risk, we implemented a simple, yet effective way of displaying levels of risk for each pattern. For each new pattern on the chart you will be able see automatic creation of Take-Profit (TP) and Stop-Loss (SL) levels. It involves creation and displaying of lines and labels, representing each level at its exact coordinates. This elevates visual perception of risk for fellow traders and avoid excessive risk in many cases;
Simplicity in data visualization.
Charts, which are cluttered with pointless visual noise, presented as 'additional confirmation analysis', don't foster insights and are not worth a dime . We understand this issue very well and we designed our indicator with the solution to this problem in mind. Every bit of information, that you will see on your chart, will make sense both technically and visually — no more wasting time cleaning mess on your charts.
By addressing the needs, described above, this indicator will be a useful tool for any trader, who employs principles of candlestick pattern analysis, because most important pains of this kind of analysis are efficiently handled by our indicator.
⚙️ SETTINGS OVERVIEW
Customization options of our indicator are quite extensive, because flexibility in such indicator is in the top of most important qualities. Let's review each group of settings deeper:
📊 Patterns: One-Candle
This group allows you to enable or disable specific onep -candle candlestick patterns.
Toggle on/off switch for Hammer, Shooting Star, Marubozu, and Doji .
📊 Patterns: Two-Candle
This group allows you to enable or disable specific two -candle candlestick patterns.
Toggle on/off switch for Belt Hold, Engulfing, Harami & Harami Cross, Kicker, Window, Piercing Line & Dark Cloud Cover .
📊 Patterns: Three-Candle
This group allows you to enable or disable specific three -candle candlestick patterns.
Toggle on/off switch for Morning Star & Evening Star, Three White Soldiers, Three Black Crows, Advance Block & Descent Block, Tasuki Gap, Side-by-Side Gap (Bullish), Squeeze .
📊 Patterns: Multi-Candle
This group allows you to enable or disable specific multi -candle (3 or more candle) candlestick patterns.
Toggle on/off switch for Rising/Falling sequences, Breakaway patterns, and Fakey .
📊 MTF Settings
These settings allow you to use the Multi-Timeframe Screener to display patterns from additional timeframes.
"Use MTF Screener" — toggles the addition of MTF Screener to main dashboard ( described in 'Visual Settings' ). If enabled, adds section of MTF Screener below main dashboard
* List of four timeframes — your personal list to choose your timeframe, which will be used to get data about latest patterns. Default list of timeframes includes timeframes like 15min, 30min 1hr, 4hr .
* The detected patterns from these timeframes will be displayed in the MTF Dashboard on the chart.
🛡️ Risk Settings
As was described above, risk settings in our indicator will control appearance of TP and SL labels and lines, which appear for each new trade. Here you can customize the most essential parameters.
"Show TP/SL" — toggles the visibility of Take-Profit (TP) and Stop-Loss (SL) values for the most recent pattern.
"Risk-to-Reward Ratio (R:R)" — defines your desired risk/reward ratio for the TP and SL calculations. The more this parameter is, the further the TP from entry level will be.
🎨 Visual Settings
In this group of settings you can fine-tune the visual appearance of the indicator to fit your preferences.
IMPORTANT: colour parameters from this group of settings affect ONLY colours in the dashboard.
"Use info dashboard" — if enabled, shows dashboard in the top right corner of the chart, which displays latest pattern's TP and SL alongside with this pattern's trade status: '⏳' - TP or SL have not been reached yet, '✋' - TP or SL have already been reached already, refrain from taking the trade.
"Bullish Pattern" — defines the color for bullish patterns.
"Bearish Pattern" — defines the color for bearish patterns.
"Neutral Pattern" — specify the color for neutral patterns like Doji.
"Frame Width" — adjusts the thickness of frames highlighting detected patterns on the chart.
📈 APPLICATION GUIDE
The way of application of this indicator is pretty straightforward, because trading methodologies based on candlestick patterns were developed decades ago and haven't changed much since then. However, we find it necessary to explain the most essential ways of application in this section.
Let's start with the basics — how you will your chart look when you load the indicator for the first time:
By default we have 5 main visual data "blocks":
Bullish patterns;
Bearish patterns;
Risk visualization;
Main Dashboard;
MTF Screener.
Let's review each of these groups one by one.
BULLISH & BEARISH PATTERNS
Patterns are displayed as up/down labels, which are styled in corresponding to trend colours. Each patterns has its own unique emoji to help traders easily navigate between patterns.
Also by default each pattern has its custom frame, inside of which resides candle (or multiple candles) of the pattern iself. These frames are made with purpose to show each pattern in a very clear way on the chart, because huge number of public scripts usually only show simple label of such patterns and don't highlight the pattern itself on the chart. To remove frames you can set "Frame Width" parameter to 0 in 'Visual Settings' group in the settings.
You can see the examples of frame on the screenshot below:
RISK VISUALIZATION (TP & SL)
Displaying Take-Profits and Stop-Losses in our indicator on the chart works quite simple: for each new trade indicator creates new pairs of lines and labels for TP and SL, while lines & labels from previous trade are erased for aesthetics purposes. Each label shows price coordinates, so that each trader would be able to grap the numbers in seconds.
See the visual showcase of TP & SL visualization on the screenshot below:
Also, whenever TP or SL of the current trade is reached, drawing of both TP and SL stops . When the TP is reached, additional '✅' emoji on the TP price is shown as confirmation of Take-Profit.
However, while TP or SL has not been reached, TP&SL labels and lines will be prolonged until one of them will be reached or new signals will come.
See the visual showcase of TP & SL stopping being visualized & TP on the screenshot below:
MAIN DASHBOARD
Main dashboard is displayed in the top right corner of the chart and it shows the data of latest pattern, that occurred on the current asset and current timeframe: pattern's name, TP, SL and trade status. Depending on bullishness or bearishness of the pattern, dashboard is colour in respective colour.
Also on the right of side TP and SL data block there is a so called trade status. It is basically an indication of wether or not latest pattern's trade is still active or not:
If TP or SL of the pattern have not been reached yet, trade is considered active and is marked with '⏳' emoji;
If TP or SL of the pattern have already been reached, trade is considered inactive and is marked with '✋' emoji.
See the visual showcase of dashboard on the screenshot below:
MTF Screener
MTF Screener is displayed right below the main dashboard and its has distinctive 'MTF Patterns' header row on the top, painted in gray colour to make sure that every traders understand he is looking at.
This screener shows the timeframe and name of patterns from four other timeframes, which trader can customize in the settings to his liking. This will help trader get more insights on global sentiment of other timeframes, which improves trading results overall if applied correctly.
In the future MTF Screener will be expanded to have more data in it, like TP and SL, age of pattern and etc.
See the visual showcase of the MTF Screener on the screenshot below:
Features, explained above, make this indicator quite versatile and suitable for incorporation in any trading strategy, which uses candlestick patterns. They are simple, yet insightful, and traders, which use similar strategies everyday, will truly appreciate the benefits of this indicator when they will set up this indicator for the first time on their chart.
🔔 ALERTS
This indicator employs alerts for an event when new pattern occurs. While creating the alert below 'Condition' field choose 'any alert() function call' .
When this alert is triggered, it will generate this kind of message:
string msg_template = "EXCHANGE:ASSET, TIMEFRAME: BULLISH_OR_BEARISH pattern PATTERN_NAME was found."
string msg_example = "BINANCE:BTCUSDT, 15m: bullish pattern 'Hammer' was found."
📌 NOTES
This indicator is most effective when used in combination with other technical analysis tools such as trendlines, moving averages, support/resistance levels or any other indicator-type tool. We strongly recommend using this indicator as confirmation indicator for your main trading strategy, not as primary source of signals;
If you want to trade directly by these patterns, make sure to use proper risk management techniques of your own and use TP&SL visualization on the chart to always have a clue about your current position;
If you lost track of visual components on the chart, look at the main dashboard to see text summary of data from latest pattern. Also don't forget to look at MTF Screener to have more context about MTF sentiment, because it is increases your understandings of MTF price trend and improves your decision-making process.
🏁 AFTERWORD
AQPRO Pattern Map was built to help traders automate candlestick pattern searching routine, improve chart readability and enhance perception of current potential risks, which may come from trading from a specific pattern. Indicator's main dashboard and MTF screener eliminate the need for constantly checking other timeframe for global sentiment, helping traders save even more time and fostering improved decision making.
This indicator will work in great conjunction with any other trading strategy as confirmation tool for entry decision. Using this indicator as primary source of signals is not recommended due to unstable nature of trading patterns.
ℹ️ If you have questions about this or any other our indicator, please leave it in the comments.

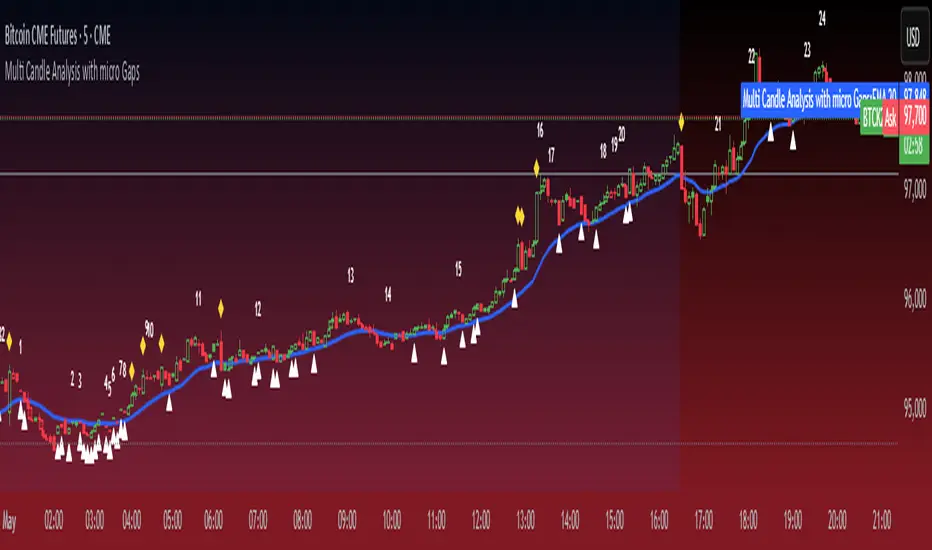
Micro Gaps DetectorSimple Micro Gap Indicator: A Technical Analysis Tool
The Simple Micro Gap Indicator is a specialized momentum indicator designed to identify and analyze micro gaps between consecutive candlesticks in financial charts. Unlike traditional gap analysis that focuses on larger price gaps, this indicator specifically targets smaller, less noticeable spaces between candles.
Key Features:
Detects minimal price disparities between consecutive candlesticks
Helps identify potential short-term momentum shifts
Useful for high-frequency trading and scalping strategies
Functions as a momentum indicator for short-term price movements
Volume Delta with Custom Colors and Min Delta Input### Indicator Description: **Volume Delta with Custom Colors and Min Delta Input**
---
Volume Delta with Custom Colors and Min Delta Input is a powerful and flexible indicator for analyzing volume delta (the difference between buying and selling volume) on TradingView charts. This indicator visualizes volume delta with customizable colors and allows filtering based on a minimum delta value. It is an ideal tool for traders who want to gain deeper insights into market activity and identify significant volume changes.
---
### Key Features:
Volume Delta Visualization:
- The indicator displays volume delta as candlesticks, where:
- Green candles indicate positive delta (buying volume dominance).
- Red candles indicate negative delta (selling volume dominance).
Customizable Colors:
- Users can choose their preferred colors for positive and negative delta to tailor the indicator to their preferences.
Minimum Delta Volume Filter:
- Added functionality to set a minimum delta volume threshold. This helps ignore insignificant volume changes and focus on important movements.
Flexible Timeframe Selection:
- The indicator supports analyzing volume delta on a different timeframe than the current chart. For example, you can analyze hourly volume delta on a daily chart.
Adaptive Settings:
- Users can configure the moving average (SMA) period and standard deviation multiplier to calculate the delta threshold.
---
### How to Use the Indicator:
Add the Indicator to Your Chart:
- Search for the indicator in the TradingView library and add it to your chart.
Configure the Settings:
- Positive Delta Bar Color: Choose the color for bars with positive delta.
- Negative Delta Bar Color: Choose the color for bars with negative delta.
- Minimum Delta Volume: Set the minimum delta volume value to be displayed.
- Use Custom Timeframe: Enable if you want to analyze volume on a different timeframe.
- Timeframe: Specify the desired timeframe for volume analysis (e.g., "1H" for hourly).
- SMA Period: Set the moving average period for delta calculation.
- Delta Multiplier: Adjust the standard deviation multiplier to fine-tune the delta threshold.
Analyze the Chart:
- Green candles indicate buying volume dominance, while red candles indicate selling volume dominance.
- Use the minimum delta volume filter to focus on significant movements.
---
### Benefits of the Indicator:
Flexibility: Customizable colors, timeframe selection, and filtering make the indicator versatile for various trading strategies.
Clarity: Volume delta visualization as candlesticks allows for quick assessment of market activity.
Noise Reduction: The minimum delta volume filter helps ignore insignificant changes and focus on important movements.
---
### Example Use Cases:
For Scalping: Use a minute timeframe and set a minimum delta volume filter to identify short-term volume anomalies.
For Long-Term Trading: Analyze volume delta on daily or weekly timeframes to identify key support and resistance levels.
---
### Recommendations:
Use the indicator in combination with other technical analysis tools (e.g., support/resistance levels or trendlines) to improve signal accuracy.
Experiment with the settings to adapt the indicator to your trading strategies.
---
Volume Delta with Custom Colors and Min Delta Input is an essential tool for traders who want to gain a deeper understanding of market dynamics and make more informed trading decisions. Try it out today and see its effectiveness for yourself!

SSL Channel MTFSSL Channel with MTF support, This eliminates the noise of a basic SSL Channel script which is based on ErwinBeckers SSL Channel. So i have used a Multi Time Frame approach to have a clear confirmation of trend and reduce Noise and False signals unlike basic SSL Channel.
This script can be used to determine.
Support/Resistance
High/Low Breakout
Trend Direction
MA candles for Entry
The high and low sma are plotted as SSL CHANNEL when ever the high and low sma cross each other a direction change is observed.
The direction of SSL channel determines the trend of the price. The length of the channel can be changed as required a low value has a high noise and direction can be determined with low accuracy. Increasing the length of SSL channel has high accuracy trend confirmation.
The MTF SSL Channel uses plot from higher timeframe this helps in using SSL Channel as a Price Action Tool. Price when ever crosses over or below the channel determines a breakout. Price tries to move between the High SMA line and Low SMA Line of the SSL Channel rejection, breakouts can be easily observed on a lower timeframe using SSL Channel Plot from a higher timeframe.
I have used 5min/15min chart with MTF SSL from a 1Hr/4Hr and a length of 5 instead of 10. This helps quick direction changes over a period of 1hr to 4hr. Price is trapped within the High SMA and Low SMA lines of SSL Channel. In addition to SSL High Low and average mid line is plotted to additional reference.
Buy Sell Signals are plotted based on crossover of SMA High and Low.
Candle are Plotted Using a SMA with length of 5. This Candle Plot can be used to make an entry based on direction confirmation of SSL. keep in mind the direction of SSL Plot and the candle must be same. Preferably Entry can made above or below the midline of SSL Channel. The Candle Plot eliminates the Noise of traditional Japanese Candlesticks.
Additionally MACD Crossover and MACD Trend line confirmations can be used to confirm a Buy Sell and Entry signals
Alerts are also plotted accordingly.

MM Candle Bias Volume Trend Matrix Pro Overlay @MaxMaseratiThis overlay indicator colors candlesticks based on trend strength and volume analysis from the MMM Candle Bias Volume Trend Matrix Pro system. It uses EMAs (8, 21, 50) for trend identification and a 20-period volume average for volume confirmation.
Candlesticks are colored:
- Strong Green: Bullish trend with high volume (>1.5x average)
- Light Green: Bullish trend with normal volume
- Strong Red: Bearish trend with high volume (>1.5x average)
- Light Red: Bearish trend with normal volume
The coloring provides a visual representation of market control and trend strength, aligning with the complete Matrix Pro system's analysis framework.

FVG Breakout/BreakdownThe FVG Breakout/Breakdown indicator is designed to identify potential breakout and breakdown opportunities in the market, based on the concept of Fair Value Gaps (FVGs). FVGs are areas where price moves too quickly, leaving behind gaps between candlesticks, often seen as areas of inefficiency or imbalance that the market tends to revisit.
Key Concepts:
Fair Value Gaps (FVG):
FVG occurs when a price gap is created between candlesticks, typically when the high of one candle is lower than the low of the previous candle (for a bearish FVG) or the low of one candle is higher than the high of the previous candle (for a bullish FVG).
These gaps represent an imbalance between buying and selling pressure, and the market often revisits them, making them valuable for identifying potential entry points.
Bullish FVG: This occurs when the low of the current candle is higher than the high of the previous candle.
Condition: low > high
Bearish FVG: This occurs when the high of the current candle is lower than the low of the previous candle.
Condition: high < low
Breakout/Breakdown Signals:
Breakout: A bullish breakout signal occurs when the price breaks above a defined resistance level after an FVG gap. This suggests that the market may continue moving higher.
Breakdown: A bearish breakdown signal occurs when the price breaks below a defined support level after an FVG gap. This suggests that the market may continue moving lower.
NWOG (New Week Opening Gap):
The NWOG can be used as an additional factor to confirm the FVG signal. The gap between Friday's close and Monday's open is a crucial level for identifying the start of a new move for the week.
NWOG helps to further refine the timing of breakout or breakdown signals, only triggering them when price moves relative to the Monday Open and shows a new direction.
NWOG with FVGThe New Week Opening Gap (NWOG) and Fair Value Gap (FVG) combined indicator is a trading tool designed to analyze price action and detect potential support, resistance, and trade entry opportunities based on two significant concepts:
New Week Opening Gap (NWOG): The price range between the high and low of the first candle of the new trading week.
Fair Value Gap (FVG): A price imbalance or gap between candlesticks, where price may retrace to fill the gap, indicating potential support or resistance zones.
When combined, these two concepts help traders identify key price levels (from the new week open) and price imbalances (from FVGs), which can act as powerful indicators for potential market reversals, retracements, or continuation trades.
1. New Week Opening Gap (NWOG):
Definition:
The New Week Opening Gap (NWOG) refers to the range between the high and low of the first candle in a new trading week (often, the Monday open in most markets).
Purpose:
NWOG serves as a significant reference point for market behavior throughout the week. Price action relative to this range helps traders identify:
Support and Resistance zones.
Bullish or Bearish sentiment depending on price’s relation to the opening gap levels.
Areas where the market may retrace or reverse before continuing in the primary trend.
How NWOG is Identified:
The high and low of the first candle of the new week are drawn on the chart, and these levels are used to assess the market's behavior relative to this range.
Trading Strategy Using NWOG:
Above the NWOG Range: If price is trading above the NWOG levels, it signals bullish sentiment.
Below the NWOG Range: If price is trading below the NWOG levels, it signals bearish sentiment.
Price Touching the NWOG Levels: If price approaches or breaks through the NWOG levels, it can indicate a potential retracement or reversal.
2. Fair Value Gap (FVG):
Definition:
A Fair Value Gap (FVG) occurs when there is a gap or imbalance between two consecutive candlesticks, where the high of one candle is lower than the low of the next candle (or vice versa), creating a zone that may act as a price imbalance.
Purpose:
FVGs represent an imbalance in price action, often indicating that the market moved too quickly and left behind a price region that was not fully traded.
FVGs can serve as areas where price is likely to retrace to fill the gap, as traders seek to correct the imbalance.
How FVG is Identified:
An FVG is detected if:
Bearish FVG: The high of one candle is less than the low of the next (gap up).
Bullish FVG: The low of one candle is greater than the high of the next (gap down).
The area between the gap is drawn as a shaded region, indicating the FVG zone.
Trading Strategy Using FVG:
Price Filling the FVG: Price is likely to retrace to fill the gap. A reversal candle in the FVG zone can indicate a trade setup.
Support and Resistance: FVG zones can act as support (in a bullish FVG) or resistance (in a bearish FVG) if the price retraces to them.
Combined Strategy: New Week Opening Gap (NWOG) and Fair Value Gap (FVG):
The combined use of NWOG and FVG helps traders pinpoint high-probability price action setups where:
The New Week Opening Gap (NWOG) acts as a major reference level for potential support or resistance.
Fair Value Gaps (FVG) represent market imbalances where price might retrace to, filling the gap before continuing its move.
Signal Logic:
Buy Signal:
Price touches or breaks above the NWOG range (indicating a bullish trend) and there is a bullish FVG present (gap indicating a support area).
Price retraces to fill the bullish FVG, offering a potential buy opportunity.
Sell Signal:
Price touches or breaks below the NWOG range (indicating a bearish trend) and there is a bearish FVG present (gap indicating a resistance area).
Price retraces to fill the bearish FVG, offering a potential sell opportunity.
Example:
Buy Setup:
Price breaks above the NWOG resistance level, and a bullish FVG (gap down) appears below. Traders can wait for price to pull back to fill the gap and then take a long position when confirmation occurs.
Sell Setup:
Price breaks below the NWOG support level, and a bearish FVG (gap up) appears above. Traders can wait for price to retrace and fill the gap before entering a short position.
Key Benefits of the Combined NWOG & FVG Indicator:
Combines Two Key Concepts:
NWOG provides context for the market's overall direction based on the start of the week.
FVG highlights areas where price imbalances exist and where price might retrace to, making it easier to spot entry points.
High-Probability Setups:
By combining these two strategies, the indicator helps traders spot high-probability trades based on major market levels (from NWOG) and price inefficiencies (from FVG).
Helps Identify Reversal and Continuation Opportunities:
FVGs act as potential support and resistance zones, and when combined with the context of the NWOG levels, it gives traders clearer guidance on where price might reverse or continue its trend.
Clear Visual Signals:
The indicator can plot the NWOG levels on the chart, and shade the FVG areas, providing a clean and easy-to-read chart with entry signals marked for buy and sell opportunities.
Conclusion:
The New Week Opening Gap (NWOG) and Fair Value Gap (FVG) combined indicator is a powerful tool for traders who use price action strategies. By incorporating the New Week's opening range and identifying gaps in price action, this indicator helps traders identify potential support and resistance zones, pinpoint entry opportunities, and increase the probability of successful trades.
This combined strategy enhances your analysis by adding layers of confirmation for trades based on significant market levels and price imbalances. Let me know if you'd like more details or modifications!

TechniTrend: Candle Pattern Detector (CPD) v3TechniTrend: Candle Pattern Detector (CPD)
The "TechniTrend: Candle Pattern Detector (CPD)" is a powerful tool designed to enhance the analysis of candlestick patterns across financial charts to understand market behavior. This indicator detects a wide range of reversal and continuation patterns, providing traders with insights into potential market movements. It incorporates dynamic filtering and customizable settings for precision in pattern recognition, allowing users to tailor the detection criteria to different trading styles.
🔷 Key Features
Comprehensive Pattern Detection: Identifies numerous candlestick patterns, including bullish and bearish reversals, continuation setups, and indecision formations.
Dynamic Filtering Options: Filter patterns are based on trend conditions, moving average positioning, and additional criteria to increase signal accuracy.
Customizable Input Settings: Provides adjustable parameters, such as body ratios and shadow length requirements, enabling traders to fine-tune detection thresholds.
Real-Time Alerts: Generates alerts when patterns are detected, ensuring traders can respond swiftly to market opportunities.
Graphical Representation: Visualizes detected patterns on the chart using intuitive labels, colors, and markers, helping to identify key signals quickly.
Supported Patterns
The indicator covers a wide range of candlestick patterns.
❇️ 51 Candlestick Patterns
🟢 Bullish Reversal Candlestick Patterns:
Bullish engulfing - Hammer - Morning star - Piercing line - Three white soldiers - Inverted hammer - Three Inside Up - Bullish Harami - Tweezer Bottom - White Marubozu - Dragonfly Doji - Three Outside Up - Bullish Counterattack Line - Bullish Abandoned Baby - Bullish Tri-Star - Hammer Doji - Morning Star Doji
🔴 Bearish Reversal Candlestick Patterns:
Bearish engulfing - Shooting star - Evening star - Hanging man - Three black crows - Dark cloud cover - Hanging Man Doji - Three Inside Down - Bearish Harami - Tweezer Top - Black Marubozu - Three Outside Down - Bearish Counterattack Line - Gravestone Doji - Evening Star Doji - Bearish Abandoned Baby - Bearish Tri-Star
🟩 Bullish Continuation Candlestick Patterns:
Rising Three Methods - Bullish Kicker - Mat Hold Bullish - Three Line Strike - Upside Tasuki Gap - Rising Window
🟥 Bearish Continuation Candlestick Patterns:
Falling Three Methods - Bearish Kicker - Mat Hold Bearish - Three Line Strike Bearish - Downside Tasuki Gap - Falling Window - On Neck Bearish
🟡 Indecision Candlestick Patterns:
Doji - Long Legged Doji - Spinning top - High Wave
Usage Recommendations
Optimized for Any Market: Designed for stocks, forex, cryptocurrencies, and other assets.
Ideal for Multi-Timeframe Analysis: Use it across different timeframes for better market timing.
Customization Options
Pattern Detection Settings: Users can adjust parameters like body-to-range ratios, shadow length requirements, and gap conditions for accurate detection.
Moving Average Filtering: Choose separate moving averages for reversal and continuation patterns to filter out false signals.
Table Display: These tables display pattern counts, allowing traders to assess the frequency and significance of various candlestick formations quickly.
Alert Configurations: Set custom alerts for specific patterns to stay informed about potential trading opportunities.
Story of Candlestick Pattern:
Candlestick patterns have a rich history rooted in ancient Japanese trading practices dating back to the 17th century. They were first developed by rice traders to visualize price movements and detect patterns reflecting market psychology. The logic behind candlestick patterns lies in the emotions driving market participants—fear, greed, uncertainty, and hope—captured through the open, high, low, and close prices.
Each pattern tells a story about buyers' and sellers' behavior, illustrating shifts in sentiment that can signal reversals or continuations in the market trend. By recognizing these patterns, traders can anticipate potential price movements and make informed decisions. The longevity and continued relevance of candlestick analysis highlight its effectiveness in understanding market dynamics.
🔓 Unlock Access
Check out the Author's Instructions or Dm me to Access the full version of the candlestick analysis with TechniTrend: Candle Pattern Detector (CPD).

Candle Range Theory | Flux Charts💎 GENERAL OVERVIEW
Introducing our new Candle Range Theory Indicator! This powerful tool offers a strategy built around the Candle Range Theory, which analyzes market movements through the relative size and structure of price candles. For more information about the process, check the "HOW DOES IT WORK" section.
Features of the new Candle Range Theory Indicator :
Implementation of the Candle Range Theory
FVG & Order Block Entry Methods
2 Different TP / SL Methods
Customizable Execution Settings
Customizable Backtesting Dashboard
Alerts for Buy, Sell, TP & SL Signals
📌 HOW DOES IT WORK ?
The Candle Range Theory (CRT) indicator operates by identifying significant price movements through the relative size and structure of candlesticks. A key part of the strategy is determining large candles based on their range compared to the Average True Range (ATR) in a higher timeframe. Once identified, a breakout of either the high wick or the low wick of the large candle is required. This breakout is considered a liquidity grab. After that, the indicator waits for confirmation through Fair Value Gaps (FVGs) or Order Blocks (OBs). The confirmation structure must be the opposite direction of the breakout, for example if the high wick is broken, a bearish FVG is required for the short entry. After a confirmation signal is received, the indicator will trigger entry points based on your chosen entry method (FVG or OB), and exit points will be calculated using either a dynamic ATR-based TP/SL method or fixed percentages. Alerts for Buy, Sell, Take-Proft, and Stop-Loss are available.
🚩 UNIQUENESS
This indicator stands out because it combines two highly effective entry methods: Fair Value Gaps (FVGs) and Order Blocks (OBs). You can choose between these strategies depending on market conditions. Additionally, the dynamic TP/SL system uses the ticker's volatility to automatically calculate stop-loss and take-profit targets. The backtesting dashboard provides metrics about the performance of the indicator. You can use it to tune the settings for best use in the current tiker. The Candle Range Theory approach offers more flexibility compared to traditional indicators, allowing for better customization and control based on your risk tolerance.
⚙️ SETTINGS
1. General Configuration
Higher Timeframe: Customize the higher timeframe for analysis. Recommended combinations include M15 -> H4, H4 -> Daily, Daily -> Weekly, and Weekly -> Monthly.
HTF Candle Size: Define the size of the higher timeframe candles as Big, Normal, or Small to filter valid setups based on their range relative to ATR.
Entry Mode: Choose between FVGs and Order Blocks for your entry triggers.
Require Retracement: Enable this option if you want a retracement to the FVG or OB for entry confirmation.
Show HTF Candle Lines: Toggle to display the higher timeframe candle lines for better visual clarity.
2. Fair Value Gaps
FVG Sensitivity: You may select between Low, Normal, High or Extreme FVG detection sensitivity. This will essentially determine the size of the spotted FVGs, with lower sensitivities resulting in spotting bigger FVGs, and higher sensitivities resulting in spotting all sizes of FVGs.
3. Order Blocks
Swing Length: Swing length is used when finding order block formations. Smaller values will result in finding smaller order blocks.
4. TP / SL
TP / SL Method:
a) Dynamic: The TP / SL zones will be auto-determined by the algorithm based on the Average True Range (ATR) of the current ticker.
b) Fixed : You can adjust the exact TP / SL ratios from the settings below.
Dynamic Risk: The risk you're willing to take if "Dynamic" TP / SL Method is selected. Higher risk usually means a better winrate at the cost of losing more if the strategy fails. This setting is has a crucial effect on the performance of the indicator, as different tickers may have different volatility so the indicator may have increased performance when this setting is correctly adjusted.

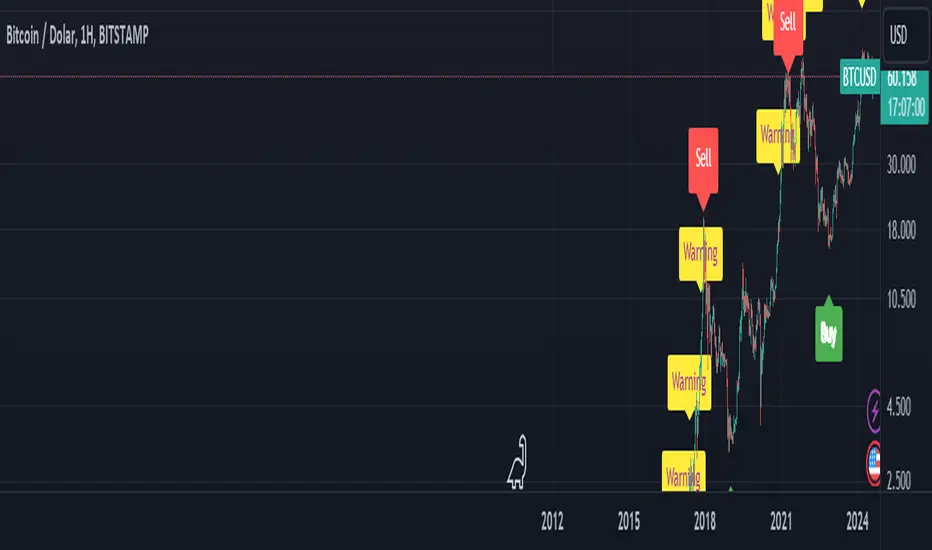
BTC Arcturus IndicatorBTC Arcturus Indicator: This indicator is designed to create buy and sell signals based on the market value of Bitcoin. It also predicts potential market tops with the Pi Cycle Top indicator.
How Does It Work?
1. MVRVZ (Market Value to Realized Value-Z Score) Calculation:
MC: Bitcoin's market cap (Market Cap) is pulled daily from Glassnode data.
MCR: Realized Market Cap of Bitcoin is taken daily from Coinmetrics data.
MVRVZ: It is calculated by dividing the difference between Bitcoin's market value and realized market value by one standard deviation. This value indicates whether the market is overvalued or undervalued.
2. Reception and Warning Signals:
Buy Signal: When MVRVZ falls below the -0.255 threshold value, the indicator gives a "Buy" signal. This indicates that Bitcoin is undervalued and may be a buying opportunity.
Warning Signal: A warning signal turns on when MVRVZ exceeds the threshold value of 2.765. This indicates that the market is approaching saturation and caution is warranted.
3. Tracking the Highest MVRVZ Value:
The indicator records the highest MVRVZ value in the last 10 candlesticks. This value is used to determine whether the market has reached its highest risk levels.
4. Warning Display:
If the MVRVZ value matches the highest value in the last 10 bars and this warning has not been displayed before, a "Warning" signal is displayed.
Once the warning signal is shown, no further warnings are shown for 10 candles.
5. Pi Cycle Top Indicator:
Pi Cycle Top: This indicator predicts Bitcoin tops by comparing two moving averages (350-day and 111-day). If the short-term moving average falls below the long-term moving average, this is considered a sell signal.
The indicator displays this signal with the label "Sell", indicating a potential market top.
User Guide:
Green Buy Signal: It means Bitcoin is cheap and offers a buying opportunity.
Yellow Warning Signal: Indicates that Bitcoin has reached possible profit taking points and caution should be exercised.
Red Sell Signal: Indicates that Bitcoin has reached market saturation and it may be appropriate to sell.
Candle GapsWhat This Indicator Does
This indicator shows you where the 'Gaps' are in the market ( as defined by this indicator ). The indicator draws a box that extends indefinitely to the right, this is the 'Gap'. This box will be 'Filled In' when price comes back and overlaps the box.
A Gap As Defined By This Indicator
A candle creates a 'Gap' in the area where there is no price action in front of, or behind ( up to 1 candle ) that area.
A 'Up Gap' is created when the close of a candle is above the high of the previous candle.
A 'Down Gap' is created when the close of a candle is below the low of the previous candle.
Both types of Gaps are coloured with the same colour.
Gaps are 'filled in' and disappear when price action crosses over them.
This indicator does not show gaps where there are no candlesticks.
The Intention Of This Indicator
The intention of this indicator is to make it possible to instantly identify Gaps in the market.
Gaps can be used as a confluence for a variety of different strategies.
Inputs
Gap Colour ( This changes the colour of the Gaps )
Draw Gaps From Wicks ( This changes whether the Gap begins to be drawn from the previous candles high/low, or from the candle the Gap occurs on )
Both inputs are for aesthetic preferences.
A maximum of 50 Gaps will be drawn on the chart at one time.
This indicator is not guaranteed to be 100% accurate.

Scalp Pump-Dump Detector with AlertsThis script displays the percentage of movement of all candles on the chart, as well as identifying abnormal movements to which you can attach alerts. An abnormal movement is considered a rise or fall that exceeds the parameter set in the settings (by default, 1% per 1 bar).
Added a function to display the volume on abnormal candlesticks.

Wick Length Dominance IndicatorThis indicator, called the "Wick Momentum Indicator" (WMI), helps to gauge price momentum by comparing the total length of upper and lower wicks of a certain number of candlesticks. The indicator turns green when there is a bullish momentum (total length of lower wicks is greater than that of upper wicks) and turns red when there is a bearish momentum (total length of upper wicks is greater than that of lower wicks).
Price Action CandlesThis simple script provides a visual aid for price action traders by coloring outside & inside candles, which in effect leaves the trader with 6 possible candle colors:
-Regular bullish candle
-Outside bullish candle
-Inside bullish candle
-Regular bearish candle
-Outside bearish candle
-Inside bearish candle
These candlesticks may provide powerful signals when used in conjunction with key levels, market structure and chart patterns.
Make sure to disable the regular candlesticks (body, borders and wicks) in the symbol tab inside the configuration menu!
Hope it can help someone!
MTF Kagi Indicator v1.0Introduction
The indicator attempts to implement a time-based, multi-timeframe, non-repainting Kagi lines as an overlay to your chart using traditional candlesticks.
How is it original and useful?
This indicator is unique in that it allows you to choose from among three different methods to define the reversal amount. They are:
ATR (Average True Range): After each Kagi line is drawn, the latest ATR value from the selected timeframe will be used until a new vertical Kagi line is drawn. At this point, the latest ATR value will be used for the reversal amount until it changes again. This means that the reversal amount will adjust as price action volatility changes.
Fixed Amount: This method will be useful if you desire to fix the reversal amount, like the normal Kagi Chart. Thus, use this option if you desire to mimic the same Kagi Chart on TradingView.
Percent of Price: This method, like the ATR, will produce the reversal amount using the latest close price against the given percentage value.
In addition, the indicator will allow you to define the Up and Down line colors and width. You can even elect to have a Kagi line drawn on the real-time bar or not.
How does it compare to other scripts in the Public Library?
This indicator makes use of the security() function and applies the best-practices as provided by the PineCoders' script called " `security()` revisited " so that the indicator will not repaint when you refresh the chart or re-open it at a later date. In addition, the indicator provides three possible alerts for Alert Conditions or Any Alert() Function Call. They are:
"Break Shoulder" - this alert will trigger (Once Per Bar) when the close price crosses above the shoulder (higher) of the previous Kagi line.
"Break Waist" - this alert will trigger (Once Per Bar) when the close price crosses below the waist (lower) of the previous Kagi line.
"New Kagi Line" - this alert will trigger (Once Per Bar) when the indicator draws a new vertical Kagi line and continues to monitor the next trend change.
When using the "Any alert() function call" option in creating alerts, the following placeholders are supported in the alert message: {{shoulder_price}}, {{waist_price}}, and {{kagi_close_price}}
What does it do and how does it do it?
When applied to the chart for the first time, the default settings will work to produce Kagi lines from the beginning of the chart history up to the real-time bar. The Kagi line width will have a width of 1 pixel and the colors will match the normal color schemes that TradingView charts have for rising and falling colors. The reversal method will default to ATR with a period length of 14 so that it can provide a visually appealing Kagi lines where the reversal amount will be adaptive for all price charts. The default timeframe will be the chart's timeframe, but it can be changed to any higher timeframe. Using a timeframe that is lower than the current chart will not disable the indicator, but the lines will not be accurate since lower timeframe prices are being grouped to fit the current timeframe.
Enjoy! 😊👍
