AlphaTrend++ offset labelsAlphaTrend++
Overview
The AlphaTrend++ is an advanced Pine Script indicator designed to help traders identify buy and sell opportunities in trending and volatile markets. Building on trend-following principles, it uses a modified Average True Range (ATR) calculation combined with volume or momentum data to plot a dynamic trend line. The indicator overlays on the price chart, displaying a colored trend line, a filled trend zone, buy/sell signals, and optional stop-loss tick labels, making it ideal for day trading or swing trading, particularly in markets like futures (e.g., MES).
What It Does
This indicator generates buy and sell signals based on the direction and momentum of a custom trend line, filtered by optional time restrictions and signal frequency logic. The trend line adapts to price action and volatility, with a filled zone highlighting trend strength. Buy/sell signals are plotted as labels, and stop-loss distances are displayed in ticks (customizable for instruments like MES). The indicator supports standard chart types for realistic signal generation.
How It Works
The indicator employs the following components:
Trend Line Calculation: A dynamic trend line is calculated using ATR adjusted by a user-defined multiplier, combined with either Money Flow Index (MFI) or Relative Strength Index (RSI) depending on volume availability. The line tracks price movements, adjusting upward or downward based on trend direction and volatility.
Trend Zone: The area between the current trend line and its value two bars prior is filled, colored green for bullish trends (upward movement) or red for bearish trends (downward movement), providing a visual cue of trend strength.
Signal Generation: Buy signals occur when the trend line crosses above its value two bars ago, and sell signals occur when it crosses below, with optional filtering to reduce signal noise (based on bar timing logic). Signals can be restricted to a 9:00–15:00 UTC trading window.
Stop-Loss Ticks: For each signal, the indicator calculates the distance to the trend line (acting as a stop-loss level) in ticks, using a user-defined tick size (default 0.25 for MES). These are displayed as labels below/above the signal.
Time Filter: An optional filter limits signals to 9:00–15:00 UTC, aligning with active trading sessions like the US market open.
The indicator ensures compatibility with standard chart types (e.g., candlestick or bar charts) to avoid unrealistic results associated with non-standard types like Heikin Ashi or Renko.
How to Use It
Add to Chart: Apply the indicator to a candlestick or bar chart on TradingView.
Configure Settings:
Multiplier: Adjust the ATR multiplier (default 1.0) to control trend line sensitivity. Higher values widen the stop-loss distance.
Common Period: Set the ATR and MFI/RSI period (default 14) for trend calculations.
No Volume Data: Enable if volume data is unavailable (e.g., for certain forex pairs), switching from MFI to RSI.
Tick Size: Set the tick size for stop-loss calculations (default 0.25 for MES futures).
Show Buy/Sell Signals: Toggle signal labels (default enabled).
Show Stop Loss Ticks: Toggle stop-loss tick labels (default enabled).
Use Time Filter: Restrict signals to 9:00–15:00 UTC (default disabled).
Use Filtered Signals: Enable to reduce signal frequency using bar timing logic (default enabled).
Interpret Signals:
Buy Signal: A blue “BUY” label below the bar indicates a potential long entry (trend line crossover, passing filters).
Sell Signal: A red “SELL” label above the bar indicates a potential short entry (trend line crossunder, passing filters).
Trend Zone: Green fill suggests bullish momentum; red fill suggests bearish momentum.
Stop-Loss Ticks: Gray labels show the stop-loss distance in ticks, helping with risk management.
Monitor Context: Use the trend line and filled zone to confirm the market’s direction before acting on signals.
Unique Features
Adaptive Trend Line: Combines ATR with MFI or RSI to create a responsive trend line that adjusts to volatility and market conditions.
Tick-Based Stop-Loss: Displays stop-loss distances in ticks, customizable for specific instruments, aiding precise risk management.
Signal Filtering: Optional bar timing logic reduces false signals, improving reliability in choppy markets.
Trend Zone Visualization: The filled zone between trend line values enhances trend clarity, making it easier to assess momentum.
Time-Restricted Trading: Optional 9:00–15:00 UTC filter aligns signals with high-liquidity sessions.
Notes
Use on standard candlestick or bar charts to ensure accurate signals.
Test the indicator on a demo account to optimize settings for your market and timeframe.
Combine with other analysis (e.g., support/resistance, volume spikes) for better decision-making.
The indicator is not a standalone system; use it as part of a broader trading strategy.
Limitations
Signals may lag in highly volatile or low-liquidity markets due to ATR-based calculations.
The 9:00–15:00 UTC time filter may not suit all markets; disable it for 24-hour assets like forex or crypto.
Stop-loss tick calculations assume consistent tick sizes; verify compatibility with your instrument.
This indicator is designed for traders seeking a robust, trend-following tool with customizable risk management and signal filtering, optimized for active trading sessions.
This update enhances label customization, clarity, and signal usability while preserving all existing AlphaTrend++ logic. The goal is to improve readability during live trading and allow traders to personalize the visual footprint of entries and stop-loss levels.
Improvements
• Cleaner Label Placement
Labels now maintain consistent spacing from the candle, regardless of volatility or ATR expansion.
• Enhanced Visual Structure
BUY/SELL signals remain bold and clear, while SL ticks use a more compact and optional sizing scheme.
• Better User Control
New UI inputs:
Entry Label Size
SL Label Size
SL Label Offset (Ticks)nces.
Search in scripts for "Candlestick"

ICT订单块交易【实时不滞后】Used to identify "Order Blocks" (OB), based on Break of Structure (BOS) and Retest mechanisms. It detects candles in the opposite direction after swing highs/lows to form potential supply/demand zones, confirming and plotting valid OBs only upon price retest. The indicator emphasizes "real" OBs: requiring a strong impulse (> ATR * multiplier) and retest verification.
- **Core Functions**: Detect BOS (Break of Structure); find opposite candles after prior impulses; verify strength and retest; draw OB boxes and labels.
- **Applicable Scenarios**: Suitable for ICT strategies, supply-demand trading, or reversal identification. Helps filter false breakouts and shows only high-probability zones.
- **Display Mode**: Overlaid on the main chart, displaying OBs as boxes, supporting up to 500 boxes.
- **Limitations**: Retest period fixed at 15 bars; based on simple candlesticks (no volume filter); no automatic cleanup of old OBs (manual management required).
The indicator has no built-in alerts but can be extended. ATR is used dynamically to validate strength.
## Input Parameters
Input parameters are concise, divided into core settings and display group. Below explains each parameter’s default value, type, and function.
### Core Settings
- **Structure Lookback** (int, default: 10, min: 3): Lookback period for structure detection (length for ta.highest/lowest). Higher values detect stronger structures.
- **Minimum Impulse Strength (ATR ×)** (float, default: 1.5, min: 0.5): Minimum impulse strength ((high-low) > ATR * this value). Ensures significant movement before OB.
- **Bars to watch for Retest** (int, default: 15, min: 1): Number of bars to monitor for retest. OB is confirmed only if price retests the OB zone within N bars after a breakout.
### Display Settings
- **Show Bullish OBs** (bool, default: true): Show bullish OBs (demand zone, rebounds after retest).
- **Show Bearish OBs** (bool, default: true): Show bearish OBs (supply zone, reverses after retest).
Colors are fixed: green (bullish, 80% transparency), red (bearish, 80% transparency).
## Calculations and Display
### Break of Structure (BOS) Detection
- **ATR Calculation**: ta.atr(14) used for strength verification.
- **Swing High/Low**: ta.highest(high, lookback) / ta.lowest(low, lookback) to identify structure. ...
## Calculation and Display
### Structure Breakout (BOS) Detection
- **ATR Calculation**: `ta.atr(14)` used for strength verification.
- **Swing High/Low**: `ta.highest(high, lookback)` / `ta.lowest(low, lookback)` identify structure.
- **BOS Trigger**:
- **bullBOS**: close > hh (breaks previous high).
- **bearBOS**: close < ll (breaks previous low).
### Order Block Identification
- **getLastOppositeCandle(isBullish)**:
- Search for the most recent "opposite" candle within the lookback period (bullBOS: bearish candle close < open; bearBOS: bullish candle close > open).
- Returns the index (idx); if none, then na.
- **OB Logic** (only when showBullish/Bearish=true):
- **Bullish OB (bullBOS)**:
- Find previous bearish candle (idx), check momentum: (high-low) > ATR * atrMult.
- Calculate obLow = low , obHigh = high .
- Backtest check: within 15 candles low inside → inRetest = true.
- If confirmed: draw green box (from bar_index - idx to current, obLow to obHigh); label "🟩 Bullish OB (Valid)" (top-left, green, 80% transparency, white text).
- Push into bullOBs array.
- **Bearish OB (bearBOS)**: symmetric, red box, label "🟥 Bearish OB (Valid)" (bottom-left).
- **Array Management**: var box bullOBs/bearOBs store all OBs; no automatic cleanup (expandable).
### Display Elements
- **Boxes**: dynamically from idx to current candle, visually showing OB area.
- **Labels**: displayed when confirmed, positioned based on obHigh/obLow.
- No lines/fills; pure boxes + labels.
## Alert Functionality
The indicator has no built-in alerts but can be extended via TradingView alerts, for example:
- **New OB**: bullBOS and inRetest or bearBOS and inRetest.
- **Backtest**: price enters OB range.
It is recommended to add `alertcondition()` for custom alerts. ...
It is recommended to add a custom alertcondition(), such as 'Bullish OB Confirmed'.
## Usage Tips
- **Optimization**: lookback=10 balances sensitivity; atrMult=1.5 filters weak impulses; retestBars=15 is suitable for intraday.
- **Customization**: turn off showBullish/Bearish to hide types; add volume filtering to the fork for better accuracy.
- **Explanation**:
- **BOS + Backtesting**: ensure OB is 'real' (not a false breakout); only draw after backtesting to avoid noise.
- **Strength**: (high-low)>ATR*1.5 indicates strong impulses, making OB more reliable.
- **Application**: Bullish OB = buy zone (support); Bearish OB = sell zone (resistance).
- **Limitations**: fixed backtesting period may miss late retracements; no volume/time filtering; few OBs in low-volatility markets.
- **Extensions**: add OB counts or Fibonacci extensions.
ICT订单块交易指标,用于识别“订单块”(Order Blocks, OB),基于结构突破(Break of Structure, BOS)与回测(Retest)机制。它通过检测摆动高/低点后的相反方向烛台,形成潜在供给/需求区域,仅在价格回测时确认并绘制有效OB。指标强调“真实”OB:需强冲动(> ATR * 乘数)与回测验证。
- **核心功能**:检测BOS(结构突破);查找前冲动相反烛台;验证强度与回测;绘制OB盒子与标签。
- **适用场景**:适合ICT策略、供给需求交易或反转识别。帮助过滤假突破,仅显示高概率区域。
- **显示模式**:叠加在主图上,使用盒子(boxes)显示OB,支持最大500个盒子。
- **限制**:回测期固定15柱;基于简单烛台(无成交量过滤);无自动清理旧OB(手动管理)。
指标无内置警报,但可扩展。数据使用ATR动态验证强度。
## 输入参数
输入参数简洁,分为核心设置与显示组。以下说明每个参数的默认值、类型和作用。
### 核心设置
- **Structure Lookback** (int, 默认: 10, 最小: 3):结构检测回溯期(ta.highest/lowest的长度)。较高值检测更强结构。
- **Minimum Impulse Strength (ATR ×)** (float, 默认: 1.5, 最小: 0.5):最小冲动强度((high-low) > ATR * 此值)。确保OB前有显著移动。
- **Bars to watch for Retest** (int, 默认: 15, 最小: 1):回测监控柱数。突破后N柱内价格回测OB区域才确认。
### 显示设置
- **Show Bullish OBs** (bool, 默认: true):显示看涨OB(需求区,回测后反弹)。
- **Show Bearish OBs** (bool, 默认: true):显示看跌OB(供给区,回测后反转)。
颜色固定:绿(看涨,80%透明)、红(看跌,80%透明)。
## 计算与显示
### 结构突破(BOS)检测
- **ATR计算**:ta.atr(14) 用于强度验证。
- **摆动高/低**:ta.highest(high, lookback) / ta.lowest(low, lookback) 识别结构。
- **BOS触发**:
- **bullBOS**:close > hh (上破前高)。
- **bearBOS**:close < ll (下破前低)。
### 订单块识别
- **getLastOppositeCandle(isBullish)**:
- 查找最近lookback柱内“相反”烛台(bullBOS: 熊烛 close < open;bearBOS: 牛烛 close > open)。
- 返回索引(idx);若无则na。
- **OB逻辑**(仅当showBullish/Bearish=true):
- **看涨OB (bullBOS)**:
- 查找前熊烛(idx),检查冲动:(high-low) > ATR * atrMult。
- 计算obLow=low ,obHigh=high 。
- 回测检查:15柱内low 在 内 → inRetest=true。
- 若确认:绘制绿盒(bar_index-idx 到当前,obLow到obHigh);标签“🟩 Bullish OB (Valid)”(左上,绿,80%透明,白文本)。
- 推入bullOBs数组。
- **看跌OB (bearBOS)**:对称,红盒,标签“🟥 Bearish OB (Valid)”(左下)。
- **数组管理**:var box bullOBs/bearOBs 存储所有OB;无自动清理(可扩展)。
### 显示元素
- **盒子**:动态从idx到当前柱,延伸显示OB区域。
- **标签**:确认时显示,位置基于obHigh/obLow。
- 无线条/填充;纯盒子+标签。
## 警报功能
指标无内置警报,但可通过TradingView警报扩展,例如:
- **新OB**:bullBOS and inRetest 或 bearBOS and inRetest。
- **回测**:价格进入OB范围。
建议添加alertcondition()自定义,如“Bullish OB Confirmed”。
## 使用提示
- **优化**:lookback=10平衡敏感;atrMult=1.5过滤弱冲动;retestBars=15适合日内。
- **自定义**:关闭showBullish/Bearish隐藏类型;fork添加成交量过滤提升准确。
- **解释**:
- **BOS+回测**:确保OB“真实”(非假突破);仅回测后绘制,避免噪音。
- **强度**:(high-low)>ATR*1.5表示强冲动,OB更可靠。
- **应用**:看涨OB=买入区(支撑);看跌OB=卖出区(阻力)。
- **局限**:回测期固定,可能错过晚回测;无成交量/时间过滤;低波动市场少OB。
- **扩展**:添加OB计数或斐波那契扩展。

Cumulative Volume Delta CandlesCVD Trend Candles
Visualize buying and selling pressure directly on your price candles. This indicator colors your candlesticks based on Cumulative Volume Delta (CVD), helping you see the underlying order flow driving price action.
WHAT IS CVD?
Cumulative Volume Delta estimates the difference between aggressive buying and selling volume on each bar. Positive delta indicates more aggressive buying; negative delta indicates more aggressive selling.
COLOR METHODS
▸ CVD Raw
The simplest view—candles are colored based purely on the raw delta of each bar.
• Cyan = Positive delta (net buying)
• Red = Negative delta (net selling)
▸ Rule-Based (Default)
Uses Heikin Ashi-smoothed CVD candles with intensity based on trend strength:
• Bright colors = Strong conviction (larger body + continuation)
• Medium colors = Moderate conviction (continuation)
• Dark colors = Weak/indecision (inside candles, hesitation)
▸ Size-Based
Colors intensity based on z-score of delta changes:
• Bright colors = Statistically significant delta (above strong threshold)
• Medium colors = Moderate delta (above moderate threshold)
• Dark colors = Normal/quiet delta
KEY FEATURES
◆ Kalman Filter Smoothing
Adaptive filtering reduces noise while staying responsive to genuine shifts in order flow. Adjust sensitivity with the Responsiveness and Kalman Gain settings.
◆ Inside Candle Rule
When enabled, prevents false signals from inside candles that show a direction change but lack conviction. The candle retains the previous trend's color (dimmed) instead of flipping.
◆ Session Anchoring
Optionally reset cumulative delta at a specific time (e.g., market open) for intraday analysis.
◆ Z-Score Thresholds
Fine-tune what constitutes "strong" vs "moderate" delta activity for Size-Based coloring.
HOW TO USE
1. Add the indicator to your chart
2. Set your chart type to "Line" or bring the indicator to front via Visual Order → Bring to Front
3. Select your preferred Color Method
4. Look for:
• Sequences of bright cyan candles → Strong buying pressure / bullish momentum
• Sequences of bright red candles → Strong selling pressure / bearish momentum
• Fading colors → Weakening conviction, potential reversal or consolidation
• Color flips → Shift in order flow dominance
Notes
• This indicator estimates delta from OHLCV data. For true order flow analysis, consider using tick or trade data from your broker/exchange.
• Works on all timeframes and instruments with volume data.
• Best used in conjunction with support/resistance levels, market structure, or other confluence factors.

HybridWhales DAY TRADINGThis indicator offers a streamlined view of prevailing market trends on lower timeframes, empowering day traders to execute their strategies with greater precision
It incorporates two widely used exponential moving averages (EMAs)—the 50-period and 200-period—alongside an 800-period EMA, which effectively mirrors the 200-period EMA on the next higher timeframe. This setup provides enhanced flexibility, delivering multi-timeframe insights without the need to switch charts manually.
In addition, the indicator highlights essential intraday levels for quick reference:
Daily Open, denoted in yellow
Monday Highs, marked in red
Monday Lows, indicated in green
The indicator's core strength lies in its ability to detect market maker activity through color-coded candlesticks, based on volume analysis. Candles exhibiting significantly higher volume than the average of the prior eight candles are colored green (for bullish closes) or red (for bearish closes), signaling active market maker positioning—either entering shorts or longs.
Candles with moderately elevated volume (above average but not extreme) are shaded blue (bullish) or pink (bearish), suggesting market makers are accumulating short or long positions.
Interpretation is key: Red or pink candles (bearish) imply that market makers have initiated long positions, with price likely to revisit and fill these areas in the future. Conversely, green or blue candles (bullish) indicate market makers establishing shorts, anticipating a eventual pullback to these levels
To pinpoint the precise zones where price may return, the indicator places a white marker on each colored candle at its 50% retracement level, representing a fair value gap or imbalance.
Overall, this tool enables traders to spot market maker footprints, identify critical support and resistance zones, gauge weekly ranges, and assess potential momentum. While it fosters stronger confluence in analysis, results are not guaranteed and depend on individual trading execution.

Aggregated Open InterestAggregates Open Interest data across 10 major crypto exchanges: Binance, Bybit, Kraken, MEXC, Bitget, BingX, Coinbase, Deribit, HTX, and Crypto.com.
Displays total market OI with candlesticks on intraday timeframes and a step line on daily+ timeframes. Color-coded: teal for increasing OI, red for decreasing OI.
Toggle individual exchanges on/off in settings to customize your view.
With this indicator there is no need to be on the perpetual chart of the asset for the open interest to be displayed.

Bull Bear Indicator# Bull Bear Indicator - TradingView Script Description
## Overview
The Bull Bear Indicator is a powerful visual tool that instantly identifies market sentiment by coloring all candlesticks based on their position relative to a moving average. This indicator helps traders quickly identify bullish and bearish market conditions at a glance.
## Key Features
### 🎨 Visual Bull/Bear Identification
- **Green Candles**: Price is at or above the moving average (Bullish condition)
- **Red Candles**: Price is below the moving average (Bearish condition)
- Complete candle coloring including body, wicks, and borders for maximum clarity
### 📊 Flexible Moving Average Options
- **MA Type**: Choose between Simple Moving Average (MA) or Exponential Moving Average (EMA)
- **Timeframe**: Select Weekly or Daily timeframe for the moving average calculation
- **Customizable Period**: Adjust the MA/EMA period (default: 50)
### 📈 Smooth Moving Average Line
- Displays a smooth blue moving average line on the chart
- Automatically adapts to your selected timeframe and MA type
- Provides clear visual reference for trend identification
## How It Works
The indicator calculates a moving average (MA or EMA) based on your selected timeframe (Weekly or Daily). It then compares the current price to this moving average:
- **Bull Market**: When price ≥ Moving Average → Candles turn **GREEN**
- **Bear Market**: When price < Moving Average → Candles turn **RED**
## Configuration Options
1. **MA Type**: Choose "MA" for Simple Moving Average or "EMA" for Exponential Moving Average
2. **Timeframe**: Select "Weekly" for weekly-based MA or "Daily" for daily-based MA
3. **MA Period**: Set the number of periods for the moving average calculation (default: 50)
## Use Cases
- **Trend Identification**: Quickly identify overall market trend direction
- **Entry/Exit Signals**: Use color changes as potential entry or exit signals
- **Multi-Timeframe Analysis**: Combine with different chart timeframes for comprehensive analysis
- **Visual Clarity**: Reduce chart clutter while maintaining essential trend information
## Best Practices
- Use Weekly MA for longer-term trend identification
- Use Daily MA for shorter-term trend analysis
- Combine with other technical indicators for confirmation
- Adjust the MA period based on your trading style and timeframe
## Technical Details
- Built with Pine Script v6
- Overlay indicator (displays on main chart)
- Optimized for performance
- Compatible with all TradingView chart types
---
**Note**: This indicator is for educational and informational purposes only. Always conduct your own analysis and risk management before making trading decisions.

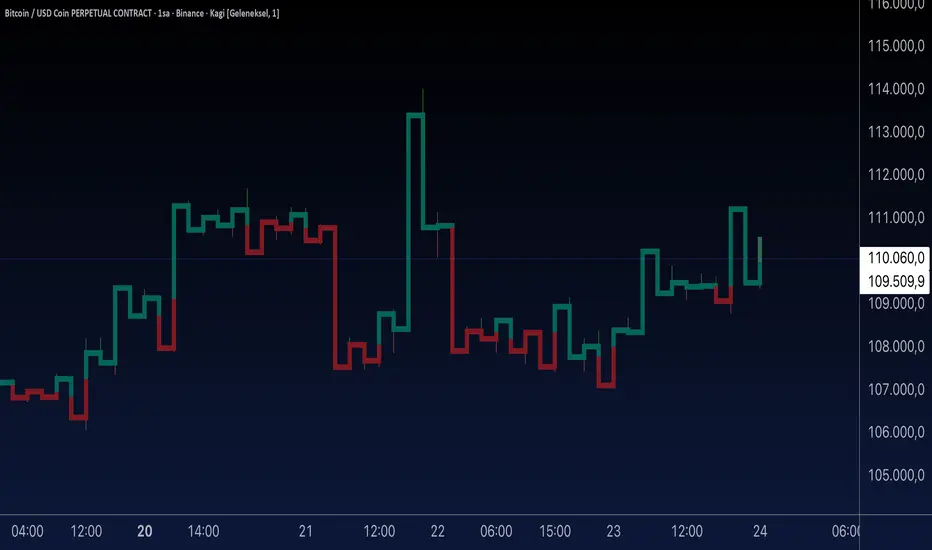
Aynet- True Wick Projector for Non-Standard ChartsTechnical Explanation: "Data Projection and Synchronization"
This script is, at its core, a "data projection" tool. The fundamental technical problem it solves is compensating for the information loss that occurs when using different data visualization models.
1. The Core Problem: Information Loss
Standard Charts (Time-Based): Normal candlesticks are time-based. Each candle represents a fixed time interval (like 1 hour or 1 day) and displays the complete Open, High, Low, and Close (OHLC) data for that period. The "wicks" show the volatility and the extreme price points (the High and Low).
Non-Standard Charts (Price/Momentum-Based): Charts like Kagi, Renko, or Line Break filter out time. Their only concern is price movement. While one Renko box or Kagi line is forming, 10 or more time-based candles might have formed in the background. During this "noise filtering" process, the true high and low values (the wicks) from those underlying candles are lost.
The problem is this: A trader looking at a non-standard chart cannot see how high or low the price actually went while that block or line was forming. This is a critical loss of information regarding market volatility, support/resistance levels, and price rejection.
2. The Technical Solution: A "Dual Data Stream"
This script intelligently combines two different data streams to compensate for this information loss:
Main Stream (Current Chart): The open and close data from your active Kagi, Renko, etc., chart.
Secondary Stream (Projected Data): The high and low data from the underlying standard (time-based) chart.
3. The Code's Methodical Steps
Step 1: Identifying the Data Source (syminfo...)
This step precisely identifies the source for the secondary data stream. By using syminfo.prefix + ":" + syminfo.ticker (e.g., "NASDAQ:AAPL"), it guarantees that the data is pulled from the exact correct instrument and exchange.
Step 2: Data Request & "Lookahead" Synchronization (request.security)
This is the most critical part of the operation.
request.security(...): This is the function Pine Script uses to pull data from another dataset (the secondary stream) onto the current chart.
: This tells the function, "The only data I care about is the 'High' and 'Low' of the standard candle from that timeframe."
lookahead = barmerge.lookahead_on (The Critical Key): This command solves the "time paradox."
Normally (without this): request.security fetches data from the last completed bar. But as your Kagi bar is currently forming, the standard candle is also currently forming. This would cause the data to always be one bar behind (lag).
With lookahead_on: This permits the script to "look ahead" at the data from the currently forming, incomplete standard bar. Because of this, as your Kagi bar moves, the true wick data is updated in real-time. This achieves real-time synchronization.
Step 3: Visual Engineering (plotcandle)
After the script retrieves the data, it must "draw" it. However, it only wants to draw the wicks, not the candle bodies.
bodyTop and bodyBottom: First, it finds the top and bottom of the current Kagi bar's body (using math.max(open, close)).
Plotting the Upper Wick (Green):
It calls the plotcandle function and instructs it to draw a fake candle.
It fixes this fake candle's Open, Low, and Close (open, low, close) values to the top of the Kagi bar's body (bodyTop).
It only sets the High (high) value to the realHigh it fetched with request.security.
The result: A wick is drawn from the bodyTop level up to the realHigh level, with no visible body.
Plotting the Lower Wick (Red):
It applies the reverse logic.
It fixes the fake candle's Open, High, and Close values to the bottom of the Kagi bar's body (bodyBottom).
It only sets the Low (low) value to the realLow.
The result: A lower wick is drawn from bodyBottom down to realLow.
Invisibility (color.new(color.white, 100)):
In both plotcandle calls, the color (body color) and bordercolor are set to 100 transparency. This makes the "fake" candle bodies completely invisible, leaving only the colored wicks.
Conclusion (Technical Summary)
This script reclaims the volatility data (the wicks) that is naturally sacrificed by non-standard charts.
It achieves this with technical precision by creating a secondary data stream using request.security and synchronizing it with zero lag using the lookahead_on parameter.
Finally, it intelligently manipulates the plotcandle function (by creating invisible bodies) to project this lost data onto your Kagi/Renko chart as an "augmented reality" layer. This allows a trader to benefit from the clean, noise-filtered view of a non-standard chart without losing access to the full picture of market volatility.
Tesla 3-6-9 Highlight (NY) 45-15 + Vertical Line- proTesla 3-6-9 Pro/Free Demo (NY) – User Guide
Overview
This indicator is designed to detect the Tesla 3-6-9 numeric patterns based on hour + minute or minute-only sums in New York time. It helps traders visually spot key moments on the chart with colored candles, symbols, vertical lines, and daily statistics.
Free Version: Shows minute-only signals 🔻.
Paid Version: Adds Hour+Minute signals 🔺, vertical line at minute 45, daily stats table, and customizable visuals.
Features
Tesla 3-6-9 Calculations
Hour + Minute: Calculates sum of digits of current hour + minute, reduces to 3, 6, or 9.
Minute-only: Calculates sum of digits of current minute only.
Candlestick Coloring
Up/Down candles are colored by default (green/bearish black).
Tesla patterns change the candle color (customizable).
Option to prioritize Hour+Minute over Minute-only.
Symbols
🔺 Hour+Minute Tesla signal.
🔻 Minute-only Tesla signal.
Can enable/disable independently.
Vertical Line
Appears at minute 45 for Paid Version.
Customizable color, width, and transparency.
Alerts
Optional sound alerts for both signal types.
Daily Statistics
Table showing number of Tesla signals per type for the day (Paid Version).
Settings Explained
Setting Description
Ignore zero digits when summing Whether 0 is ignored in digit sums.
Bullish Candle Color Color for up candles (default green).
Bearish Candle Color Color for down candles (default black).
Tesla Color (Hour+Minute) Candle color when Hour+Minute Tesla pattern is active.
Tesla Color (Minute-only) Candle color when Minute-only Tesla pattern is active.
Show 🔺 Hour+Minute Symbols Toggle visibility of 🔺 symbols.
Show 🔻 Minute-only Symbols Toggle visibility of 🔻 symbols.
Symbol Size Adjusts the size of the symbols.
Enable Sound Alerts Plays sound alerts when Tesla patterns occur.
Show Vertical Line at Minute 45 Toggle visibility of vertical line at 45th minute.
Vertical Line Color Color of the vertical line.
Vertical Line Transparency 0–255 transparency level for vertical line.
Vertical Line Width Width of the vertical line.
Hour+Minute priority over Minute-only Determines if Hour+Minute signals override Minute-only signals visually.
Paid Version Features Enabled Enables all Paid Version features (table, vertical line, Hour+Minute signals).
How to Use
Add the script to your TradingView chart.
Set Paid Version Features Enabled to true if you have access to the full version.
Customize colors, symbols, and alerts to your preference.
Watch for:
🔺 Hour+Minute signals
🔻 Minute-only signals
Candlestick color changes
Vertical line at minute 45
Daily Tesla statistics table (Paid Version)
Monetization Tips
If you plan to sell or share the Paid Version:
Publish on TradingView: Paid version requires publishing as a protected indicator.
Subscription Model: Offer monthly access to Paid Version.
Free Version as Teaser: Let users try minute-only signals for free.
Marketing: Highlight unique features:
Accurate Tesla 3-6-9 pattern detection
Customizable visuals and alerts
Daily statistics table
Vertical line for key minutes
Features
Feature Free Version Paid Version
Minute-only Tesla signals 🔻 ✅ ✅
Hour+Minute Tesla signals 🔺 ❌ ✅
Candlestick coloring ✅ ✅ (customizable colors)
Vertical line at minute 45 ❌ ✅
Sound alerts ✅ ✅
Daily statistics table ❌ ✅
Symbol size & color customization ✅ ✅
Ignore zero digits option ✅ ✅
Installation
Open TradingView
Click Indicators → Invite-Only Scripts
Search for Tesla 3-6-9 Indicator (NY)
Add it to your chart and configure settings
Subscription & Pricing Suggestions
Free Version: Access to minute-only signals 🔻 as a teaser
Paid Version: Full feature set (🔺 signals, vertical line, daily stats)
Monthly Subscription: $10/month
Offer trial period to attract new users
Usage Tips
Best used on 1-minute or 5-minute charts
Works with any market symbol
Track patterns visually without manual calculation
Use the daily statistics table to analyze Tesla signal frequency

Heikin-Ashi-Candles MTFHeikin-Ashi Higher Timeframe Candles
This indicator overlays higher-timeframe Heikin-Ashi candles (default: 5 minutes) onto a lower-timeframe chart (e.g., 1 minute). Instead of using standard candlesticks, it draws:
Semi-transparent rectangles to represent the candle bodies.
Vertical lines to represent wicks, centered on each body.
Key features:
Dynamic transparency: The current, still-forming higher-timeframe candle is plotted in green or red (depending on trend) with a separate, lighter transparency (default: 30) so you can easily distinguish it from completed candles.
Finalization on close: As soon as a higher-timeframe candle closes, its body and wicks update to the standard transparency level (default: 50), ensuring completed candles are visually distinct.
Customizable inputs: You can adjust
The higher timeframe (tf) for Heikin-Ashi calculations.
Body transparency for confirmed candles.
Transparency for unfinished candles.
Wick thickness.
Use case:
This is particularly useful for traders who analyze price action on lower timeframes but want to stay aware of the higher-timeframe Heikin-Ashi trend without switching charts. The fading effect on the active candle helps prevent confusion between fully formed candles and those still developing.

STC Advanced Signals with Early Warnings [Overlay]🧠 STC Advanced Signals with Early Warnings – Indicator Description
Purpose:
The “STC Advanced Signals” indicator is designed for active traders (day traders, scalpers, swing traders) who require early signal detection without relying solely on one single indicator. It offers a combination of momentum shifts, candlestick confirmation, and visual guidance for high-quality trade setups.
🔍 Core Components
1. Early Warning Arrows (Orange)
Detected using pivot logic based on the internal STC oscillator curve.
Appear 1–3 bars before potential trend shifts.
Warning only – no execution signal yet.
Can alert traders to prepare for setups in advance.
2. Confirmed Signals (Gold Arrows)
Appear after threshold breakouts of the STC oscillator:
Up Arrow: STC crosses above thresholdUp (default: 25).
Down Arrow: STC crosses below thresholdDown (default: 75).
These are execution-level signals and often indicate momentum breakout or reversal confirmation.
3. Tiny Pre-Confirmation Circles (Yellow)
Optional component (can be toggled on/off).
Visualize potential micro-cycles before full signal confirmation.
Useful for anticipating trend continuation or delay.
4. Candlestick Pattern Recognition
Auto-detects 5 reliable patterns, printed one bar after confirmation:
HA = Hammer
SS = Shooting Star
DJ = Doji
EB = Engulfing Bullish
ES = Engulfing Bearish
Labels are plotted above candles and the bar is highlighted yellow.
Ideal for confirming signals via price action structure.
🧰 Chart Setup Recommendations
Best used on M5, M15 (Scalping/Intraday), or H1 (Swing).
Suggested workflow:
Observe orange Early Warning arrow
Wait for confirmed yellow/gold arrow
Confirm with candlestick pattern
Optionally add volume, trend filters (e.g., EMA200)
📊 Technical Notes
This script does not display the STC line itself.
To view the oscillator line (ranging 0–100), add the companion script:
➤ STC Oscillator
This panel-based indicator must be attached in a separate sub-window and mirrors the official cTrader STC calculation.
🛡 Risk Management Suggestions
Always use stop loss: e.g., below hammer low.
Max 0.5% account risk per trade.
Combine multiple signals before executing.
Avoid trading during high-impact news unless backtested.
تلوين الشموع حسب الحجم (يومي أو متوسط)📊 Indicator Name:
Candle Coloring Based on Volume Change (Flexible Comparison)
🎯 Purpose of the Indicator:
This indicator colors candlesticks based solely on changes in volume, regardless of price direction. It helps traders visualize unusual volume activity and potential accumulation or distribution zones.
It also displays the percentage change in volume above each candle — based on a comparison method chosen by the user.
⚙️ User Inputs:
Comparison Method (Mode):
"Compare with Previous Day":
The volume of the current candle is compared with the volume of the previous candle.
"Compare with Average of N Days":
The volume is compared with a moving average of volume over a number of past days (e.g., 10 days).
Average Length (for mode 2):
Used only when "Compare with Average" is selected.
Defines the number of days over which to calculate the volume average.
Minimum % Change to Show Label:
A threshold that controls when the percentage label appears.
Prevents label clutter for insignificant volume changes.
🎨 Candle Coloring Logic:
Condition Meaning Candle Color
Current volume > reference volume High activity 🟢 Green
Current volume < reference volume Low activity 🔴 Red
Nearly equal volumes Normal ⚪ Gray
🏷️ Volume Change Label:
The indicator displays a percentage change label above the candle.
For example:
If volume increased by 45% → label shows +45.00%.
If the change exceeds ±50%, the label turns yellow to indicate a significant spike.
✅ Key Benefits:
Quickly detects unusual volume activity (e.g., spikes, drops).
Enhances classic price-action analysis with volume context.
Flexible comparison:
Day-to-day for short-term traders.
Moving average for swing and position traders.
Clean, minimalist design with conditional labels.
🔍 Use Case Examples:
🔴 Red candle on price rise → weak rally (low participation).
🟢 Green candle on price drop → potential distribution.
⚪ Gray candles → sideways or stable behavior.
👤 Who Should Use It?
Day traders and scalpers monitoring volume strength.
Technical analysts who focus on volume-price behavior.
Traders who track accumulation/distribution patterns.
FVGFVG indicator
A Fair Value Gap is when the price moved very fast without looking back in the short term. Usually this is an indication of smart money plays.
### Basics FVGs ###
Fair value gaps are determined with 3 candlesticks
When bullish this is the difference from the cs1 high to the cs3 low, = BISI.
When bearish this is the difference from the cs1 low to the cs3 high, = SIBI.
By default it shows SIBI and BISI FVGs those just follow the 2 simplest rules above.
Default colour = blue as this is neutral.
Those FVG drawings should be used to calibrate the following 3 special FVGs.
### Special FVGs ###
Than there are 3 more conditions to define FVG's in more detail
1. Expansion / Breakout FVG
This is when the body of cs3 is more than % of cs2
Default colour = yellow as this is not positive.
2. Rejection / Rejected FVG
This is when the FVG created from cs1 and cs2 is filled for more than % by the move of cs3 (by the wicks).
Default colour = yellow as this is not positive.
3. True FVG
This is when the cs3 after a FVG (that is not expansion or rejection) has a very small body vs wicks. So if the body is smaller than % of the whole cs3. Additionally the cs3 body has to close above cs2 high when BISI and cs3 body has to close below cs2 low when SIBI.
Default colour = green as this is positive.
### Visuals ###
You can change the colouring of all the FVGs.
You can change which FVGs you want to see.
### Technical Calibration ###
The % of the move of cs3 back into the FVG of cs1 & cs2 to determine if a FVG is an expansion.
Thee % of the body of cs3 compared to cs2 to determine if a FVG is a rejection.
Body % of cs3 that complements to determine if a FVG is a true FVG.
### How to use ####
This is not providing any trades on itself it is rather a complement for people that are trading with fair value gaps to quantify their approach in the framework described above.
The indicator can be used on all timeframes and tickers. It is advised to approach any FVG strategy by searching confluence on multiple timeframes.

Intelligent Top & Bottom Finder v9.8 Keyvankh📈 Intelligent Top & Bottom Finder v9.8 Keyvankh
A next-generation all-in-one trading system for precise tops, bottoms, and reversals across all timeframes.
---
🟢 Overview
This indicator is a powerful and intelligent solution for detecting market tops and bottoms, key reversals, and S/R zones with institutional-grade accuracy. Designed for traders seeking an edge in any market (crypto, forex, stocks), it combines advanced candlestick recognition, multi-indicator confirmation, smart support/resistance clustering, and strict signal filtering into one seamless tool.
---
🔎 How Does It Work?
1. Advanced Support & Resistance Clustering
Automatically detects and draws high-probability support and resistance zones using dynamic ATR-based pivot clustering.
Highlights breakouts and retest (flip) zones in real-time, adapting to changing market structure.
2. Full Candlestick Pattern Recognition
Scans for 15+ classic and advanced patterns: Engulfing, Pin Bar, Doji, Three Bar, Marubozu, Hammer, Shooting Star, Three White Soldiers, Three Black Crows, Tweezer, Morning/Evening Star, Kicker, Belt Hold, and more.
Scores each pattern’s strength based on location (S/R zone, retest, breakout), volume context, and confirmation signals.
3. Multi-Indicator Confirmation Engine**
Integrates and scores confirmation from up to five additional sources:
RSI Games 1.2** (smoothed LTF momentum shifts)
MACD Divergence** (bullish/bearish momentum reversal)
QQE+ v7 Advanced** (dynamic volatility filter)
OBV Trend Filter** (volume-backed trend validation)
Volume Game** (net volume spike and reversal detection)
Each module can be enabled or disabled to fit your personal trading style.
4. Institutional S/R and Retest Logic
Real-time recognition of major trendline breaks, retest zones, and price flips.
Automatic labeling and coloring of S/R zones, retest boxes, and confirmation candles.
5. Smart Buy & Sell Signal Generation**
Combines all scoring modules with strict logical filters and “failsafe override” logic (guaranteeing signal on confirmed hammers, engulfings, etc. even if other filters disagree).
Plots clear “BUY” and “SELL” labels only when a strong, multi-factor signal appears—minimizing noise and maximizing reliability.
Built-in fallback logic (optional) for edge cases.
6. Alerts & Automation Ready
TradingView alerts for all BUY, SELL, or ANY signal conditions—perfect for auto-trading or notification setups.
---
*⚙️ Customizable Inputs
Enable/Disable any module (RSI Games, MACD, OBV, QQE+, Candlestick Scanner, Volume Game)
Minimum Confirmations** required for a signal (1–10)
Pivot/Zone Sensitivity:** ATR multiplier, pivots per cluster, retest bar duration
LTF (Lower Timeframe) Confirmation:** Fully configurable
---
📊 How To Use**
Apply on any timeframe and symbol**—crypto, stocks, forex, indices.
Use as a **standalone reversal/entry tool** or to confirm your own technical setups.
Combine with your favorite momentum, trend, or volume indicators for advanced confluence.
Set up **TradingView alerts** for auto-trading, Telegram/email notifications, or trade journaling.
---
🟢 What Makes This Unique?
All-in-one multi-indicator fusion:** No more juggling a dozen scripts.
Institutional logic:** Goes beyond basic signals with true S/R, retest, and volume logic.
Full transparency:** Source code is clear and commented (if published open-source).
Fast and reliable:** Optimized for minimal lag and maximum accuracy.
---
⚠️ Disclaimer**
This indicator is a tool to assist with trade timing and risk management. **No system is 100% accurate.** Always use in conjunction with your own analysis and risk management practices.
---
📚 Credits & License**
Created by Keyvan Khodakhah.
You may use, modify, or share this script under the (mozilla.org).
Please credit the original author if you fork or reuse in public.
---
Questions, feedback, or collaboration? Contact: Keyvankh
---
Precision in technical analysis comes from layers of confluence and discipline. This tool brings that precision to your chart.

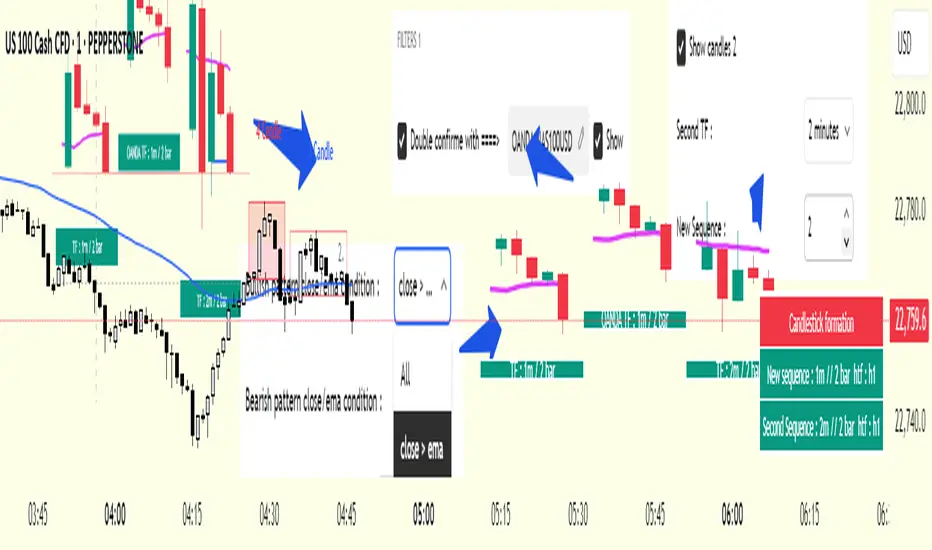
cd_secret_candlestick_patterns_CxHi traders,
With this indicator, we aim to uncover secret candlestick formations that even advanced traders may miss—especially those that can't be detected by classic pattern indicators, unless you're a true master of candlestick patterns or candle math.
________________________________________
General Idea:
We'll try to identify candlestick patterns by regrouping candles into custom-sized segments that you define.
You might ask: “Why do I need this? I can just look at different timeframes and spot the structure anyway.” But it’s not the same.
For example, if you're using a 1-minute chart and add a higher-timeframe candle overlay (like 5-minute), the candles you see start at fixed timestamps like 0, 5, 10, etc.
However, in this indicator, we redraw new candles by grouping them from the current candle backward in batches of five.
These candles won't match the standard view—only when aligned with exact time multiples (e.g., 0 and 5 minutes) will they look the same.
In classic charts:
• You see 5-minute candles that begin every 0 and 5 minutes.
In this tool:
• You see a continuously updating set of 5 merged 1-minute candles redrawn every minute.
What about the structures forming in between those fixed timeframes?
That’s exactly what we’ll be able to detect—while also making the lower timeframe chart more readable.
________________________________________
Candle Merging:
Let’s continue with an example.
Assume we choose to merge 5 candles. Then the new candle will be formed using:
open = open
close = close
high = math.max(high , high , high , high , high)
low = math.min(low , low , low , low , low)
This logic continues backward on the chart, creating merged candles in groups of 5.
Since the selected patterns are made up of 3, 4, or 5 candles, we redraw 5 such merged candles to analyze.
________________________________________
Which Patterns Are Included?
A total of 18 bullish and bearish patterns are included.
You’ll find both widely known formations and a few personal ones I use, marked as (MeReT).
You can find the pattern list and visual reference here:
________________________________________
Entry and Filtering Suggestions:
Let me say this clearly:
Entering a trade every time a pattern forms will not make you profitable in the long run.
You need a clear trade plan and should only act when you can answer questions like:
• Where did the pattern appear?
• When and under what conditions?
It’s more effective to trade in the direction of the trend and look for setups around support/resistance, supply/demand zones, key levels, or areas confirmed by other indicators.
Whether you enter immediately after the pattern or wait for a retest is a personal choice—but risk management is non-negotiable.
One of the optional filters I’ve included is a Higher Timeframe (HTF) condition, which is my personal preference:
When enabled, the highest or lowest price among the pattern candles must match the high or low of the current HTF candle.
You can see in the image below the decrease in the number of detected patterns on the 1-minute chart when using no filter (blue labels) compared to when the 1-hour timeframe filter is applied (red labels).
Additionally, I’ve added a “protected” condition for engulfing patterns to help filter out weak classic engulf patterns.
________________________________________
Settings:
From the menu, you can configure:
• Number of candles for regrouping
• Distance between the last candle and newly drawn candles
• Show/hide options
• HTF filter toggle and timeframe selection
• Color, label placement, and text customization
• Pattern list (select which to display or trigger alerts for)
My preferred setup:
While trading on the 1-minute chart, I typically set the higher timeframe to 15m or 1H, and switch the candle count between 2 and 3 depending on the situation.
⚠️ Important note:
The “Show” and “Alert” options are controlled by a single command.
Alerts are automatically created for any pattern you choose to display.
________________________________________
What’s Next?
In future updates, I plan to add:
• Pattern success rate statistics
• Multi-broker confirmation for pattern validation
Lastly, keep in mind:
The more candles a pattern is based on, the more reliable it may be.
I'd love to hear your feedback and suggestions.
Cheerful trading! 🕊️📈
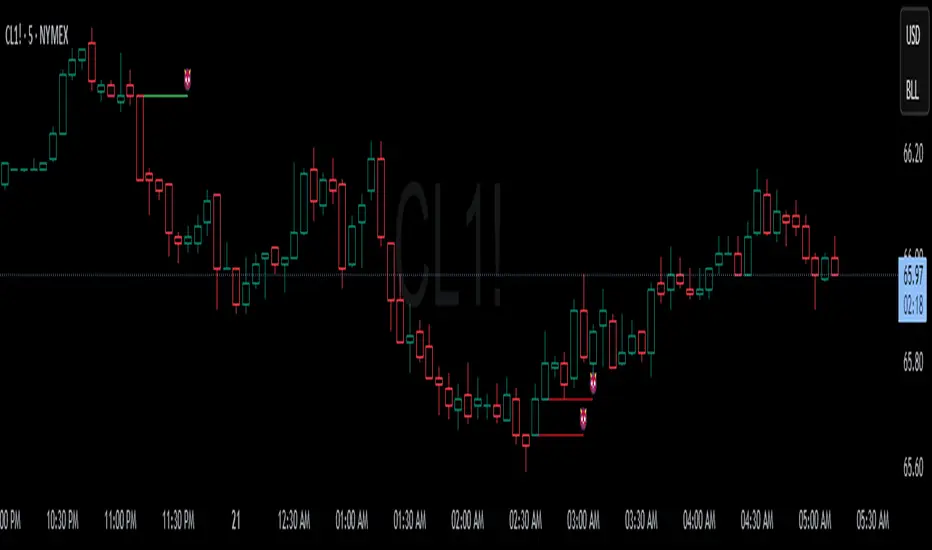
Devils MarkThe Devil’s Mark Indicator identifies bullish or bearish candlesticks with no opposing wick, plotting a horizontal line at the open/low (bullish) or open/high (bearish) price to mark the inefficiency.
This line highlights the level where price is expected to retrace to form the missing wick, serving as a visual cue.
The line is automatically removed from the chart once price crosses it, confirming the inefficiency has been rebalanced.
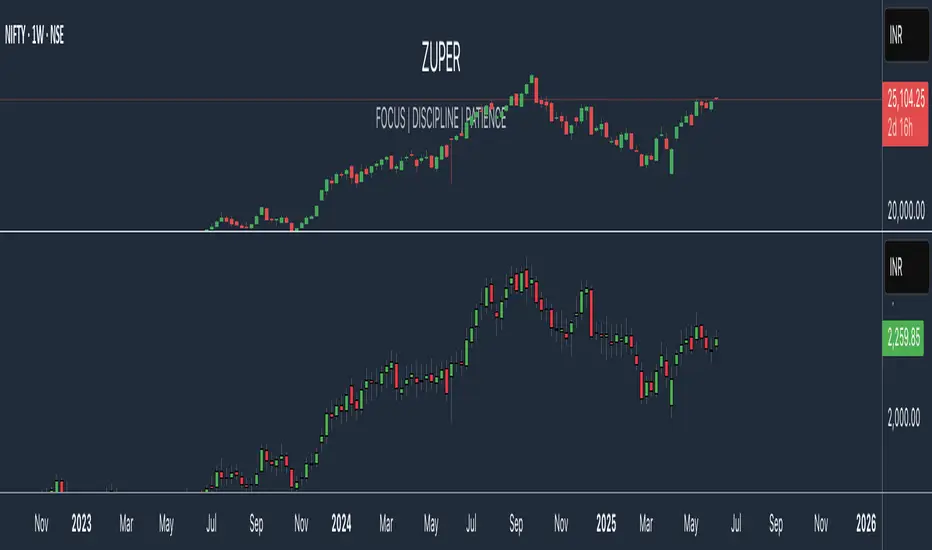
Zuper Custom Index (Up to 40 Stocks)Description:
This indicator empowers you to create your own custom index from up to 40 stocks, with full control over the weight of each component. Whether you want to track a sector, a basket of favourites, or build your own benchmark, this tool gives you the flexibility and visualisation you need—all directly on your TradingView chart.
Key Features:
Supports Up to 40 Stocks:
Combine up to 40 different symbols into a single, custom index.
Flexible Weighting:
Assign a custom percentage weight to each stock. The script automatically normalizes your weights to ensure the index always sums to 100%.
Candlestick or Line Chart Display:
Choose between a candlestick chart (showing open, high, low, close of the index) or a simple line chart (close only) for your custom index.
Dynamic Rebalancing:
Change weights or symbols at any time; the index recalculates instantly.
Easy Symbol Input:
Add or remove stocks with simple input fields—no code editing required.
Perfect for Sector Analysis & Custom Baskets:
Track sectors, strategies, or any group of assets you care about.
How to Use:
Add the Indicator to Your Chart.
Enter Up to 40 Stock Symbols in the input fields.
Assign Weights (as percentages) to each symbol.
If all weights are left at zero, the index will use equal weighting.
If you enter custom weights, they will be automatically normalized.
Choose Your Display Type:
Select between a candlestick or line chart for your index.
Analyze Your Custom Index!
Use Cases:
Build your own sector or thematic index.
Track a custom ETF or fund composition.
Compare your portfolio’s performance as a single chart.
Visualize the impact of different weightings on a basket of stocks.
Notes:
The indicator uses TradingView’s latest Pine Script version for maximum performance and flexibility.
You can use any valid TradingView symbol (stocks, ETFs, indices, etc.).
For best results, ensure all symbols are available on your selected timeframe and exchange.
Create, visualize, and analyze your own custom indices—right on your TradingView chart!
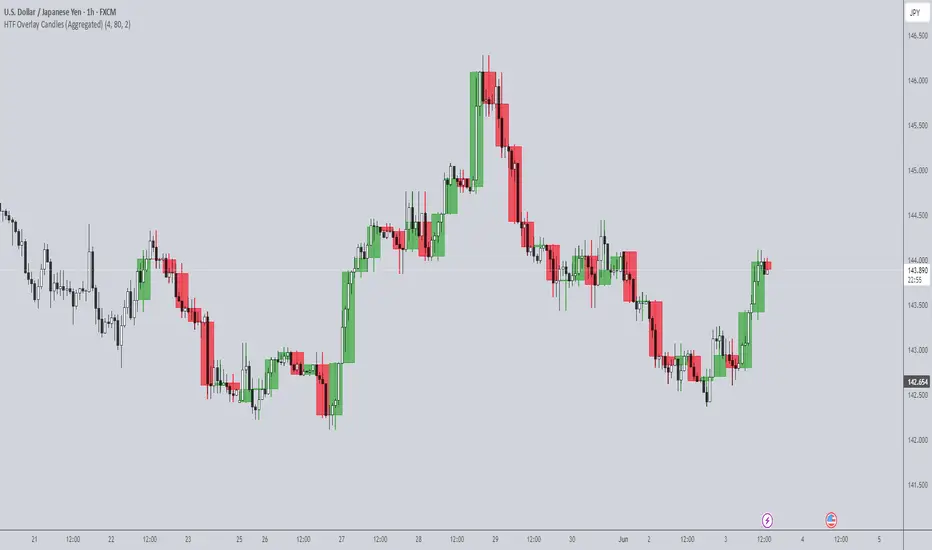
HTF Overlay Candles (Aggregated)🕯️ Synthetic Aggregated Candles
Created by: The_Forex_Steward
License: Mozilla Public License 2.0
🔍 Description
This indicator creates visually aggregated candles directly on your chart, allowing you to view synthetic candlesticks that combine multiple bars into one. It enables a higher-level perspective of price action without switching timeframes.
Each synthetic candle is built by combining a user-defined number of consecutive bars (e.g., 4 bars from the current timeframe form one aggregated candle). It accurately tracks open, high, low, and close values, then draws a colored box and wick to represent the aggregated data.
⚙️ Features
Aggregation Factor: Combine candles over a custom number of bars (e.g., 4 = 4x current TF)
Timezone Alignment: Aggregation is aligned with midnight in UTC-5 (modifiable in code)
Custom Colors: Choose colors for bullish and bearish synthetic candles
Body Opacity: Control the opacity of the candle body for visual clarity
Wick Width: Customize the thickness of the candle wick
📌 Use Case
Ideal for traders looking to:
- Reduce noise in lower timeframes
- Visualize price action in broader chunks
- Spot larger structure and swing patterns without switching charts
📈 How It Works
At every bar, the script checks whether a new aggregation interval has begun (aligned to the day start). If so, it finalizes the previous candle and starts a new one. On the last bar of the chart, it ensures the final synthetic candle is drawn.
✅ Tip
For best results, apply this script on intraday timeframes and experiment with different aggregation factors (4, 6, 12, etc.) to discover the most insightful compression for your strategy.
Note: This script is optimized for visual representation only. It does not repaint, but it is not intended for algorithmic strategies or alerts.
Pro Signal Suite [LePasha]Pro Signal Suite
Description:
This advanced signal indicator combines candlestick pattern analysis, RSI momentum, and candle stability metrics to generate precise Buy and Sell signals on your chart.
It identifies bullish and bearish engulfing patterns filtered by candle stability and RSI thresholds, enhanced by price movement comparison over a configurable lookback period.
Designed for clarity and customization, it offers multiple label styles and colors with options to suppress repeating signals for clean chart visualization.
Core Logic:
• Candle Stability Index: Measures the strength of a candle by comparing its body size to its total range (high-low). Higher values indicate more reliable candle formations.
• RSI Filter: Uses the Relative Strength Index (RSI) to identify overbought and oversold market conditions.
• Engulfing Patterns: Detects classic bullish and bearish engulfing candlestick patterns as entry triggers.
• Price Movement Confirmation: Checks price movement over a user-defined number of candles to confirm trend continuation.
• Bar Confirmation: Signals are issued only on confirmed bars to avoid premature alerts.
Inputs:
• Candle Stability Threshold (0-1): Minimum ratio of candle body to range to consider a candle stable.
• RSI Threshold (0-100): RSI cutoff level to identify oversold (for Buy) or overbought (for Sell) conditions.
• Candle Lookback Length (≥3): Number of candles to compare price movement for trend validation.
• Prevent Repeating Signals (true/false): Option to disable multiple consecutive identical signals for cleaner charts.
Visual Settings:
• Label Size: Choose from huge, large, normal, small, or tiny.
• Label Style: Select from text bubble, triangle, or arrow.
• BUY/SELL Label Colors and Text Colors: Fully customizable for personal preference or color schemes.
Usage:
Ideal for traders seeking a simple yet robust entry signal based on price action and momentum indicators.
Can be combined with other tools like Supertrend, VWAP, or EMA for enhanced trading strategies.
Best applied on confirmed bars to reduce noise and false signals.
Limitations:
• Like all indicators, signals are not guaranteed and should be used alongside risk management.
• Best used on liquid markets and suitable timeframes for candlestick pattern reliability.

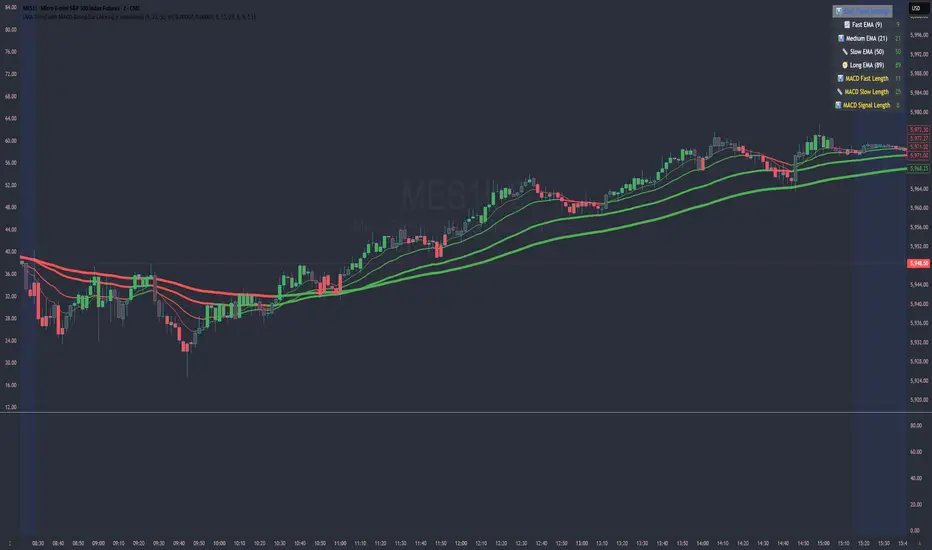
EMA Trend with MACD-Based Bar Coloring (Customized)This indicator blends trend-following EMAs with MACD-based momentum signals to provide a visually intuitive view of market conditions. It's designed for traders who value clean, color-coded charts and want to quickly assess both trend direction and overbought/oversold momentum.
🔍 Key Features:
Multi-EMA Trend Visualization:
Includes four Exponential Moving Averages (EMAs):
Fast (9)
Medium (21)
Slow (50)
Long (89)
Each EMA is dynamically color-coded based on its slope—green for bullish, red for bearish, and gray for neutral—to help identify the trend strength and alignment at a glance.
MACD-Based Bar Coloring:
Candlesticks are colored based on MACD's relationship to its Bollinger Bands:
Green bars signal strong bullish momentum (MACD > Upper Band)
Red bars signal strong bearish momentum (MACD < Lower Band)
Gray bars reflect neutral conditions
Compact Visual Dashboard:
A clean, top-right table displays your current EMA and MACD settings, helping you track parameter configurations without opening the settings menu.
✅ Best Used For:
Identifying trend alignment across short- to medium-term timeframes
Filtering entries based on trend strength and MACD overextension
Enhancing discretion-based or rule-based strategies with visual confirmation
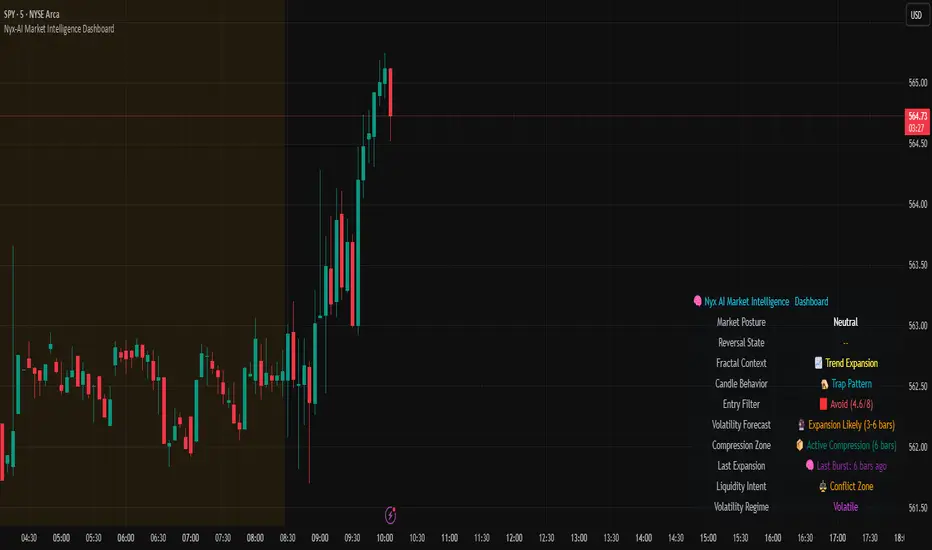
Nyx-AI Market Intelligence DashboardNyx AI Market Intelligence Dashboard is a non-signal-based environmental analysis tool that provides real-time insight into short-term market behavior. It is designed to help traders understand the quality of current price action, volume dynamics, volatility conditions, and structural behavior. It informs the trader whether the current market environment is supportive or hostile to trading and whether any active signal (from other tools) should be trusted, filtered, or avoided altogether.
Nyx is composed of seven intelligent modules. Each module operates independently but is visually unified through a floating dashboard panel on the chart. This panel renders live diagnostics every few bars, maintaining a low visual footprint without drawing overlays or modifying price.
Market Posture Engine
This module reads individual candlesticks using real-time candle anatomy to interpret directional bias and sentiment. It examines body-to-range ratio, wick imbalances, and compares them to prior bars. If the current candle is a large momentum body with minimal wick, it is interpreted as a directional thrust. If it is a small body with equal wicks, it is considered indecision. Engulfing patterns are used to detect potential liquidity tests. The system outputs a plain-text posture signal such as Building Bullish Intent, Bearish Momentum, Indecision Zone, Testing Liquidity (Up or Down), or Neutral.
Flow Reversal Engine
This module monitors short-term structural shifts and volume contraction to detect early signs of reversal or exhaustion. It looks for lower highs or higher lows paired with weakening volume and closing behavior that implies loss of momentum. It also monitors divergence between price and volume, as well as bar-to-bar momentum stalls (where highs and lows stop expanding). When these conditions are met, it outputs one of several states including Top Forming, Bottom Forming, Flow Divergence, Momentum Stall, or Neutral. This is useful for detecting inflection points before they manifest on trend indicators.
Fractal Context Engine
This engine compares the current bar’s range to its surrounding structural context. It uses a dynamic lookback length based on volatility. It determines whether the market is in expansion (strong directional trend), compression (shrinking range), or a transitional phase. A special case called Flip In Progress is triggered when the current high and low exceed the entire recent range, which often precedes sharp reversals or volatility expansion. The result is one of the following: Trend Expansion, Trend Breakdown, Sideways or Coil, Flip In Progress, or Expansion to Coil.
Candle Behavior Analyzer
This module analyzes the last five candles as a set to detect behavioral traits that a single candle may not reveal. It calculates average body and wick size, and counts how many recent candles show thrust (large body dominance), trap behavior (price returns inside wicks), or weakness (small bodies with high wick ratios). The module outputs one of the following behaviors: Aggressive Buying, Aggressive Selling, Trap Pattern, Trap During Coil, Low Participation, Low Energy, or Fakeout Candle. This helps the trader assess sentiment quality and the reliability of price movement.
Volatility Forecast and Compression Memory
This module predicts whether a breakout is likely based on recent compression behavior. It tracks how many of the last 10 bars had significantly reduced range compared to average. If a certain threshold is met without any recent large expansion bar, the system forecasts that a volatility expansion is likely in the near future. It also records how many bars ago the last high volatility impulse occurred and classifies whether current conditions are compressing. The outputs are Expansion Likely, Active Compression, and Last Burst memory, which provide breakout timing and energy insights.
Entry Filter
This module scores the current bar based on four adaptive criteria: body size relative to range, volume strength relative to average, current volatility versus historical volatility, and price position relative to a 20-period moving average. Each factor is scored as either 1 or 2. The total score is adjusted by a behavioral modifier that adds or subtracts a point if recent candles show aggression or trap behavior. Final scores range from 4 to 8 and are classified into Optimal, Mixed, or Avoid categories. This module is not a trade signal. It is a confluence filter that evaluates whether conditions are favorable for entry. It is particularly effective when layered with other indicators to improve precision.
Liquidity Intent Engine
This engine checks for price behavior around recent swing highs and lows. It uses adaptive pivots based on volatility to determine if price has swept above a recent high or below a recent low. This behavior is often associated with institutional liquidity hunts. If a sweep is detected and price has moved away from the sweep level, the engine infers directional intent and compares current distance to the high and low to determine which liquidity pool is more dominant. The output is Magnet Above, Magnet Below, or Conflict Zone. This is useful for anticipating directional bias driven by smart money activity.
Sticky Memory Tracking
To avoid flickering between states on low volatility or noisy price action, Nyx includes a sticky memory system. Each module’s output is preserved until a meaningful change is detected. For example, if Market Posture is Neutral and remains so for several bars, the previous non-neutral value is retained. This makes the dashboard more stable and easier to interpret without misleading noise.
Dashboard Rendering
All module outputs are displayed in a clean two-column panel anchored to any corner of the chart. Text values are color-coded, tooltips are added for context, and the data refreshes every few bars to maintain speed. The dashboard avoids clutter and blends seamlessly with other chart tools.
This tool is intended for informational and educational purposes only. It does not provide financial advice or trading signals. Nyx analyzes price, volume, structure, and volatility to offer context about the current market environment. It is not designed to predict future price movements or guarantee profitable outcomes. Traders should always use independent judgment and risk management. Past performance of any analysis logic does not guarantee future results.
AlphaTrend++AlphaTrend++
Overview
The AlphaTrend++ is an advanced Pine Script indicator designed to help traders identify buy and sell opportunities in trending and volatile markets. Building on trend-following principles, it uses a modified Average True Range (ATR) calculation combined with volume or momentum data to plot a dynamic trend line. The indicator overlays on the price chart, displaying a colored trend line, a filled trend zone, buy/sell signals, and optional stop-loss tick labels, making it ideal for day trading or swing trading, particularly in markets like futures (e.g., MES).
What It Does
This indicator generates buy and sell signals based on the direction and momentum of a custom trend line, filtered by optional time restrictions and signal frequency logic. The trend line adapts to price action and volatility, with a filled zone highlighting trend strength. Buy/sell signals are plotted as labels, and stop-loss distances are displayed in ticks (customizable for instruments like MES). The indicator supports standard chart types for realistic signal generation.
How It Works
The indicator employs the following components:
Trend Line Calculation: A dynamic trend line is calculated using ATR adjusted by a user-defined multiplier, combined with either Money Flow Index (MFI) or Relative Strength Index (RSI) depending on volume availability. The line tracks price movements, adjusting upward or downward based on trend direction and volatility.
Trend Zone: The area between the current trend line and its value two bars prior is filled, colored green for bullish trends (upward movement) or red for bearish trends (downward movement), providing a visual cue of trend strength.
Signal Generation: Buy signals occur when the trend line crosses above its value two bars ago, and sell signals occur when it crosses below, with optional filtering to reduce signal noise (based on bar timing logic). Signals can be restricted to a 9:00–15:00 UTC trading window.
Stop-Loss Ticks: For each signal, the indicator calculates the distance to the trend line (acting as a stop-loss level) in ticks, using a user-defined tick size (default 0.25 for MES). These are displayed as labels below/above the signal.
Time Filter: An optional filter limits signals to 9:00–15:00 UTC, aligning with active trading sessions like the US market open.
The indicator ensures compatibility with standard chart types (e.g., candlestick or bar charts) to avoid unrealistic results associated with non-standard types like Heikin Ashi or Renko.
How to Use It
Add to Chart: Apply the indicator to a candlestick or bar chart on TradingView.
Configure Settings:
Multiplier: Adjust the ATR multiplier (default 1.0) to control trend line sensitivity. Higher values widen the stop-loss distance.
Common Period: Set the ATR and MFI/RSI period (default 14) for trend calculations.
No Volume Data: Enable if volume data is unavailable (e.g., for certain forex pairs), switching from MFI to RSI.
Tick Size: Set the tick size for stop-loss calculations (default 0.25 for MES futures).
Show Buy/Sell Signals: Toggle signal labels (default enabled).
Show Stop Loss Ticks: Toggle stop-loss tick labels (default enabled).
Use Time Filter: Restrict signals to 9:00–15:00 UTC (default disabled).
Use Filtered Signals: Enable to reduce signal frequency using bar timing logic (default enabled).
Interpret Signals:
Buy Signal: A blue “BUY” label below the bar indicates a potential long entry (trend line crossover, passing filters).
Sell Signal: A red “SELL” label above the bar indicates a potential short entry (trend line crossunder, passing filters).
Trend Zone: Green fill suggests bullish momentum; red fill suggests bearish momentum.
Stop-Loss Ticks: Gray labels show the stop-loss distance in ticks, helping with risk management.
Monitor Context: Use the trend line and filled zone to confirm the market’s direction before acting on signals.
Unique Features
Adaptive Trend Line: Combines ATR with MFI or RSI to create a responsive trend line that adjusts to volatility and market conditions.
Tick-Based Stop-Loss: Displays stop-loss distances in ticks, customizable for specific instruments, aiding precise risk management.
Signal Filtering: Optional bar timing logic reduces false signals, improving reliability in choppy markets.
Trend Zone Visualization: The filled zone between trend line values enhances trend clarity, making it easier to assess momentum.
Time-Restricted Trading: Optional 9:00–15:00 UTC filter aligns signals with high-liquidity sessions.
Notes
Use on standard candlestick or bar charts to ensure accurate signals.
Test the indicator on a demo account to optimize settings for your market and timeframe.
Combine with other analysis (e.g., support/resistance, volume spikes) for better decision-making.
The indicator is not a standalone system; use it as part of a broader trading strategy.
Limitations
Signals may lag in highly volatile or low-liquidity markets due to ATR-based calculations.
The 9:00–15:00 UTC time filter may not suit all markets; disable it for 24-hour assets like forex or crypto.
Stop-loss tick calculations assume consistent tick sizes; verify compatibility with your instrument.
This indicator is designed for traders seeking a robust, trend-following tool with customizable risk management and signal filtering, optimized for active trading sessions.

Relative Volume CandlesVisualizes candlesticks with transparency based on volume relative to a moving average. Higher-than-average volume makes candles more opaque, while lower volume increases transparency—helping you spot significant price movements at a glance!
Features:
Customizable up/down candle colors (default: green/red)
Adjustable lookback period for volume averaging (default: 21)
Fine-tune transparency with base transparency (default: 80) and scale (default: 2.0)
Overlay directly on your chart for seamless analysis
