Candlestick MathThis is a script I made to do what is called candlestick math (if you're not sure, Google it). It will take the first open, the last close, and the highest high and lowest low from a range of candlesticks, and plot it on top of the chart.
Unfortunately, there is no way to make it so you can move it with your mouse, and the bar numbering is not the same as the regular drawing tools, so to figure out what the line number is, create a new script with the text:
study("Plot N")
plot(n)
This will create another chart that will show you the bar numbers that correspond to the script's bar numbers. From there, figure out where you want to start the candlestick math, and enter that number in the "Start" field in the inputs for this script.
Search in scripts for "Candlestick"

Candlestick DataCandlestick Data Indicator
The Candlestick Data indicator provides a comprehensive overview of key metrics for analyzing price action and volume in real-time. This overlay indicator displays essential candlestick data and calculations directly on your chart, offering an all-in-one toolkit for traders seeking in-depth insights.
Key Features:
Price Metrics: View the daily high, low, close, and percentage change.
Volume Insights: Analyze volume, relative volume, and volume buzz for breakout or consolidation signals.
Range Analysis: Includes closing range, distance from low of day (LoD), and percentage change in daily range expansion.
Advanced Metrics: Calculate ADR% (Average Daily Range %), ATR (Average True Range), and % from 52-week high.
Moving Averages: Supports up to four customizable moving averages (EMA or SMA) with distance from price.
Market Context: Displays the sector and industry group for the asset.
This indicator is fully customizable, allowing you to toggle on or off specific metrics to suit your trading style. Designed for active traders, it brings critical data to your fingertips, streamlining decision-making and enhancing analysis.
Perfect for momentum, swing, and day traders looking to gain a data-driven edge!

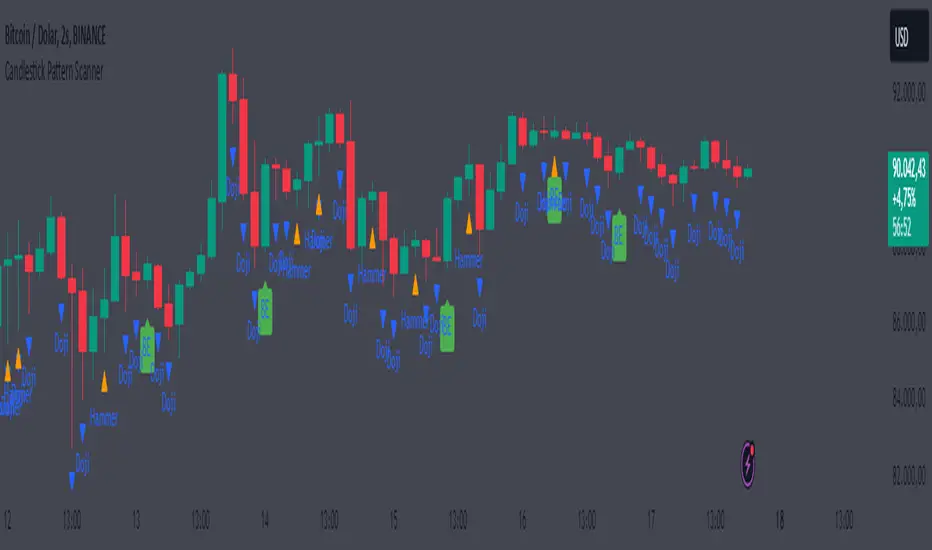
Candlestick Pattern ScannerCandlestick Pattern Scanner
This indicator identifies popular candlestick patterns on the chart and provides visual and alert-based support for traders. Based on technical analysis, it provides insights into potential trend reversals or continuation signals in price action. The following patterns are detected and marked:
1. Bullish Engulfing
Definition: Considered a strong bullish signal. A small red candle is followed by a large green candle that completely engulfs the previous one.
Chart Display: Marked with a green arrow below the price bar.
Alert Message: "Bullish Engulfing Pattern Detected!"
2. Bearish Engulfing
Definition: Considered a strong bearish signal. A small green candle is followed by a large red candle that completely engulfs the previous one.
Chart Display: Marked with a red arrow above the price bar.
Alert Message: "Bearish Engulfing Pattern Detected!"
3. Doji
Definition: Indicates indecision in the market. The candlestick has an opening and closing price that are almost the same, forming a very small body.
Chart Display: Marked with a blue triangle below the price bar.
Alert Message: "Doji Pattern Detected!"
4. Hammer
Definition: Can signal a strong bullish reversal. It has a long lower shadow and a small body, often appearing at the end of a downtrend.
Chart Display: Marked with an orange triangle below the price bar.
Alert Message: "Hammer Pattern Detected!"
5. Shooting Star
Definition: Can signal a strong bearish reversal. It has a long upper shadow and a small body, often appearing at the end of an uptrend.
Chart Display: Marked with a purple triangle above the price bar.
Alert Message: "Shooting Star Pattern Detected!"
Features:
Visual Support: Patterns are clearly marked on the chart using distinct shapes (arrows and triangles).
Alerts: Receive real-time notifications through TradingView’s alert system when a pattern is detected.
Versatility: Useful for identifying both trend reversals and continuation signals.
User-Friendly: Patterns are easily distinguishable with unique color coding.
Purpose:
This indicator helps traders identify potential reversal points or strong trend beginnings in price action. It can be used as a supportive tool in scalping, swing trading, or long-term investment strategies.
Candlestick Patterns indicator V1 This indicator detects 4 candlestick patterns on the chart with confluences of EMA and market trend.
The indicator first considers the body percentages for candles and then checks the conditions for the formation of candlestick patterns.
This indicator detects the following patterns.
Pinbar
Morning & Evening Doji star
Engulfing Pattern
Tweezer Pattern
Let's talk about how the indicator detects these patterns.
Pinbar:
For Pinbar, the indicator takes the following inputs for body analysis.
Body above or below %: Using this parameter, the indicator looks for pin bar formation in which the candle's body is at specifying distance form the high or low of the candles.
Body Upper Limit: This specifies the maximum size for the body of pinbar relative to its total range.
Body Lower Limit: This specifies the minimum size for the body of pinbar relative to its total range.
Engulfing Candle:
For Engulfing Candle, the indicator takes the following inputs for body analysis.
Body Percentage of Big Candle: This specifies the size of the body of a bigger candle or the latest candle
Body Percentage of Small Candle: This specifies the size of the body for small candle that is being engulfed.
Tweezer Candle:
For Tweezer Candle, the indicator takes the following inputs for body analysis.
At what percentage should the second candle close: This specifies the close of the latest candle relative to the first candle
Body Percentage of First Candle: This specifies the size of the body of first or former candle
Body Percentage of Second Candle: This specifies the size of the body for the second or latest candle
Doji Star Candle:
For Doji Star Candle, the indicator takes the following inputs for body analysis.
Body Percentage of First Candle: This specifies the size of the body of the first candle
Body Percentage of Second Candle: This specifies the size of the body of the Second or middle candle
Body Percentage of Third Candle: This specifies the size of the body for the Third or latest candle
At what percentage should the last candle close: This specifies the close of the latest candle relative to the first candle
Also, for each candlestick, there is an option to show or hide the label and change the colour of the labels

Candlestick Body and Wick Midpoints [Dire]Summary
This indicator provides a deeper look into intra-bar price action by plotting the precise halfway point of each candlestick's body, top wick, and bottom wick. It renders three distinct, color-coded horizontal lines on each of the most recent candles, helping traders identify hidden micro-levels of interest.
How It Works
For each candlestick, the indicator calculates and plots:
Top Wick Midpoint: The median price of the sell-off (or profit-taking) range.
Body Midpoint: The equilibrium or "fair price" point between the open and close.
Bottom Wick Midpoint: The median price of the buy-up (or support) range.
How to Use
These levels can serve as micro-pivots or points of interest for price action analysis. A return to a previous wick's midpoint may signal a potential reaction. Observing how these levels align over several bars can reveal subtle areas of price consensus or rejection that are not obvious from standard candle charts.
Customization
Lookback Period: Easily adjust the number of recent candles to analyze via the "Inputs" tab.
Colors: The color for each of the three lines (Top Wick, Body, and Bottom Wick) can be fully customized in the "Style" tab of the indicator settings.
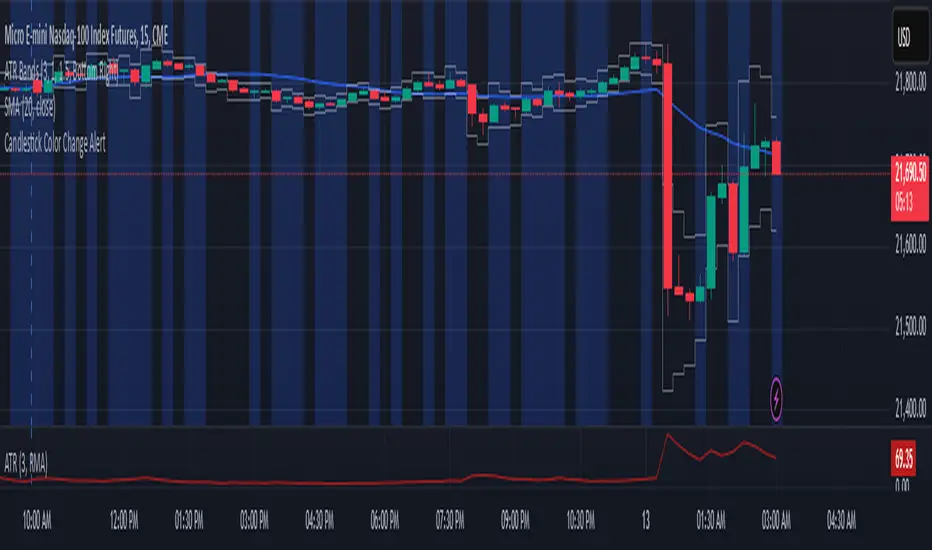
Candlestick Color Change AlertIt is an alert for change of candlestick color.
Identifies Candle Type
A candle is bullish if the closing price is higher than the opening price.
A candle is bearish if the closing price is lower than the opening price.
Detects a Color Change
The script checks if the current candle is bullish while the previous candle was bearish, or vice versa.
If a change is detected, an alert is triggered.
Triggers an Alert
Users receive an alert notification whenever a candlestick color change occurs.
Alerts can be set for popup, email, mobile push, or webhook notifications.
Visual Highlighting (Optional)
The script can also apply a background color (blue) on the chart to visually mark color changes.
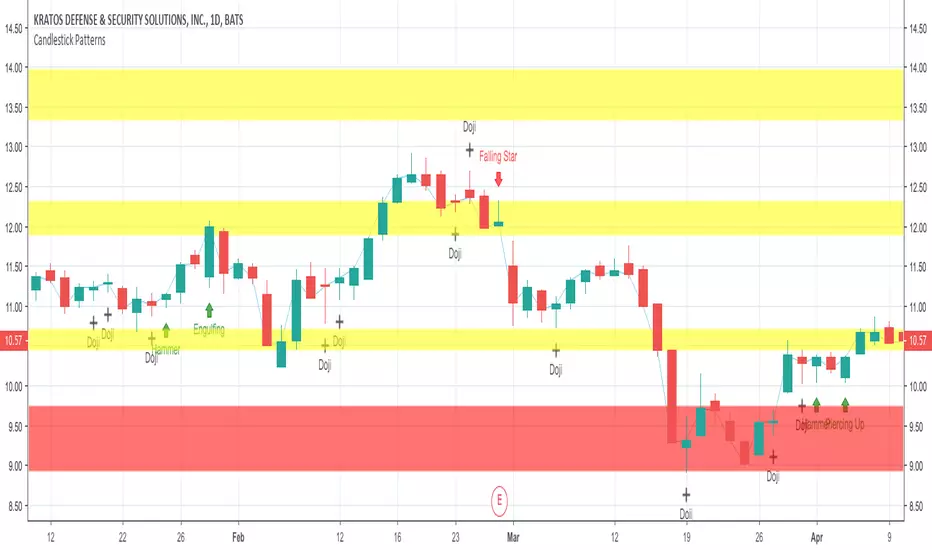
Candlestick Pattern [sma]Detects and labels well-known Japanese candlestick formations directly on the chart, helping traders visually spot potential market reversals or continuation signals.
Bullish patterns
Hammer · Bullish Engulfing · Morning Star · Piercing Pattern · Dragonfly Doji · Bullish Harami
Bearish patterns
Shooting Star · Bearish Engulfing · Evening Star · Dark Cloud Cover · Gravestone Doji · Bearish Harami · Hanging Man
Features
Adjustable label size (tiny, small, normal)
Optional tooltip with candle data (open, close, high, low)
Built-in alerts when any bullish or bearish pattern is detected
This indicator is designed for educational and analytical purposes and does not provide financial advice.

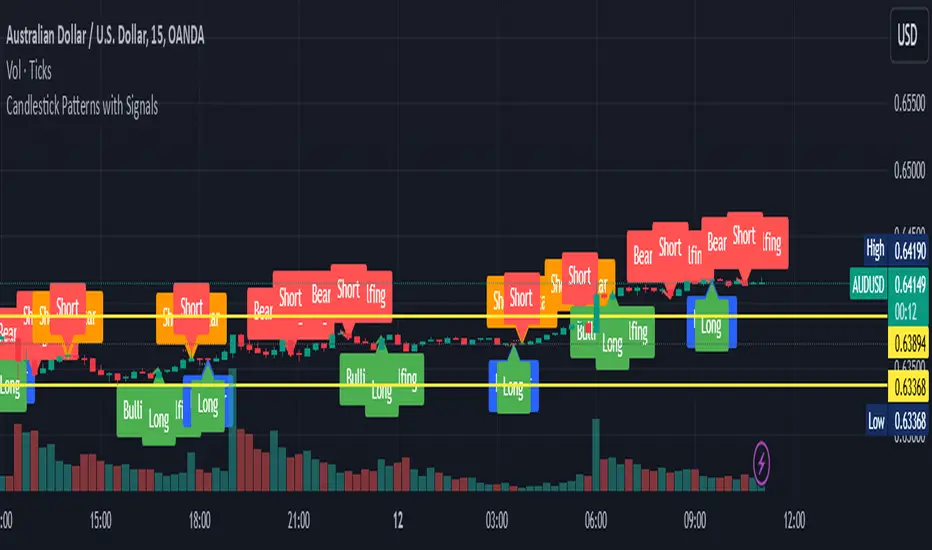
Candlestick Patterns with SignalsIdentified Patterns:
Bullish Engulfing: Indicates potential upward price movement, marked with green labels and lines.
Bearish Engulfing: Suggests potential downward price movement, marked with red labels and lines.
Hammer: A bullish reversal pattern, marked with blue labels.
Shooting Star: A bearish reversal pattern, marked with orange labels.
Signal Generation:
Long Signal: Triggered when a Bullish Engulfing or Hammer pattern is detected. A dotted green line marks the entry level.
Short Signal: Triggered when a Bearish Engulfing or Shooting Star pattern is detected. A dotted red line marks the entry level.
Visual Elements:
Labels indicating the candlestick pattern names appear at the relevant candles.
Lines connect the previous and current candles for engulfing patterns to highlight their range.
Dotted lines indicate potential entry levels for long or short trades.
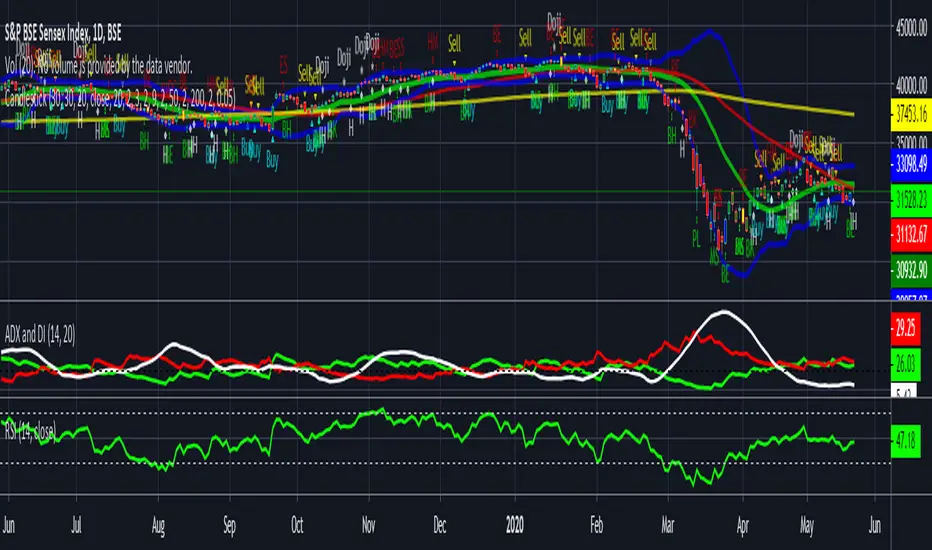
Candlestick Patterns With EMA and Stochastic6/11/15, Corrected barcolor errors.
Candlestick patterns identified and color coded according to position above or below 8EMA(TLine).
Special thanks to repo32, DavidR, and Chris Moody for coding ideas.
Bullish candlestick buy signals have a greater probability of success when Stochastics are oversold. Bearish ones have a
greater probability of success when overbought. Stack as many factors in your favor as possible. A candlestick signal by itself is of little value unless you apply additional information with it. An 8 EMA is coded also to help with buy/sell signals. Some of the videos by Steven Bigalow are on the Web to see how he uses it.
www.youtube.com
Regardless of systems and strategies used, make your second trade first: Know when you're going to exit. Risk management rules. Good luck and good trading.

Noteworthy CandlesticksThis indicator identifies noteworthy candlestick formations by analyzing the proportions of a candlestick’s body, wicks, and shadows in relation to its total range. It highlights specific patterns to assist in analyzing potential market activity.
Key Features
Lower Wick Candles: It identifies candlesticks with long lower wicks, which may indicate price rejection at lower levels.
Upper Wick Candles: It detects candlesticks with long upper wicks, which may indicate price rejection at higher levels.
Doji Candles: It recognizes candlesticks with small bodies relative to their range, often associated with market indecision.
Definitions of Wicks and Shadows
In traditional candlestick charting, the terms wick and shadow are interchangeable, referring to the thin lines extending above and below the candlestick's body. However, this indicator uses distinct definitions:
Wicks represent the distance from the edges of the candlestick body (the open and close prices) to the high or low.
Shadows measure the distance from the closing price to the high or low of the candlestick.
By distinguishing between wicks and shadows, the indicator provides separate insights into price extremes (wicks) and price behavior around the close (shadows).
How It Works
The indicator evaluates each candlestick against user-defined thresholds for wick and shadow length. It compares the overall range of the candlestick to the ATR (Average True Range) to ensure patterns are relevant in the context of recent volatility.
Candlesticks with noteworthy lower wicks are marked with a symbol below the bar.
Candlesticks with noteworthy upper wicks are marked with a symbol above the bar.
Doji candles are marked with symbols both above and below the bar.
Applications
This indicator can assist traders in identifying potential areas of price reversal, rejection, or indecision. It can also provide additional context when used alongside other technical tools like volume analysis, trendlines, or support and resistance levels.
Acknowledgment
This description was written by ChatGPT to facilitate the understanding of the indicator's features and functionality.

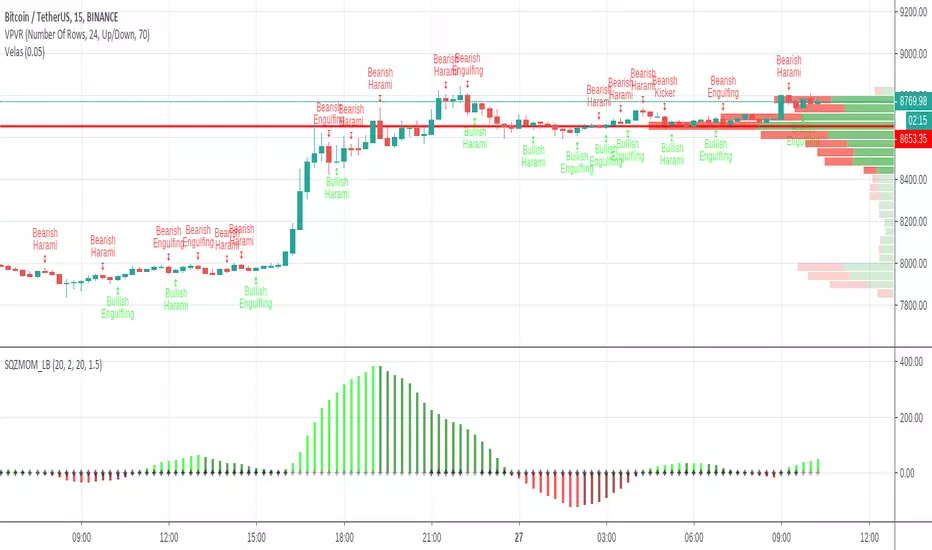
CandlestickThe default script have: Bollinger Bands , Support & Resistance, Buy & Sell Signals and Candlesticks pattern like Doji , Bearish Harami, Bullish Harami, Bearish Engulfing , Bullish Engulfing , Piercing Line, Bullish Belt, Bullish Kicker, and Bearish Kicker.
The Piercing Line, Bullish Belt, and the Kickers will usually show up better in the daily charts .
Details:
Support --> Yellow Color
Resistance --> Aqua Color
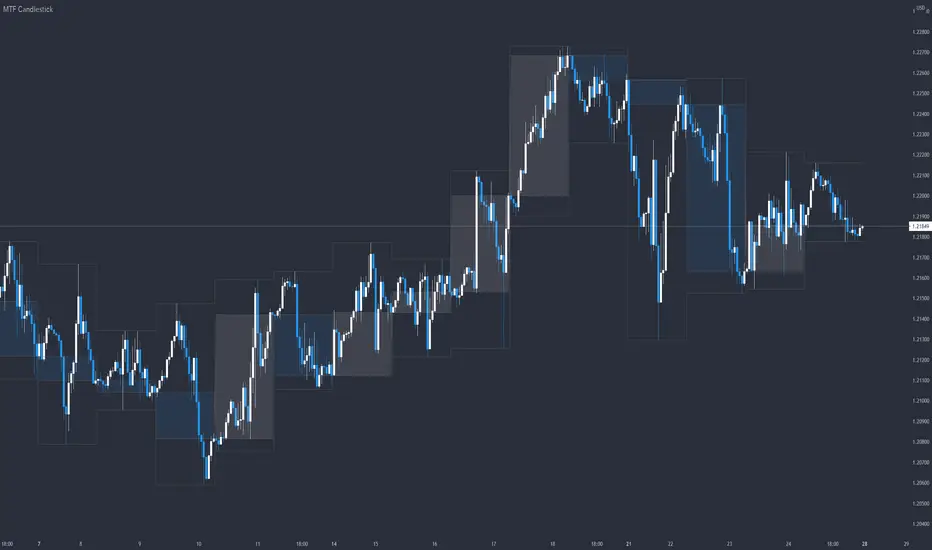
MTF CandlestickOne of the most important thing to understand in order to estimate the trend direction and its continuation is how the lower time frame candlesticks have been formed.
There are many processes by which candlesticks have been formed even if same size.
So in this script, daily candlestick is overlapped on the currently chart as default, and that can be changed.
Only real body is shown so as not to interfere with the currently chart.
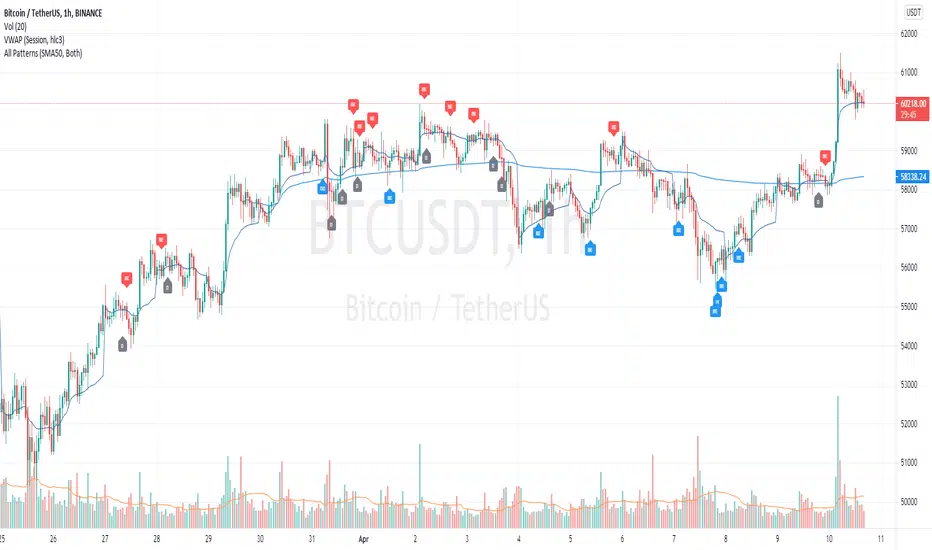
MTF VWAP + Candlestick VWAP Reactions (Bounce + Score)It’s an intraday VWAP + candlestick confluence tool that:
Draws daily, weekly, monthly, yearly VWAPs.
Detects textbook candlestick patterns, classed as BuH/BuM (bullish high/moderate) and BeH/BeM (bearish high/moderate) with colored boxes.
Triggers long/short arrows only when price bounces off a VWAP by at least 0.15% AND there’s a recent matching pattern.
Grades every signal as A / B / C with a score 1–10:
A (8–10) = high-reliability pattern (BuH/BeH) + strong 2-candle body reaction (your A+ setups).
B (5–8) = moderate pattern (BuM/BeM) + one solid bounce.
C (1–5) = weaker / mixed context (scalpy or gamble).

Open - Candlestick-ChartIt forces the Open indicator to use the candlestick open values. For example, if you need to use a Heikin-Ashi chart with the Open indicator based on regular candlestick data, this indicator will ensure it does not change.

scalping with heikin candlestick patternsThis indicator will show you when a heikin ashi candlestick pattern forms based on volume .
It contains different candlestick patterns to be able to use it in scalping.
Each pattern has a specific name to identify it
It is recommended to use it in 1 minute charts.

Heikin ashi candlestick patterns for scalping by lalocoutinoThis indicator will show you when a heikin ashi candlestick pattern forms based on volume.
It contains different candlestick patterns to be able to use it in scalping.
Each pattern has a specific name to identify it
It is recommended to use it in 1 minute charts.

scalping with candlestick patterns VJThis indicator will show you when a volume-based candlestick pattern forms.
It contains different candlestick patterns to be able to use it in scalping.
Each pattern has a specific name to identify it
It is recommended to use it in 1 minute charts.
*All Candlestick Patterns* Tiny VersionThis is just the *All Candlestick Patterns* script with tiny labels. Also an excuse to test the script publication .. but you will find this version much less annoying

Identificador de Candlestick PT-br (updated 27/05/19) -whande1Identificador de Candlestick PT-br (updated 27/05/19) -whande1
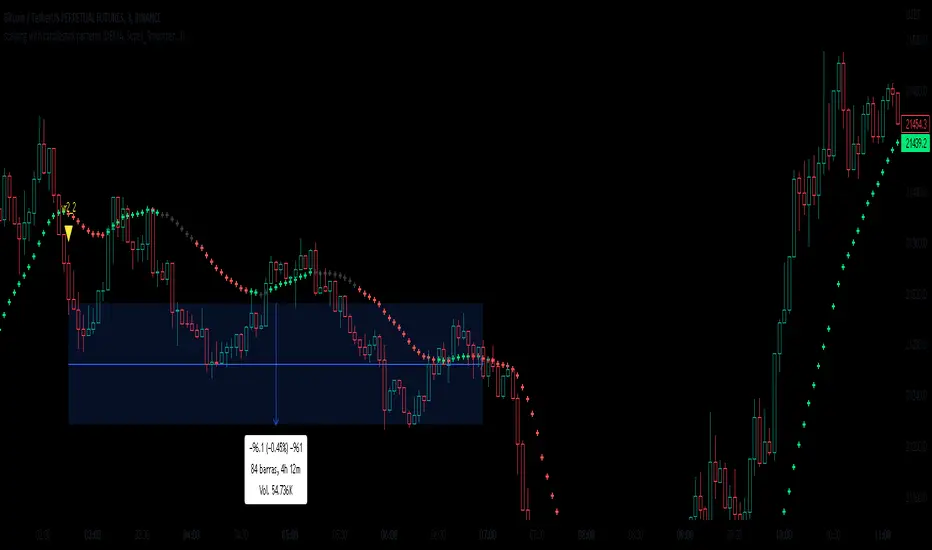
Heikin-Ashi-Candlestick-smoothedNK225M1!
Calculate average of candlestick of the past 3
Trend turnover timing is slower than "Heikin-Ashi"
Reduce the sign of "Heikin-Ashi" fake
Maintain candle shape and draw trend
-------------------------------------------------------------------------------------------------------
平均足(スムージング)
通常のローソク足の形状を維持したまま平均足のトレンドを可視化します。
過去3本のローソク足から平均足を計算します。
トレンド転換のタイミングは遅れますが通常の平均足よりもダマシが減少しています。

Reversal Candlestick Structure [LuxAlgo]The Reversal Candlestick Structure indicator detects multiple candlestick patterns occurring when trends are most likely to experience a reversal in real-time. The reversal detection method includes various settings allowing users to adjust the reversal detection algorithm more precisely.
A dashboard showing the percentage of patterns detected as reversals is also included.
🔶 USAGE
Candlestick patterns are ubiquitous to technical analysts, allowing them to detect trend continuations, reversals, and indecision.
The proposed tool effectively detects reversals by using the confluence between candlestick patterns and a reversal detection method based on the stochastic oscillator, acting as a filter for the patterns. If a candlestick pattern occurs while conditions suggest a potential reversal then the pattern is highlighted.
The displayed candle coloring allows users to observe the reversal detection method, with colored candles indicating potential reversals.
Users wanting to detect longer-term reversals can use a higher "Trend Length" setting, this can however lead to an increased amount of displayed candlestick patterns.
To prevent false positives users also have control over a "Threshold" setting in a range between (0, 100), with values closer to 100 preventing candlesticks from being detected at the start of trends.
The "Warmup Length" serves a similar purpose, and aims to prevent sudden moves to be classified as reversals. Higher values of this setting will require trends to be established for a longer period of time for reversal conditions to be detected.
🔹 Dashboard
To evaluate the role of individual candlestick patterns as potential reversal signals relative to the proposed reversal detection method, a dashboard displaying the percentage of candlestick patterns displayed (that occur when a potential reversal is detected) over the total amount detected.
Hovering on the dashboard cells of the "Reversal %" column allows displaying the total amount of patterns detected.
🔶 CANDLESTICKS PATTERNS
This tool detects 16 popular candlestick patterns, each listed in the sub-sections below.
🔹 Bullish Patterns
Hammer - A bullish reversal pattern that forms after a decline, characterized by a small body at the upper end of the trading range and a long lower shadow.
Inverted Hammer - A bullish reversal pattern that forms after a downtrend, featuring a small body at the lower end of the trading range and a long upper shadow.
Bullish Engulfing - A bullish reversal pattern where a small bearish candlestick is followed by a larger bullish candlestick that completely engulfs the previous candle.
Rising 3 - A bullish continuation pattern that consists of a long bullish candlestick followed by three smaller bearish candlesticks and then another long bullish candlestick.
3 White Soldiers - A bullish reversal pattern consisting of three consecutive long bullish candlesticks, each opening within the previous candle's body and closing higher.
Morning Star - A bullish reversal pattern made up of three candlesticks: a long bearish candlestick, followed by a short candlestick, and then a long bullish candlestick.
Bullish Harami - A bullish reversal pattern where a small bullish candlestick is completely within a previous larger bearish candlestick.
Tweezer Bottom - A bullish reversal pattern identified by an initial bullish candle, followed by a bearish candle, both having equal lows.
🔹 Bearish Patterns
Hanging Man - A bearish reversal pattern that forms after an uptrend, characterized by a small body at the upper end of the trading range and a long lower shadow.
Shooting Star - A bearish reversal pattern that forms after an uptrend, featuring a small body at the lower end of the trading range and a long upper shadow.
Bearish Engulfing - A bearish reversal pattern where a small bullish candlestick is followed by a larger bearish candlestick that completely engulfs the previous candle.
Falling 3 - A bearish continuation pattern that consists of a long bearish candlestick followed by three smaller bullish candlesticks and then another long bearish candlestick.
3 Black Crows - A bearish reversal pattern consisting of three consecutive long bearish candlesticks, each opening within the previous candle's body and closing lower.
Evening Star - A bearish reversal pattern made up of three candlesticks: a long bullish candlestick, followed by a short candlestick, and then a long bearish candlestick.
Bearish Harami - A bearish reversal pattern where a small bearish candlestick is completely within a previous larger bullish candlestick.
Tweezer Top - A bearish reversal pattern is identified by an initial bullish candle, followed by a bearish candle, both having equal highs."
🔶 SETTINGS
🔹 Patterns
Group including toggles for each of the supported candlestick patterns. Enabled toggles will allow detection of the associated candlestick pattern.
🔹 Reversal Detection
Trend Length: Determines the sensitivity of the reversal detection method to shorter-term variation, with higher values returning a detection method more sensitive to longer-term trends.
Threshold: Determines how easy it is for the reversal detection method to consider a trend at an extreme point.
Warmup Length: Warmup period in the reversal detection method, longer values will require a longer-term trend to detect potential reversals.
🔹 Style
Color Candles: Enable candle coloring on the user chart based on the reversal detection method.
Use Gradient: Use a gradient as candle coloring.
Label Size: Size of the labels displaying the detected candlesticks patterns.
🔹 Dashboard
Show Dashboard: Display the dashboard on the user chart when enabled.
Location: Dashboard location on the user chart.
Size: Size of the displayed dashboard.
