Master Candle# Master Candle Indicator
## Overview
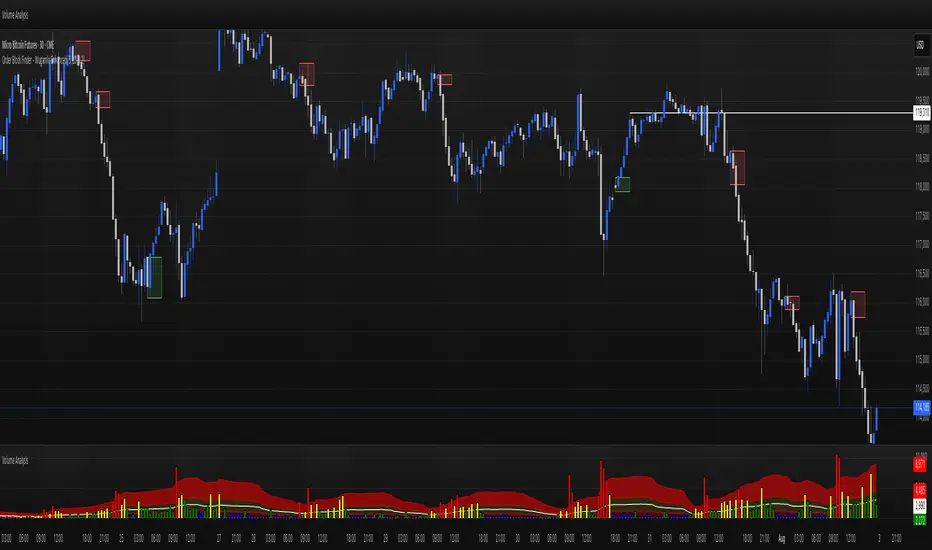
The Master Candle Indicator identifies and highlights significant price consolidation patterns where multiple candles trade within the high-low range of a single "master" candle. This technical analysis tool helps traders spot potential breakout zones and key support/resistance levels.
## What is a Master Candle?
A Master Candle is a candlestick that contains 4 or more subsequent candles completely within its high-low range. These formations often indicate:
- Market consolidation phases
- Potential breakout areas
- Strong support and resistance levels
- Areas of price compression before significant moves
## Features
✅ **Automatic Detection**: Scans historical data to identify Master Candle patterns
✅ **Visual Highlighting**: Draws colored boxes around detected Master Candles
✅ **Customizable Parameters**: Adjust minimum candles required (2-20)
✅ **Candle Counter**: Shows exact number of candles contained within each Master Candle
✅ **Performance Optimized**: Efficient lookback system with memory management
✅ **Clean Interface**: Non-intrusive visual design that doesn't clutter charts
## How to Use
1. Add the indicator to your chart
2. Adjust the "Minimum candles inside" parameter (default: 4)
3. Set the lookback period for historical scanning (default: 50)
4. Master Candles will be automatically highlighted with colored boxes
5. Use these levels as potential support/resistance zones for your trading strategy
## Settings
- **Minimum candles inside**: Set how many candles must be contained (2-20)
- **Lookback period**: How far back to scan for patterns (10-200 bars)
## Educational Purpose
This indicator is designed for educational and analysis purposes. It helps traders:
- Understand market consolidation patterns
- Identify potential breakout zones
- Recognize key support and resistance areas
- Improve market structure analysis skills
## Technical Details
- Compatible with all timeframes
- Works on any trading instrument
- Optimized for performance with automatic memory management
- Uses historical data analysis for pattern detection
## Important Notes
- This indicator is for educational and analytical purposes only
- Past patterns do not guarantee future results
- Always combine with other analysis tools
- Practice proper risk management in your trading
- Not financial advice - for educational use only
Search in scripts for "Candlestick"

CVD Absorption + Confirmation [Orderflow & Volume]This indicator detects bullish and bearish absorption setups by combining Cumulative Volume Delta (CVD) with price action, candlestick, and volume confirmations.
🔹 What is Absorption?
Absorption happens when aggressive buyers/sellers push CVD to new highs or lows, but price fails to follow through.
Bearish absorption: CVD makes a higher high, but price does not.
Bullish absorption: CVD makes a lower low, but price does not.
This often signals that limit orders are absorbing aggressive market orders, creating potential reversal points.
🔹 Confirmation Patterns
Absorption signals are only shown if they are validated by one of the following patterns:
Engulfing candle with low volume → reversal faces little resistance.
Engulfing candle with high volume → strong aggressive participation.
Pin bar with high volume → absorption visible in the wick.
CVD flattening / slope reversal → shift in aggressive order flow.
🔹 Signals
✅ Bullish absorption confirmed → Green label below the bar.
❌ Bearish absorption confirmed → Red label above the bar.
Each label represents a potential reversal setup after orderflow absorption is validated.
🔹 Alerts
Built-in alerts are included for both bullish and bearish confirmations, so you can track setups in real-time without watching the chart 24/7.
📌 How to Use:
Best applied at key levels (supply/demand, VWAP, OR, liquidity zones).
Look for confluence with your trading strategy before taking entries.
Works on all markets and timeframes where volume is reliable.

Doji Detector - ZTFNon-Lagging Doji Detector
This indicator automatically identifies and plots four types of doji candlestick patterns in real-time.
Common Doji - Small body with balanced upper and lower shadows (blue diamond)
Long-Legged Doji - Small body with very long shadows on both sides (purple square)
Dragonfly Doji - Small body with long lower shadow, minimal upper shadow (green triangle)
Four-Price Doji - All prices (OHLC) nearly equal, forming a flat line (orange cross)
Key Features:
Detects patterns as they form (non-lagging) or waits for candle close confirmation
Adjustable body size threshold (default 10% of candle range)
Tiny, unobtrusive labels positioned below bars
Works on all timeframes and instruments
Simple pattern recognition without directional bias
How it works: The indicator analyzes each candle's body size relative to its total range and shadow proportions. It uses a hierarchy system to classify each doji into its most specific type, ensuring only one label per candle.

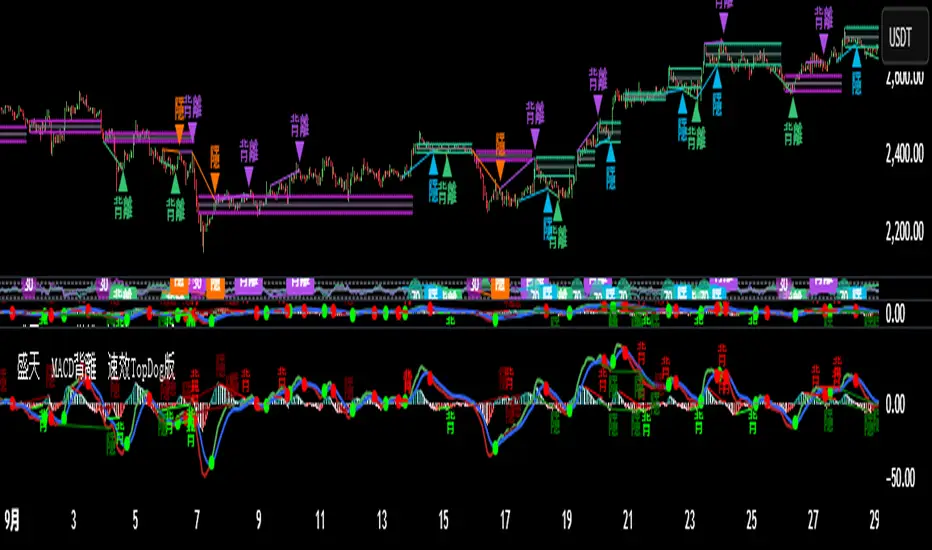
♨️盛天®MACD背離Ⓜ️速效TopDog版🕯📊功能概述
該指標整合了傳統 MACD(移動平均線收斂-發散指標)的核心功能,並新增了背離檢測、Top Dog Trading 的 MOM 和 DAD 模式、多時間框架支持以及靈活的視覺化和警報設置。
以下是其主要功能👇 :
1️⃣ MACD 核心計算MACD 線:由快速移動平均線(Fast MA)減去慢速移動平均線(Slow MA)計算得出,反映價格的短期與長期趨勢差異。
信號線:對 MACD 線進行平滑處理(通常使用 EMA 或 SMA),用於識別趨勢轉換點。
直方圖:MACD 線與信號線的差值,顯示動量的強弱和方向。
靈活性:用戶可選擇使用 EMA(指數移動平均線)或 SMA(簡單移動平均線)進行計算,並可設置快速均線、慢速均線和信號線的週期。
📊Feature Overview
This indicator integrates the core functionality of the traditional MACD (Moving Average Convergence-Divergence) indicator and adds divergence detection, Top Dog Trading's MOM and DAD modes, support for multiple time frames, and flexible visualization and alert settings.
Here are its key features:
1. MACD Core Calculation: The MACD Line is calculated by subtracting the Slow Moving Average (Slow MA) from the Fast Moving Average (Fast MA) and reflects the divergence between short-term and long-term price trends.
Signal Line: The MACD Line is smoothed (typically using an EMA or SMA) to identify trend reversals.
Histogram: The difference between the MACD Line and the Signal Line indicates the strength and direction of momentum.
Flexibility: Users can choose to use either EMA (Exponential Moving Average) or SMA (Simple Moving Average) for calculations, and can set the periods for the fast and slow moving averages, as well as the signal line.
2️⃣多時間框架支持通過 request.security 函數,允許用戶選擇不同的時間框架(例如 1 小時、日線等)來計算 MACD,適用於分析更高或更低時間框架的趨勢,無需改變圖表的當前時間框架。
2️⃣Multi-timeframe support is available through the request.security function, allowing users to select different timeframes (such as 1 hour, daily, etc.) to calculate the MACD. This is suitable for analyzing trends in higher or lower timeframes without changing the current timeframe of the chart.
3️⃣Top Dog Mode:
The Top Dog Mode is an advanced feature of the indicator that enhances the MACD's sensitivity to short-term momentum and its ability to identify long-term trends through specific moving average periods (5, 20, 30) and MOM/DAD visualization. It is particularly suitable for short-term traders, swing traders, and market participants who need fast momentum signals. Through crossover dots, MOM histograms, DAD direction alerts, and divergence detection, the Top Dog Mode provides traders with flexible signal generation tools suitable for various market environments.
The signal line period (30) is longer than the standard MACD's 9, which helps filter out short-term fluctuations and confirm long-term trends.
The Top Dog pattern is suitable for the following trading scenarios:
(🔵➤ Short-term trading scenario: In highly volatile markets (such as forex or cryptocurrencies), use the rapid crossover signals of the MOM and DAD to capture short-term price fluctuations.
Recommendation: Use this pattern on lower timeframes (such as the 5-minute or 15-minute timeframe) and set a stop-loss to control risk.
(🔵➤ Trend confirmation scenario: Use the direction of the DAD to confirm the long-term trend and combine it with the MOM histogram to determine entry points.
Recommendation: Use this pattern on higher timeframes (such as the 1-hour or 4-hour timeframe) and combine it with trendlines or moving averages.
(🔵➤ Reversal trading scenario: Combine the Top Dog pattern's divergence signals (labeled "divergence" or "hidden") to identify potential trend reversals.
Recommendation: Confirm divergence signals near key support/resistance levels to reduce the risk of false positives.
(🔵➤ Trend Continuation Scenarios: Using Hidden Divergences (labeled "Hidden") to Identify Trend Continuation Opportunities 👇
4. Divergence Detection: Regular Divergences (labeled "Divergence"): Bullish Divergence: When the price makes lower lows, but the MACD histogram or MACD line makes higher lows, it indicates weakening bearish momentum and may signal a reversal.
Bearish Divergence: When the price makes higher highs, but the MACD histogram or MACD line makes lower highs, it indicates weakening bullish momentum and may signal a reversal. 👇
Hidden Divergences (labeled "Hidden"): Hidden Bullish Divergence: When the price makes higher lows, but the MACD histogram or MACD line makes lower lows, it may signal the possibility of trend continuation.
Hidden Bearish Divergence: When the price makes lower highs, but the MACD histogram or MACD line makes lower highs, it may signal a reversal. The line has made a higher high, indicating the possibility of trend continuation👇
3️⃣Top Dog 模式:
Top Dog 模式是該指標的一個進階功能,通過特定的均線週期(5、20、30)和 MOM/DAD 的視覺化方式,增強了 MACD 對短期動量的敏感性和長期趨勢的確認能力。它特別適合短線交易者、波段交易者和需要快速動量信號的市場參與者。通過交叉圓點、MOM 直方圖、DAD 方向警報和背離檢測,Top Dog 模式為交易者提供了靈活的信號生成工具,適用於多種市場環境。
信號線週期(30)比標準 MACD 的 9 更長,有助於過濾短期波動,確認長期趨勢。
Top Dog 模式適用於以下交易場景:
(🔵➤短線交易場景:在高波動市場(如外匯或加密貨幣)中,利用 MOM 和 DAD 的快速交叉信號捕捉短期價格波動。
建議:在低時間框架(如 5 分鐘或 15 分鐘)使用,並設置止損以控制風險。
(🔵➤ 趨勢確認場景:利用 DAD 的方向確認長期趨勢,結合 MOM 直方圖判斷進場時機。
建議:在較高時間框架(如 1 小時或 4 小時)使用,結合趨勢線或移動平均線。
(🔵➤反轉交易場景:結合 Top Dog 模式的背離信號(標籤“背”或“隱”),識別潛在的趨勢反轉。
建議:在關鍵支撐/阻力位附近確認背離信號,降低假信號風險。
(🔵➤ 趨勢延續場景:利用隱藏背離(標籤“隱”)捕捉趨勢延續機會👇
4. Divergence Detection: Regular Divergence (labeled "Divergence"): Bullish Divergence: When prices make lower lows, but the MACD histogram or MACD line makes higher lows, it indicates weakening downside momentum and may signal a reversal.
Bearish Divergence: When prices make higher highs, but the MACD histogram or MACD line makes lower highs, it indicates weakening upside momentum and may signal a reversal.
4️⃣背離檢測常規背離(標籤為“背”):看漲背離:當價格創出更低低點,但 MACD 直方圖或 MACD 線創出更高低點,表明下跌動量減弱,可能預示反轉。
看跌背離:當價格創出更高高點,但 MACD 直方圖或 MACD 線創出更低高點,表明上漲動量減弱,可能預示反轉👇。
隱藏背離(標籤為“隱”):隱藏看漲背離:當價格創出更高低點,但 MACD 直方圖或 MACD 線創出更低低點,表明趨勢延續的可能。
隱藏看跌背離:當價格創出更低高點,但 MACD 直方圖或 MACD 線創出更高高點,表明趨勢延續的可能👇
5️⃣ Trend Coloring MACD Line: Based on the position of the MACD line relative to the signal line (crossing above for an uptrend, crossing below for a downtrend), you can choose whether to display the trend color (default green for uptrend, red for downtrend)👇.
5️⃣ 趨勢著色MACD 線:根據 MACD 線相對於信號線的位置(上穿為上升趨勢,下穿為下降趨勢),可選擇是否顯示趨勢顏色(默認綠色為上升,紅色為下降)👇 。
6️⃣ Crossover Dots:
When the MACD line crosses the signal line, a dot appears: Upward crossover (MACD line crosses above the signal line): a green dot.
Downward crossover (MACD line crosses below the signal line): a red dot. You can set whether to display the dot and its width.
6️⃣ 交叉圓點:
當 MACD 線與信號線交叉時,顯示圓點:上穿(MACD 線上穿信號線):綠色圓點。
下穿(MACD 線下穿信號線):紅色圓點。可設置是否顯示以及寬度👇 。
7️⃣ Display Flexibility: Users can choose whether to display the MACD line, signal line, histogram, histogram outline, MOM histogram (Top Dog pattern), crossover dots, and divergence labels.
Line widths (MACD line, signal line, histogram, dots) and color settings are adjustable.
7️⃣顯示靈活性用戶可選擇是否顯示 MACD 線、信號線、直方圖、直方圖外框、MOM 直方圖(Top Dog 模式)、交叉圓點和背離標籤。
可調整線條寬度(MACD 線、信號線、直方圖、圓點)和顏色設置👇 。
8️⃣警報功能:
MACD交叉警報:
🚨MACD 線上穿信號線(看漲信號)。
🚨MACD 線下穿信號線(看跌信號)。
🚨MACD > 0 且上穿(強看漲信號)。
🚨MACD < 0 且下穿(強看跌信號)。
背離警報:
🚨MACD 直方圖/MOM 的常規和隱藏看漲/看跌背離。
🚨MACD 線/DAD 的常規和隱藏看漲/看跌背離。
DAD 方向警報:
🚨DAD(信號線)方向改變(交叉前一根 K 線的信號線值)。
🚨DAD 向上(信號線上升)。
🚨DAD 向下(信號線下降)。
所有警報默認啟用,可通過 TradingView 的警報設置面板配置通知方式。
8️⃣Alert Features:
MACD Crossover Alerts:
🚨MACD Line crosses above Signal Line (bullish signal).
🚨MACD Line crosses below Signal Line (bearish signal).
🚨MACD > 0 and crosses upward (strong bullish signal).
🚨MACD < 0 and crosses downward (strong bearish signal).
Divergence Alerts:
🚨Regular and hidden bullish/bearish divergences of the MACD Histogram/MOM.
🚨Regular and hidden bullish/bearish divergences of the MACD Line/DAD.
DAD Direction Alerts:
🚨DAD (Signal Line) direction changes (crosses over the previous candlestick's Signal Line value).
🚨DAD up (Signal Line rising).
🚨DAD down (Signal Line falling).
All alerts are enabled by default, and notification methods can be configured through the TradingView Alerts panel.
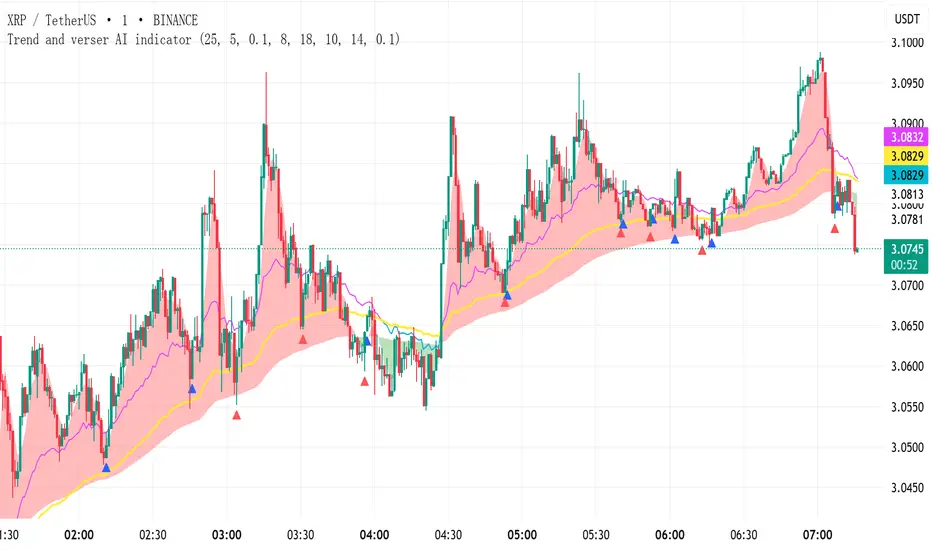
Trend and verser AI indicator V1.01Declaration: NO REPAINTING, NO LAG, NO DISPLACEMENT – SIGNALS NEVER DISAPPEAR!
Indicator Usage Guide (Simple & Effective):
(1) Red Zone + UP Arrow → Go LONG
(2) Green Zone + DOWN Arrow → Go SHORT
(3) Alternating Red/Green Zones → Consolidation Phase (NO TRADING!)
Default parameters are optimized for reliable signals but can be customized as needed.
Instructions:
(1) This indicator is suitable for any trading instrument (stocks, futures, forex, cryptocurrencies, options, etc.) and any timeframe (minutes, hours, days, weeks, months).
(2) The indicator only provides entry signals (buy/sell signals). It does not provide exit signals. Profitability depends entirely on your holding period. This indicator does not guarantee profits.
(3) Arrows come in Red and Blue, representing two different signal types. Red signals may provide more precise reversal points on the candlestick chart compared to Blue signals.
(4) The indicator plots three distinct trend lines: a Red trend line, a Green trend line, and a Yellow trend line.
(5) * When the Red trend line is ABOVE the Yellow trend line, it signifies a Bullish (uptrend) market,consider taking LONG positions based on arrow signals.
* When the Green trend line is BELOW the Yellow trend line, it signifies a Bearish (downtrend) market,consider taking SHORT positions based on arrow signals.
* When the Red and Green trend lines are ALTERNATING (crossing frequently), it signifies a Ranging (sideways/consolidation) market, arrow signals are less reliable during this phase, and trading is NOT recommended.
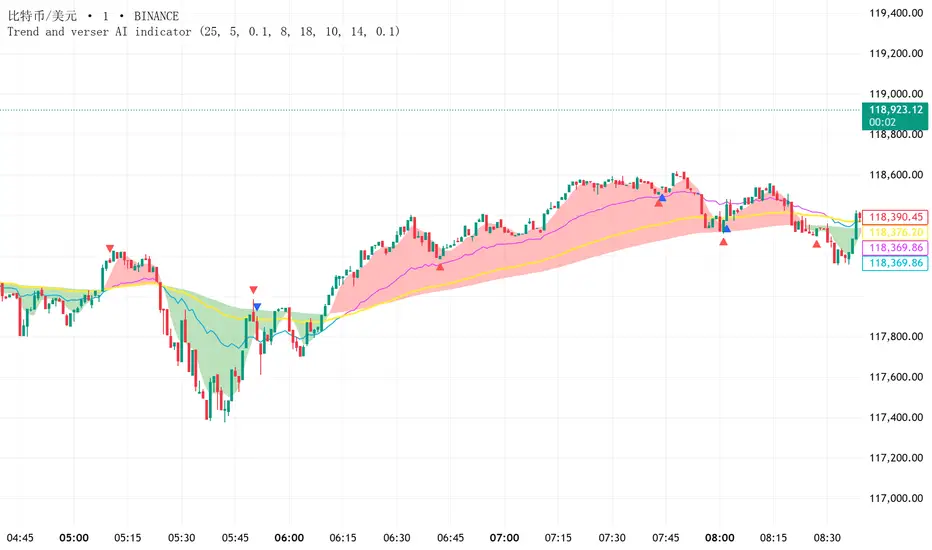
Trend and Reverse AI indicator Declaration: NO REPAINTING, NO LAG, NO DISPLACEMENT – SIGNALS NEVER DISAPPEAR!
Indicator Usage Guide (Simple & Effective):
(1) Red Zone + UP Arrow → Go LONG
(2) Green Zone + DOWN Arrow → Go SHORT
(3) Alternating Red/Green Zones → Consolidation Phase (NO TRADING!)
Default parameters are optimized for reliable signals but can be customized as needed.
Instructions:
(1) This indicator is suitable for any trading instrument (stocks, futures, forex, cryptocurrencies, options, etc.) and any timeframe (minutes, hours, days, weeks, months).
(2) The indicator only provides entry signals (buy/sell signals). It does not provide exit signals. Profitability depends entirely on your holding period. This indicator does not guarantee profits.
(3) Arrows come in Red and Blue, representing two different signal types. Red signals may provide more precise reversal points on the candlestick chart compared to Blue signals.
(4) The indicator plots three distinct trend lines: a Red trend line, a Green trend line, and a Yellow trend line.
(5) * When the Red trend line is ABOVE the Yellow trend line, it signifies a Bullish (uptrend) market,consider taking LONG positions based on arrow signals.
* When the Green trend line is BELOW the Yellow trend line, it signifies a Bearish (downtrend) market,consider taking SHORT positions based on arrow signals.
* When the Red and Green trend lines are ALTERNATING (crossing frequently), it signifies a Ranging (sideways/consolidation) market, arrow signals are less reliable during this phase, and trading is NOT recommended.
Wickless Precision IndicatorThe Wickless Precision Indicator is a powerful tool designed to identify and highlight wickless and tailless candlestick patterns on your TradingView charts. A wickless candle, where the open or close price equals the high or low, signals strong directional momentum and potential support or resistance levels. This indicator automatically detects these unique candles, drawing customizable horizontal lines at their key price levels to help traders spot critical zones for entries, exits, or reversals.
Key Features:
Automatic Wickless Detection: Identifies bullish (no lower wick) and bearish (no upper wick) candles with precision.
Dynamic Line Plotting: Draws horizontal lines at the high or low of wickless candles, extending until price interaction or user-defined conditions.
Customizable Settings: Adjust line styles, colors, and sensitivity thresholds to suit your trading style.
Visual Markers: Highlights wickless candles with distinct shapes (e.g., triangles or crosses) for easy identification.
Alert Integration: Set real-time alerts to stay notified when wickless candles form, ensuring you never miss a potential trading opportunity.
Use Cases:
Pinpoint strong support/resistance zones where price rejection is evident.
Identify high-probability entry or exit points based on momentum-driven candles.
Enhance price action strategies with clear visual cues for market sentiment shifts.
Perfect for traders seeking to capitalize on clean, wickless price movements, the Wickless Precision Indicator simplifies technical analysis and boosts trading confidence.
BarCounter_Q主要是用来计算日内5分钟级别的k线数量
"Primarily used to calculate the number of intraday 5-minute candlestick charts."

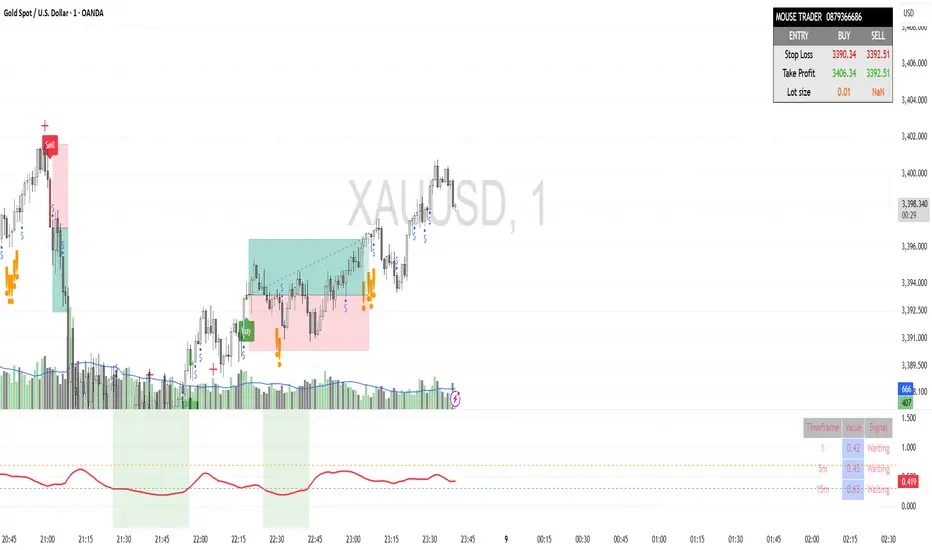
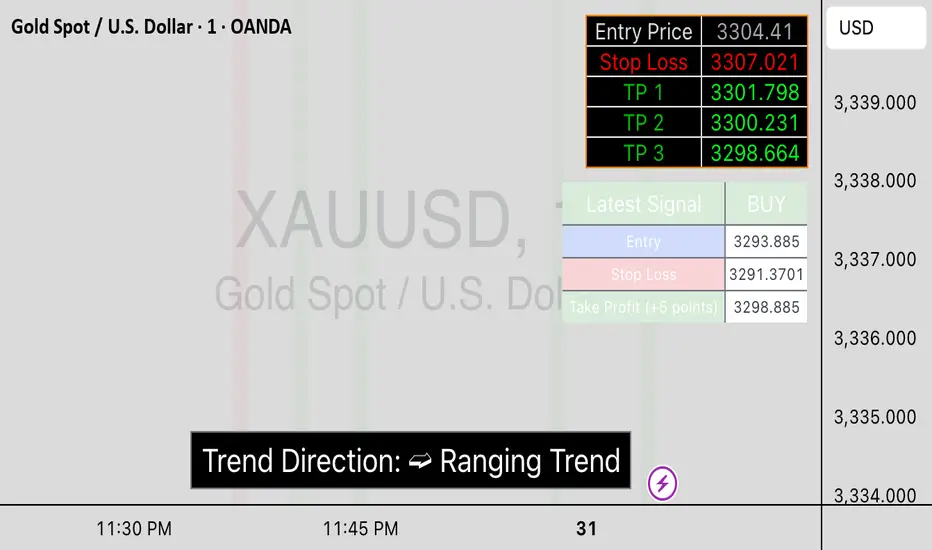
Mouse Indicator Private V2.0The "Mouse Indicator Private" is a powerful Pine Script tool designed for XAU/USD (Gold) trading on the 1-minute (M1) timeframe. It incorporates a sophisticated set of conditions to identify potential trading opportunities, focusing on specific candlestick patterns and volume dynamics, combined with advanced capital management features.
Detector Mecha Profunda M20This indicator identifies a high-probability "Deep Wick Pattern" based on candlestick structure and volume analysis, filtered by the 20-period simple moving average (SMA). A buy signal is generated when the candle has a long lower wick, closes above the previous low, shows bullish structure, and is confirmed by increasing volume — all while the price is trading above the 20 SMA. A sell signal appears under the opposite conditions: a long upper wick, bearish candle closing below the previous high, with increased volume, and price trading below the 20 SMA. This tool helps traders spot potential reversals or continuations with added confirmation from trend direction and volume.

Gelişmiş Mum Ters StratejiAdvanced Candle Reversal Strategy Overview
This TradingView PineScript indicator detects potential reversal signals in candlestick patterns, focusing on a sequence of directional candles followed by a wick-based reversal candle. Here's a step-by-step breakdown:
User Inputs:
candleCount (default: 6): Number of consecutive candles required (2–20).
wickRatio (default: 1.5): Minimum wick-to-body ratio for reversal (1.0–5.0).
Options to show background colors and an info table.
Candle Calculations:
Computes body size (|close - open|), upper wick (high - max(close, open)), and lower wick (min(close, open) - low).
Identifies bullish (close > open) or bearish (close < open) candles.
Checks for long upper wick (≥ body * wickRatio) for short signals or long lower wick for long signals.
Sequence Check:
Verifies if the last candleCount candles are all bearish (for long signal) or all bullish (for short signal), including the current candle.
Signal Conditions:
Long Signal: candleCount bearish candles + current candle has long lower wick (plotted as green upward triangle below bar with "LONG" text).
Short Signal: candleCount bullish candles + current candle has long upper wick (plotted as red downward triangle above bar with "SHORT" text).
Additional Features:
Alerts for signals with custom messages.
Optional translucent background color (green for long, red for short).
Plots tiny crosses for long wicks not triggering full signals (yellow above for upper, orange below for lower).
Info table (top-right): Displays strategy summary, candle count, and signal explanations.
Debug label: On signals, shows wick/body ratio above the bar.
The strategy aims for reversals after trends (e.g., after 6 red candles, a red candle with long lower wick signals buy). Customize via inputs; backtest for effectiveness. Not financial advice.

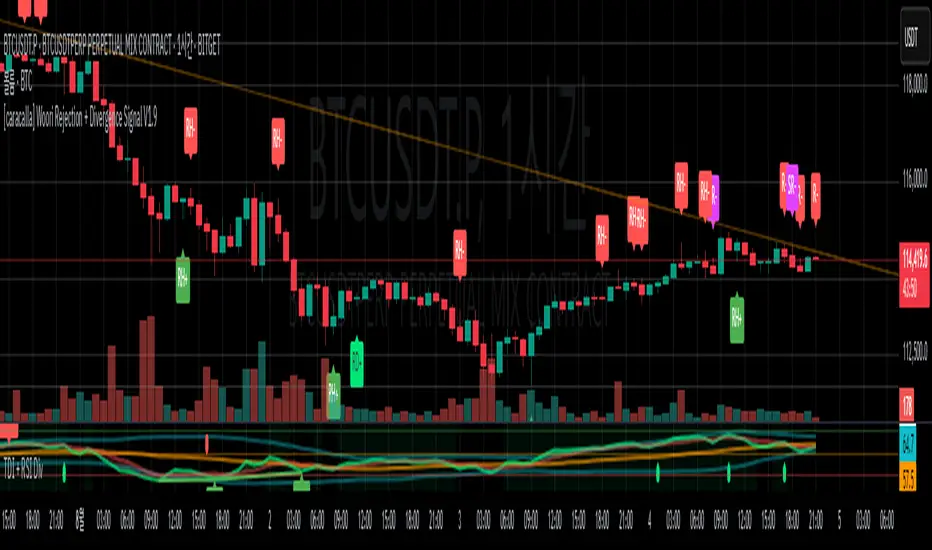
[caracalla] Woori Rejection + Divergence Signal V1.6📌 지표 개요 | Indicator Overview
KR
이 스크립트는 리젝션 패턴과 RSI 다이버전스를 활용해 매수(R+)·매도(R-) 반전 신호를 생성합니다. 특히 일반 다이버전스(RD+, RD-)를 히든 다이버전스(RH+, RH-)보다 우선 표시하며, 과매도/과매수 조건도 실전 트레이딩에 맞게 유연하게 조정되어 있습니다.
EN
This script generates buy (R+) and sell (R−) reversal signals by combining rejection candlestick patterns and RSI divergences. It prioritizes regular divergence signals (RD+/RD−) over hidden ones (RH+/RH−), with relaxed overbought/oversold RSI conditions to better suit real trading environments.
🔍 리젝션 조건 | Rejection Conditions
KR
R+: 이전 음봉 후 양봉 전환, 아래꼬리가 몸통보다 길며 RSI < 45
R-: 이전 양봉 후 음봉 전환이거나 긴 위꼬리 음봉, RSI > 50
도지 캔들은 제외되며, 꼬리 길이 비중이 중요한 요소로 작용
EN
R+: Bullish rejection after a bearish candle, long lower wick, RSI < 45
R-: Bearish rejection after bullish candle or long upper wick, RSI > 50
Doji candles are filtered out; long wick length relative to body is essential.
⚙️ 다이버전스 감지 | Divergence Detection
✅ 일반 다이버전스 | Regular Divergence (RD+/RD−)
KR
RD+: 가격 저점 하락 + RSI 저점 상승 + 리젝션
RD-: 가격 고점 상승 + RSI 고점 하락 + 리젝션
EN
RD+: Price makes lower lows, RSI makes higher lows, with rejection
RD−: Price makes higher highs, RSI makes lower highs, with rejection
✅ 히든 다이버전스 | Hidden Divergence (RH+/RH−)
KR
RH+: 가격 저점 상승 + RSI 저점 하락 + 리젝션
RH-: 가격 고점 하락 + RSI 고점 상승 + 리젝션
EN
RH+: Price makes higher lows, RSI makes lower lows, with rejection
RH−: Price makes lower highs, RSI makes higher highs, with rejection
🧠 시그널 우선순위 | Signal Priority
KR
동일한 캔들에서 일반 다이버전스와 히든 다이버전스가 동시에 발생해도, **일반 다이버전스(RD+, RD−)**가 **히든 다이버전스(RH+, RH−)**보다 우선 표시됩니다.
EN
When both regular and hidden divergence conditions are met on the same candle, regular divergence (RD+, RD−) is prioritized over hidden divergence (RH+, RH−).
🔔 알림 기능 | Alert System
KR
모든 시그널(R+, R-, RD+, RD-, RH+, RH-)에 대해 알림 설정이 포함되어 있어, 자동매매나 실시간 대응이 가능합니다.
EN
Alert conditions are included for all signals (R+, R-, RD+, RD-, RH+, RH-), enabling automation or real-time trading reactions.
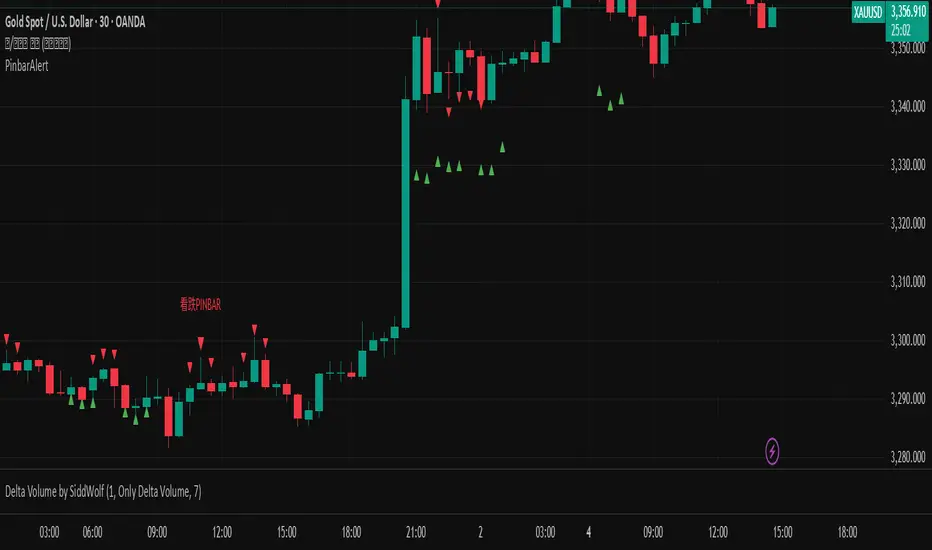
Pinbar signalA Pin Bar is a powerful candlestick pattern used in technical analysis to identify potential price reversals or continuations in the market. It is characterized by a small body located at one end of the candle and a long tail or wick on the opposite side, which indicates a strong rejection of price in that direction. A bullish Pin Bar has a long lower wick, showing that sellers pushed the price down but buyers regained control, suggesting a potential upward move. Conversely, a bearish Pin Bar has a long upper wick, indicating that buyers attempted to drive prices higher but were overpowered by sellers, hinting at a possible downward move. For high-probability setups, traders typically look for Pin Bars that form at key support or resistance levels, trendlines, or Fibonacci zones, and they often use them in combination with overall trend direction. Entry strategies include entering at the close of the Pin Bar, on a retracement, or above/below the wick with stop-losses placed beyond the wick’s extreme. When used correctly in the right context, the Pin Bar can be a highly effective signal in a trader’s toolkit.
GOXXIE H4 S/R + Volume Zones + Alerts [For GOLD Day Traders]This advanced indicator identifies key trading levels by combining:
H4 Timeframe Support/Resistance
Automatically detects swing highs/lows from the 4-hour chart
Plots them on your current timeframe (perfect for day traders)
Only shows confirmed levels (adjustable from 1-5 touches)
Volume Confirmation
Highlights high-volume zones from the H4 timeframe
Purple shading shows where institutions traded actively
Proximity Alerts
Customizable alerts when price approaches key levels (0.1%-5% distance)
Prevents missed opportunities at critical zones
Key Features:
✅ Multi-Timeframe Analysis - See H4 structure while trading lower timeframes
✅ Volume-Filtered Levels - Avoid false breaks with volume confirmation
✅ Customizable Sensitivity - Adjust touch requirements and alert distances
✅ Clean Visualization - Dashed lines (red=resistance, green=support) with subtle volume shading
Ideal For:
Day traders who need to align with higher timeframe structure
Swing traders looking for confluent support/resistance zones
Breakout/Reversal strategies with volume confirmation
Input Parameters:
Higher Timeframe (H4) - Base timeframe for level detection
Min Touches - How many times a level must be tested (1-5)
Volume Threshold - Sensitivity for high-volume zones (0.1-2.0)
Alert Distance - How close price must be to trigger alerts (0.1%-5%)
Pro Tips:
Combine with:
Trend confirmation (e.g., 200 EMA)
Candlestick patterns at key levels
Strongest signals occur when:
Price tests H4 level + volume zone simultaneously
Lower timeframe shows rejection (wick) or breakout (close beyond level)
Publishing Notes:
Categories: Strategy > Support/Resistance > Volume
Tags: support, resistance, volume, daytrading, multitimeframe
Preview Image: Show a chart with:
H4 levels on a 15m chart
Purple volume zones
Example alerts popping up
Daily Engulfing Zones Visually see engulfing candlestick pattern and capture explosive moves both up and down

Order Block Finder - yzeen ayoubCore Concept
Order blocks represent areas where large institutional traders (banks, hedge funds) have placed significant orders, creating zones of potential support or resistance. The script identifies these zones by looking for specific candlestick patterns.
How It Detects Order Blocks
Bullish Order Blocks
Formation: Starts with a single bearish candle (close < open)
Confirmation: Followed by a sequence of consecutive bullish candles
Displacement: Price must move up by a minimum percentage from the formation candle
Bearish Order Blocks
Formation: Starts with a single bullish candle (close > open)
Confirmation: Followed by a sequence of consecutive bearish candles
Displacement: Price must move down by a minimum percentage from the formation candle
Key Features
Visual Elements
Rectangles: Draw the actual order block zones using the high/low of formation candles
Equilibrium Lines: Show the middle point of each order block
Risk/Reward Lines: Display stop loss (SL), 2R, and 3R take profit levels
Color Themes: Bright or dark color schemes
Customizable Parameters
Confirmation Candles: How many consecutive candles needed (default: 5)
Display Count: Maximum order blocks to show (default: 20)
Minimum Displacement: Required percentage move after formation (default: 0.2%)
Visual Options: Toggle equilibrium lines, risk/reward levels, signature
Smart Features
Array Management: Automatically removes old order blocks to keep chart clean
Alert System: Notifies when price enters an order block zone
Performance Optimized: Uses efficient counting functions instead of complex loops
Trading Logic
The script assumes that:
Institutional Imbalance: The formation candle represents institutional order flow
Retail Response: The confirmation sequence shows retail traders responding
Future Reaction: When price returns to these zones, it may find support/resistance
Practical Use
Traders use this to:
Identify high-probability entry zones
Set stop losses below/above order blocks
Target 2R and 3R profit levels
Get alerts when price approaches these critical zones
The script essentially automates the process of finding these institutional footprints that many smart money traders look for manually.
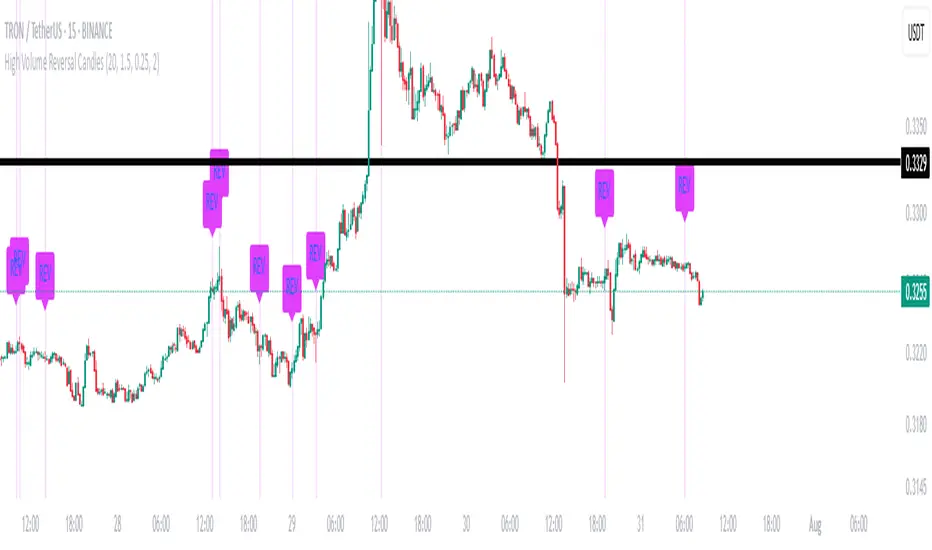
High Volume Reversal CandlesIdentifies candles which display reversal patterns (mainly hammers, inverted hammers, spinning top) on unusually high volume.
This makes the candlestick pattern more likely to fulfil.
Remember to always wait for confirmation; should only be used as an entry locator, not entry trigger.
Superdupermegadeduper signals by BrenFX🚀 Superdupermegadeduper Signals by BrenFX
Overview
The Superdupermegadeduper Signals indicator is a comprehensive trading system that combines multiple advanced technical analysis concepts to identify high-probability trading opportunities. This indicator integrates supply/demand zone analysis, dynamic trendline detection, and multi-confirmation signal generation to provide traders with precise entry, stop-loss, and take-profit levels.
🎯 Key Features
Supply & Demand Zone Detection
Intelligent Zone Identification: Automatically detects high-probability supply and demand zones based on price action and touch frequency
Customizable Zone Strength: Set minimum touches required for zone validation (2-10 touches)
Visual Zone Display: Clear visual representation with customizable colors and transparency
Zone Extension: Projects zones forward for future reference
Dynamic Trendline Analysis
Multi-Touch Trendline Detection: Identifies significant support and resistance trendlines with configurable minimum touch requirements
Automatic Trendline Drawing: Draws and extends trendlines automatically with custom colors
Deviation Tolerance: Configurable deviation percentage for trendline validation
Breakout & Retest Signals: Detects trendline breakouts and subsequent pullback retests
Advanced Signal Generation
Dual Signal Types:
Zone Reversal Signals: Based on supply/demand zone interactions
Trendline Breakout Signals: Based on trendline breaks with pullback confirmation
Multi-Confirmation System:
Volume confirmation (optional)
RSI filter integration
Candlestick pattern confirmation
Pullback verification
Professional Trade Management
Multiple Stop Loss Methods:
ATR-based dynamic stops
Zone-based stops
Fixed point stops
Automatic Level Calculation: Entry, stop-loss, and take-profit levels calculated automatically
Real-Time Trade Table: Live display of current trade levels and parameters
Customizable Table Position: Place trade information anywhere on your chart
Alert System
Comprehensive Alerts: Get notified instantly when signals are generated
Detailed Alert Messages: Include entry price, stop-loss, and take-profit levels
Frequency Control: Once-per-bar alert frequency to avoid spam
📊 How It Works
Signal Logic
Zone Analysis: The indicator scans for areas where price has repeatedly found support or resistance
Trendline Detection: Identifies significant trend lines by connecting pivot points with multiple touches
Confirmation Process: Multiple filters ensure signal quality:
Price action confirmation (multiple bullish/bearish candles)
Volume above average (optional)
RSI oversold/overbought conditions (optional)
Entry Timing: Signals are generated when all confirmations align
Buy Signals Generated When:
Price reaches a demand zone with bullish reversal confirmation, OR
Price breaks above resistance trendline and retests successfully
Sell Signals Generated When:
Price reaches a supply zone with bearish reversal confirmation, OR
Price breaks below support trendline and retests successfully
⚙️ Configuration Options
Supply/Demand Settings
Zone Strength: Minimum touches required (2-10)
Lookback Period: Historical bars to analyze (10-100)
Zone Extension: Forward projection length (1-20 bars)
Trendline Settings
Lookback Period: Historical analysis range (20-200 bars)
Minimum Touches: Required pivot connections (2-5)
Deviation Tolerance: Allowable price variance (0.01-1.0%)
Signal Filters
Reversal Confirmation: Required confirmation candles (1-5)
Pullback Confirmation: Retest validation period (1-5)
Volume Filter: Above-average volume requirement
RSI Filter: Overbought/oversold confirmation
Trade Management
Stop Loss Methods: ATR, Zone-based, or Fixed points
ATR Multiplier: Risk adjustment (0.5-5.0x)
Take Profit: Fixed point target (1.0-50.0 points)
📈 Best Practices
Recommended Settings
For Scalping: Lower zone strength (2-3), shorter lookback periods
For Swing Trading: Higher zone strength (4-6), longer lookback periods
For Trend Following: Enable trendline signals, use ATR-based stops
Risk Management
Always use the provided stop-loss levels
Consider position sizing based on stop-loss distance
Monitor the trade table for real-time level updates
Use alerts to avoid missing opportunities
🎨 Visual Elements
Supply Zones: Red semi-transparent rectangles
Demand Zones: Green semi-transparent rectangles
Resistance Lines: Red trendlines
Support Lines: Green trendlines
Buy Signals: Green "BUY" labels below bars
Sell Signals: Red "SELL" labels above bars
Trade Table: Comprehensive trade information display
💡 Tips for Success
Combine with Market Structure: Use on clean trends and at key support/resistance levels
Multiple Timeframe Analysis: Confirm signals on higher timeframes
Volume Confirmation: Enable volume filter for higher quality signals
Risk Management: Never risk more than 1-2% per trade
Backtesting: Test settings on historical data before live trading
⚠️ Important Notes
This indicator works best in trending markets
Signals are more reliable when multiple confirmations align
Always consider fundamental analysis and market conditions
Past performance does not guarantee future results
Practice proper risk management at all times
🔧 Technical Specifications
Pine Script Version: 6
Overlay: Yes
Max Objects: 500 boxes, 500 lines
Performance: Optimized for real-time analysis
Compatibility: Works on all timeframes and instruments
Developed by BrenFX | Advanced Trading Signals for Professional Traders
Remember: Trading involves risk. This indicator is a tool to assist in analysis and should not be the sole basis for trading decisions. Always use proper risk management and consider your financial situation before trading.
Conservative High Low Identifier by AgungIndicator to identify high and low on candlestick chart.
This indicator use concept of every movement of high and low, there is small movement of high and low too. This movement can be identified by variance of bullish and bearish candle.
How to use this indicator?
Set number of bar that wanna be analyzed by this indicator on setting then there will be high and low label on your chart for identify high and low

Rapid HTF Price Action DashboardRapid HTF Price Action Dashboard V2.0
Overview
Stop the constant switching between timeframes. The Rapid HTF Price Action Dashboard is an all-in-one analysis suite designed to give you a crystal-clear view of the market's true intent by projecting critical higher-timeframe (HTF) data directly onto your trading chart.
This tool is more than just a pattern indicator; it's a complete dashboard that provides institutional-grade insights into price action. It helps you anticipate market moves by showing you where liquidity lies and how the bigger players are positioning themselves, all from the comfort of your lower-timeframe chart.
Key Features
Multi-Timeframe Dashboard: A clean, intuitive panel on the right of your chart displays the last two closed higher-timeframe candles (Candle A & B) and the live, developing one (Candle C).
Projected HTF Levels: Automatically draws and projects the previous HTF candle's high and low across your chart, acting as critical dynamic support and resistance levels.
Advanced Pattern Recognition: Identifies seven high-conviction candlestick patterns based on our proprietary filtering system, designed to eliminate noise and pinpoint only the most potent signals.
The Logic: Why Our Signals Are More Accurate
This indicator goes far beyond textbook definitions. We don't just look for shapes; we look for the story behind the price action. Each pattern is filtered through a rigorous set of conditions to ensure it represents true market conviction.
Hammers & Inverted Hammers: The Liquidity Grab
Classic Hammer/IH patterns are often misleading. Ours are different. We identify them as true liquidity grab signals, a core concept used in ICT (Inner Circle Trader) methodologies.
A Hammer (H) is only valid if its low wick has pierced below the low of the previous candle (low < low ). This signifies a "stop hunt" where liquidity was absorbed below a key level before buyers aggressively pushed the price up.
An Inverted Hammer (IH) is only valid if its high wick has pierced above the high of the previous candle (high > high ). This shows liquidity was taken above a prior high before sellers took control and suppressed the price.
Harami: Filtering for Conviction
A classic Harami (an inside bar) can often just be a weak doji, signaling indecision. We filter this noise out.
Our Harami signal (BeH, BuH) requires the inside candle to have a meaningful body (defaulting to 30% of its own range, but fully customizable).
Furthermore, we have enhanced the logic to ensure the body of the inside candle is strictly contained within the body of the previous candle, making it a more precise and reliable signal of consolidation before a potential expansion.
Power Engulfing: A Signal of Overwhelming Force
We don't flag just any engulfing candle. We look for true displacement and momentum.
Our Power Engulfing pattern (BE, BuE) requires the body of the current candle to completely engulf the body of the previous candle.
Crucially, it must also close decisively beyond the entire range (including the wick) of the previous candle. A Bullish Engulfing must close above the previous high, and a Bearish Engulfing must close below the previous low. This confirms overwhelming force has entered the market and a reversal is highly probable.
How to Use the Dashboard
Set Your Reference Timeframe (refTF): Choose the higher timeframe you want to analyze (e.g., "240" for 4-Hour).
Identify the Narrative: Use the projected High/Low lines as your key support and resistance zones. A primary strategy is to wait for price to interact with these levels.
Anticipate the Draw on Liquidity: Watch as price approaches the previous HTF high or low. The dashboard helps you predict the market's next move. For example, if price is trading below the previous HTF low, you can anticipate a potential sweep of that level.
Confirm with a Signal: When a signal like a Hammer (H) appears on the dashboard after sweeping the previous low, it provides high-conviction confirmation that liquidity has been taken and price is ready to reverse.

Closed Market / Back-Test Filter x 'Bull_Trap_9'Hello TradingView Traders!
This is a very valuable tool that I believe all traders will find useful.
This indicator / filter is '1 of 2'. I prefer it as a filter because it is not meant for live trade analysis. It is designed to make a trader aware of their individual trade sessions and to help aid in static chart candlestick back-testing.
Also, look for my indicator / filter, '2 of 2': 'Red Report Filter'
There are two functions to this filter.
Primary use: It allows a trader to set a session window: Open / Close.
During a trade session, like YM, I only trade 9:30 - 15:00. Without the filter, many times I have traded past my cutoff because I was focused on the chart and not the time.
With this filter on as close nears with an open trade and the filter starts to apply, I know I am at session close with no more trades upon exit. Otherwise, I know the session is done with no further trades.
It is also nice to have the filter on during the session open as a demarcation boundary.
Secondary use: It is used as a chart back-test tool.
When applied to a traders back-test chart, the trader can control their trade session envelopes for easier and more precise evaluation. The filter will allow only the candles per session that the trader wants to focus on and will filter all other non-session candles.
I can easily compare a whole week of 30m session data, concentrating solely on the filtered trade windows.
Please Note: The filter will be active as far back as the historic data prints.
Thanks for viewing!

Rapid Candle PATTERNSIndicator Title: Rapid Candle Patterns - High-Probability Signals
Description
Tired of noisy charts filled with weak and ambiguous candlestick patterns? The Rapid Candle Patterns indicator is engineered to solve this problem by moving beyond simple textbook definitions. It identifies only high-probability reversal and continuation signals by focusing on the underlying market dynamics: momentum, liquidity, and confirmation.
This is not just another pattern indicator; it's a professional-grade tool designed to help you spot truly significant price action events.
How The Logic Works & Why It's More Accurate
Each pattern in this script has been enhanced with stricter, more intelligent rules to filter out noise and reduce false signals. Here’s what makes our logic superior:
1. The Liquidity Grab Hammer & Inverted Hammer
Standard Logic: A simple hammer shows a long lower wick, suggesting buyers pushed the price back up.
Our Enhanced Logic: We don't just look for a hammer shape. Our signal is only valid if the hammer’s low takes out the low of the previous candle (a "liquidity grab" or "stop hunt").
Why It's More Accurate: This sequence is incredibly powerful. It shows that sellers attempted to push the market lower, triggered stop-loss orders below the prior low, and then were decisively overpowered by buyers who reversed the price. This isn't just a reversal; it's a failed breakdown, often trapping sellers and fueling a stronger move in the opposite direction.
2. The "True" Bullish & Bearish Harami
Standard Logic: A small candle forms within the high-low range of the previous candle. This can often be misleading if the prior candle has long wicks and a tiny body.
Our Enhanced Logic: We enforce a "dual containment" rule. For a Harami to be valid, its body must be contained within the body of the previous candle. We also ensure the Harami candle itself is not a Doji, meaning it must show some conviction.
Why It's More Accurate: This ensures you are seeing a genuine and significant contraction in momentum. It filters out scenarios where a large-bodied candle forms inside the wicks of a doji-like candle, which is not a true Harami. Our logic captures the "pregnant" pattern as it was intended—a moment of quiet consolidation before a potential new move.
3. The "Power" Bullish & Bearish Engulfing
Standard Logic: A candle's body engulfs the body of the previous candle. This is a common signal, but it often lacks follow-through.
Our Enhanced Logic: Our "Power Engulfing" requires two conditions: (1) The body must engulf the prior candle's body, AND (2) the candle must close beyond the entire high/low range of the prior candle.
Why It's More Accurate: This is the ultimate sign of confirmation. It doesn't just show that one side has won the battle for the session; it proves they had enough force to break the entire structure of the previous candle. This signifies immense momentum and dramatically increases the probability that the trend will continue in the direction of the engulfing candle.
4. The Quantified Doji
Our Logic: Instead of being a subjective pattern, a Doji is defined quantitatively. It's a candle whose body is less than or equal to a user-defined percentage (default 9%) of its total range.
Why It's More Accurate: It provides a consistent and objective measure of market indecision. Furthermore, any candle identified as a Doji is automatically disqualified from being a Hammer, ensuring clear and distinct signals.
User Customization
Toggle Patterns On/Off: Declutter your chart by only showing the patterns you want to see.
Fine-Tune Logic: Use the "Pattern Logic" settings to adjust the sensitivity of the Doji and Harami detectors to perfectly match your trading style, asset, and timeframe.
Disclaimer: This indicator is a powerful tool for identifying high-probability price action. However, no single indicator is a complete trading system. Always use these signals as part of a comprehensive strategy, combined with analysis of market structure, support/resistance levels, and other forms of confluence.

Volume Engulfing DetectorThis indicator is built to detect powerful shifts in market participation by analyzing volume surges during directional candles — not traditional "engulfing" patterns based on candle body structure, but volume-driven dominance by buyers or sellers.
Instead of relying on the classic visual engulfing pattern, it flags situations where a bullish or bearish candle prints with significantly higher volume than its predecessor, and where that volume also surpasses key benchmarks from previous opposing moves.
This approach is designed to capture institutional activity, smart money footprints, or hidden accumulation/distribution, which often manifest as volume spikes even in the absence of textbook candlestick formations.
🚦 Key Features
✅ 1. Volume-Based Engulfing Detection
The script identifies candles where:
A bullish candle's volume exceeds the previous candle’s total volume and the previous candle was bearish (and vice versa for bearish engulfing).
Additionally, the bullish engulfing volume must also be greater than the volume of the last bearish engulfing (and vice versa).
This helps filter out false engulfing signals and only highlights the ones with significant participation or conviction.
🔷 Plotted with: Vol↑Eng (Green label below candle)
🔻 Plotted with: Vol↓Eng (Red label above candle)
✅ 2. High-Volume Rejection Markers (Non-Engulfing)
Sometimes a candle doesn’t engulf the previous one, but the volume is so dominant that it may still indicate a powerful reversal or failed breakout. This indicator flags those too:
If a bullish candle has volume higher than any bearish engulfing volume seen today, it’s marked as a potential buy-side absorption.
If a bearish candle has volume higher than any bullish engulfing volume today, it may be a sign of sell-side rejection.
🟢 Plotted with: Vol↑Big (Lime triangle up)
🔴 Plotted with: Vol↓Big (Maroon triangle down)
⏰ Daily Reset & Filtering
All volume comparisons are done within the current trading day, so each day's context is treated independently.
The first candle of the day is ignored, preventing skewed signals due to overnight gaps or opening volatility.
🔔 Alerts Included
You can set alerts on:
Bullish or bearish volume-engulfing candles.
High-volume rejection candles.
This ensures you’re notified in real time when the market shows signs of strong accumulation or distribution, even if you're not actively monitoring the chart.
💡 Use Cases
Day Traders: Identify potential intraday reversals or trend initiations with volume confirmation.
Swing Traders: Use engulfing and high-volume patterns to time entries after pullbacks or breakouts.
Volume Analysts: Study how price responds when volume exceeds critical historical thresholds.
Tape Readers: Get a visual clue of where smart money might be stepping in based on volume surges.
📌 Final Thoughts
This indicator filters out noise and focuses on volume-dominant price actions, giving you a cleaner and more actionable view of the market. Use it to complement your existing strategy, particularly when looking for high-conviction turning points on the chart.
Whether you're trading equities, indices, or futures — this tool brings volume context to price action in a simple and visual way.
