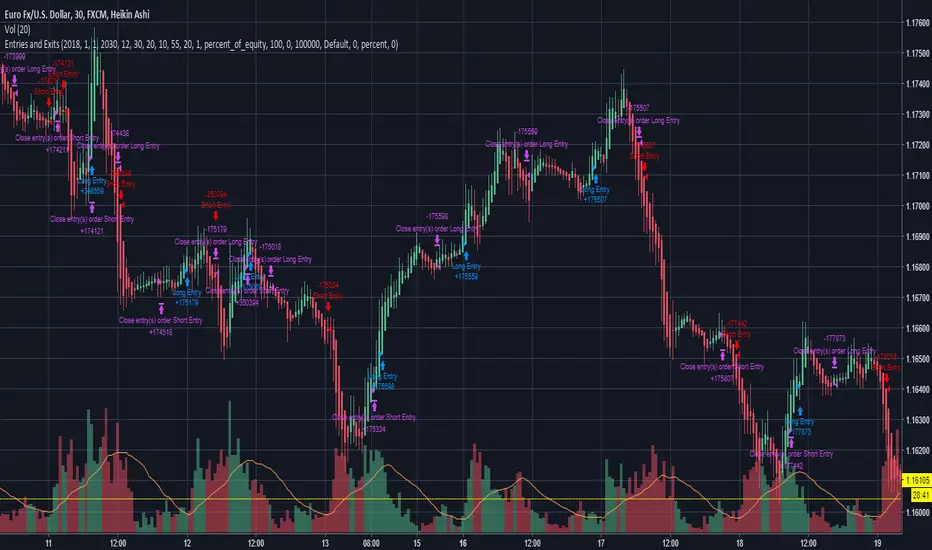
MBY_Trade1HBITFINEX:ETHUSD
Hi.
This is MBY_LAB.
This indicator is a paid indicator.
The color of the moving average reflects MACD.
The signal line in the middle of the screen is the Ichimoku baseline.
And you can also trade through the Bollinger Band at the same time, and you can turn it off when you need it.
You can see the Fibonacci resistance line and supporting line at a glance.
We have set the background color to distinguish between bearish and burlish.
Please use strategy test in 1 hour time frame.
Please give me a message.
Search in scripts for "Candlestick"

Wyckoff Trend Tracking Trade SystemWyckoff Trend Tracking Trading System威科夫趋势跟踪交易指标工具为非结构化的市场增添了结构,它有一套明确一致的交易规则,让您专注于具有最高回报和最低风险的交易机会,无论您是刚刚开始从事交易还是经验丰富的交易员,它对您来说绝对是一种竞争优势。

Failure Swing Strategy (stop hunting) V1 (Made on XBT/USD 4h Bitmex)
This strategy is a first attempt to countertrade the false break of a key support/resistance.
If a candle breaks the level, but it comes back before close, it will trigger an order.
The Stop Loss is in %, the Take Profit is near the EMA.
There is a "volatility filter" to block orders when the price is near the EMA and a coefficient to adjust a little the Stop Loss and Take Profit according to the chart condition.

Matt's MACD Algo v1This script is meant to be viewed with the Heiken Ashi candlestick chart. I use it for pretty much everything. It has a lot of extra stuff just for visual reference, but the trades are based on the MACD (3,5,9) indicator. I found that speeding up the intervals of the MACD makes for a much more reactive chart. In this heavily volatile market, it has been performing well. If the market is not very volatile, it tends to have too many noisy signals. Any help or criticism would be greatly appreciated.

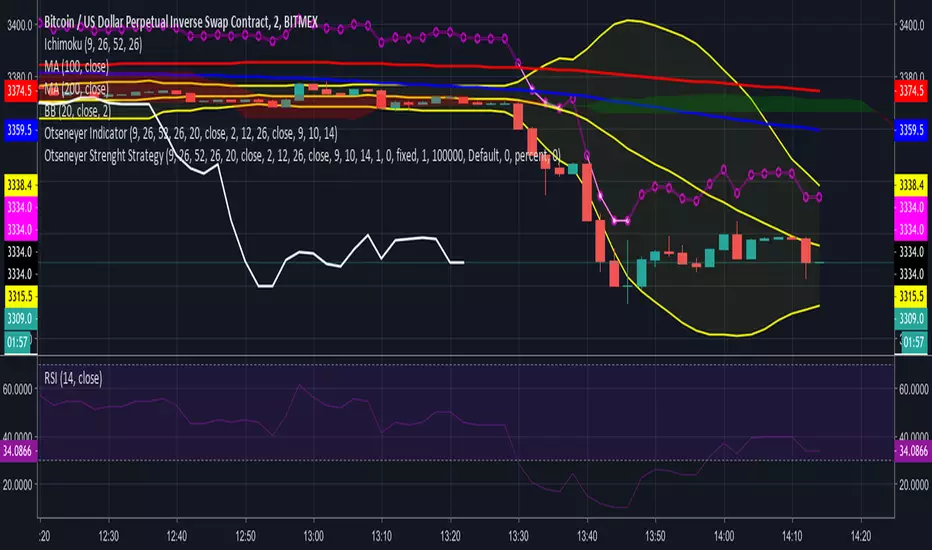
Otseneyer Strenght StrategyThis strategy shows if the market is strong or weak, marking short or long respectively, however this does not represent a direct entry, only a strength or weakness, which applied with some other parameters (candlestick patterns, resistances, etc) can throw us a very good entry, especially in the appropriate temporality, where there is a balance between volatility and the persistence of micro-tendencies.

Dane - MA StrategyThis strategy has been developed as a development service. It is published for customer acceptance and verification. As such, I am unable to provide access to anyone other than the paying customer. Sorry about that.
For those interested in development services, please check out the backtest-rookies (.com) website.
MA Strategy
A Moving average crossover strategy using Heikin-ashi candles for confirmation. The strategy makes trading decisions based on Heikin-ashi data but trades on real candlestick charts to avoid incorrect backtest results.
The strategy includes optional plotting of HK candles on an overlay to help with strategy verification.

Bitmex Bot 5m candlesThis script was made for our customers to test the strategies of our Bitmex Bot.
I'm not going to give you permission to use the Script, only if you become our client.
Telegram @rmgslash
Coinsolos Wonderfull Strategy 1h ChartSet your chart 1h resolution and follow the signs. 94% profitable trade for 275 trades between 01.01.2018 and 11.09.2018

LevelTradeV2. Indicator give to us min. and max. levels This indicator is designed to work on short-term and long-term periods.
It provides levels of resistance and support for the two options.
1) purple levels - minimum and maximum price for the shadows of candles.
2) red and green levels - over the body of a candle.
added a moving average and a profit calculator fully customizable.

Kozlod - Heikin-Ashi Bar Color Change StrategyYou can use this script to backtest Heikin-Ashi bar color change strategy.
You have to apply this script to usual candles and not Heikin-Ashi!!!
Background color indicates HA bar color. On change you'll see green/red arrows and alert will be fired.
Also you can find in the code calculations of all HA OHLC values.

Solstice (Strategy)Solstice:
This script readjusts according to the timeframe and candlestick pattern.
Its optimum timeframe is above 2hr .
(But can also be used on any timeframe or cancel stick pattern)
I decided to present the HA pattern, as it gives greater clarity to how to bot trades.
Bitmex is the best platform to trade on, as with using half limit orders, you can bring your fees down to +-0.05%.
I used Gold -0.88% as the example, to show how you can trade this strategy manually.
Syntax can be supplied.
Contact me for a (Trial Period) Access
Happy Money Printing

quit your bullshit! Heikin-Ashi Backtest with Real Candle ValuesMade in a few minutes to debunk all the bullshit going around tradingview and everywhere about "heikin-ashi" being a holy grail trend indicator.
Do not be deceived.
Heikin-Ashi is a beautiful way to remove much of the noise in markets, and is light on the eyes. (nice and smooth!)
I personally use heikin-ashi as a way to remove a lot of the clutter in the markets, allowing me to trade with less emotion.
While heikin-ashi is a great way to visualize trends, it is NOT a good trend indicator because its displayed values do not align with actual trading values.
Therefore, entry and exit points for many of the ideas published about heikin-ashi for trade are inaccurate.
::: When Heikin-Ashi changes colour for x candles, a new trade is created on the open of the following real candle.
In practice, Heikin-Ashi is much closer to break even.
As tested, Heikin-Ashi trend trading works better on pairs that have clearer definitions of trends and are less often in consolidation. (ex. USDJPY)
Usage:
Switch to normal candlestick chart.
Features:
Change the period for new trades. (For example: x amount of red candles after a green candle to signify short trade)

Pearl (Strategy)Pearl:
This script readjusts according to the timeframe and candlestick pattern.
Its optimum is the: 1min Renko (Traditional,4)
I decided to present the HA pattern, as it gives greater clarity to how to bot trades.
Bitmex is the best platform to trade on, as with using half limit orders, you can bring your fees down to +-0.05%.
Syntax can be supplied.
Results are of 6 days backtesting.
Happy Money Printing
Regards
Jack

Entries and Exits (plus alerts)Simple breakout strategy that can be used for most equities, FOREX and cryptocurrencies. Inputs can be customized to suit your trading style and can be applied to any time frame chart. Comes with matching alert indicator which is useful for autotrading or just simply never missing a trade for manual trading. Please message me for access. Happy trading!
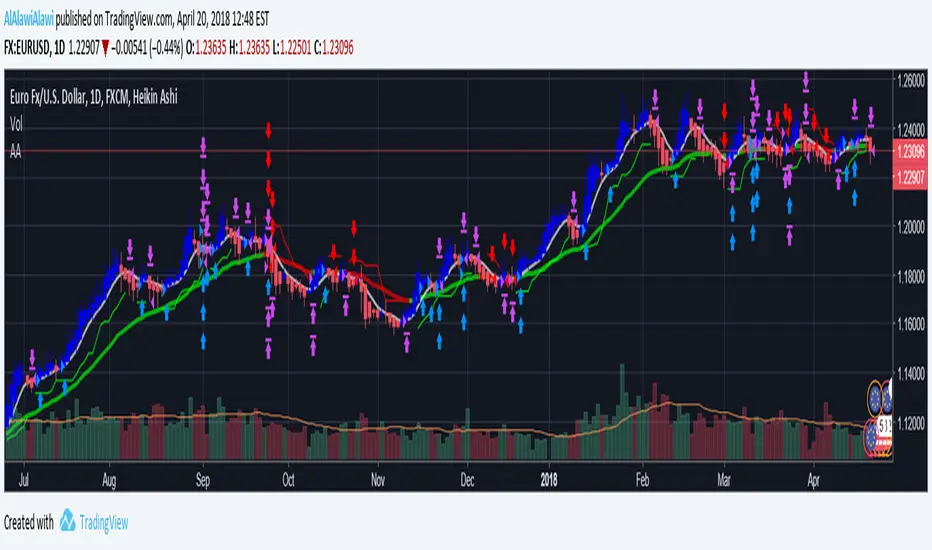
AlAlawi StrategyHello Experts / Trolls;
I had written this strategy for a while and although I know how to color my charts, I wish for some expert advice or just some trolls to bring light to the codes weakness area's.
Period = isdwm?timestamp(2012, 01, 01, 00, 00):isintraday?timestamp(2018, 04, 01, 00, 00):timestamp(2018, 04, 01, 00, 00)
The above line of code for example lets my 4H and 1H charts suffer from a small size of testing and I need to change the dates manually, any idea to let a more dynamic approach and accomodate a 1 minute to 4h charts solution without having to play with the dates manually every time.
I also see a huge difference in results when applying this script on a Heikin-Ashi vs Candlestick chart!
So when pyramiding (upto 15) is applied on this strategy, the numbers starts boosting like crazy too!
This is a rough code for now, let me know where to work on the code or just like and share your opinion on this.
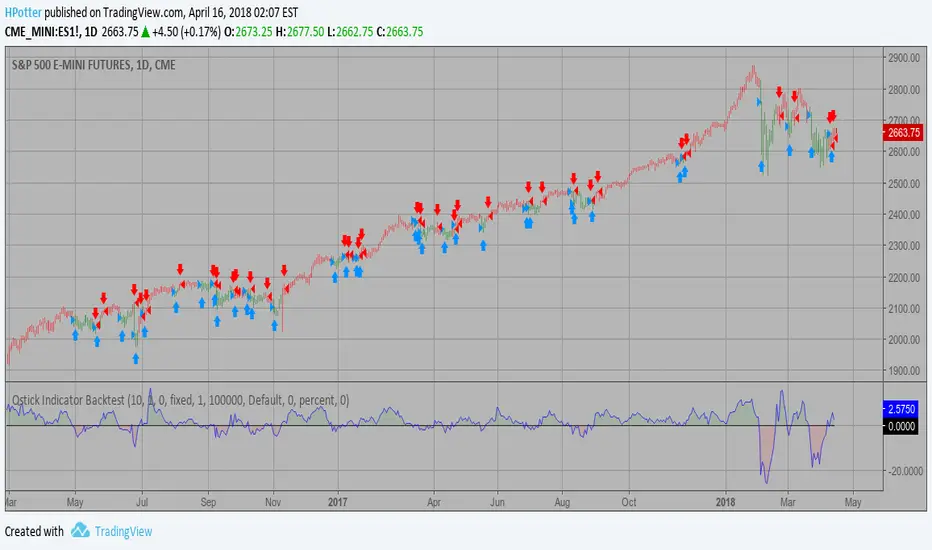
Qstick Indicator Backtest A technical indicator developed by Tushar Chande to numerically identify
trends in candlestick charting. It is calculated by taking an 'n' period
moving average of the difference between the open and closing prices. A
Qstick value greater than zero means that the majority of the last 'n' days
have been up, indicating that buying pressure has been increasing.
Transaction signals come from when the Qstick indicator crosses through the
zero line. Crossing above zero is used as the entry signal because it is indicating
that buying pressure is increasing, while sell signals come from the indicator
crossing down through zero. In addition, an 'n' period moving average of the Qstick
values can be drawn to act as a signal line. Transaction signals are then generated
when the Qstick value crosses through the trigger line.
You can change long to short in the Input Settings
WARNING:
- For purpose educate only
- This script to change bars colors.
Cypher Core Trading Suite
Reband lol
- RSI overlay indicators (diamond shapes)
- Most commonly used MA types( i.e. SMA, EMA, WMA, VWMA, ZEMA )
- Bands
- Price Action Indicator (color coordinated)
color code:
yellow --- inside bars (breakout)
blue --- outside bars (breakout)
green --- up pin bars (reversal)
red --- down pin bars (reversal)
fuchsia --- down shaved bars (selling pressure, selling likely to continue)
aqua --- up shaved bars (buying pressure, buying likely to continue)
- Reversal candlestick patterns (only a few for now)
- Two strategies for determining buy/sell signals
1. buy/sell signals determined by EMAs crossover (better for position or swing trades)
2. buy/sell signals determined by MAs crossover (better for scalping)

SD_Bull_Bear_Engulfing_Rsi_SdThis strategy combines the idea of a bullish or bearish candle engulfing coupled with standard deviation (a 100% increase or a 50% decrease). The exit condition is placed if the percentage increase is achieved or 35<rsi<65.
The strategy requires refinement so please test the script and let know what can be incorporated to improve the efficiency.

Gunbot BB StepGain TunerSimulation of Gunbot BB Stepgain strategy useful for fine tuning settings and backtesting.
In Pine Editor -> Open "Gunbot BB Stepgain" -> Add To Chart -> On Indicator -> Format -> Input your desired settings to test.
Red = Stepgain Sell Level
Green = BB Buy Level
NOTICE: By requesting access to this script you acknowledge that you have read and understood that this is for research purposes only and I am not responsible for any financial losses you may incur by using this script!
AP_PatternsSysCreator: Andrew Palladino
Date: 10/22/2017
Strategy Name: Pattern Classifier System.
Description:
The strategy automatically classifies common price patterns using price fractals an trades them with an ATR based risk management strategy.
The following patterns are currently supported:
Symmetrical Triangle Breakout Long or Short
Ascending Triangle Long
Descending Triangle Short
Ascending Wedge Short
Descending Wedge Long
Future releases will include:
Rectangle Breakouts Long and Short
Head and Shoulders Patterns
The user has the ability to turn on or off any combinations of the individual patterns above.

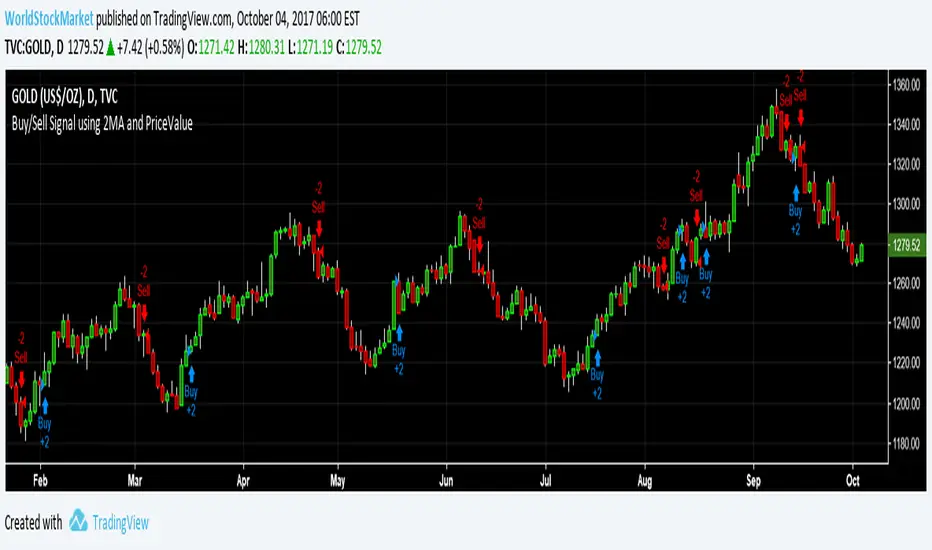
Buy/Sell Signal using 2MA and PriceValueThis strategy is based on the value of two SMA. One based on close and other on open. It is NOT based on crossover but based on using one SMA at one time. For example, the value of GOLD and two SMA's, i.e., SMA(close,length1) for buying and SMA(open,length2) for selling.
Feel free to use. Its open for all, but the source code is hidden, so that i could make further changes and improvements without any problems.