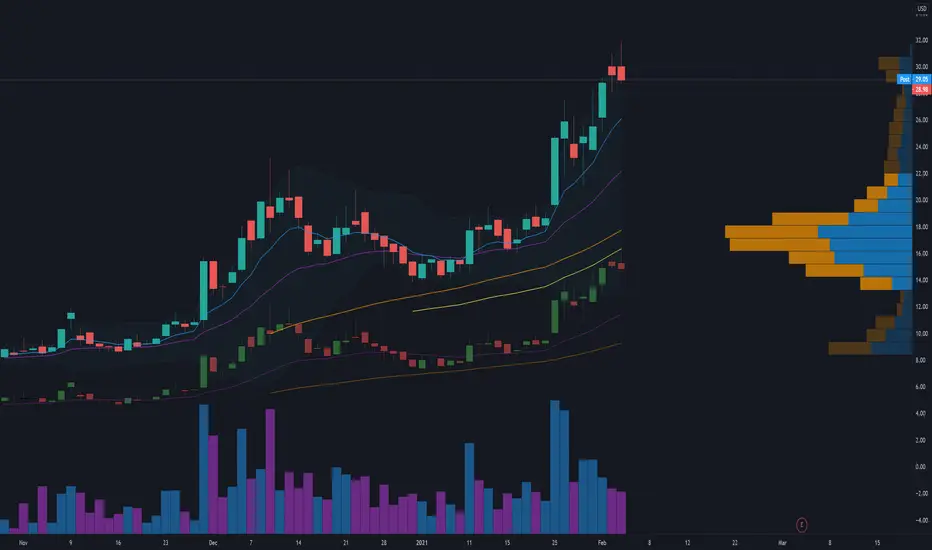
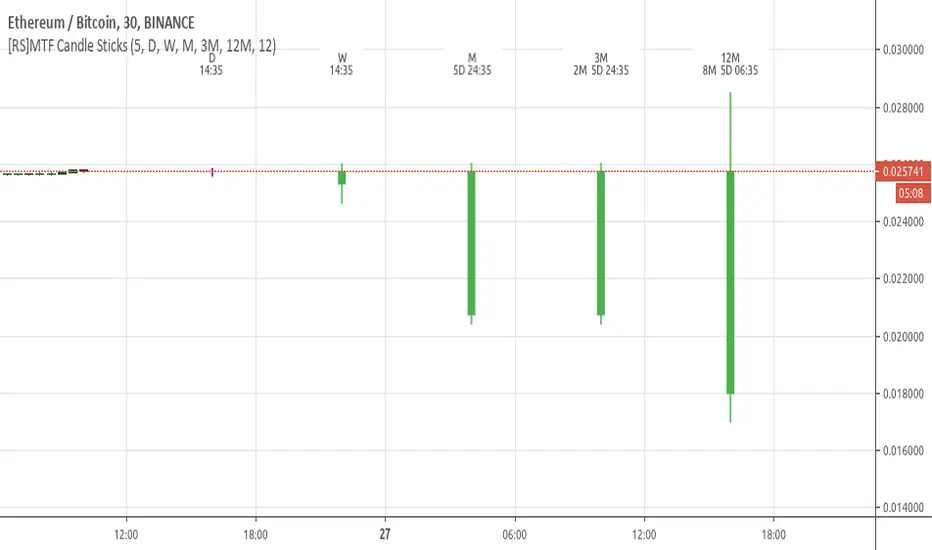
Candlestick RSThis is a candlestick charted Relative Strength indicator. It compares the chosen stock's progress compared to that of the SPY ETF ... ( SPY is used so it should hopefully update intraday). I use this indicator to see which stocks are outperforming the market.
Input Variable Descriptions:
Ratio: this variable is a float (0 to 1) that is basically how close the Candlestick RS is to the actual price action of the chart. (1.0 being right on top of it, 0.0 being as far away as possible from it)
Ballpark SPY price: this variable has to be constant, and due to the way pinescript works, you have to manually put in a ballpark of what SPY is at.
Neither of these variables influences the actual data of the indicator, but rather how it is shown on screen. It's difficult to describe, so I recommend you messing around with the variables and see what changes.
Hope this helps, I find this useful, so I figured I'd publish this... This is my first pine script so forgive me for any errors, just want to help :)
Search in scripts for "Candlestick"
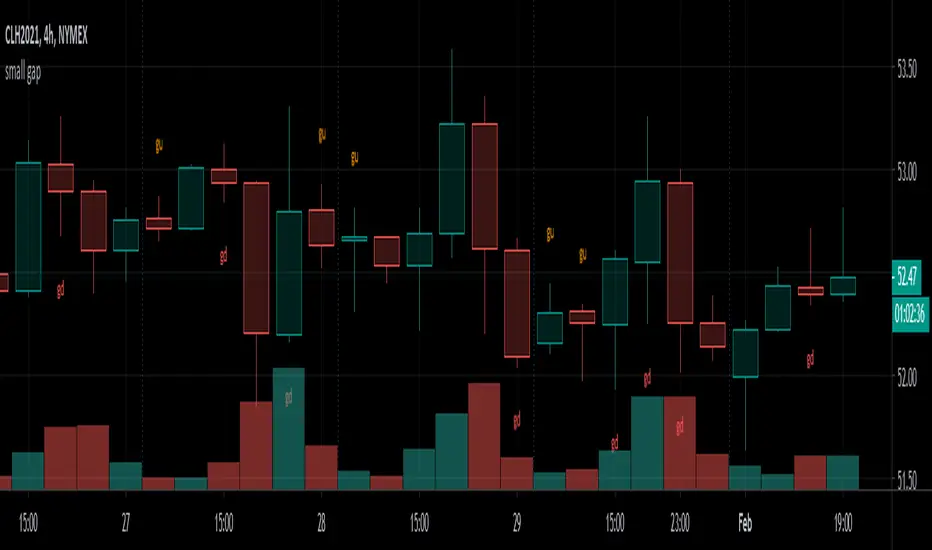
Gap detector
This is a very simple gap indicator derived by comparing the previous opening and next closing price.
Gap down if opening price is lesser than previous closed price.
Gap up if opening is more than previous closed price.
This gap detector use to evaluate the continuation or reversal of next candle and needed to be implement with other indicator such as Moving average or Boilinger band to read the possible direction of trend. Basic knowledge of candlestick pattern may help to predict the direction of next candlestick base on gap up or down of current price.
Alert can be setup using this gap detector accordingly to the time frame of chart.
Multiple time frame is recommended
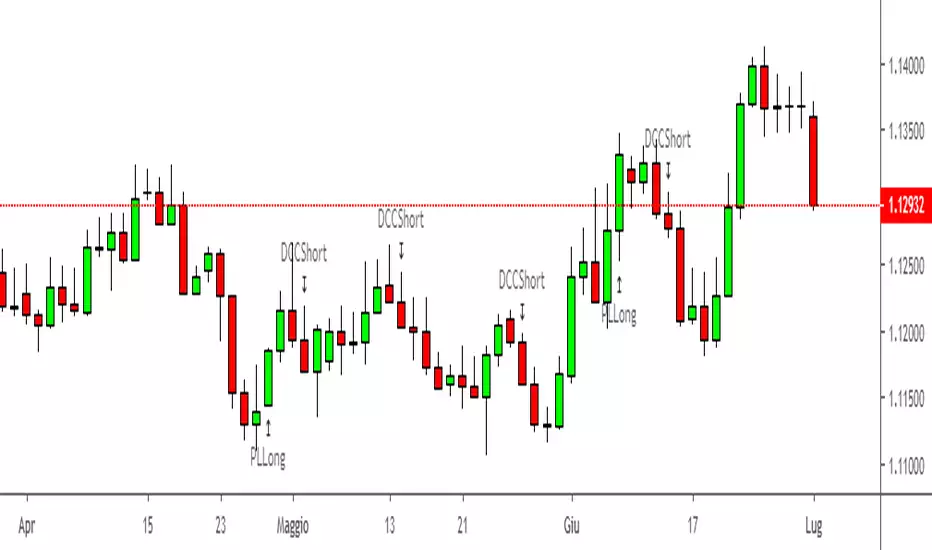
Dark Cloud Cover and Piercing Line {LucaBono}Questo candlestick pattern parla da solo! Come potete vedere dal grafico questo pattern individua i massimi e i minimi, più o meno momentanei.
Si possono effettuare svariati tipi di trade in quanto è valido per tutti i tipi di mercato e timeframe e potrebbe essere ottimo per il trading di breve termine o scalping in base al timeframe utilizzato. Si basa sul Dark Cloud Cover, un pattern ribassista che ho migliorato aggiungendo dei filtri per individuare quelli più significativi e non vi resta altro che entrare in direzione short nel caso del Dark Cloud Cover che ho impostato con una freccia verso il basso, sopra la candela, e la scritta DCCShort.
Per quanto riguarda l'ingresso long ci basiamo sul pattern Piercing Line che altro non è che l'opposto del Dark Cloud Cover. Ho inserito sul grafico una freccia verso l'alto posta sotto la candela con la scritta PLLong.
Cercalo tra gli indicatori, lascia un like se lo trovi utile e..buon trading!
Timeframe Weekly su GOLD
This candlestick pattern speaks for itself! As you can see from the graph this pattern identifies the maximum and minimum, more or less momentary.
Various types of trade can be made as it is valid for all types of markets and timeframes and could be excellent for short term trading or scalping based on the timeframe used. It is based on the Dark Cloud Cover, a bearish pattern that I improved by adding filters to identify the most significant ones and there is nothing left but to enter short in the case of the Dark Cloud Cover that I set with an arrow down, over the candle , and the word DCCShort.
As for the long entry we rely on the Piercing Line pattern which is nothing but the opposite of the Dark Cloud Cover. I placed an upward arrow on the chart under the candle with the PLLong inscription.
Look for it among the indicators, leave a like if you find it useful and ... good trading!
S&R Zone SignalsThis indicator allows you to specify price zones in which to detect basic candlestick patterns.
In the example above, I have specified the most immediate support and resistance zones on GBP/USD and set the script to detect engulfing candles. If a bearish engulfing candle occurs within the resistance zone a signal will be generated; likewise for bullish engulfing candles within the support zone .
The purpose of this indicator is to generate trading alerts when these patterns occur in order to reduce the screen-time required to monitor setups. This indicator is intended for structure traders primarily, although it could be used by anyone who uses zones and candlestick patterns to enter trades.
If you leave either zone set to 0 then that zone will not be used, meaning that you can use this to detect both support and resistance signals, or only signals at support, or only signals at resistance.
Settings:
R1: First Resistance Price
R2: Second Resistance Price
S1: First Support Price
S2: Second Support Price
Draw Signals: Enable/Disable Visual Signals
How Far To Look Back: Used For Detecting Fractal Highs/Lows
Doji Size (in pips): This Changes the Size of Detected Doji Candles
Hammer Wick Size: This Changes the Size of Detected Hammers/Shooting Stars
Engulf Wick: If Enabled, Only Engulfing Candles That Engulf the Wick Will Be Valid
Show Engulfing Candles: Enable/Disable Visual Signals For Engulfing Candles
Show Doji Candles: Enable/Disable Visual Signals For Doji Candles
Show Hammer Candles: Enable/Disable Visual Signals For Hammer/Shooting Star Candles
Source Code:
Go to zenandtheartoftrading.com for the source code – it’s free!

Fake-Out IndicatorThe signal comes from the "RailRoad" candlestick pattern breaking a support/resistance level, which typically indicates price will respect that level.
How consistent is the pattern? Hard to say considering candlestick patterns vary wildly by % change between different securities.
I didn't implement any kind of "fuzzy logic" for this strategy, though it would benefit greatly from it.
There are many instances where a fixed% simply doesn't catch a winning trade from a "bounce" off a S/R level.

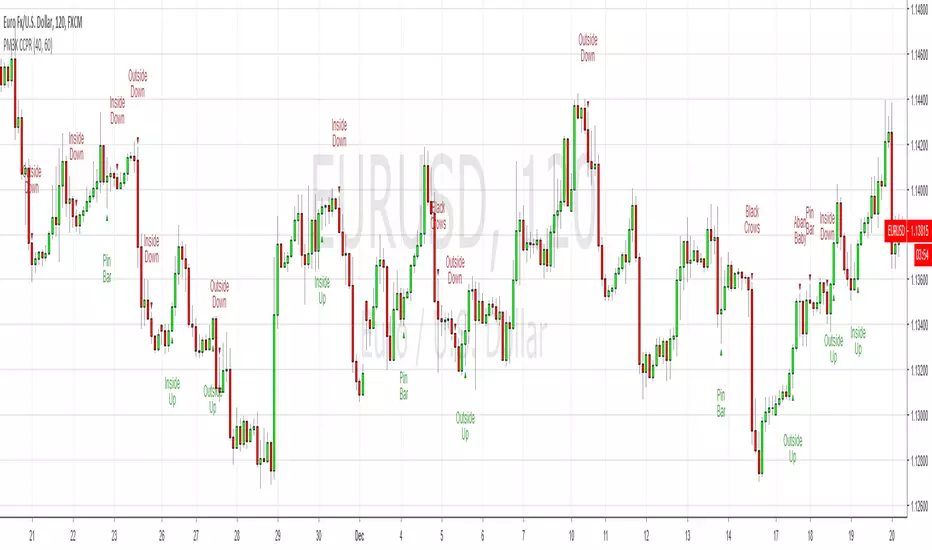
PM3K Confirmed Candle Reversal PatternsThese candlestick reversal patterns use three bars for each signal. So, for example, a Bearish Engulfing Candles (which is a well known signal) will have a third candle which confirms the bullish move. This improves the reliability and reduces the number of signals.
Like any candlestick pattern these are best traded away from horizontal support/resistance and/or moving average levels. Overbought/sold RSI conditions are also good for confirmation as are classic pivot points.
Volume Based Price ActionThis indicator is uses volume and common candlestick patterns to suggest potential trend reversals. It is not quite meant to be used as a buy/sell signal. Instead, it should be used to evaluate market psychology based on when the buyers or sellers fully dominated the price action.
In the current version, the indicators looks for engulfing and pin-bar patterns. Optionally, it also considers rising volume as further confirmation to the signal. In future, I plan on allowing it to track more candlestick patterns.
Please let me know if you have any suggestions, concerns, or comments!

Bookmap Style Aggressor Bubbles
This indicator is designed to emulate the visual aesthetic of professional Order Flow software (such as Bookmap) directly within TradingView. It replaces the traditional candlestick view with a clean "Microstructure" Step Line and highlights significant volume events using dynamic "Aggressor Bubbles."
This tool is perfect for traders who practice Order Flow analysis, Scalping, or VSA (Volume Spread Analysis) and want to visualize the relative intensity of buyers and sellers without the noise of traditional wicks and bodies.
1. How it Works
Since TradingView Pine Script operates on OHLCV (Level 1) data, this indicator uses a heuristic model to approximate Order Flow dynamics:
Aggressor Bubbles (Volume Spikes):
The script calculates a Relative Volume (RVOL) metric by comparing the current bar's volume against a 50-period Simple Moving Average (SMA).
If the current volume exceeds a user-defined threshold (e.g., 2.0x the average), a bubble is plotted.
Size: The bubble size scales dynamically based on how massive the volume spike is (Small, Normal, Large, Huge).
Direction (Color): The aggressor side is approximated using the price action of the bar. If Close >= Open, it is treated as Buy Aggression (Green). If Close < Open, it is treated as Sell Aggression (Red).
Microstructure Price Line:
Standard candles can obscure the immediate path of price. This indicator includes a Step Line option that plots the closing price. This mimics the "Last Price" feed seen in DOM-based software, allowing you to see exactly where price held or broke.
2. Features
Smart Filtering: Filters out low-volume noise. You only see bubbles when "Whales" or significant liquidity changes occur.
Visual Customization: Fully adjustable colors for Buy/Sell bubbles and the price line.
Alert System: Includes a built-in alert that triggers whenever a significant Aggressor Bubble appears, allowing you to be notified of high-activity moments instantly.
Clean Aesthetic: Optimized for Dark Mode/Black backgrounds.
3. How to Use
Chart Setup (Important): For the best experience, hide your standard candles. Go to Chart Settings > Symbol and uncheck Body, Borders, and Wick.
Settings: Set your background to Black.
Interpretation:
Breakouts: Look for large bubbles pushing price through a key level. This indicates strong momentum.
Absorptions: Look for large bubbles appearing at the top/bottom of a range without price follow-through. This often suggests a reversal (Passive limit orders absorbing the aggressive market orders).
4. Technical Disclosure & Limitations
Please note that TradingView Pine Script provides access to OHLCV (History) data, not historical Tick-by-Tick or Level 2 (Depth of Market) data. Therefore, this indicator is a simulation. The "Aggressor" side is derived from bar direction, and the bubbles represent executed volume per bar, not individual tick clusters. It is intended for visual analysis and identifying high-volume nodes relative to recent history.

Candlestick Absorption (Pure Price+Volume)📘 Candlestick Absorption (Pure Price + Volume)
An original approach to detecting hidden institutional absorption using nothing but candle structure and relative volume.
🧠 Concept
Every candle tells a story — not just in its color, but in the battle between aggressive orders and passive liquidity.
This indicator isolates those moments where one side of the market absorbs the other’s aggression — when a candle shows excess wicks on high volume but fails to extend in that direction.
Unlike traditional volume indicators or oscillators, this script focuses solely on the interaction between wick length, body size, and relative volume , giving a pure price–volume perspective of absorption and exhaustion.
⚙️ How It Works
1. Relative Volume Detection
• Compares each candle’s volume to a configurable moving average (default SMA 20).
• Marks only candles with significantly above-average activity (e.g. 1.5× SMA) as eligible for absorption.
2. Wick–Body Anatomy Analysis
• Measures the proportion of each candle’s wicks and body within its total range.
• Focuses on long wicks with small bodies , representing strong push-and-absorb behavior.
• The close must remain off the extreme by a user-defined percentage to confirm that the move was rejected.
3. Absorption Logic
• Bullish Absorption (⬆) → long lower wick, high volume, small body, close away from the low → demand absorbed selling pressure.
• Bearish Absorption (⬇) → long upper wick, high volume, small body, close away from the high → supply absorbed buying pressure.
4. Cooldown & Clarity
• A built-in cooldown prevents repetitive signals in congestion zones.
• Optional translucent absorption zones (boxes) extend forward, helping you visualize where future retests may react.
🎯 How to Use It
• Watch for Absorb ⬆ or Absorb ⬇ markers near swing highs/lows, session extremes, or fair-value gaps — these often highlight zones of institutional absorption or stop-runs.
• Combine with market structure or order-flow context rather than standalone entries.
• Use zones as potential re-entry or rejection levels when price revisits them.
• For intraday use, increase High-Volume Factor to 1.8–2.2 to filter noise.
• For higher timeframes, relax wick/body thresholds slightly to capture broader absorption events.
⸻
🔍 What Makes It Original
• Pure Price + Volume logic — no MAs, RSI, VWAP, or momentum filters.
• Uses dynamic wick-to-range ratios and relative-volume qualification instead of arbitrary thresholds.
• Adaptive visual design: the plotted boxes fade as they age, making absorption footprints visually intuitive.
• Works across any market (stocks, crypto, indices, futures) and timeframe without recalibration.
• Zero repainting. All signals are based on completed bars only.
🧩 Inputs Summary
Volume Filter : Volume SMA Length, High-Volume Factor
Defines how much higher a candle’s volume must be compared to its average
Candle Anatomy : Min Wick % of Range, Max Body % of Range, Close Off Edge %
Controls candle geometry for valid absorption
Signal Logic [/b : Cooldown Bars, color filters
Reduces clutter and false clustering
Zones : Draw Zones, Zone Forward Bars, Opacity Levels
Paints temporary liquidity footprints
Visuals : Background Tint
Highlights active absorption bars
⚠️ Important Notes
• Absorption ≠ instant reversal — it’s often a precursor to exhaustion or liquidity shift.
• Always confirm with structure, trend context, or additional confluence.
• Use at your own discretion; the script makes no performance claims.
💡 Suggested Use Cases
• Identifying trap candles at swing highs/lows.
• Spotting hidden institutional participation before reversals.
• Filtering false breakouts in tight ranges.
• Defining retest zones for Smart-Money or volume-profile strategies.

IL - Inside Bar Detector - v01Indicator: IL - Inside Bar Detector - v01
Product: An Indigo Lynx Indicator
Copyright: © Indigo Lynx, v01, 2025-07-04
Description:
This indicator identifies Inside Bar candlestick patterns, which can signal
consolidation or indecision in the market, often preceding breakouts.
It offers multiple definitions for what constitutes an Inside Bar, an
optional volume filter, and differentiates markers and display for
bullish or bearish closing inside bars.
Features:
- Detects Inside Bar patterns.
- Configurable Inside Bar Definitions (via "Inside Bar Definition" input):
1. "Body (O/C)": Current O/C body within previous O/C body.
2. "Range (H/L - Standard)": Current H/L within previous H/L.
3. "Super (Range & Body)": Requires BOTH conditions.
- Optional Volume Filter: Inside Bar volume < SMA of volume.
- Display Toggles: Separate options to show/hide Bullish closing IBs
and Bearish closing IBs.
- Customizable Visuals: Bar color and optional plotshape markers (differentiated
for bullish/bearish closing inside bars using "BI" and "BRI" text).
- Data Logging: Option to log detected pattern details.
How to Use & Interpret:
- Configure definition, volume filter, and display options.
- Inside Bars are highlighted by bar color if their type (bullish/bearish closing) is enabled.
- Optional shapes: Green up-triangle (BI) for bullish-closing Inside Bars,
Red down-triangle (BRI) for bearish-closing Inside Bars, if enabled.
- Use with other analysis methods for confirmation.
Disclaimer: Trading involves substantial risk of loss and is not suitable for all investors.
Past performance is not indicative of future results.

Heikinashi Candles Biggest problem that when we use normal heikin-ashi candlestick pattern then all applied indicator values also changes
Like Pivot Point with CPR ,,, EMA,,, SMA including VWAP indicator value
So , this indicator help us plot Heikinashi candles on Normal candles
Please follow below steps:
Add this indicator to chart
Go to setting >> un-tick Body, Border and Wick color
That will hide candles on chart and Plot heikinashi candles on Normal candles without changing any indicator value
Remember use normal candle stick pattern that

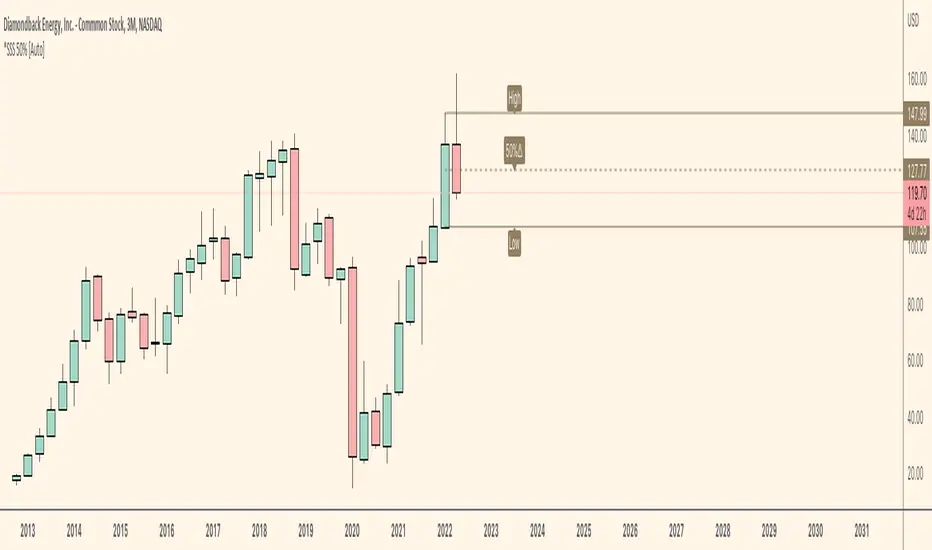
*SSS 50% [Auto]** SSS 50% - Displays Outside Warning and Previous High/Low on Current chart timeframe or Custom Timeframe Selection **
Outside Warning and Previous high/low levels default is set to the current charts timeframe.
For all Custom Timeframes, select within Indicator settings. Note this indicator is a simple version of my previous SSS Rule Indicator and HTF as this is allows for ONE Timeframe only!
This indicator is based on Sara Strat Sniper's - 50% Rule for trading Outside Bars and helps you visual the method quickly.
** Indicator Setup Requirements **
For Indicator to correctly display the 50% price level you need to setup your chart correctly. Right-click your chart background, select Settings, select Scales and Tick “Indicator Last Value Label". Now your 50% Price level will be displayed.
Known Issues:
This indicator does not work when you try to view a lower timeframes levels on a higher timeframe chart.
Example 1: Selecting Daily Warning, High and Low Levels will not be displayed correctly on a Weekly timeframe and above etc. The Daily selection however will be displayed correctly on all lower timeframes from the 1 minute chart to the Daily.
Example 2: Selecting Weekly Warning, High and Low Levels will not be displayed correctly on a Monthly timeframe and above etc. The Weekly selection however will be displayed correctly on all lower timeframes from the 1 minute chart to the Weekly. Please apply these same rules for all other timeframe indicator selections.
Monthly Warning, High and Low levels will not work correctly on a Weekly chart when the current Weekly candlestick is forming between the end of a previous Month and start of new Month. Once the first Weekly candle of a new Month closes the Monthly levels will now be displayed correctly. Please note, selecting the Monthly levels when viewing a Monthly chart will work as normal and Monthly levels displayed on a Weekly chart will be corrected once the first Weeks candle has closed. I believe this error is caused by a pine script repainting issue when assessing historical price data which is out of my limited scripting brains control.
*SSS 50% HTF** SSS 50% - HTF (Higher Timeframe) -D/W/M/Q Edition **
This indicator is based on Sara Strat Sniper's - 50% Rule for trading Outside Bars and helps you visual the method quickly.
This indicator allows you to select: Outside: Day/Week/Month/Quarter Warning Levels with Previous High and Low Levels available within the indicators settings.
Please note - Daily warning and high/low levels are set to the indicators default. Feel free to change and save as required. Any issues let me know. See known issues below.
** Indicator Setup Requirements **
For Indicator to correctly display the 50% price level you need to setup your chart correctly. Right-click your chart background, select Settings, select Scales and Tick “Indicator Last Value Label". Now your 50% Price level will be displayed.
Known Issues:
This indicator does not work when you try to view a lower timeframes levels on a higher timeframe chart.
Example 1: Selecting Daily Warning, High and Low Levels will not be displayed correctly on a Weekly timeframe and above etc. The Daily selection however will be displayed correctly on all lower timeframes from the 1 minute chart to the Daily.
Example 2: Selecting Weekly Warning, High and Low Levels will not be displayed correctly on a Monthly timeframe and above etc. The Weekly selection however will be displayed correctly on all lower timeframes from the 1 minute chart to the Weekly. Please apply these same rules for all other timeframe indicator selections.
Monthly Warning, High and Low levels will not work correctly on a Weekly chart when the current Weekly candlestick is forming between the end of a previous Month and start of new Month. Once the first Weekly candle of a new Month closes the Monthly levels will now be displayed correctly. Please note, selecting the Monthly levels when viewing a Monthly chart will work as normal and Monthly levels displayed on a Weekly chart will be corrected once the first Weeks candle has closed. I believe this error is caused by a pine script repainting issue when assessing historical price data which is out of my limited scripting brains control.

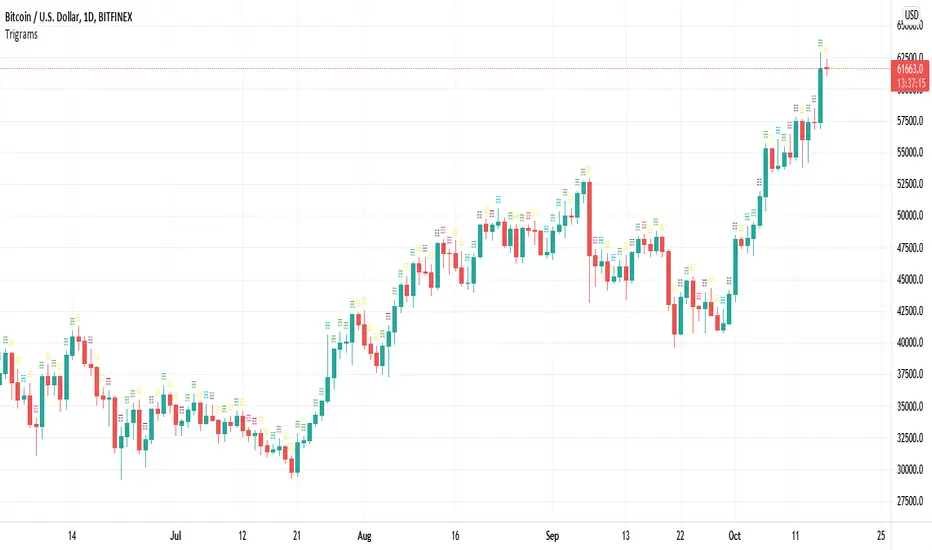
Trigrams based on Candle PatternThis script matches a Trigram for the current candle from its pattern Bullish/Bearish: Marubozu, Hammer, Inverted Hammer, Spinning Top.
The source for Trigram to candlestick pattern can be found online. I'm missing the reputation to add the link here.
Heaven = Bearish Marubozu
Earth = Bullish Marubozu
Thunder = Bearish Spinning Top
Water = Bullish Inverted Hammer
Mountain = Bullish Hammer
Wind = Bullish Spinning Top
Flame = Bearish Hammer
Lake = Bearish Inverted Hammer
The idea is simple. It takes the current candles pattern to match the Trigram.
Inspired by the Trigram Script from ByzantineSC
Anyways, not sure what use it is yet, but if there is anyone else out there interested in I Ching, Yin/Yang theory and trading, this is for you.
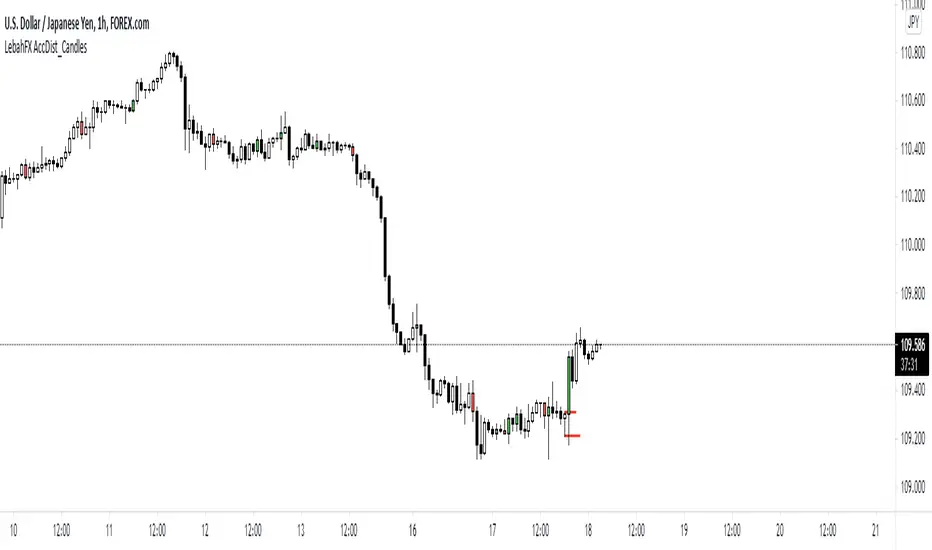
LebahFX AccDist_CandlesLebahFX Indicator that showing Accumulation and Distribution Signal in HTF Candlestick
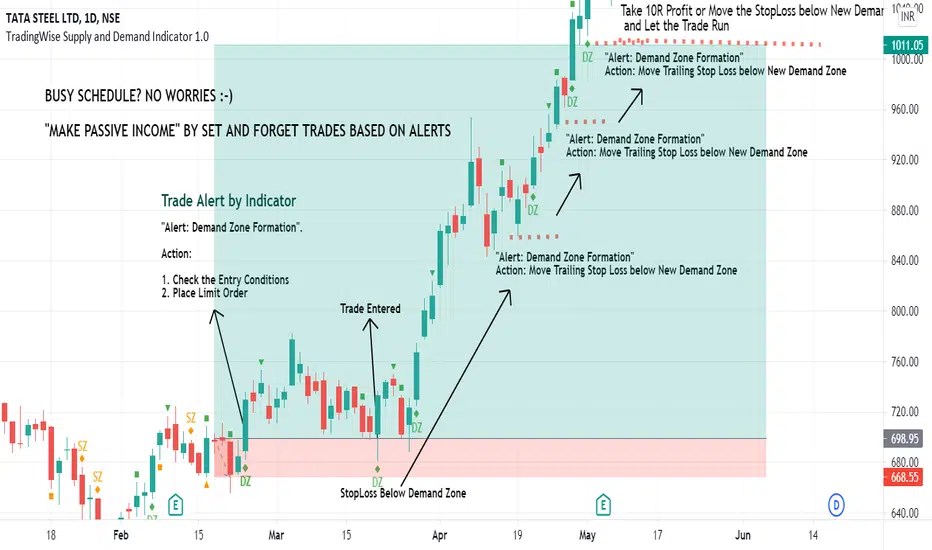
TradingWise Supply and Demand Indicator 1.0TradingWise Supply and Demand Indicator 1.0 is based on the Price Action candlestick patterns to identify the Supply and Demand zones in the charts (Areas of liquidity). It works on all Timeframes and Asset Classes. This Script helps the traders to identify the demand and supply zones with identifications on the candle stick patterns indicating the origin of the Strong move. Also it generates Alerts automatically once the supply or demand area is formed thus by reducing the hours spent on the charts and reducing the missed trade Opportunities as well. This Indicator is extremely helpful for those on Full time Jobs/ Busy Schedule.
Buy/Sell Alerts by Indicator:
Green Diamond + DZ Sign ---> Indicates the Demand Zone Formation. Place Buy Trade upon Entry Criteria Met
Orange Diamond + SZ Sign ---> Indicates the Supply Zone Formation. Place Sell Trade upon Entry Criteria Met
Pivot Point CandlesIndicator that highlights Hammer, Inverted Hammer, Engulfing, and Harami candlestick patterns. Great for those looking for a quick way to show the most popular reversal patterns on the charts.
Options will allow you to select to show Hammers, Engulfing or Harami patterns only. You choose the combinations that you want. Great tool to learn and training your eyes to the patterns.
You also have an option to select "Super" versions of the Engulfing and the Harami patterns, the Supers only shows if the pattern engulfs the body and the wick of the smaller candle in the pattern.
The indicator will show Bullish opportunities and Bearish opportunities on the chart for each of the patterns. The inverted hammer will show at the top indicating a Bear move, and the Hammer will show below price indicating a Bullish move.
Use this indicator in conjunction with other Support & Resistance such as the simple moving averages, trend lines, flat lines, or even Bollinger bands. When these patterns show at or around these points on the chart they will indicate a reversal is pending. Wait for the next candle as confirmation that the move will actually take place in the direction indicated and you will have your pivot point on the chart and create a higher probability of success. Leverage Stochastic, RSI, or CCI indicators to help confirm the reversal as well. Look out for resistance above or support below to determine your targets for the reversal.
Happy trading!


Engulfing/Outside BarThis indicator provides a statistical report on the Engulfing/ Outside Bar candlestick pattern. Based on the chart's bars, it can improve your edge on any markets and timeframes.
Knowing there are many definitions about the Engulfing/ Outside Bar pattern, here we're strictly referring to one bar's body engulfing one other AND making a higher high and lower low.
The report is broken down into the different following sections: retracement , invalidation , continuation and breakout .
Each of them provides hindsights about the pattern price behavior and brings answers to questions such as: How often does price retrace? Does the pattern often invalidate? If it doesn't then does it break in the pattern's direction? How far does price go? What are the odds of a false breakout?
While there are many ways to make use of the metrics, my favorite use case is for developing directional and daily/weekly biases while refining my stop/entry/target positioning.
Miscellaneous
Highlights patterns on the chart;
Supports bar to bar analysis and replay functionalities;
Provides counts on the `Data Window` panel for debugging or computing your own metrics;
Settings
Option for filtering patterns that close outside previous bar;
Show/hide for toggling different sections;
Report coloring and offset on the x axis;
Gaining Access
This is a private indicator and is available only for my Patrons. You can reach my Patreon page below from the link in my signature.

ArrowsI decided to republish this one without the trend filter and with all the major symbols active. This will allow for all the patterns to show up.
Due to 15 different candlestick formations in this one script, it will be difficult to turn off the last few due to screen size. You can turn off individual patterns on the settings screen.
I have everything spelled out except the hammer and inverted hammer . They are "H" and "IH" respectively on the charts. They show up so often that they cluttered the charts.
The default script has: Doji , Evening Star , Morning Star , Shooting Star , Hammer , Inverted Hammer , Bearish Harami, Bullish Harami, Bearish Engulfing , Bullish Engulfing , Piercing Line, Bullish Belt, Bullish Kicker, Bearish Kicker, Hanging man , and Dark Cloud Cover. You can turn off what you don't like. The Piercing Line, Bullish Belt, and the Kickers will usually show up better in the daily charts .
I recommend watching videos with Stephen Bigalow to get a feel for how to trade these. You will want to add an 8 EMA to your chart with his setups. Enjoy.

Tweezer Scanner v1Some code for detecting tweezer candles, which are reversal patterns. You'll need to tweak the settings to be either less strict (more detections) or more strict (less detections). I found that if you follow the documentation for tweezers exactly, you will get very few detections. It is possible that this candlestick has become overused, so the original pattern itself has been lost to the noise of the market.
Settings:
1. Tweezer Max Body Height (Pips) - How tall can the body of the tweezer be, in pips (increase this pips to increase detections)
2. Tweezer Body Similarity (>%) - How similar should the body heights be, higher percentage is more similar (reduce this % to increase detections)
3. Tweezer Tail Similarity (>%) - How similar should the tail heights be, higher percentage is more similar (reduce this % to increase detections)
4. Tweezer Tail Proportion (<%) - How short should the opposite tail heights be, lower percentage is shorter and more similar to the documentation (increase this % to increase detections)

[RESEARCH] Heikin-Ashi Chart IdentifierA deterministic approach to identify Heikin-Ashi chart type.
The script checks the next statements about HA:
HA chart does not have any gaps in a classic sense
Every new HA open price is calculated using a specific recurrence formula. This fact also means that initial HA open price is used to calculate all the next and so on (a construction of Infinite Impulse Response filters)
The script works correctly being applied to other chart types:
Classic Candlestick
Range Bars
Line Break
Traditional Renko
ATR Renko
Traditional Point-and-Figure
ATR Point-and-Figure
Kagi
For special ones: this code allows you to check whether your script is being executed with Heikin-Ashi candles or not inside your script.
Ev sistr 'ta Laou!
