Trend lines + Pivot Levels + Candlestick PatternsThis is a pure PRICE ACTION indicator that will show you possible trend lines, pivot lines and candlestick patterns at once.
it has been designed to determine upper and lower trend lines in the chart and you can set candlestick patterns on them with alerts!
it means that you add the indicator to the chart and set the alert and done!
whenever a pinbar or engulf or breakout(in both directions) happens, you will be notified by alerts.
you also have pivot lines on the chart by this indicator. you can set the candlesticks on pivots instead of trend lines, so if you are a fan of support and resistance you can have this one, it depends on you.
all of the pivots and trend lines and also the candle sticks are customizable, so you can exactly select the pinbar, engulfing or breakout candle that matches with your mindset. for example you can set a pinbar that long shadow is 4 times or 3 times greater than the body, it's on you.
you can also customize trendlines or pivot lines, if you are scalper you can set it to small trend lines and if you are day trader or long term trader you can set it to the number that fits with your strategy.
trends and pivots will be updated automatically and there is no need to set it every time.
Be PROFITABLE!
$kMagician /*
Search in scripts for "Candlestick"

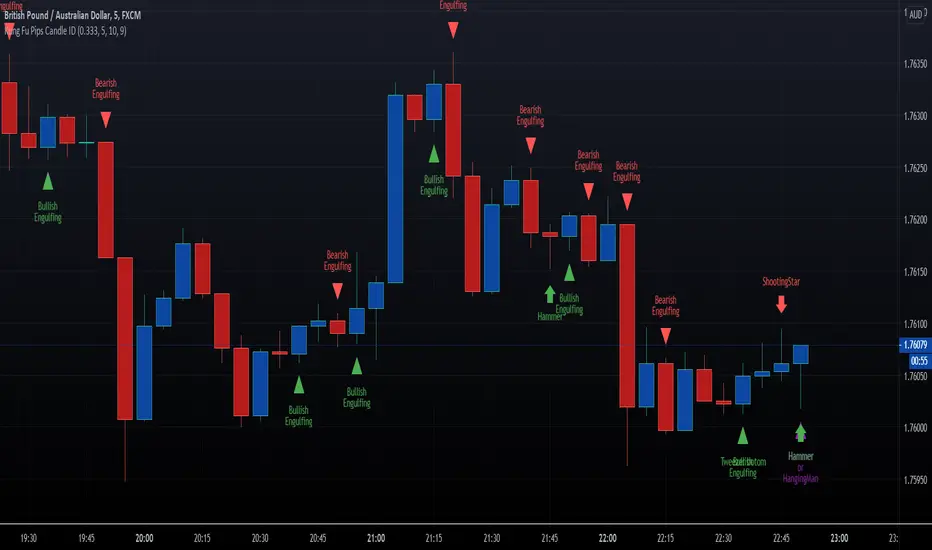
HFX Kung Fu Pips Candlestick Identifier by Trader ZThis indicator identifies the following candle stick patterns:
Bullish and Bearish Engulfing
Hammer/Hanging Man, Shooting Star
Tweezer Tops and Bottoms
Doji Star
Doji Gravestone
Made for trading Forex Binary Options but can be used in any market. When the candlestick pattern emerges the script will label the pattern. A helpful visual tool for your analysis.
Enjoy!!!!
Reversal Candlestick Pattern Detector// Name: Reversal Candlestick Pattern Detector
// Condition:
// 1-up move: last n candles, 3/5 move higher; and/or the last is the highest in past n bars
// 2-down move: last n candles, 3/5 move lower; and/or the last is the lowest in past n bars
//
// Show Bullish reversal pattern in down move; Show Bearish reversal pattern in up move;
//
//Reversal candlestick patterns:
//1. Hammer/Shooting Star,
//2. Engulfing,
//3. Morning/Evening Star,
//4. Harami, --Also Harami could be used in continuation (Rally based Rally/Drop based Drop);
//5. Piercing/Dark Cloud cover,
//6. Hook Reversal
//7. Breakaway Gap, or Gap Crosses SMA8, SMA50. This is for un-filled Gap only. low >high or high

High Performance Candlestick Patterns Colors//Candle Patterns Ranked by Performance THOMAS N. BULKOWSKI
//1. Bearish Three Line Strike +Up 67.38%
//2. Bullish Three Line Strike -Down 65.23%
//3. Bearish Three Black Crows -Down 59.83%
//4. Bearish Evening Star -Down 55.85%
//5. Bullish Upside Tasuki Gap +Up 54.44%
//6. Bullish Inverted Hammer -Down 51.73%
//7. Bullish Matching Low -Down 50.00%
//8. Bullish Abandone Baby +Up 49.73%
//9. Bearish Two Black Gapping -Down 49.64%
//10. Brearish Breakaway -Down 49.24%
//11. Bullish Morning Star +Up 49.05%
//12. Bullish Piercing Line +Up 48.37%
//13. Bullish Stick Sandwich +Up 48.20%
//14. Bearish Thrusting Line During Dowtrend +Up 48.10%
//15. Bearish Meeting Line +Up 48.07%
//Down=Yellow Bar Color and Black Text
//Up=Blue Bar Color and Blue Text
//High Performance Candlestick Patterns Colors Top 15

High Performance Candlestick Patterns//Candle Patterns Ranked by Performance THOMAS N. BULKOWSKI
//1. Bearish Three Line Strike +Up 67.38%
//2. Bullish Three Line Strike -Down 65.23%
//3. Bearish Three Black Crows -Down 59.83%
//4. Bearish Evening Star -Down 55.85%
//5. Bullish Upside Tasuki Gap +Up 54.44%
//6. Bullish Inverted Hammer -Down 51.73%
//7. Bullish Matching Low -Down 50.00%
//8. Bullish Abandone Baby +Up 49.73%
//9. Bearish Two Black Gapping -Down 49.64%
//10. Brearish Breakaway -Down 49.24%
//11. Bullish Morning Star +Up 49.05%
//12. Bullish Piercing Line +Up 48.37%
//13. Bullish Stick Sandwich +Up 48.20%
//14. Bearish Thrusting Line During Dowtrend +Up 48.10%
//15. Bearish Meeting Line +Up 48.07%
//Down=Yellow Bar Color and Black Text
//Up=Blue Bar Color and Blue Text
//High Performance Candlestick Patterns Top 15

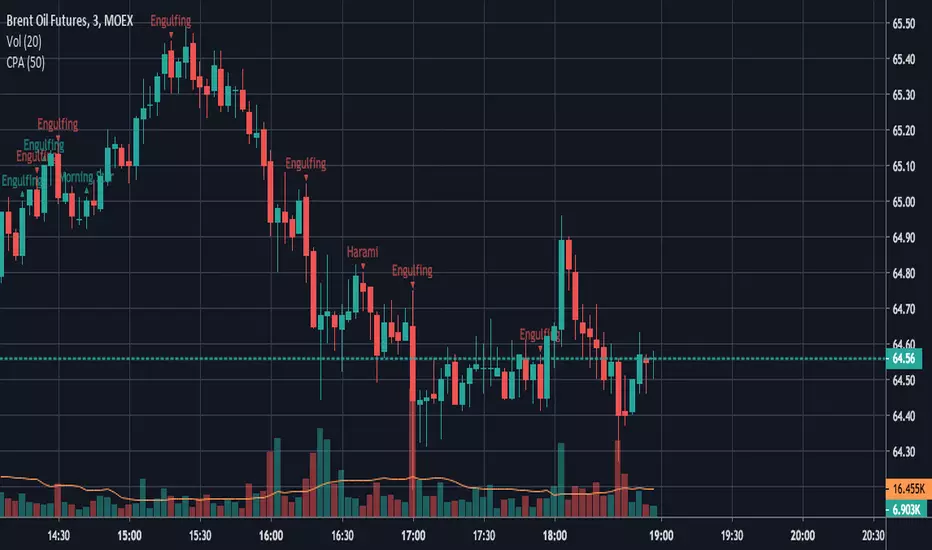
Actually Engulfing CandlesticksThis thing attempts to find price reversals with actually engulfing candlesticks with volume spikes and RSI values as confirmation. It works well on mean reverting assets I guess.
Green dots below bars = bullish reversal
Fuchsia dots above bars = bearish reversal
Have fun!

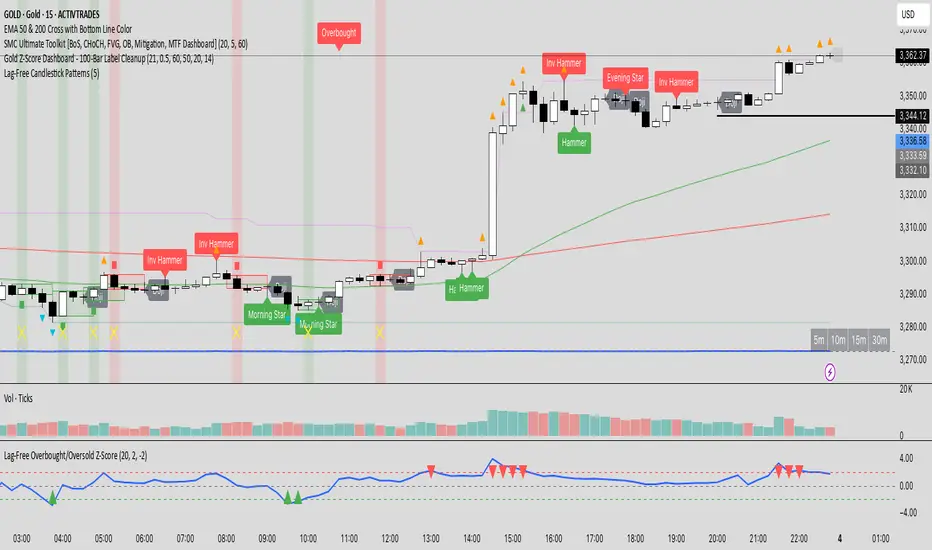
Lag-Free Candlestick Pattern Detector — All-in-One📌 Indicator Name:
Lag-Free Candlestick Pattern Detector — All-in-One
🧾 Description (for Publishing):
This indicator scans the chart for high-probability candlestick reversal patterns using clean, non-repainting logic. It confirms each pattern on bar close and shows signals one bar later to eliminate repainting and improve reliability.
✅ Patterns Detected:
Single-bar patterns:
Hammer / Inverted Hammer
Doji
Shooting Star / Hanging Man
Two-bar patterns:
Bullish & Bearish Engulfing
Bullish & Bearish Harami
Piercing Line / Dark Cloud Cover
Tweezer Top / Bottom
Three-bar patterns:
Morning Star / Evening Star
Three Inside Up / Three Inside Down
🧠 How It Works:
📌 Each pattern is detected using classic candlestick logic derived from open, close, high, and low prices over the past 2–3 bars.
🔁 It uses pivot-based swing detection to locate nearby support and resistance areas.
📈 Bullish signals are only shown near support zones, and bearish signals near resistance, improving signal accuracy.
⚠️ Labels appear on the next candle after confirmation to avoid misleading repainting behavior.
💡 Best Used For:
Spotting key reversal points on any timeframe
Combining with trend or volume filters for strategy development
Training pattern recognition visually on live charts
Volume Impulse & Candlestick Patterns - FontiramisuIndicator showing volume impulse & engulfing candlestick pattern.
You can set up multiple parameter for both events.
Volume Impulse :
Volume Period : Lenght of the average volume calculated.
Volume Multiplier : Factor to compare actual volume with average volume.
Engulfing Pattern :
VS avg body : Let you chose to compare body candle to average body of the last few candles (define with parameter : lenghtSizeAvgBody ), otherwise it will be compared to the last body candle.
Engulfing Multiplier : Factor to compare and validate the pattern.

Fear and Greed Index CandlesticksThis colours the candlesticks based on my 'Fear and Greed Index'.
All calculations are explained in the code.
The index is mainly based upon the components of the popular fear and greed index website. I've annotated the components in the code for you to look at.
If you're interested, you can replace the final variable 'Total' (within the 'barcolor' function at the very end) with any of the final outputs of the subcomponents to see the results of that single part.
Red = Greed
Green = Fear
Enjoy!

Visual Candlestick Blender (Analysis Tool), by @BlueJayBird- This is a analysis tool.
Brief Description
- It generates candlestick containers for current timeframe, using OPEN/HIGH/CLOSE/LOW data from higher time frames.
- Current version supports up to 4 CVB at the same time. Usually using only 2 is enough.
- Vertical extended divisions for 1h, 4h, 1D and 1W using background lines are included too.
* Report any bugs or feedback you have.
NOTE. At current unclosed candlestick , some weird line painting it is expected. It is not a bug, it is a Trading View feature that I haven't been able to solve yet. To solve this, setting the VCB off and then on should be enough.

Candle Patterns AlertCandlestick pattern alerts for strategies "Candle Patterns Strategy" and "Candle Patterns Strategy - 2".
In order not to receive unnecessary signals, in the "Manage alerts" option should be selected "Once per bar close".
IO_CWL IndexCandlestick body and Wick Length Index (CWL)
Shows a trend chart of candle body length and wick length.
Green -> Candle body
Red -> Candle Wick
-- Invsto

Momentum Candlestick TerakhirThis indicator highlights momentum candlesticks based on breakout behavior from previous highs/lows and draws real-time boxes and labels when momentum shifts occur.
It also includes an optional CMP (Current Market Position) table that categorizes price position into Bawah(low), Tengah(mid), Atas(high), or Luar Zone(Outside), with multitimeframe (MTF) logic to assess different timeframes in one view.
Additional features:
• Momentum Box & Label Drawing
• S/R Labeling using Pivot Points
• MTF Momentum & CMP Table Display
• Alerts for Buy/Sell Momentum Candles
Built for traders who rely on visual momentum tracking and want to quickly assess price position in any timeframe.
This script is intended for educational and analytical use only.
for entry, if weekly's current momentum is momentum buy, timeframe h4 also must be momentum buy.
weekly - H4
Daily - H1
H4 - M30
H1 - M15
weekly - 300/500 pips
daily - 100/150 pips
H4 - 70/80 pips
H1 - 20/30 pips

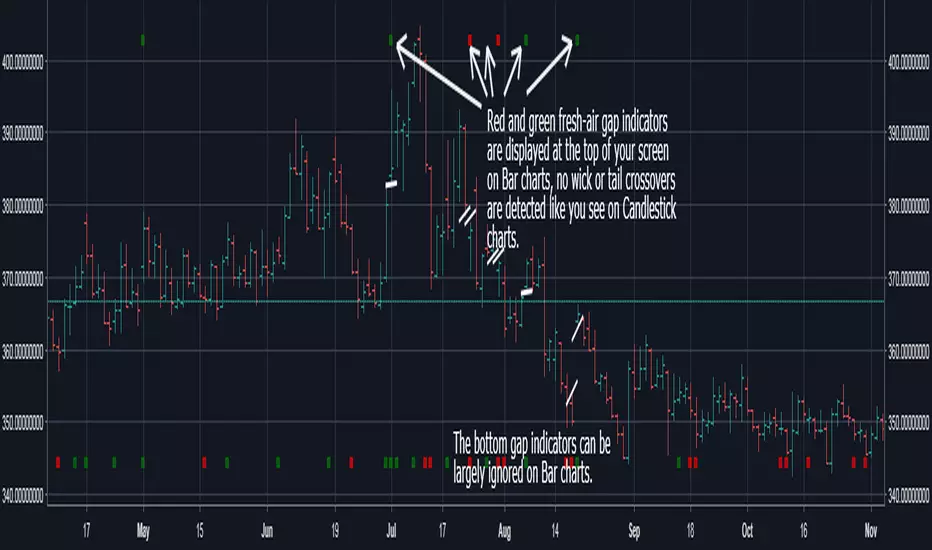
My Simple Gaps with overlay (Bar and Candlestick Charts)Can be used to identify gaps on bar and candlestick charts.
Bar graph gaps shown at top of screen, candlestick gaps shown on bottom of screen.
DepthHouse - Trend & Reversal CandlesticksDepth House Trend and Reversal Candlestick Indicato r is a custom trading tool designed to help traders determine trend direction, and possible trend reversal points.
Here is a video which I give a brief overview and show it in action:
youtu.be
How it works:
Based on the default settings, there are 5 primary colors that each have their own possible signal.
The colors are:
Green - Trending upwards
Red – Trending downwards
Lime –Trending upwards with a chance of reversal
Orange – Trending downwards with a chance of reversal
Grey – General trend is unknown
Please Note: There are NOT trading signals. Each colored candle represents nothing other than a possibility of which way the trend may go. Be sure to use your own adequate analysis. Use at your own financial risk.
How to get:
As you can see this is an invite only script. In the coming months this indicator, along with many others will become pay to use only. (website on my profile page)
However all my indicators will be FREE until May 1, 2018 . So please try them out!
To take advantage of this FREE trial:
1. Subscribe to my YouTube channel. I have many more videos to come! Maybe even leave a comment of what you would like to see next!
2. Comment on this indicator post! Maybe even give me a follow :D
I hope you all enjoy!!
Indicator website: depthhouse.com

Fractional + Heikin-Ashi Candlestick – CF / ABNew model of Candlestick, Tis model constructed on Fractional Calculus mathematical, use two kernel - Caputo-Fabrizio and Atangana-Baleanu.

My Simple Gaps with overlay (Bar and Candlestick Charts)updated screenshot with some narrative
this is a bar and candlestick chart gap identification tool


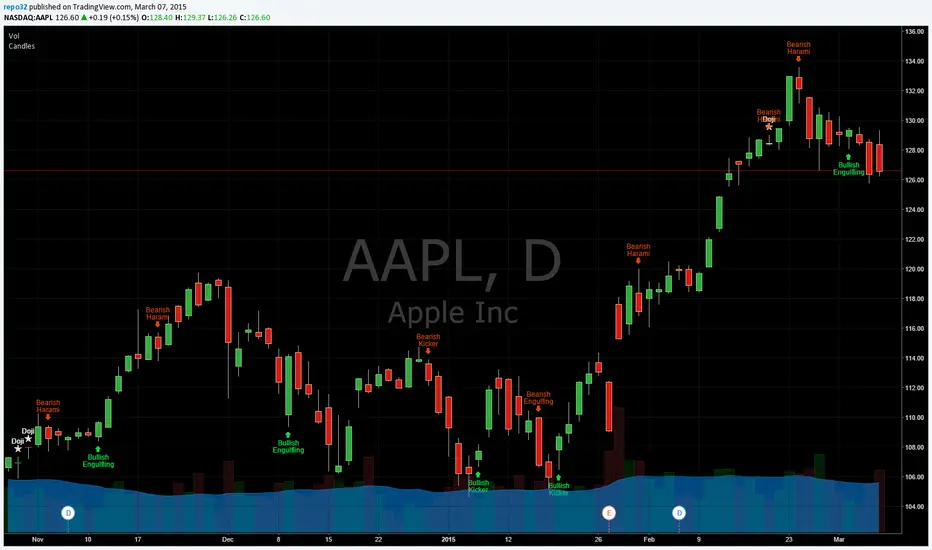
Candlesticks Patterns IdentifiedI was using another script that colored the bars to show the different candle patterns. Thanks to HPotter (www.tradingview.com). Unfortunately, I can't think that fast when looking across a screen of charts with different color bars. Fortunately, Tradingview came up with symbols and names on 2/26/15. I decided to take my favorite symbols and attach them to a name. This makes it easier to see what is going on and where your entry would be if it confirms. Works beautifully for me. Decided to share. I also added the ability to alter what shows up based upon a look back. A bullish engulfing at the top of a trend, or a bearish harami at the bottom of the trend, is nearly useless and clutters the chart. I have the default set for the open of the current bar to be higher or lower than the open from 5 bars back. You can adjust in the settings to what you like. This trend setting is on all the patterns except doji. If you want to see all the candle patterns, set it to "1".
The doji can be adjusted as well. I left some other patterns at the bottom of the script, but they are turned off. They became too much of a clutter for me. I prefer DovCaspi's pattern finder for hammers and stars: I use his due to the clean appearance.
The default script has: Doji, Bearish Harami, Bullish Harami, Bearish Engulfing, Bullish Engulfing, Piercing Line, Bullish Belt, Bullish Kicker, and Bearish Kicker. You can turn off what you don't like. The Piercing Line, Bullish Belt, and the Kickers will usually show up better in the daily charts.
If you would like the updated version, see the Related Ideas below:
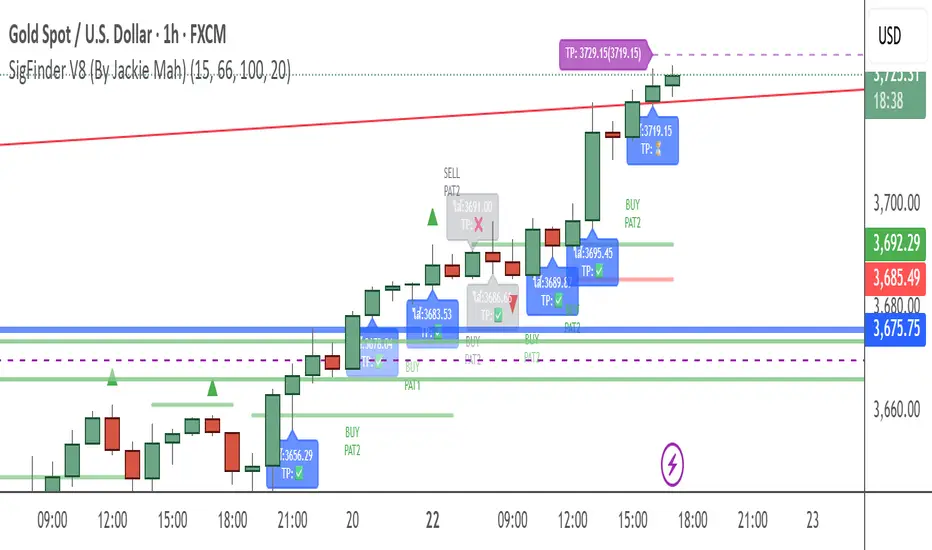
SigFinder V8 (By Jackie Mah)Candlestick Price Action & Signal Finder with Alerts system and text customization.
Time - Bar StatusCandlestick analysis
The Indicator "Bar Status" will display the current open candle state and the last three close candles state based on the logic below.
Abbreviations.
OC = Open Candle (if in no state listed below)
FB = False Break
BO = Break Out
IN = Inside Bar
FBR = False Break Reversal
Logic:
OC = This is the current open candle yet to close. Its status will change as it progresses through time until close.
Green False Break Revers (FBR) = bar Close is higher than previous bar Close AND bar High is higher than previous bar High AND bar Low is lower than previous bar Low.
Green False Break (FB) = bar Close is lower than previous bar High AND bar High is higher than previous bar High.
Green Breakout (BO) = bar Close is higher than previous bar Close AND bar High is higher than previous bar High.
Green Inside Bar (IN) = bar High is lower than previous bar High AND bar Low is higher than previous bar Low.
Red False Break Revers (FBR) = bar Close is lower than previous bar Close AND bar Low is lower than previous bar Low AND bar High is Higher than previous bar High.
Red False Break (FB) = bar Close is higher than previous bar Low AND bar Low is lower than previous bar Low.
Red Breakout (BO) = bar Close is lower than previous bar Close AND bar Low is lower than previous bar Low.
Red Inside Bar (IN) = bar High is lower than previous bar High AND bar Low is higher than previous bar Low.
The end column is the current open candle/bar.
The second from the end column is the last closed candle/bar.
The third from the end column is the second closed candle/bar.
The forth from the end column is the third closed candle/bar.
=============================================================
Also Includes candle countdown timer, of various candles. i.e. 4 hour, 1 hour, 15min, 5 min.

Japanese Candlestick Pattern RecognizerJapanese candlestick patterns are a powerful tool in technical analysis, offering traders and investors a detailed view of price action and market sentiment.
1. Spinning Top
Description: The Spinning Top has a small candle body with long upper and lower shadows. This indicates that both buyers and sellers were active during the period, but neither took control. The close is near the open.
Significance: Signals indecision in the market. Can appear in both uptrends and downtrends and suggests that the current direction may be losing momentum.
Type: Neutral
2. Doji
Description: A Doji has almost equal opening and closing prices, meaning there was no clear direction during the period. It has long upper and lower shadows.
Significance: Signals indecision or a potential trend reversal. In the context of a strong trend, a Doji can indicate that the trend is losing strength.
Type: Neutral
3. White Marubozu
Description: A long white (or green) candle body with no shadows. Indicates that buyers were in control throughout the entire period.
Significance: Strongly bullish. A White Marubozu often signals the continuation of an uptrend or the start of a new uptrend.
Type: Bullish
4. Black Marubozu
Description: A long black (or red) candle body with no shadows. Indicates that sellers were in control throughout the entire period.
Significance: Strongly bearish. A Black Marubozu often signals the continuation of a downtrend or the start of a new downtrend.
Type: Bearish
5. Hammer
Description: A small candle body at the upper end of the trading range with a long lower shadow. Signals a bullish reversal after a downtrend.
Significance: Bullish reversal. The long lower shadow shows that sellers were strong during the day, but buyers managed to push the price back up.
Type: Bullish
6. Hanging Man
Description: A small candle body at the upper end of the trading range with a long lower shadow. Signals a bearish reversal after an uptrend.
Significance: Bearish reversal. The long lower shadow shows that sellers were strong during the day, suggesting that buyers may be losing strength.
Type: Bearish
7. Inverted Hammer
Description: A small candle body at the lower end of the trading range with a long upper shadow. Signals a bullish reversal after a downtrend.
Significance: Bullish reversal. The long upper shadow shows that buyers attempted to push the price up, indicating a potential trend reversal.
Type: Bullish
8. Shooting Star
Description: A small candle body at the lower end of the trading range with a long upper shadow. Signals a bearish reversal after an uptrend.
Significance: Bearish reversal. The long upper shadow shows that buyers tried to push the price higher, but sellers managed to drive it back down.
_____________________________________
Japanische Candlestick-Muster sind ein leistungsstarkes Werkzeug in der technischen Analyse, das Händlern und Investoren eine detaillierte Sicht auf die Kursentwicklung und Marktstimmung bietet.
1. Spinning Top
Beschreibung: Der Spinning Top hat einen kleinen Kerzenkörper und lange obere und untere Schatten. Dies zeigt, dass sowohl Käufer als auch Verkäufer während der Periode aktiv waren, aber keiner die Kontrolle übernommen hat. Der Schlusskurs liegt nahe dem Eröffnungskurs.
Bedeutung: Signalisiert Unentschlossenheit im Markt. Kann sowohl im Aufwärtstrend als auch im Abwärtstrend erscheinen und zeigt an, dass die aktuelle Richtung möglicherweise an Schwung verliert.
Typ: Neutral
2. Doji
Beschreibung: Ein Doji hat nahezu gleiche Eröffnungs- und Schlusskurse, was bedeutet, dass es während der Periode keine klare Richtung gab. Es hat lange obere und untere Schatten.
Bedeutung: Signalisiert Unentschlossenheit oder mögliche Trendumkehr. Im Kontext eines starken Trends kann ein Doji darauf hinweisen, dass der Trend an Kraft verliert.
Typ: Neutral
3. White Marubozu
Beschreibung: Langer weißer (oder grüner) Kerzenkörper ohne Schatten. Zeigt an, dass Käufer den ganzen Tag über die Kontrolle hatten.
Bedeutung: Stark bullisch. Ein White Marubozu signalisiert oft die Fortsetzung eines Aufwärtstrends oder den Beginn eines neuen Aufwärtstrends.
Typ: Bullish
4. Black Marubozu
Beschreibung: Langer schwarzer (oder roter) Kerzenkörper ohne Schatten. Zeigt an, dass Verkäufer den ganzen Tag über die Kontrolle hatten.
Bedeutung: Stark bärisch. Ein Black Marubozu signalisiert oft die Fortsetzung eines Abwärtstrends oder den Beginn eines neuen Abwärtstrends.
Typ: Bearish
5. Hammer
Beschreibung: Kleiner Kerzenkörper am oberen Ende der Handelsspanne, langer unterer Schatten. Signalisiert eine bullische Umkehr nach einem Abwärtstrend.
Bedeutung: Bullische Umkehr. Der lange untere Schatten zeigt an, dass die Verkäufer während des Tages stark waren, aber die Käufer konnten den Preis zurück nach oben treiben.
Typ: Bullish
6. Hanging Man
Beschreibung: Kleiner Kerzenkörper am oberen Ende der Handelsspanne, langer unterer Schatten. Signalisiert eine bärische Umkehr nach einem Aufwärtstrend.
Bedeutung: Bärische Umkehr. Der lange untere Schatten zeigt an, dass die Verkäufer während des Tages stark waren, was darauf hindeutet, dass die Käufer an Kraft verlieren könnten.
Typ: Bearish
7. Inverted Hammer
Beschreibung: Kleiner Kerzenkörper am unteren Ende der Handelsspanne, langer oberer Schatten. Signalisiert eine bullische Umkehr nach einem Abwärtstrend.
Bedeutung: Bullische Umkehr. Der lange obere Schatten zeigt, dass die Käufer versucht haben, den Preis nach oben zu treiben, und dies könnte auf eine bevorstehende Trendumkehr hinweisen.
Typ: Bullish
8. Shooting Star
Beschreibung: Kleiner Kerzenkörper am unteren Ende der Handelsspanne, langer oberer Schatten. Signalisiert eine bärische Umkehr nach einem Aufwärtstrend.
Bedeutung: Bärische Umkehr. Der lange obere Schatten zeigt, dass die Käufer versucht haben, den Preis weiter nach oben zu treiben, aber die Verkäufer konnten den Preis wieder nach unten drücken.
Typ: Bearish

FRAMA and Candlestick Patterns [CSM]FRAMA (Fractal Adaptive Moving Average) is a technical analysis indicator that adapts its smoothing period according to the market's volatility, allowing it to provide accurate signals in all market conditions. This indicator script plots the FRAMA on a chart and generates buy and sell signals based on the FRAMA and candlestick patterns. It also includes an option to filter signals based on bullish and bearish engulfing patterns.
To detect candlestick patterns, the script imports the "BankNifty_CSM" library from the creator's public library on TradingView. The FRAMA calculation is done using a loop that iterates over the last "length" number of bars, with the smoothing factor adjusted based on the "fracDim" parameter.
The buy and sell signals are generated based on the position of the current price relative to the FRAMA line. If the "engulfing" parameter is set to true, the signals are further filtered based on bullish and bearish engulfing patterns.
Overall, this script combines various technical indicators and candlestick pattern recognition to provide a complete trading strategy. However, as with any trading strategy, it should be thoroughly backtested and evaluated before using it in a live trading environment.
