BreakFixThis script is solely for my own use as a private development script for breaking/fixing, testing, and troubleshooting updates of my other scripts before releasing them publicly.
There will be no responses from me to comments regarding this script.
Search in scripts for "Candlestick"

Big Candles v1This script simply takes a user-defined bar height number (variable barHeight) to find large candles. Automatically colors large bullish and bearish candles green or red, respectively. The barHeight can be modified to fit your needs.
Use this in a variety of ways:
- Confirm breakouts of support / resistance
- Identify new trends
3 Red / 3 Green Strategy with Volatility CheckStrategy Name: 3 Red / 3 Green Strategy with Volatility Check by AlgoTradeKit
Overview
This long-only strategy is designed for daily bars on NASDAQ (or similar instruments) and combines simple price action with a volatility filter. It “tells it like it is” – enter when the market shows weakness, but only in sufficiently volatile conditions, and exit either on signs of a reversal or after a set number of days.
Entry Conditions
- Price Action :
Enter a long position when there are 3 consecutive red days (each day's close is below its open).
- Volatility Filter :
The entry is allowed only if the current ATR (Average True Range) calculated over the specified ATR Period (default 12) is greater than its 30-day simple moving average. This ensures the market has enough volatility to justify the trade.
Exit Conditions
- Reversal Signal :
Exit the long position when 3 consecutive green days occur (each day's close is above its open), signaling a potential reversal.
- Time Limit :
Regardless of market conditions, any open trade is closed if it reaches the Maximum Trade Duration (default 22 days). This helps limit exposure during stagnant or unfavorable market conditions.
- You can toggle the three-green-day exit if you want to isolate the time-based exit.
Input Parameters
- Maximum Trade Duration (days): Default is 22 days.
- ATR Period: Default is 12.
- Use 3 Green Days Exit: Toggle to enable or disable the three-green-day exit condition.
How It Works
1. Entry: The strategy monitors daily price action for 3 consecutive down days. When this occurs and if the market is volatile enough (current ATR > 30-day ATR average), it opens a long position.
2. Exit: The position is closed if the price action reverses with 3 consecutive up days or if the trade has been open for the maximum allowed duration - i.e. use it on daily chart.
Risk Management
- The built-in maximum trade duration prevents trades from lingering too long in a non-trending or consolidating market.
- The volatility filter helps ensure that trades are only taken when there is sufficient price movement, potentially increasing the odds of a meaningful move.
Disclaimer
This strategy is provided “as is” without any warranties. It is essential to backtest and validate the performance on your specific instrument and market conditions before deploying live capital. Trading involves significant risk, and you should adjust parameters to match your risk tolerance.
Test and tweak this strategy to see if it fits your trading style and market conditions. Happy trading!

V Bottom & V Top Pattern [Misu]█ This indicator shows V bottom & V top patterns as well as potential V bottom & V top.
These V bottom & V top are chart powerful reversal patterns.
They appear in all markets and time-frames, but due to the nature of the aggressive moves that take place when a market reverses direction, it can be difficult to identify this pattern in real-time.
To address this problem, I added potential V pattern as well as the confirmed one.
█ Usages:
You can use V top & V bottoms for reversal zones.
You can use it for scalping strategies, as a main buy & sell signal.
Potential V patterns can be used to anticipate the market, in addition to volatility or momentum indicators, for example.
█ How it works?
This indicator uses pivot points to determine potential V patterns and confirm them.
Paramaters are available to filter breakouts of varying strengths.
Patterns also have a "max number bars" to be validated.
█ Why a Strategy type indicator?
Due to the many different parameters, this indicator is a strategy type.
This way you can overview the best settings depending on your pair & timeframe.
Parameters are available to filter.
█ Parameters:
Deviation: Parameter used to calculate parameters.
Depth: Parameter used to calculate parameters.
Confirmation Type: Type of signal used to confirme the pattern.
> Mid Pivot: pattern will confirm on mid pivot breakout.
> Opposit Pivot: pattern will confirm on opposit pivot breakout.
> No confirmation: no confirmation.
Lenght Avg Body: Lenght used to calculate the average body size.
First Breakout Factor: This factor multiplied by the "body avg" filters out the non-significant breakout of potential V pattern.
Confirmation Breakout Factor: This factor multiplied by the "body avg" filters out the non-significant breakout for the confirmation.
Max Bars Confirmation: The maximum number of bars needed to validate the pattern.

IBS (Internal Bar Strength) Trading Strategy for SPY and NDQImplementation by AlgoTradeKit
Overview
The IBS Trading Strategy is a daily bars long-only trading system, based on the concept of Internal Bar Strength (IBS). The strategy aims to identify potential reversals by monitoring how the previous bar’s close positions itself within its high-low range. It is suitable for stock and US indices. The default parameters are optimized for SPY/SPX and NDQ/QQQ
Strategy Concept
The Internal Bar Strength (IBS) is calculated using the formula:
IBS = (Previous Close - Previous Low) / (Previous High - Previous Low)
This value always lies between 0 and 1. An IBS value below 0.2 is typically interpreted as an oversold condition, while a value above 0.9 suggests an overbought state.
Trading Rules
- Long Entry :
- Condition 1 : IBS is below the user-defined entry threshold (default is 0.2).
- Condition 2 : The current price is above an N-period Exponential Moving Average (EMA) (default period is 252).
- Note : You can disable the EMA condition by setting the EMA period to 0.
- Long Exit
- The position is closed when IBS rises above the user-defined exit threshold (default is 0.9).
Customization Options
- IBS Entry Threshold : Adjust to set the sensitivity for entering a long trade based on oversold conditions.
- IBS Exit Threshold : Customize to define the exit point when the market becomes overbought.
- EMA Period : Set the lookback period for the EMA to align with your trend bias; disable this condition by setting the period to 0.
Risk Management & Trading Considerations
- Designed for daily charts, the strategy captures higher timeframe trends and minimizes noise.
- The entry and exit conditions are straightforward, aiming to avoid over-trading while letting clear signals dictate trade management.
- Always use proper risk management techniques and test the strategy thoroughly on historical data and in a simulated environment before applying it in live markets.
Disclaimer
This strategy is for educational and informational purposes only and does not constitute financial advice. Trading involves risk, and past performance is not indicative of future results. Always conduct your own research and consider your risk tolerance before making any trades.

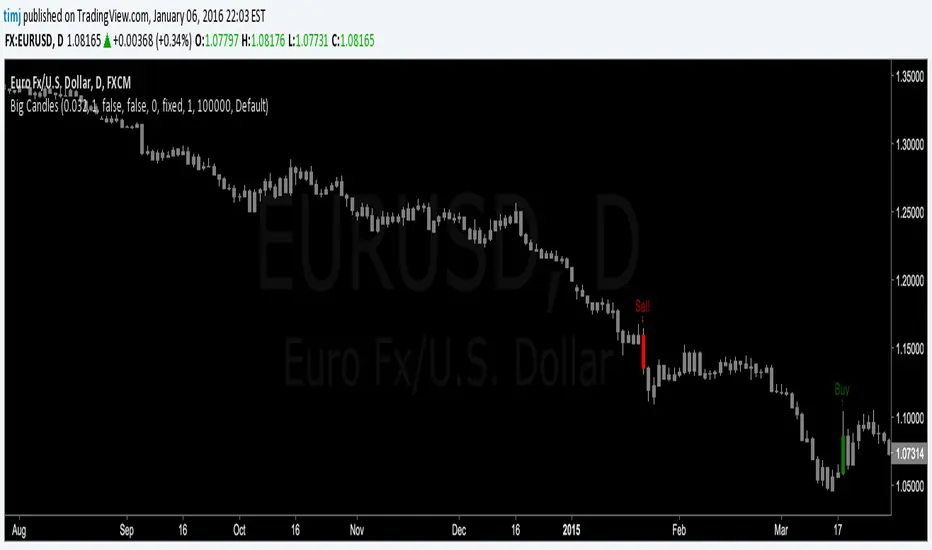
ChitukiProduced according to Bitcoin and Ethereum 1D, 1W, and 1M candle charts.
When you use it for general stock charts or altcoins, make sure to backtest it thoroughly before using it.
*To facilitate backtesting, this have a vertical line that allows you to easily specify the start time.😍
This indicator is simply based on the Engulfing patterns.
I focused on finding inflection points and wrote them based on 1D chart.
▲▼ Small and fat arrows: Displays simple engulfing patterns.
(Displays only those whose lengths differ by at least 1.2 times from each other)
↑↓ Slim and long arrows: Displays actual trading. (Backtesting reflects this.)
Compare the 7 lowest points to find the bullish Engulfing .
Compare the 14 highest points to find the Bearish Engulfing .
Switch the long and short positions to each other.
Long/short position entry at the market price, mid-price, and closing price of Engulfing Candles.
The charts from 2014 to January 2023 were back-tested and the error ranges were calculated and adjusted in detail.
In conclusion, you can think of it as an Engulfing Pattern Finder tailored to the Bitcoin chart.
This is how I did trading before I made this indicator, and I programmed the trading method as an indicator and I think it's pretty reliable but...
Please don't blindly trust ONLY the indicator(s).
///Properties setting Recommend///
Base currency : USD
Oder size : 18% of equity
Pyramiding : 21 (in plenty / Bcuz one deal is divided into three times.)
Commission : according to the exchange's commission
Recalculate : None
Margin : never less than 50%

3 Candle Strike StretegyMainly developed for AMEX:SPY trading on 1 min chart. But feel free to try on other tickers.
Basic idea of this strategy is to look for 3 candle reversal pattern within trending market structure. The 3 candle reversal pattern consist of 3 consecutive bullish or bearish candles,
followed by an engulfing candle in the opposite direction. This pattern usually signals a reversal of short term trend. This strategy also uses multiple moving averages to filter long or short
entries. ie. if the 21 smoothed moving average is above the 50, only look for long (bullish) entries, and vise versa. There is option change these moving average periods to suit your needs.
I also choose to use Linear Regression to determine whether the market is ranging or trending. It seems the 3 candle pattern is more successful under trending market. Hence I use it as a filter.
There is also an option to combine this strategy with moving average crossovers. The idea is to look for 3 candle pattern right after a fast moving average crosses over a slow moving average.
By default , 21 and 50 smoothed moving averages are used. This gives additional entry opportunities and also provides better results.
This strategy aims for 1:3 risk to reward ratio. Stop losses are calculated using the closest low or high values for long or short entries, respectively, with an offset using a percentage of
the daily ATR value. This allows some price fluctuation without being stopped out prematurely. Price target is calculated by multiplying the difference between the entry price and the stop loss
by a factor of 3. When price target is reach, this strategy will set stop loss at the price target and wait for exit condition to maximize potential profit.
This strategy will exit an order if an opposing 3 candle pattern is detected, this could happen before stop loss or price target is reached, and may also happen after price target is reached.
*Note that this strategy is designed for same day SPY option scalping. I haven't determined an easy way to calculate the # of contracts to represent the equivalent option values. Plus the option
prices varies greatly depending on which strike and expiry that may suits your trading style. Therefore, please be mindful of the net profit shown. By default, each entry is approximately equal
to buying 10 of same day or 1 day expiry call or puts at strike $1 - $2 OTM. This strategy will close all open trades at 3:45pm EST on Mon, Wed, and Fri.
**Note that this strategy also takes into account of extended market data.
***Note pyramiding is set to 2 by default, so it allows for multiple entries on the way towards price target.
Remember that market conditions are always changing. This strategy was only able to be back-tested using 1 month of data. This strategy may not work the next month. Please keep that in mind.
Also, I take no credit for any of the indicators used as part of this strategy.
Enjoy~

The 950 Bar StrategyNQ 9:50 AM Candle Strategy v3 (Trade at 9:55AM) - 1 Contract
Also called the 950 Standard. The 950 Strategy.
This strategy places its trade at 9:55am each day based on the close of the 9:50am candle. Uses 5min timeframe candles. If candle closes red, or bearish, the strategy goes short. If candle closes green, or bullish, the strategy goes long. Brackets are 150tick TP and 200tick SL.

Equilibrium Candles + Pattern [Honestcowboy]The Equilibrium Candles is a very simple trend continuation or reversal strategy depending on your settings.
How an Equilibrium Candle is created:
We calculate the equilibrium by measuring the mid point between highest and lowest point over X amount of bars back.
This now is the opening price for each bar and will be considered a green bar if price closes above equilibrium.
Bars get shaded by checking if regular candle close is higher than open etc. So you still see what the normal candles are doing.
Why are they useful?
The equilibrium is calculated the same as Baseline in Ichimoku Cloud. Which provides a point where price is very likely to retrace to. This script visualises the distance between close and equilibrium using candles. To provide a clear visual of how price relates to this equilibrium point.
This also makes it more straightforward to develop strategies based on this simple concept and makes the trader purely focus on this relationship and not think of any Ichimoku Cloud theories.
Script uses a very simple pattern to enter trades:
It will count how many candles have been one directional (above or below equilibrium)
Based on user input after X candles (7 by default) script shows we are in a trend (bg colors)
On the first pullback (candle closes on other side of equilibrium) it will look to enter a trade.
Places a stop order at the high of the candle if bullish trend or reverse if bearish trend.
If based on user input after X opposite candles (2 by default) order is not filled will cancel it and look for a new trend.
Use Reverse Logic:
There is a use reverse logic in the settings which on default is turned on. It will turn long orders into short orders making the stop orders become limit orders. It will use the normal long SL as target for the short. And TP as stop for the short. This to provide a means to reverse equity curve in case your pair is mean reverting by nature instead of trending.
ATR Calculation:
Averaged ATR, which is using ta.percentile_nearest_rank of 60% of a normal ATR (14 period) over the last 200 bars. This in simple words finds a value slightly above the mean ATR value over that period.
Big Candle Exit Logic:
Using Averaged ATR the script will check if a candle closes X times that ATR from the equilibrium point. This is then considered an overextension and all trades are closed.
This is also based on user input.
Simple trade management logic:
Checks if the user has selected to use TP and SL, or/and big candle exit.
Places a TP and SL based on averaged ATR at a multiplier based on user Input.
Closes trade if there is a Big Candle Exit or an opposite direction signal from indicator.
Script can be fully automated to MT5
There are risk settings in % and symbol settings provided at the bottom of the indicator. The script will send alert to MT5 broker trying to mimic the execution that happens on tradingview. There are always delays when using a bridge to MT5 broker and there could be errors so be mindful of that. This script sends alerts in format so they can be read by tradingview.to which is a bridge between the platforms.
Use the all alert function calls feature when setting up alerts and make sure you provide the right webhook if you want to use this approach.
There is also a simple buy and sell alert feature if you don't want to fully automate but still get alerts. These are available in the dropdown when creating an alert.
Almost every setting in this indicator has a tooltip added to it. So if any setting is not clear hover over the (?) icon on the right of the setting.
The backtest uses a 4% exposure per trade and a 10 point slippage. I did not include a commission cause I'm not personaly aware what the commissions are on most forex brokers. I'm only aware of minimal slippage to use in a backtest. Trading conditions vary per broker you use so always pay close attention to trading costs on your own broker. Use a full automation at your own risk and discretion and do proper backtesting.

Hobbiecode - SP500 IBS + HigherThis is a simple strategy that is working well on SPY but also well performing on Mini Futures SP500. The strategy is composed by the followin rules:
1. Today is Monday.
2. The close must be lower than the close on Friday.
3. The IBS must be below 0.5.
4. If 1-3 are true, then enter at the close.
5. Sell 5 trading days later (at the close).
If you backtest it on Mini Futures SP500 you will be able to track data from 1993. It is important to select D1 as timeframe.
Please share any comment or idea below.
Have a good trading,
Ramón.

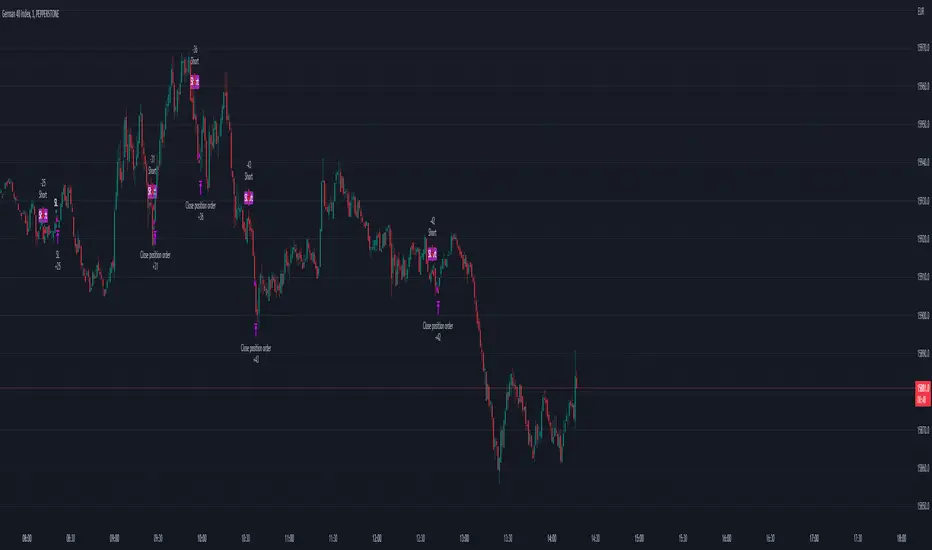
FVG Strategy - Fair Value GapThe Fair Value Gap Strategy (FVG) is a trading approach that relies on price action analysis and involves identifying market inefficiencies or imbalances.
The strategy offers a variety of customizable settings to match your preferences and includes an entry and exit strategy to guide you through trades.
The script operates in the following manner:
It begins by searching for fair-value-gaps and subsequently identifies a break in structure.
The next step involves waiting for the price to retrace within the previously established fair value gap.
Within this gap, there is a Fibonacci retracement that must be reached before placing a stop-order.
Example: GER40, 1min Chart
STOP LOSS & RISK MANAGEMENT
FVG : The stop loss will be set at the end of the fair value gap
Last Swing : The stop loss will be at the last swing high/low
ATR (Average True Range) : The stop loss will be placed one 'Average True Range' away from the entry
TAKE PROFIT
Pips/Points : The stop loss will be set at the chosen amount of pips/points.
RiskReward TP : This is a fixed take profit where you can set a specific risk-to-reward ratio for the trade. For example, you can set a 1:3 risk-to-reward ratio.
Trailing Stop : This is a flexible stop that moves with the market price, allowing you to capture more profit as the trade moves in your favor.
Both : This option combines both the RiskReward TP and Trailing Stop. If the price target is set at a 1:3 risk-to-reward ratio, the trailing stop will move with the price until either the stop or take profit is reached, and the position will be closed completely.
THE FVG SECTION
In the FVG section, you will have the ability to customize your settings based on your specific requirements.
Firstly, you will have the choice of two possible entry options:
Candle Close : This option triggers the order once the candle has completely closed and all the set requirements are met.
Stop Orders : This option triggers the order once all the set requirements are met, even if the candle is still active and has not yet closed.
On top, you can activate the "Pinbar-Trading", that will allow you to take a trade on a pinbar, even when the candle just dipped into the FVG and snapped back.
FAIR VALUE GAP TYPE
On volatile market, it may happen that a massive FVG is created. Thats why we have separated the FVG into 2 different variables.
FVG Type: Normal : This is all regular FVG that meet the requirement of you minimum size range. As example FVG must be minimum 5$ big.
FVG Type: Big : This are all big FVG that meet the minimum set size range. The difference to the "normal" type, the stop loss will be set at 50% of the Big-FVG.
FIBONACCI RETRACEMENT & MARKET STRUCTURE
To refine the FVG strategy, you have three options:
Fibonacci Retracement Value (%) : The FVG strategy employs a Fibonacci retracement, which allows you to trade in the direction of the market movement. To initiate the order, the price must reach a predetermined Fibonacci level and then rebound.
Formation-to-Retracement Countdown: : This option provides you with a specified number of candles to meet the necessary conditions. For example, if the order is not triggered within 20 candles, delete the FVG-Zone and skip the trade to avoid getting caught in a sideways ranging trend.
Structure Lookback : This feature filters out older FVG Zones. You can specify the number of candles that should mark the FVG Zones. Keep in mind that newer and fresher zones will automatically conceal older ones.
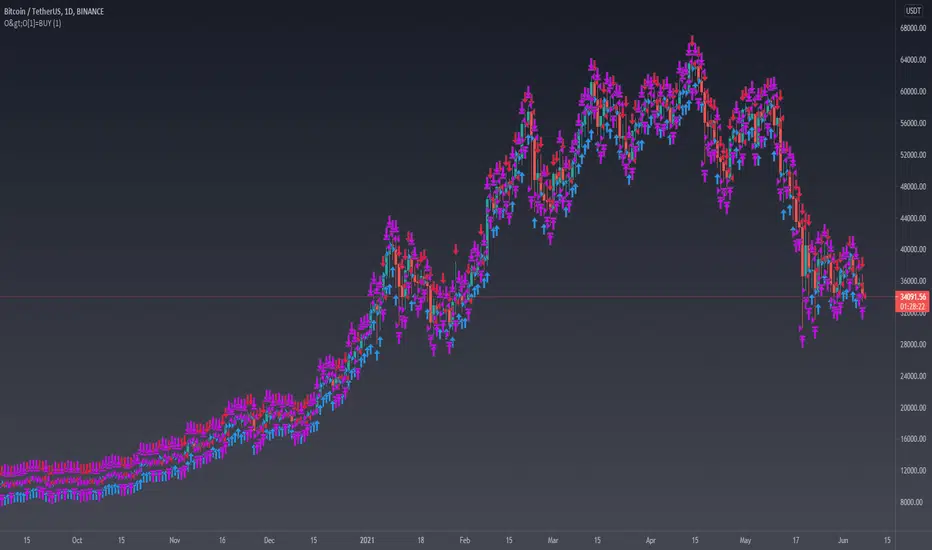
open>open[1]=BUY_else_SELLsimple script. enter rule is open>open =BUY_else_SELL (open means open price 1 candle ago, so basically its if price now greater than price 1 candle ago...)
exit rule is Trailing Stop.
1 trade per candle, here on daily chart BTCUSDT with binance commision included in result.
254 million percent profit....
😲
Trailing EngulferTrailing Engulfer is a price action strategy that uses trailing orders that makes use of any timeframe although shorter timeframes are typically used with price action trading. due to it being price action related, there are some differences needed when trading with different assets. This strategy is recommended to be used for stocks and futures only although it can be used on others. There are two specific inputs that pertain to futures: trailing trigger and trailing offset. Futures price changes in ticks and tick values are supposed to be used here, whereas the percentage fields are primarily for stocks.
Inputs:
Futures: Trailing Trigger - used for futures only and the value represents the number of ticks you wish for a trailing order to enter. For example: if set to 4 ticks, the trailing stop will not be created until after 4 ticks of profit has been reached.
Futures: Trailing Offset - used for futures only and the value represents the number of ticks you wish the stop to trail the price. For example: if set trigger is set to 4 and offset is set to 3, then the trailing stop order will be created once a profit of 4 ticks has been reached and the trailing stop will be 3 ticks against you.
Max Loss (%) - used for stocks only and the value represents the maximum loss you are willing to take in case the trailing stop hasn't yet been made. For example: you wish the trailing stop to be created once it has made 1% profit. If it never reaches that, it will close at this Max Loss value.
Trailing Trigger (%) - used for stocks only. It works similar to the futures trigger other than the fact that it uses % rather than ticks.
Trailing Offset (%) - used for stocks only. It works similar to the futures trigger offset other than the fact that it uses % rather than ticks.
Futures also have a "Max Loss" but it is not user defined. For futures, the max loss is not based on a tick loss but rather entirely on the asset's price action.
Futures also makes use of shorting.

Noro's BottomSensivity v0.6 strategy + rsi + AlarmThe original indicator is Noro's BottomSensivity v0.6
I simply turned noro's bottom sensibility 6.0 indicator, which I consider a great tool to find market bottom, into a strategy.
I also added an additional RSI filter with inputs that can be set by the user for entry and exit from the market.
I have tried to insert an alarm so that I can be notified when this particular purchase condition is formed.
I also tried to insert an additional filter that would allow me to make further pyramid purchases only after a certain percentage of drawdown from the first entry so as to reduce the average purchase price but I was not able ... if someone could implement this I would appreciate it.
Well..this is the first time that I try to program / modify a strategy / indicator, there are certainly some gross errors (as in my English too), please forgive me, I will appreciate the corrections that more experienced users will want to make.
I wish you all a good day, pfjons

ARVEX V1“Failed Reversal – Opposite Candle Only (No Doji/Hammer/Hanging Man)”:
This strategy captures failed reversal attempts where the current candle is opposite to the previous candle and volume is higher. It enters long if a bearish candle fails to break a previous bullish candle’s low, and short if a bullish candle fails to break a previous bearish candle’s high. Signals are canceled for Doji, Hammer, or Hanging Man candles. Entries only, fully backtestable.

Smart Money Bot [MTF Confluence Edition]Uses multi-time frame analysis and supply and demand strategy.
Best used when swing trading.

USOIL BOS Retest Strategy 2.0 This is generating 4.73% return nothing wow but will form the base of my trading engine

Nuaing Trend Zone + Trade Guide PRO Multi TF + Structure Nuaing Trend Zone + Trade Guide PRO Multi TF + Structure

Simple ICT Sweep + FVG (LuxAlgo Swings FIXED)something i created if anyone can improve it or change for better visual

New ALASMARThis is an update version of my strategy. You all are welcome for any notifications.
best regards,
Alasmar

Hammer Strategy (CLOSE ON NEXT BAR) [WORKING]Adjustable hammer and inverted hammer candle
Ham? INV? is the hammer
Entry on HAM, INV OR HAM?, INV? close next bar

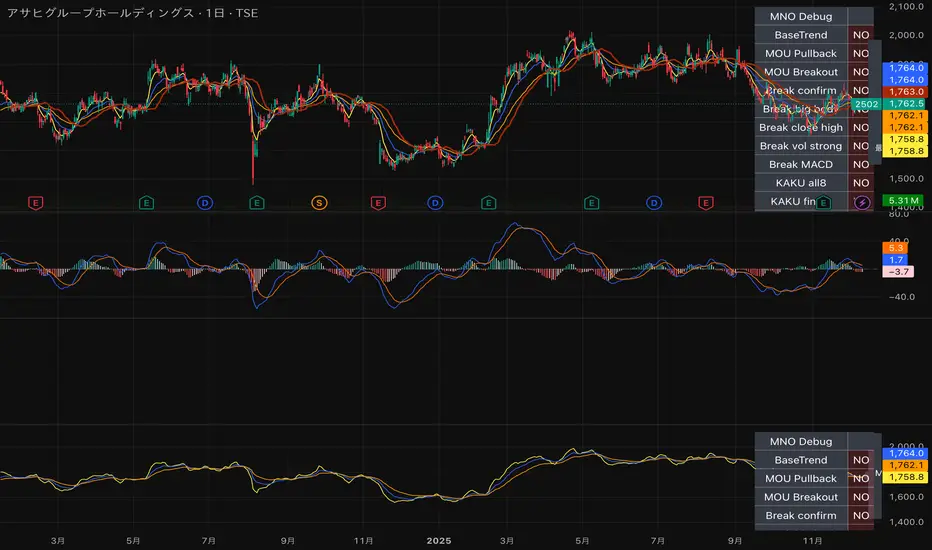
MNO_2Step_Strategy_MOU_KAKU (Publish-Clear)//@version=5
strategy("MNO_2Step_Strategy_MOU_KAKU (Publish-Clear)", overlay=true, pyramiding=0,
max_labels_count=500, max_lines_count=500,
initial_capital=100000,
default_qty_type=strategy.percent_of_equity, default_qty_value=10)
// =========================
// Inputs
// =========================
emaSLen = input.int(5, "EMA Short (5)")
emaMLen = input.int(13, "EMA Mid (13)")
emaLLen = input.int(26, "EMA Long (26)")
macdFast = input.int(12, "MACD Fast")
macdSlow = input.int(26, "MACD Slow")
macdSignal = input.int(9, "MACD Signal")
macdZeroTh = input.float(0.2, "MOU: MACD near-zero threshold", step=0.05)
volLookback = input.int(5, "Volume MA days", minval=1)
volMinRatio = input.float(1.3, "MOU: Volume ratio min", step=0.1)
volStrong = input.float(1.5, "Strong volume ratio (Breakout/KAKU)", step=0.1)
volMaxRatio = input.float(3.0, "Volume ratio max (filter)", step=0.1)
wickBodyMult = input.float(2.0, "Pinbar: lowerWick >= body*x", step=0.1)
pivotLen = input.int(20, "Resistance lookback", minval=5)
pullMinPct = input.float(5.0, "Pullback min (%)", step=0.1)
pullMaxPct = input.float(15.0, "Pullback max (%)", step=0.1)
breakLookbackBars = input.int(5, "Pullback route: valid bars after break", minval=1)
// --- Breakout route (押し目なし初動ブレイク) ---
useBreakoutRoute = input.bool(true, "Enable MOU Breakout Route (no pullback)")
breakConfirmPct = input.float(0.3, "Break confirm: close > R*(1+%)", step=0.1)
bigBodyLookback = input.int(20, "Break candle body MA length", minval=5)
bigBodyMult = input.float(1.2, "Break candle: body >= MA*mult", step=0.1)
requireCloseNearHigh = input.bool(true, "Break candle: close near high")
closeNearHighPct = input.float(25.0, "Close near high threshold (% of range)", step=1.0)
allowMACDAboveZeroInstead = input.bool(true, "Breakout route: allow MACD GC above zero instead")
// 表示
showEMA = input.bool(true, "Plot EMAs")
showMouLabels = input.bool(true, "Show MOU/MOU-B labels")
showKakuLabels = input.bool(true, "Show KAKU labels")
showDebugTbl = input.bool(true, "Show debug table (last bar)")
showStatusLbl = input.bool(true, "Show status label (last bar always)")
locChoice = input.string("Below Bar", "Label location", options= )
lblLoc = locChoice == "Below Bar" ? location.belowbar : location.abovebar
// =========================
// 必ず決済が起きる設定(投稿クリア用)
// =========================
enableTPSL = input.bool(true, "Enable TP/SL")
tpPct = input.float(2.0, "Take Profit (%)", step=0.1, minval=0.1) // ←投稿クリア向けに近め
slPct = input.float(1.0, "Stop Loss (%)", step=0.1, minval=0.1) // ←投稿クリア向けに近め
maxHoldBars = input.int(30, "Max bars in trade (force close)", minval=1)
entryMode = input.string("MOU or KAKU", "Entry trigger", options= )
// ✅ 保険:トレード0件を避ける(投稿クリア用)
// 1回でもクローズトレードができたら自動で沈黙
publishAssist = input.bool(true, "Publish Assist (safety entry if 0 trades)")
// =========================
// EMA
// =========================
emaS = ta.ema(close, emaSLen)
emaM = ta.ema(close, emaMLen)
emaL = ta.ema(close, emaLLen)
plot(showEMA ? emaS : na, color=color.new(color.yellow, 0), title="EMA 5")
plot(showEMA ? emaM : na, color=color.new(color.blue, 0), title="EMA 13")
plot(showEMA ? emaL : na, color=color.new(color.orange, 0), title="EMA 26")
emaUpS = emaS > emaS
emaUpM = emaM > emaM
emaUpL = emaL > emaL
goldenOrder = emaS > emaM and emaM > emaL
above26_2days = close > emaL and close > emaL
baseTrendOK = (emaUpS and emaUpM and emaUpL) and goldenOrder and above26_2days
// =========================
// MACD
// =========================
= ta.macd(close, macdFast, macdSlow, macdSignal)
macdGC = ta.crossover(macdLine, macdSig)
macdUp = macdLine > macdLine
macdNearZero = math.abs(macdLine) <= macdZeroTh
macdGCAboveZero = macdGC and macdLine > 0 and macdSig > 0
macdMouOK = macdGC and macdNearZero and macdUp
macdBreakOK = allowMACDAboveZeroInstead ? (macdMouOK or macdGCAboveZero) : macdMouOK
// =========================
// Volume
// =========================
volMA = ta.sma(volume, volLookback)
volRatio = volMA > 0 ? (volume / volMA) : na
volumeMouOK = volRatio >= volMinRatio and volRatio <= volMaxRatio
volumeStrongOK = volRatio >= volStrong and volRatio <= volMaxRatio
// =========================
// Candle patterns
// =========================
body = math.abs(close - open)
upperWick = high - math.max(open, close)
lowerWick = math.min(open, close) - low
pinbar = (lowerWick >= wickBodyMult * body) and (lowerWick > upperWick) and (close >= open)
bullEngulf = close > open and close < open and close >= open and open <= close
bigBull = close > open and open < emaM and close > emaS and (body > ta.sma(body, 20))
candleOK = pinbar or bullEngulf or bigBull
// =========================
// Resistance / Pullback route
// =========================
res = ta.highest(high, pivotLen)
pullbackPct = res > 0 ? (res - close) / res * 100.0 : na
pullbackOK = pullbackPct >= pullMinPct and pullbackPct <= pullMaxPct
brokeRes = ta.crossover(close, res )
barsSinceBreak = ta.barssince(brokeRes)
afterBreakZone = (barsSinceBreak >= 0) and (barsSinceBreak <= breakLookbackBars)
pullbackRouteOK = afterBreakZone and pullbackOK
// =========================
// Breakout route (押し目なし初動ブレイク)
// =========================
breakConfirm = close > res * (1.0 + breakConfirmPct / 100.0)
bullBreak = close > open
bodyMA = ta.sma(body, bigBodyLookback)
bigBodyOK = bodyMA > 0 ? (body >= bodyMA * bigBodyMult) : false
rng = math.max(high - low, syminfo.mintick)
closeNearHighOK = not requireCloseNearHigh ? true : ((high - close) / rng * 100.0 <= closeNearHighPct)
mou_breakout = useBreakoutRoute and baseTrendOK and breakConfirm and bullBreak and bigBodyOK and closeNearHighOK and volumeStrongOK and macdBreakOK
mou_pullback = baseTrendOK and volumeMouOK and candleOK and macdMouOK and pullbackRouteOK
mou = mou_pullback or mou_breakout
// =========================
// KAKU (Strict): 8条件 + 最終三点
// =========================
cond1 = emaUpS and emaUpM and emaUpL
cond2 = goldenOrder
cond3 = above26_2days
cond4 = macdGCAboveZero
cond5 = volumeMouOK
cond6 = candleOK
cond7 = pullbackOK
cond8 = pullbackRouteOK
all8_strict = cond1 and cond2 and cond3 and cond4 and cond5 and cond6 and cond7 and cond8
final3 = pinbar and macdGCAboveZero and volumeStrongOK
kaku = all8_strict and final3
// =========================
// Entry (strategy)
// =========================
entrySignal = entryMode == "KAKU only" ? kaku : (mou or kaku)
canEnter = strategy.position_size == 0
newEntryKaku = canEnter and kaku and entrySignal
newEntryMouB = canEnter and (not kaku) and mou_breakout and entrySignal
newEntryMou = canEnter and (not kaku) and mou_pullback and entrySignal
// --- Publish Assist(保険エントリー) ---
// 条件が厳しすぎて「トレード0件」だと投稿時に警告が出る。
// closedtradesが0の間だけ、軽いEMAクロスで1回だけ拾う(その後は沈黙)。
assistFast = ta.ema(close, 5)
assistSlow = ta.ema(close, 20)
assistEntry = publishAssist and strategy.closedtrades == 0 and canEnter and ta.crossover(assistFast, assistSlow)
// 実エントリー
if newEntryKaku or newEntryMouB or newEntryMou or assistEntry
strategy.entry("LONG", strategy.long)
// ラベル(視認)
if showMouLabels and newEntryMou
label.new(bar_index, low, "猛(IN)", style=label.style_label_up, color=color.new(color.lime, 0), textcolor=color.black)
if showMouLabels and newEntryMouB
label.new(bar_index, low, "猛B(IN)", style=label.style_label_up, color=color.new(color.lime, 0), textcolor=color.black)
if showKakuLabels and newEntryKaku
label.new(bar_index, low, "確(IN)", style=label.style_label_up, color=color.new(color.yellow, 0), textcolor=color.black)
if assistEntry
label.new(bar_index, low, "ASSIST(IN)", style=label.style_label_up, color=color.new(color.aqua, 0), textcolor=color.black)
// =========================
// Exit (TP/SL + 強制クローズ)
// =========================
inPos = strategy.position_size > 0
tpPx = inPos ? strategy.position_avg_price * (1.0 + tpPct/100.0) : na
slPx = inPos ? strategy.position_avg_price * (1.0 - slPct/100.0) : na
if enableTPSL
strategy.exit("TP/SL", from_entry="LONG", limit=tpPx, stop=slPx)
// 最大保有バーで強制決済(これが「レポート無し」回避の最後の保険)
var int entryBar = na
if strategy.position_size > 0 and strategy.position_size == 0
entryBar := bar_index
if strategy.position_size == 0
entryBar := na
forceClose = inPos and not na(entryBar) and (bar_index - entryBar >= maxHoldBars)
if forceClose
strategy.close("LONG")
// =========================
// 利確/損切/強制クローズのラベル
// =========================
closedThisBar = (strategy.position_size > 0) and (strategy.position_size == 0)
avgPrev = strategy.position_avg_price
tpPrev = avgPrev * (1.0 + tpPct/100.0)
slPrev = avgPrev * (1.0 - slPct/100.0)
hitTP = closedThisBar and high >= tpPrev
hitSL = closedThisBar and low <= slPrev
// 同一足TP/SL両方は厳密に判断できないので、表示は「TP優先」で簡略(投稿ギリギリ版)
if hitTP
label.new(bar_index, high, "利確", style=label.style_label_down, color=color.new(color.lime, 0), textcolor=color.black)
else if hitSL
label.new(bar_index, low, "損切", style=label.style_label_up, color=color.new(color.red, 0), textcolor=color.white)
else if closedThisBar and forceClose
label.new(bar_index, close, "時間決済", style=label.style_label_left, color=color.new(color.gray, 0), textcolor=color.white)
// =========================
// Signals (猛/猛B/確)
// =========================
plotshape(showMouLabels and mou_pullback and not kaku, title="MOU_PULLBACK", style=shape.labelup, text="猛",
color=color.new(color.lime, 0), textcolor=color.black, location=lblLoc, size=size.tiny)
plotshape(showMouLabels and mou_breakout and not kaku, title="MOU_BREAKOUT", style=shape.labelup, text="猛B",
color=color.new(color.lime, 0), textcolor=color.black, location=lblLoc, size=size.tiny)
plotshape(showKakuLabels and kaku, title="KAKU", style=shape.labelup, text="確",
color=color.new(color.yellow, 0), textcolor=color.black, location=lblLoc, size=size.small)
// =========================
// Alerts
// =========================
alertcondition(mou, title="MNO_MOU", message="MNO: MOU triggered")
alertcondition(mou_breakout, title="MNO_MOU_BREAKOUT", message="MNO: MOU Breakout triggered")
alertcondition(mou_pullback, title="MNO_MOU_PULLBACK", message="MNO: MOU Pullback triggered")
alertcondition(kaku, title="MNO_KAKU", message="MNO: KAKU triggered")
alertcondition(assistEntry, title="MNO_ASSIST_ENTRY", message="MNO: ASSIST ENTRY (publish safety)")
// =========================
// Status label(最終足に必ず表示)
// =========================
var label status = na
if showStatusLbl and barstate.islast
label.delete(status)
statusTxt =
"MNO RUNNING\n" +
"ClosedTrades: " + str.tostring(strategy.closedtrades) + "\n" +
"BaseTrend: " + (baseTrendOK ? "OK" : "NO") + "\n" +
"MOU: " + (mou ? "YES" : "no") + " (猛=" + (mou_pullback ? "Y" : "n") + " / 猛B=" + (mou_breakout ? "Y" : "n") + ")\n" +
"KAKU: " + (kaku ? "YES" : "no") + "\n" +
"VolRatio: " + (na(volRatio) ? "na" : str.tostring(volRatio, format.mintick)) + "\n" +
"Pull%: " + (na(pullbackPct) ? "na" : str.tostring(pullbackPct, format.mintick)) + "\n" +
"Pos: " + (inPos ? "IN" : "OUT")
status := label.new(bar_index, high, statusTxt, style=label.style_label_left, textcolor=color.white, color=color.new(color.black, 0))
// =========================
// Debug table(最終足のみ)
// =========================
var table t = table.new(position.top_right, 2, 14, border_width=1, border_color=color.new(color.white, 60))
fRow(_name, _cond, _r) =>
bg = _cond ? color.new(color.lime, 70) : color.new(color.red, 80)
tx = _cond ? "OK" : "NO"
table.cell(t, 0, _r, _name, text_color=color.white, bgcolor=color.new(color.black, 0))
table.cell(t, 1, _r, tx, text_color=color.white, bgcolor=bg)
if showDebugTbl and barstate.islast
table.cell(t, 0, 0, "MNO Debug", text_color=color.white, bgcolor=color.new(color.black, 0))
table.cell(t, 1, 0, "", text_color=color.white, bgcolor=color.new(color.black, 0))
fRow("BaseTrend", baseTrendOK, 1)
fRow("MOU Pullback", mou_pullback, 2)
fRow("MOU Breakout", mou_breakout, 3)
fRow("Break confirm", breakConfirm, 4)
fRow("Break big body", bigBodyOK, 5)
fRow("Break close high", closeNearHighOK, 6)
fRow("Break vol strong", volumeStrongOK, 7)
fRow("Break MACD", macdBreakOK, 8)
fRow("KAKU all8", all8_strict, 9)
fRow("KAKU final3", final3, 10)
fRow("AssistEntry", assistEntry, 11)
fRow("ClosedTrades>0", strategy.closedtrades > 0, 12)
ETH UU Reversion Strategy Strategy Overview
The "ETH UU Reversion Strategy" is a sophisticated mean-reversion trading system designed to capture price reversals at standard deviation extremes. Unlike typical strategies that enter trades immediately at market price, this script employs a proprietary **Limit Order Execution Mechanism** combined with volatility filtering to optimize entry prices and reduce slippage.
Originality & Key Features
This script addresses the common pitfalls of standard Bollinger Band strategies by introducing advanced order management logic:
1. Limit Order Execution:** Instead of market orders, the strategy calculates an optimal entry price based on ATR offsets. This allows traders to capitalize on "wicks" and secure better risk-reward ratios.
2. Smart Timeout Logic:To prevent "catching a falling knife," pending orders are automatically cancelled if not filled within a customizable number of bars (default: 15). This ensures orders do not remain active when market structure shifts.
3. Dynamic Risk Recalculation:** Stop Loss (SL) and Take Profit (TP) levels are recalculated at the exact moment of execution using the real-time ATR, ensuring risk parameters adapt to current market volatility.
How to Use
1. Setup: Apply the strategy to ETH/USDT (or other crypto pairs) on 15m or 1h timeframes.
2. Configuration:
* Adjust `BB Length` and `RSI Length` to fit your timeframe.
* Set `Order Timeout` to define how long a pending order should remain active.
* Toggle `Use ADX Filter` to avoid trading against strong trends.
3. *Visuals: The chart displays distinct labels for pending orders (Gray), active entries (Blue/Red), and cancellations, providing full transparency of the strategy's logic.
Risk Disclaimer
This script is for educational and quantitative analysis purposes only. Past performance regarding backtesting or live trading does not guarantee future results. Cryptocurrency trading involves high risk and high volatility. Please use proper risk management and trade at your own discretion.
-------------------------------------------------------------
Chinese Translation (中文说明)
策略概述
“ETH UU 均值回归策略”是一个旨在捕捉标准差极端位置价格反转的交易系统。与立即以市价入场的典型策略不同,本策略采用独特的**挂单执行机制**结合波动率过滤,以优化入场价格并减少滑点。
原创性与核心功能
本脚本通过引入高级订单管理逻辑,解决了普通布林带策略的常见缺陷:
1. 挂单交易模式: 策略不使用市价单,而是根据 ATR 偏移计算最佳入场价(Limit Orders)。这允许交易者捕捉K线的“影线”,获得更好的盈亏比。
2. 智能超时撤单: 为了防止“接飞刀”,如果挂单在指定K线数内(默认15根)未成交,系统会自动撤单。这确保了当市场结构发生变化时,旧的挂单不会被错误触发。
3. 动态风控重算: 止损和止盈在成交的瞬间根据实时 ATR 重新计算,确保风控参数始终适应当前的市场波动率。
风险提示
本脚本仅供教育和量化分析使用。回测或实盘的过往表现并不预示未来结果。加密货币交易具有极高的风险和波动性,请务必做好仓位管理,并自行承担使用本策略的风险。
