Trojan Cycle: Dip & Profit Hunter📉 Crypto is changing. Your signals should too.
This script doesn’t try to outguess price — it helps you track capital rotation and flow behavior in alignment with the evolving macro structure of the digital asset market.
Trojan Cycle: Dip & Profit Hunter is a signal engine built to support and validate the capital rotation models outlined in the Trojan Cycle and Synthetic Rotation theses — available via RWCS_LTD’s published charts
It is not a classic “buy low, sell high” tool. It is a structural filter that uses price/volume statistics to surface accumulation zones, synthetic traps, and macro context shifts — all aligned with the institutionalization of crypto post-2024.
🧠 Purpose & Value
Crypto no longer follows the retail-led, halving-driven pattern of 2017 or 2021.
Instead, institutional infrastructure, regulatory filters, and equity-market Trojan horses define the new path of capital.
This tool helps you visualize that path by interpreting behavior through statistical imbalances and real-time momentum signals.
Use it to:
Track where capital is accumulating or exiting
Identify signals consistent with true cycle rotation (vs. synthetic traps)
Validate your macro view with real-time statistical context
🔍 How It Works
The engine combines four signal layers:
1. Z-Score Logic
- Measures how far price and volume have deviated from their mean
- Detects dips, blowoffs, and exhaustion zones
2. Percentile Logic
- Compares current price and volume to historical rank distribution
- Flags statistically rare conditions (e.g. bottom 10% price, top 90% volume)
3. Combined Context Engine
- Integrates both models to generate one of 36 unique output states
- Each state provides a labeled market context (e.g., 🟢 Confluent Buy, 🔴 Confluent Sell, 🧨 Synthetic Trap )
4. Momentum Spread & Divergence
- Measures whether price is leading volume (trap risk) or volume is leading price (accumulation)
- Outputs intuitive momentum context with emoji-coded alerts
📋 What You See
🧠 Contextual Table UI with key Z-Scores, percentiles, signals, and market commentary
🎯 Emoji-coded signals to quickly grasp high-probability setups or risk zones
🌊 Optional overlays: price/volume divergence, momentum spread
🎨 Visual table customization (size, position) and chart highlights for signal clarity
🔔 Alert System
✅ Single dynamic alert using alert() that only fires when signal context changes
Prevents alert fatigue and allows clean webhook/automation integration
🧭 Use Cases
For macro cycle traders: Track where we are in the Trojan Cycle using statistical context
For thesis explorers: Use the 36-output signal map to match against your rotation thesis
For capital rotation watchers: Identify structural setups consistent with ETF-driven or compliance-filtered flow
For narrative skeptics: Avoid synthetic altseason traps where volume lags or flow dries up
🧪 Suggested Pairing for Thesis Validation
To use this tool as part of a thesis-confirmation framework , pair it with:
BTC.D — Bitcoin Dominance
ETH/BTC — Ethereum strength vs. Bitcoin
TOTALE100/ETH — Altcoin strength relative to ETH
RWCS_LTD’s published charts and macro cycle models
🏁 Final Note
Crypto has matured. So should your signals.
This tool doesn’t try to game the next 2 candles. It helps you understand the current phase in a compliance-filtered, institutionalized rotation model.
It’s not built for hype — it’s built for conviction.
Explore the thesis → Validate the structure → Trade with clarity.
🚨 Disclaimer
This script is not financial advice. It is an analytical tool designed to support market structure research and rotation thesis validation. Use this as part of a broader framework including technical structure, dominance charts, and macro data.
Search in scripts for "Cycle"

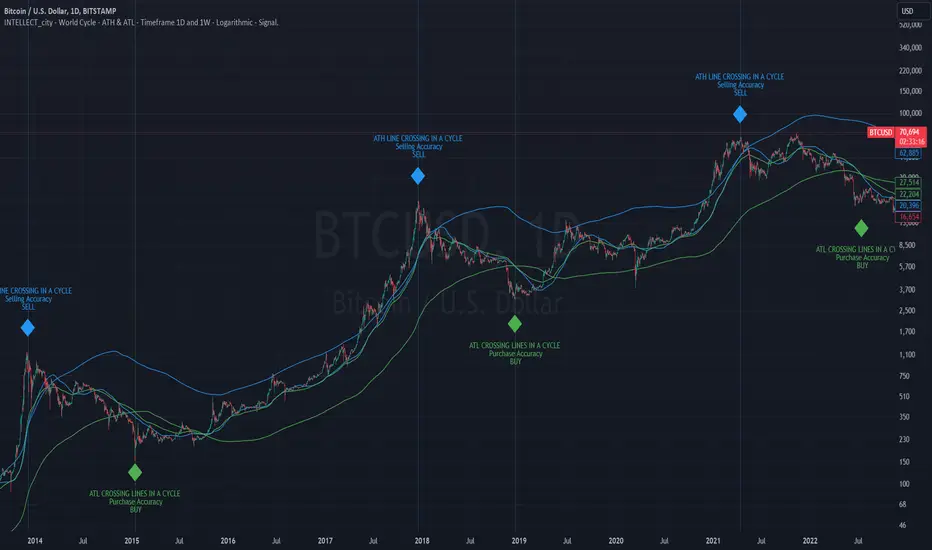
Intelle_city - World Cycle - Ath & Atl - Logarithmic - Strategy.Overview
Indicators: Strategy !
INTELLECT_city - World Cycle - ATH & ATL - Timeframe 1D and 1W - Logarithmic - Strategy - The Pi Cycle Top and Bottom Oscillator is an adaptation of the original Pi Cycle Top chart. It compares the 111-Day Moving Average circle and the 2 * 350-Day Moving Average circle of Bitcoin’s Price. These two moving averages were selected as 350 / 111 = 3.153; An approximation of the important mathematical number Pi.
When the 111-Day Moving Average circle reaches the 2 * 350-Day Moving Average circle, it indicates that the market is becoming overheated. That is because the mid time frame momentum reference of the 111-Day Moving Average has caught up with the long timeframe momentum reference of the 2 * 350-Day Moving Average.
Historically this has occurred within 3 days of the very top of each market cycle.
When the 111 Day Moving Average circle falls back beneath the 2 * 350 Day Moving Average circle, it indicates that the market momentum of that cycle is significantly cooling down. The oscillator drops down into the lower green band shown where the 111 Day Moving Average is moving at a 75% discount relative to the 2 * 350 Day Moving Average.
Historically, this has highlighted broad areas of bear market lows.
IMPORTANT: You need to set a LOGARITHMIC graph. (The function is located at the bottom right of the screen)
IMPORTANT: The INTELLECT_city indicator is made for a buy-sell strategy; there is also a signal indicator from INTELLECT_city
IMPORTANT: The Chart shows all cycles, both buying and selling.
IMPORTANT: Suitable timeframes are 1 daily (recommended) and 1 weekly
-----------------------------
Описание на русском:
-----------------------------
Обзор индикатора
INTELLECT_city - World Cycle - ATH & ATL - Timeframe 1D and 1W - Logarithmic - Strategy - Логарифмический - Сигнал - Осциллятор вершины и основания цикла Пи представляет собой адаптацию оригинального графика вершины цикла Пи. Он сравнивает круг 111-дневной скользящей средней и круг 2 * 350-дневной скользящей средней цены Биткойна. Эти две скользящие средние были выбраны как 350/111 = 3,153; Приближение важного математического числа Пи.
Когда круг 111-дневной скользящей средней достигает круга 2 * 350-дневной скользящей средней, это указывает на то, что рынок перегревается. Это происходит потому, что опорный моментум среднего временного интервала 111-дневной скользящей средней догнал опорный момент импульса длинного таймфрейма 2 * 350-дневной скользящей средней.
Исторически это происходило в течение трех дней после вершины каждого рыночного цикла.
Когда круг 111-дневной скользящей средней опускается ниже круга 2 * 350-дневной скользящей средней, это указывает на то, что рыночный импульс этого цикла значительно снижается. Осциллятор опускается в нижнюю зеленую полосу, показанную там, где 111-дневная скользящая средняя движется со скидкой 75% относительно 2 * 350-дневной скользящей средней.
Исторически это высветило широкие области минимумов медвежьего рынка.
ВАЖНО: Выставлять нужно ЛОГАРИФМИЧЕСКИЙ график. (Находиться функция с правой нижней части экрана)
ВАЖНО: Индикатор INTELLECT_city сделан для стратегии покупок продаж, есть также и сигнальный от INTELLECT_сity
ВАЖНО: На Графике видны все циклы, как на покупку так и на продажу.
ВАЖНО: Подходящие таймфреймы 1 дневной (рекомендовано) и 1 недельный
-----------------------------
Beschreibung - Deutsch
-----------------------------
Indikatorübersicht
INTELLECT_city – Weltzyklus – ATH & ATL – Zeitrahmen 1T und 1W – Logarithmisch – Strategy – Der Pi-Zyklus-Top- und Bottom-Oszillator ist eine Anpassung des ursprünglichen Pi-Zyklus-Top-Diagramms. Er vergleicht den 111-Tage-Gleitenden-Durchschnittskreis und den 2 * 350-Tage-Gleitenden-Durchschnittskreis des Bitcoin-Preises. Diese beiden gleitenden Durchschnitte wurden als 350 / 111 = 3,153 ausgewählt; eine Annäherung an die wichtige mathematische Zahl Pi.
Wenn der 111-Tage-Gleitenden-Durchschnittskreis den 2 * 350-Tage-Gleitenden-Durchschnittskreis erreicht, deutet dies darauf hin, dass der Markt überhitzt. Das liegt daran, dass der Momentum-Referenzwert des 111-Tage-Gleitenden-Durchschnitts im mittleren Zeitrahmen den Momentum-Referenzwert des 2 * 350-Tage-Gleitenden-Durchschnitts im langen Zeitrahmen eingeholt hat.
Historisch gesehen geschah dies innerhalb von 3 Tagen nach dem Höhepunkt jedes Marktzyklus.
Wenn der Kreis des 111-Tage-Durchschnitts wieder unter den Kreis des 2 x 350-Tage-Durchschnitts fällt, deutet dies darauf hin, dass die Marktdynamik dieses Zyklus deutlich nachlässt. Der Oszillator fällt in das untere grüne Band, in dem der 111-Tage-Durchschnitt mit einem Abschlag von 75 % gegenüber dem 2 x 350-Tage-Durchschnitt verläuft.
Historisch hat dies breite Bereiche mit Tiefstständen in der Baisse hervorgehoben.
WICHTIG: Sie müssen ein logarithmisches Diagramm festlegen. (Die Funktion befindet sich unten rechts auf dem Bildschirm)
WICHTIG: Der INTELLECT_city-Indikator ist für eine Kauf-Verkaufs-Strategie konzipiert; es gibt auch einen Signalindikator von INTELLECT_city
WICHTIG: Das Diagramm zeigt alle Zyklen, sowohl Kauf- als auch Verkaufszyklen.
WICHTIG: Geeignete Zeitrahmen sind 1 täglich (empfohlen) und 1 wöchentlich

intellect_city - World Cycle - Ath & Atl - Logarithmic - Signal.Indicator Overview
INTELLECT_city - World Cycle - ATH & ATL - Timeframe 1D and 1W - Logarithmic - Signal - The Pi Cycle Top and Bottom Oscillator is an adaptation of the original Pi Cycle Top chart. It compares the 111-Day Moving Average circle and the 2 * 350-Day Moving Average circle of Bitcoin’s Price. These two moving averages were selected as 350 / 111 = 3.153; An approximation of the important mathematical number Pi.
When the 111-Day Moving Average circle reaches the 2 * 350-Day Moving Average circle, it indicates that the market is becoming overheated. That is because the mid time frame momentum reference of the 111-Day Moving Average has caught up with the long timeframe momentum reference of the 2 * 350-Day Moving Average.
Historically this has occurred within 3 days of the very top of each market cycle.
When the 111 Day Moving Average circle falls back beneath the 2 * 350 Day Moving Average circle, it indicates that the market momentum of that cycle is significantly cooling down. The oscillator drops down into the lower green band shown where the 111 Day Moving Average is moving at a 75% discount relative to the 2 * 350 Day Moving Average.
Historically, this has highlighted broad areas of bear market lows.
IMPORTANT: You need to set a LOGARITHMIC graph. (The function is located at the bottom right of the screen)
IMPORTANT: The INTELLECT_city indicator is made for signal purchases of sales, there is also a strategic one from INTELLECT_city
IMPORTANT: The Chart shows all cycles, both buying and selling.
IMPORTANT: Suitable timeframes are 1 daily (recommended) and 1 weekly
-----------------------------
Описание на русском:
-----------------------------
Обзор индикатора
INTELLECT_city - World Cycle - ATH & ATL - Timeframe 1D and 1W - Logarithmic - Signal - Логарифмический - Сигнал - Осциллятор вершины и основания цикла Пи представляет собой адаптацию оригинального графика вершины цикла Пи. Он сравнивает круг 111-дневной скользящей средней и круг 2 * 350-дневной скользящей средней цены Биткойна. Эти две скользящие средние были выбраны как 350/111 = 3,153; Приближение важного математического числа Пи.
Когда круг 111-дневной скользящей средней достигает круга 2 * 350-дневной скользящей средней, это указывает на то, что рынок перегревается. Это происходит потому, что опорный моментум среднего временного интервала 111-дневной скользящей средней догнал опорный момент импульса длинного таймфрейма 2 * 350-дневной скользящей средней.
Исторически это происходило в течение трех дней после вершины каждого рыночного цикла.
Когда круг 111-дневной скользящей средней опускается ниже круга 2 * 350-дневной скользящей средней, это указывает на то, что рыночный импульс этого цикла значительно снижается. Осциллятор опускается в нижнюю зеленую полосу, показанную там, где 111-дневная скользящая средняя движется со скидкой 75% относительно 2 * 350-дневной скользящей средней.
Исторически это высветило широкие области минимумов медвежьего рынка.
ВАЖНО: Выставлять нужно ЛОГАРИФМИЧЕСКИЙ график. (Находиться функция с правой нижней части экрана)
ВАЖНО: Индикатор INTELLECT_city сделан для сигнальных покупок продаж, есть также и стратегический от INTELLECT_сity
ВАЖНО: На Графике видны все циклы, как на покупку так и на продажу.
ВАЖНО: Подходящие таймфреймы 1 дневной (рекомендовано) и 1 недельный
-----------------------------
Beschreibung - Deutsch
-----------------------------
Indikatorübersicht
INTELLECT_city – Weltzyklus – ATH & ATL – Zeitrahmen 1T und 1W – Logarithmisch – Signal – Der Pi-Zyklus-Top- und Bottom-Oszillator ist eine Anpassung des ursprünglichen Pi-Zyklus-Top-Diagramms. Er vergleicht den 111-Tage-Gleitenden-Durchschnittskreis und den 2 * 350-Tage-Gleitenden-Durchschnittskreis des Bitcoin-Preises. Diese beiden gleitenden Durchschnitte wurden als 350 / 111 = 3,153 ausgewählt; eine Annäherung an die wichtige mathematische Zahl Pi.
Wenn der 111-Tage-Gleitenden-Durchschnittskreis den 2 * 350-Tage-Gleitenden-Durchschnittskreis erreicht, deutet dies darauf hin, dass der Markt überhitzt. Das liegt daran, dass der Momentum-Referenzwert des 111-Tage-Gleitenden-Durchschnitts im mittleren Zeitrahmen den Momentum-Referenzwert des 2 * 350-Tage-Gleitenden-Durchschnitts im langen Zeitrahmen eingeholt hat.
Historisch gesehen geschah dies innerhalb von 3 Tagen nach dem Höhepunkt jedes Marktzyklus.
Wenn der Kreis des 111-Tage-Durchschnitts wieder unter den Kreis des 2 x 350-Tage-Durchschnitts fällt, deutet dies darauf hin, dass die Marktdynamik dieses Zyklus deutlich nachlässt. Der Oszillator fällt in das untere grüne Band, in dem der 111-Tage-Durchschnitt mit einem Abschlag von 75 % gegenüber dem 2 x 350-Tage-Durchschnitt verläuft.
Historisch hat dies breite Bereiche mit Tiefstständen in der Baisse hervorgehoben.
WICHTIG: Sie müssen ein logarithmisches Diagramm festlegen. (Die Funktion befindet sich unten rechts auf dem Bildschirm)
WICHTIG: Der INTELLECT_city-Indikator dient zur Signalisierung von Käufen oder Verkäufen, es gibt auch einen strategischen Indikator von INTELLECT_city
WICHTIG: Das Diagramm zeigt alle Zyklen, sowohl Kauf- als auch Verkaufszyklen.
WICHTIG: Geeignete Zeitrahmen sind 1 täglich (empfohlen) und 1 wöchentlich
Adaptive Bandpass Filter [Ehlers]This is my latest bandpass filter - used to determine if a security is in a trend or cycle.
Now with an adaptive period setting! I use Ehlers in-phase & quadrature dominant cycle measurement (IQ IFM) method to set the period dynamically.
This method favors longer periods which tend to produce smoother, albeit laggier bandpass oscillator plots. From my quick tests, I tend to have lag between 4 and 8 bars, depending on the Timeframe.
The lower timeframes tend to have more noise and thus produce more interfering frequencies that may cause lag.
>Settings
Source: Select the data source to perform calc's on (close, open, etc...)
Period: Select the period to tune. Periods outside of this value will be attenuated (reduced)
Adaptive: Enable to have the I-Q IFM set the period for you (disables Period setting)
Bandpass Tolerance: Allow periods that are plus/minus the chosen period to pass.
Cycle Tolerance: Sensitivity of cycle mode. Lower values consider trends more frequent, higher values consider cycles more frequent.
Bandpass tolerance example: for instance, if this setting is 0.1 (10%) and Period is set to 20, then waves with a period of 18 - 22 will pass.
>How to read
Red line is the bandpass output, showing a lagged version of the dominant cycle representing the
Black lines are the upper and lower bounds for a cycle
Green Background indicates an uptrend
Red background indicates a downtrend

Pi Cycle Top RatioPast cycles show a top prediction within a few days of the top when 111DMA crosses the 350DMA*2 (Pi Cycle top indicator).
Each cycle the 2 ratios have crossed less and for shorter periods of time. In 2021 the 2 averages hardly even crossed each other. It is likely the moving averages will not cross this cycle.
This can be seen more clearly if the two moving averages are divided by each other to give a visual ratio, when this is done you can clearly see the diminishing peaks. A trendline can then be applied across these peaks to account for the decaying signal. When the upper trend is hit this would be indicative of a potential peak. Interestingly, this ratio also represents bottoms consistently across each cycle, when the ratio has gone below 0.35 these matches with BTC lows.

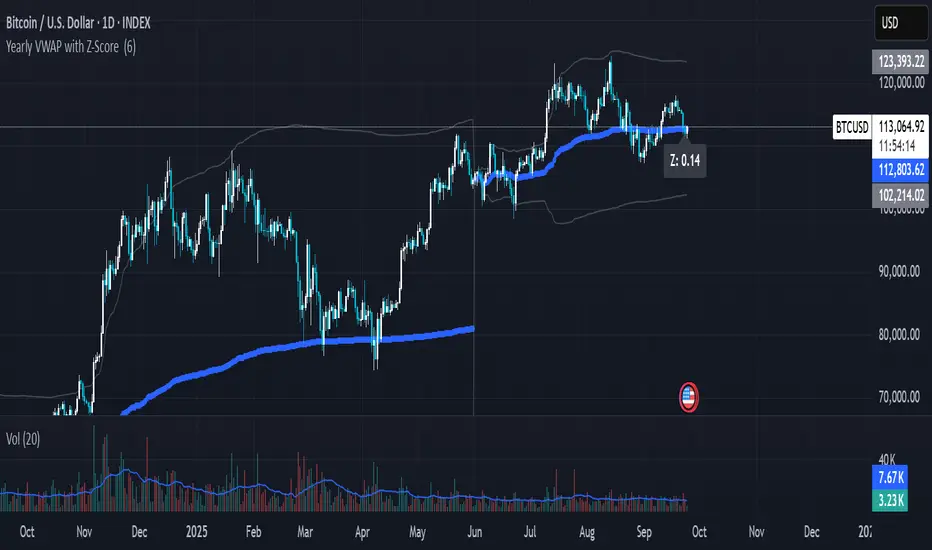
Yearly VWAP with Z-Score V2This script extends the traditional Volume Weighted Average Price (VWAP) by applying it to yearly sessions (with a customizable start month) and combining it with a Z-Score framework to standardize price deviations from VWAP.
Features
Yearly VWAP: Automatically resets at the selected month, making it possible to align VWAP with fiscal or seasonal cycles (e.g., June–May).
Volatility-Weighted Bands: Standard deviation is calculated using volume-weighted price variance, creating adaptive upper and lower bands around VWAP.
Z-Score Calculation: Converts price distance from VWAP into standardized scores, ranging from +2.5 to –2.5. This enables statistical interpretation of whether price is trading at fair value, extended, or oversold relative to VWAP.
Custom Session Control: Input allows users to change the yearly anchor month.
On-Chart Display: VWAP and bands are plotted, with a live Z-Score label shown on the latest bar.
How to Use
Fair Value Reference: VWAP reflects the average price weighted by volume over the yearly session — a natural equilibrium point.
Overbought / Oversold Detection: Extreme Z-Score readings (±2 or beyond) highlight when price is stretched relative to VWAP.
Cycle Analysis: Resetting VWAP by custom months allows studying market behavior over fiscal years, seasons, or custom trading cycles.
Part of a Broader Toolkit: This script is not a standalone trading system. It works best when aggregated with other indicators, confluence factors, or a structured strategy.
Originality
Unlike a standard VWAP, this version:
Uses yearly anchoring with custom start month instead of session/day anchoring.
Adds volume-weighted standard deviation bands for statistical context.
Translates distance into a Z-Score scale for objective overbought/oversold assessment.
Positive Z-Score values indicate zones where price is positioned favorably for accumulation or potential buys, while negative values highlight areas more suitable for distribution or profit-taking — always best used in confluence with other tools rather than as a standalone signal
The Ultimate Buy and Sell Indicator: Unholy Grail Edition"You see, Watson, the market is not random—it simply whispers in a code too complex for the average trader. Lucky for you, I am not average."
They searched for the Holy Grail of trading for decades—promises, false prophets, and overpriced PDFs.
But they were all looking in the wrong place.
This isn’t a relic buried in the desert.
This is the Unholy Grail — a machine-forged fusion of logic, engineering, and tactical overkill .
Built by Sherlock Macgyver , this is not a mystical object. It’s a surveillance system for trend detection, signal validation, and precision entries .
⚠️ Important: This script draws its own candles.
To see it properly, disable regular candles by turning off "Body", "Wick" and "Border" colors.
🔧 What You’re Looking At
This overlay plots confirmed Buy/Sell signals , momentum-based “watch” zones , adaptive candle coloring , SuperTrend bias detection , dual Bollinger Bands , and a moving average ribbon .
It’s not “minimalist” —it’s comprehensive .
📍 Configuring the Tool: Follow the Breadcrumbs
Every setting includes a tooltip — read them . They're not filler. They explain exactly how each feature functions so you can dial this thing in like you're tuning a surveillance rig in a Cold War bunker .
If you skip them, you're walking blind in a minefield .
🕰️ Timeframes: The Signal Sweet Spot
Each asset has a tempo . You need to find the one where signals align with clarity —not chaos .
Start with 4H or 1H —work up or down from there.
Too many fakeouts? → Higher timeframe
Too slow? → Drop to 15m or 5m —but expect more noise and adjust settings accordingly.
The signals scale with time, but you must find the rhythm that best fits your asset—and your trading lifestyle .
♻️ RSI Cycle = Signal Sensitivity
This is the heart of the system . It controls how reactive the RSI engine is.
Adjust based on noise level and how often you can actually monitor your charts.
Short cycle (14–24): More signals, more speed, more noise
Longer cycle (36–64): Smoother entries, better for swing traders
Tip: If your signals feel too jittery, increase the cycle. If they lag too much, reduce it.
📉 SuperTrend: Your Trend Bias Compass
This isn’t your average SuperTrend. It adapts with RSI overlay logic and detects market “silence” via EMA compression— turning white right before the chaos . That said, you still control its aggression.
ATR Length = how many bars to average
ATR Factor = how tight or loose it hugs price
Lower = more sensitive (more trades, more noise)
Higher = confirmation only (fewer, but stronger signals)
Tweak until it feels like a sniper rifle.
No, you won’t get it perfect on the first try.
Yes, it’s worth it.
🛠️ Modular Signals: Why Things Fire (or Don’t)
Buy/Sell entries require conditions to align. The logic is modular, and that’s on purpose.
RSI signals only fire if RSI crosses its smoothed MA outside the dead zone and a “Watch” condition is active.
SuperTrend signals can be enabled to act on crossovers, optionally ignoring the Watch filter .
Watch conditions (colored squares) act as early recon and hint at possible upcoming trades.
Background color changes are “pre-signal warnings” and will repaint . Use them as leading signals, not gospel.
Want more trades? Loosen your filters .
Want sniper entries? Lock them down .
🌈 Candles and MAs: Visual Market Structure
Candles adapt in real-time to MA structure:
Green = bullish (above both fast/slow MAs)
Yellow = indecision (between)
Red = bearish (below both)
Buy/Sell signals override candles with bright orange and fuchsia —because subtlety doesn’t win wars .
You can also enable up to 8 customizable moving averages —great for confluence , trend confirmation , or just looking like a wizard .
🧠 Pro Usage Tips (TL;DR for Smart People):
Use tooltips in the settings menu —every toggle and slider is explained
Test timeframes until signal frequency and reliability match your goals
Adjust RSI cycle to reduce noise or speed up signals based on how frequently you trade
Tweak SuperTrend factor and ATR to fit volatility on your asset
Start with visual confirmation :
• Are watch signals lining up with trend zones?
• Are backgrounds firing before price moves?
• Are candle colors agreeing with signal direction?
📣 Alerts & Integration
Alerts are available for:
Buy/Sell entries (confirmed or advanced background)
Watch signals
Full band agreement (both Bollinger bands bullish or bearish)
Use these with webhook systems , bots , or your own trade journals .
Created by Sherlock Macgyver
Because sometimes the best trade…
is knowing exactly when not to take one.

Financial Astrology Neptune LongitudeNeptune energy influence the charity, confusion, imagination, waste, crime, intuition, occult, scandal, illusion and dreams. It rules the industries related to chemicals, gas and oil, drugs and alcoholic beverages, scams, non profit organisations, spirituality. The last decade Neptune have been traveling through Piscis sign which caused humanity to have an illusion that economical growth don't have limits, as consequence we saw US indexes growth toward new all time highs. However, Neptune is close to leave Piscis, in 7 more degrees as per July 2021 and new cycle is going to start. It will be interesting to see what happens as Neptune moves into Aries sign.
This longitude indicator show a zodiac signs horizontal line boundaries that identify the start of the sign marked in the corresponding horizontal line label in the Y axis, this simplify the analysis of a planet effect within specific zodiac sign.
Note: The Neptune longitude indicator is based on an ephemeris array that covers years 2010 to 2030, prior or after this years the data is not available, this daily ephemeris are based on UTC time so in order to align properly with the price bars times you should set UTC as your chart timezone.

Trigonometric Sine Cosine WavesTrigonometric Sine Cosine Waves - Advanced Cyclical Analysis
Overview
This innovative indicator applies trigonometric mathematics to market analysis, generating dynamic sine and cosine waves that adapt to price movement and volatility. Unlike traditional oscillators, this tool visualizes market cycles directly on your chart using mathematical wave functions.
How It Works
The indicator calculates phase-based waves using:
• Phase Calculation: 2π × bar_index / cycle_length
• Adaptive Amplitude: EMA-based price + ATR volatility scaling
• Sine Wave: avgPrice + volatility × sin(phase)
• Cosine Wave: avgPrice + volatility × cos(phase)
Key Features
Dynamic Wave Generation
• Sine Wave: Primary cycle indicator with smooth transitions
• Cosine Wave: Leading indicator (90° phase difference from sine)
• Adaptive Amplitude: Automatically adjusts to market volatility using ATR
Turning Point Detection
• Anti-Repaint Signals: Uses confirmed values from previous bars
• Sine Bottom: Potential buy zones when wave transitions from down to up
• Sine Top: Potential sell zones when wave transitions from up to down
Advanced Analytics
• Price Correlation Angle: Shows relationship between price movement and cycle
• Phase Information: Current position in the mathematical cycle
• Real-time Values: Live sine/cosine values and phase degrees
Visual Enhancement
• Background Coloring: Changes based on sine wave position (above/below zero)
• Clean Overlay: Waves plot directly on price chart without cluttering
Parameters
• Cycle Length (5-200): Controls wave frequency - shorter = more sensitive
• Amplitude Multiplier (0.1-5.0): Adjusts wave height relative to volatility
• Display Options : Toggle sine wave, cosine wave, and correlation table
• Show Correlation : Optional table showing mathematical values
Trading Applications
Cycle Analysis
• Identify market rhythm and timing
• Spot potential reversal zones
• Understand price-to-cycle relationships
Entry/Exit Timing
• Buy Signals: Sine wave bottoms (cycle lows)
• Sell Signals: Sine wave tops (cycle highs)
• Confirmation: Use with other indicators for higher probability setups
Market Structure
• Visualize underlying market cycles
• Identify periods of high/low cyclical activity
• Track phase relationships between price and mathematical cycles
Pro Tips
1. Longer cycles (50-100) work better for swing trading
2. Shorter cycles (10-20) suitable for scalping
3. Combine with volume for stronger signal confirmation
4. Monitor correlation angle for trend strength assessment
5. Use background color as quick visual cycle reference
Important Notes
• Signals are anti-repaint using confirmed previous bar values
• Best used in trending or cyclical markets
• Consider market context when interpreting signals
• Mathematical approach - not based on traditional TA concepts
Alerts Included
• Sine Wave Buy Signal: Triggered on wave bottom detection
• Sine Wave Sell Signal: Triggered on wave top detection
Technical Requirements
• Pine Script v6
• Works on all timeframes
• No external dependencies
• Optimized for performance
This is a free, open-source indicator. Feel free to modify and improve according to your trading needs!
Educational Value: Perfect for understanding how mathematical functions can be applied to market analysis and cycle detection.

Bull Momentum GaugeBull Momentum Gauge
The Bull Momentum Gauge is a powerful momentum oscillator designed to identify the underlying strength and sustainability of major market trends. Instead of trying to predict tops and bottoms, this indicator helps traders and investors ride long-term bull markets by signaling when momentum is building and when it is starting to fade.
What it Does
At its core, this tool measures how statistically "stretched" or "compressed" an asset's price is relative to its long-term (1-year) trend. It does this by:
Calculating the price's deviation from its 365-day moving average.
Normalizing this deviation into a Z-score to measure its statistical significance.
Comparing the inverted Z-score to its own 200-day moving average to gauge the momentum of the trend itself.
The result is a single, smooth line that oscillates around a zero value.
How to Use It
The signals are simple and based on the indicator's relationship to the zero line:
Green Line (Gauge below 0): This indicates that the price has been compressed relative to its long-term trend and is now showing signs of building upward momentum. A cross into the green zone can be interpreted as a potential entry signal for a new bull run.
Red Line (Gauge above 0): This suggests that the price has become over-extended or "stretched" and the upward momentum is beginning to weaken. A cross into the red zone can be used as a potential exit signal, indicating it may be time to take profits and wait for the next cycle.
This indicator is designed to work across multiple timeframes (Daily, Weekly, Monthly) and provides a clear, data-driven framework for navigating major market cycles.

Edufx AMD~Accumulation, Manipulation, DistributionEdufx AMD Indicator
This indicator visualizes the market cycles using distinct phases: Accumulation, Manipulation, Distribution, and Reversal. It is designed to assist traders in identifying potential entry points and understanding price behavior during these phases.
Key Features:
1. Phases and Logic:
-Accumulation Phase: Highlights the price range where market accumulation occurs.
-Manipulation Phase:
- If the price sweeps below the accumulation low, it signals a potential "Buy Zone."
- If the price sweeps above the accumulation high, it signals a potential "Sell Zone."
-Distribution Phase: Highlights where price is expected to expand and establish trends.
-Reversal Phase: Marks areas where the price may either continue or reverse.
2. Weekly and Daily Cycles:
- Toggle the visibility of Weekly Cycles and Daily Cycles independently through the settings.
- These cycles are predefined with precise timings for each phase, based on your selected on UTC-5 timezone.
3. Customizable Appearance:
- Adjust the colors for each phase directly in the settings to suit your preferences.
- The indicator uses semi-transparent boxes to represent the phases, allowing easy visualization without obstructing the chart.
4. Static Boxes:
- Boxes representing the phases are drawn only once for the visible chart range and do not dynamically delete, ensuring important consistent reference points.

Volume Difference Delta Cycle OscillatorVolume Difference Delta Cycle Oscillator indicator:
Using the power of my Volume Difference Indicator and standard deviations based on Bollinger Bands and more, we present this wonderful indicator with the following features:
Price Action Histogram: This is the bread and butter of this graph, if the PAH is above 0, this is considered a BULL cycle, and if below 0, this is considered a BEAR cycle. The histogram will move up and down based on the Histagram settings you set in the properties field. Be careful, we advise using default settings.
Custom Overbought & Oversold Lines:mean
These lines can be used to identify when to buy and sell the security, and help you make sense of the action of the histogram. Change the color, size, and linewidth!
These lines are what are used to perform the trades with the strategy as well, so if you change them, they will make an impact on the strategy itself.
EzSpot Background:
Do you want to turn your brain off and just trade when you you're inside an Overbought or Oversold line? Awesome! Turn on EzSpot backgrounds, and when it's green, go long, when it's red go short! Simple as that!
How it works:
By taking the Delta of the Volume Difference Indicator we're able to find the rate of change of the amount of change of volume, allowing us to see changes in volume before price changes. To add onto these, we supercharge it by taking the output of this line as the input source of bollinger bands which we use to output the %B of the Delta of the Volume Difference Indicator.
Separately, we calculate the %B of the current close to use later.
The final step is taking the second %B (which is an indication of where price lies on the curve of historical price data), and from it subtract the first %B, which allows us to visualize the standard deviation of the closing price, minus the standard deviation of Delta of the Volume Difference , which in essence allows us to see when volume changes but price does not and vice versa.
This final output is then plotted along with an over bought and over sold line, which we use to perform our trades on.
Simplified: This indicator shows the cycles of price action - volume based on the rate of the rate of volume changes based on price and the closing price.
Super Simple: Notice when volume increases but price hasn't, and vice versa with this indicator.

Financial Astrology Crypto ML Daily TrendThis daily trend indicator is based on financial astrology cycles detected with advanced machine learning techniques for the crypto-currencies research portfolio: ADA, BAT, BNB, BTC, DASH, EOS, ETC, ETH, LINK, LTC, XLM, XMR, XRP, ZEC and ZRX. The daily price trend is forecasted through this planets cycles (angular aspects, speed, declination), fast ones are based on Moon, Mercury, Venus and Sun and Mid term cycles are based on Mars, Vesta and Ceres. The combination of all this cycles produce a daily price trend prediction that is encoded into a PineScript array using binary format "0 or 1" that represent sell and buy signals respectively. The indicator provides signals since 2021-01-01 to 2022-12-31, the past months signals purpose is to support backtesting of the indicator combined with other technical indicator entries like MAs, RSI or Stochastic. For future predictions besides 2022 a machine learning models re-train phase will be required.
The resolution of this indicator is 1D, you can tune a parameter where you can determine how many future bars of daily trend are plotted and adjust an hours shift to anticipate future signals into current bar in order to produce a leading indicator effect to anticipate the trend changes with some hours of anticipation. Combined with technical analysis indicators this daily trend is very powerful because can help to produce approximately 60% of profitable signals based on the backtesting results. You can look at our open source Github repositories to validate accuracy using the backtesting strategies we have implemented in Jesse Crypto Trading Framework as proof of concept of the predictive potential of this indicator. Alternatively, we have implemented a PineScript strategy that use this indicator, just consider that we are pending to do signals update to the period July 2021 to December 2022: This strategy have accumulated more than 110 likes and many traders have validated the predictive power of Financial Astrology.
DISCLAIMER: This indicator is experimental and don’t provide financial or investment advice, the main purpose is to demonstrate the predictive power of financial astrology. Any allocation of funds following the documented machine learning model prediction is a high-risk endeavour and it’s the users responsibility to practice healthy risk management according to your situation.

Gann Sacred Geometry Hexagram Ver 1.2━━━━━━━━━━━━━━━━━━━━━━━━━━━━━━━━━━━━━━━━
🔯 GANN SACRED GEOMETRY HEXAGRAM v1.2
━━━━━━━━━━━━━━━━━━━━━━━━━━━━━━━━━━━━━━━━
A comprehensive technical analysis tool combining W.D. Gann's sacred geometry principles,
hexagram patterns, and advanced confluence scoring for high-probability trade signals.
━━━━━━━━━━━━━━━━━━━━━━━━━━━━━━━━━━━━━━━━
📖 GANN THEORY BACKGROUND
━━━━━━━━━━━━━━━━━━━━━━━━━━━━━━━━━━━━━━━━
W.D. Gann (1878-1955) believed markets move in geometric patterns and that price
and time must be in balance. His methods incorporated:
- The Square of Nine
- Geometric angles (1x1, 2x1, etc.)
- Sacred geometry and natural law
- Cycle theory and time divisions
- The principle "When time and price square, a change in trend is imminent"
This indicator applies these timeless principles with modern confluence analysis.
SACRED GEOMETRY FOUNDATION:
The hexagram (six-pointed star) is formed by two overlapping equilateral triangles:
- ▲ Upward triangle = Yang energy, bullish forces, expansion
- ▼ Downward triangle = Yin energy, bearish forces, contraction
When overlapped, they create the "Star of David" - representing perfect balance
between opposing market forces. Gann believed this geometry revealed natural
support and resistance zones where price would react.
HEXAGRAM IN MARKETS:
- 6 outer points = Major reversal zones
- Center point = Balance/equilibrium price
- Inner intersections = Secondary support/resistance
- The shape itself creates "harmonic" price levels
GANN'S SQUARE PHILOSOPHY:
"When time and price square, a change in trend is imminent."
- W.D. Gann
This indicator applies the "squaring" concept:
1. SPATIAL SQUARE: Grid cells are perfect squares in price-time space
2. TEMPORAL SQUARE: Time divisions (1/4, 1/2, 3/4) create cycle points
3. PRICE SQUARE: Price divisions (25%, 50%, 75%) mirror time divisions
4. GEOMETRIC SQUARE: All geometry radiates from perfect square centers
When price reaches a corner or edge of a square at a time cycle point,
the "squaring" of price and time creates a reversal probability zone.
PHI IN GANN GEOMETRY:
The Golden Ratio appears throughout natural phenomena and market structure.
This script uses φ in two primary ways:
1. INNER TRIANGLE SCALING:
- Outer triangles span the full cell (100%)
- Inner triangles scaled by φ⁻¹ (0.618 or 61.8%)
- This creates Fibonacci retracement levels geometrically
2. HARMONIC RESONANCE:
- φ ratio divides price space into natural harmony
- Markets tend to pause/reverse at these φ-scaled levels
- Combines Fibonacci analysis with Gann geometry
MATHEMATICAL RELATIONSHIP:
Inner Triangle Height = Outer Height × 0.618
Inner Triangle Width = Outer Width × 0.618
These create the 61.8% retracement levels automatically
within each grid cell's geometry.
GANN'S COMPLETE ANGLE SYSTEM:
Gann identified 9 primary angles that price follows. Each represents a different
relationship between price movement and time passage:
╔════════════════════════════════════════════════════════════════╗
║ ANGLE │ RATIO │ DEGREES │ MEANING ║
╠════════════════════════════════════════════════════════════════╣
║ 1x8 │ 1:8 │ 7.125° │ Very slow trend (gentle) ║
║ 1x4 │ 1:4 │ 14.036° │ Slow trend ║
║ 1x3 │ 1:3 │ 18.435° │ Moderate-slow trend ║
║ 1x2 │ 1:2 │ 26.565° │ Moderate trend ║
║ 1x1 │ 1:1 │ 45.000° │ MASTER ANGLE (most important) ║
║ 2x1 │ 2:1 │ 63.435° │ Strong trend ║
║ 3x1 │ 3:1 │ 71.565° │ Very strong trend ║
║ 4x1 │ 4:1 │ 75.964° │ Extreme trend ║
║ 8x1 │ 8:1 │ 82.875° │ Parabolic trend (unsustainable)║
╚════════════════════════════════════════════════════════════════╝
THE 1x1 ANGLE - THE MASTER:
- Most important angle in Gann theory
- Represents perfect balance: 1 unit price = 1 unit time
- When price is ABOVE 1x1 = Bullish control
- When price is BELOW 1x1 = Bearish control
- Crossing 1x1 = Major trend change signal
ANGLE FANS:
- From any pivot point, all 9 angles radiate outward
- Creates a "fan" of dynamic support/resistance
- Steeper angles (4x1, 8x1) = strong momentum resistance
- Gentler angles (1x4, 1x8) = weak support in downtrends
THE SACRED DIVISIONS OF TIME:
Gann divided all cycles into 8 equal parts, based on ancient geometry
and astrological principles:
CYCLE DIVISIONS (8ths):
┌─────────────────────────────────────────────────────┐
│ 1/8 = 12.5% │ First minor turn point │
│ 2/8 = 25.0% │ First major turn (Cardinal) │
│ 3/8 = 37.5% │ Second minor turn │
│ 4/8 = 50.0% │ MID-CYCLE (most powerful) │
│ 5/8 = 62.5% │ Third minor turn │
│ 6/8 = 75.0% │ Second major turn (Cardinal) │
│ 7/8 = 87.5% │ Fourth minor turn │
│ 8/8 = 100.0% │ CYCLE COMPLETION (reversal zone) │
└─────────────────────────────────────────────────────┘
WHY EIGHTHS?
- 8 is the number of balance in sacred geometry
- Octave divisions create harmonic resonance
- 360° circle ÷ 8 = 45° (the 1x1 master angle)
- Natural cycles show 8-fold symmetry
IN THIS SCRIPT:
When current time position is within 8% of any eighth division,
the "Gann 8ths Timing" factor activates, adding confluence points.
THE CARDINAL CROSS SYSTEM:
The Cardinal Cross divides any square into four equal quadrants,
creating a cross pattern:
100% ●━━━━━━━━━━━━━●
┃ ↑ ┃
75% ┃ SELL ZONE ┃ ← Resistance quadrant
┃ ↑ ┃
50% ●━━━━━●━━━━━━● ← EQUILIBRIUM (most important)
┃ ↓ ┃
25% ┃ BUY ZONE ┃ ← Support quadrant
┃ ↓ ┃
0% ●━━━━━━━━━━━━━●
PRICE LEVELS:
- 0% = Bottom support (grid cell low)
- 25% = Lower mid-level support
- 50% = PERFECT BALANCE - most powerful level
- 75% = Upper mid-level resistance
- 100% = Top resistance (grid cell high)
TIME DIVISIONS:
- 0% = Cycle start (grid cell left edge)
- 25% = First quarter turn
- 50% = Mid-cycle (most powerful timing)
- 75% = Third quarter turn
- 100% = Cycle completion (grid cell right edge)
CONFLUENCE MAGIC:
When BOTH price AND time align at cardinal points simultaneously:
Example: Price at 50% level + Time at 50% of cycle = Maximum power
This is the "squaring" Gann referred to.
━━━━━━━━━━━━━━━━━━━━━━━━━━━━━━━━━━━━━━━━
📊 KEY FEATURES
━━━━━━━━━━━━━━━━━━━━━━━━━━━━━━━━━━━━━━━━
✅ Dynamic Grid System (1x1 to 7x7) - Automatically constructed from swing high to swing low
✅ Sacred Geometry Hexagrams - Overlapping triangles creating Star of David pattern
✅ Golden Ratio (φ = 1.618) Inner Triangles - Fibonacci harmony in geometry
✅ 9 Complete Gann Angles - 1x1, 2x1, 1x2, 3x1, 1x3, 4x1, 1x4, 8x1, 1x8
✅ Cardinal Cross Levels - 0%, 25%, 50%, 75%, 100% price divisions
✅ Gann 8ths Timing Cycles - 1/8, 1/4, 3/8, 1/2, 5/8, 3/4, 7/8 time divisions
✅ Price-Time Square Balance - Gann's principle of harmonious price-time relationship
✅ Advanced Confluence Scoring - Multi-factor signal validation (8-30 score range)
✅ Optimized Geometry Display - Shows full detail only near current price (reduces clutter)
✅ Customizable Visual Themes - Full color and thickness control
━━━━━━━━━━━━━━━━━━━━━━━━━━━━━━━━━━━━━━━━
🎯 HOW IT WORKS
━━━━━━━━━━━━━━━━━━━━━━━━━━━━━━━━━━━━━━━━
📍 GRID CONSTRUCTION:
The indicator identifies the most recent significant swing high-to-low movement using
configurable pivot periods (default: 88 bars). This creates the base "square" which is
then replicated in a grid pattern both vertically (price) and horizontally (time).
📐 SACRED GEOMETRY:
Each grid cell contains:
- Outer hexagram (Star of David) formed by two overlapping triangles
- Inner φ-ratio triangles scaled by the Golden Ratio
- Gann angles radiating from the center point
- Cardinal cross levels dividing price into quarters
🔍 CONFLUENCE SCORING SYSTEM:
Signals are generated when multiple Gann principles align:
1. Cardinal Cross Levels (0-6 points) - Price at key quarter divisions
2. Gann Angle Touches (0-5 points) - Price touching dynamic support/resistance angles
3. Angle Clustering (0-6 points) - Multiple angles converging = strong zone
4. Gann 8ths Timing (0-3 points) - At critical time cycle points
5. Price-Time Square (0-4 points) - Balanced price/time movement
6. Trend Alignment (0-3 points) - Signal direction matches trend
7. Grid Boundary Timing (0-3 points) - Near cell edges = reversal zones
8. φ Triangle Touches (0-2 points) - Golden ratio support/resistance
9. Reversal Patterns (0-2 points) - Wick rejections confirming reversal
Minimum confluence score of 15 required for signal (adjustable 8-30).
━━━━━━━━━━━━━━━━━━━━━━━━━━━━━━━━━━━━━━━━
⚙️ RECOMMENDED SETTINGS
━━━━━━━━━━━━━━━━━━━━━━━━━━━━━━━━━━━━━━━━
📊 For Daily Charts (Swing Trading):
- Gann Number: 88
- Grid Size: 4x4
- Confluence Score: 15
- Geometry Range: 5
- Trend Filter: ON
📊 For 4H Charts (Intraday):
- Gann Number: 44
- Grid Size: 3x3
- Confluence Score: 12-13
- Geometry Range: 3-4
- Trend Filter: ON
📊 For 15M Charts (Scalping):
- Gann Number: 22
- Grid Size: 2x2
- Confluence Score: 10-12
- Geometry Range: 2-3
- Allow Counter-Trend: Consider enabling
━━━━━━━━━━━━━━━━━━━━━━━━━━━━━━━━━━━━━━━━
📚 BEST PRACTICES
━━━━━━━━━━━━━━━━━━━━━━━━━━━━━━━━━━━━━━━━
✓ Use higher confluence scores (15+) for higher probability trades
✓ Combine with volume analysis for confirmation
✓ Respect trend filter - signals with trend are stronger
✓ Watch for signals at grid boundaries (time cycle completions)
✓ Higher scores (20+) indicate exceptional setups
✓ Use alerts to catch signals in real-time
✓ Works best on liquid markets with clear swings
EXAMPLE 1: Strong Buy Signal (Score: 18)
✓ Price touched 50% level (6 pts)
✓ 1x1 Gann angle support (5 pts)
✓ At Gann 8th cycle point (3 pts)
✓ Price-Time squared (4 pts)
= High probability long entry
EXAMPLE 2: Medium Sell Signal (Score: 15)
✓ Price at 75% level (4 pts)
✓ 2x1 angle resistance (3 pts)
✓ Trend aligned downward (3 pts)
✓ Near grid boundary (3 pts)
✓ Bearish wick rejection (2 pts)
= Valid short entry
━━━━━━━━━━━━━━━━━━━━━━━━━━━━━━━━━━━━━━━━
🎨 CUSTOMIZATION OPTIONS
━━━━━━━━━━━━━━━━━━━━━━━━━━━━━━━━━━━━━━━━
- Structure: Gann Number (11, 22, 44, 88, 176, 352)
- Grid: Size from 1x1 to 7x7
- Geometry: Toggle squares, triangles, angles, levels
- Optimization: Show geometry only near price (performance boost)
- Thickness: All line widths adjustable (1-5)
- Colors: Full color customization for all elements
- Scoring: Adjust all tolerance and threshold parameters
- Timing: Enable/disable Gann 8ths, Price-Time Square
- Filters: Trend filter, boundary requirement, counter-trend signals
- Display: 4 signal styles (Labels, Diamonds, Circles, Stars)
━━━━━━━━━━━━━━━━━━━━━━━━━━━━━━━━━━━━━━━━
⚠️ IMPORTANT NOTES
━━━━━━━━━━━━━━━━━━━━━━━━━━━━━━━━━━━━━━━━
- This indicator is for educational purposes
- Not financial advice - always do your own research
- Past performance does not guarantee future results
- Use proper risk management and position sizing
- Combine with other analysis methods for best results
- Grid redraws when new swing high/low forms
- Signals appear in real-time based on confluence scoring
━━━━━━━━━━━━━━━━━━━━━━━━━━━━━━━━━━━━━━━━
📞 SUPPORT & UPDATES
━━━━━━━━━━━━━━━━━━━━━━━━━━━━━━━━━━━━━━━━
Follow for updates and improvements. Feedback welcome!
Version 1.2 - January 2025
- Optimized geometry rendering
- Enhanced confluence scoring
- Improved visual clarity
- Performance optimizations
━━━━━━━━━━━━━━━━━━━━━━━━━━━━━━━━━━━━━━━━

Continuous Accumulation Strategy [DCA] v9🇬🇧 English: Continuous Accumulation Strategy v9.4
This script is a full-featured strategy designed to backtest the "Buy the Dip" or "Dollar Cost Averaging" (DCA) philosophy. Its core feature is the Dynamic Peak Detection logic, which solves the "lock-in" problem of previous versions. Instead of getting stuck on an old high, the strategy constantly adapts to the market by referencing the most recent peak.
Key Features
* Dynamic Peak Detection: You define the "Peak Lookback Period." For example, on a Daily chart, setting it to `5` references the peak of the last business week.
* Stable Order Management: The strategy consistently uses a fixed cash amount (e.g., $100) for each entry, which prevents any runtime errors related to negative equity.
* Publishing-Ready: To meet TradingView's requirement for a backtest report, this strategy executes a symbolic, one-time "dummy trade" (one buy and one sell) at the very beginning of the test period. This first trade should be ignored when analyzing performance , as its only purpose is to enable publication.
How It Works
The main logic follows an adaptive cycle: Find Dynamic Peak -> Wait for a Drop -> Buy on Crossover -> Repeat.
1. Finds the Dynamic Peak: On every bar, it identifies the highest price within your defined lookback period.
2. Calculates the Drop: It constantly calculates the percentage drop from this moving peak.
3. Executes an Entry: The moment the price crosses below a target drop percentage, it executes a buy order.
4. Continuously Adapts: As the price moves, the dynamic peak is constantly updated, meaning the strategy never gets locked and is always ready for the next opportunity.
How to Use This Strategy
* Focus on the Strategy Tester: After adding it to the chart, analyze the Equity Curve, Net Profit, and Max Drawdown to see how this accumulation philosophy would have performed on your favorite asset.
* Optimize Parameters: Adjust the "Peak Lookback Period" and "Drop Percentages" to fit the volatility of the asset you are testing.
This is a tool for testing and analyzing a "buy and accumulate" philosophy. Its main logic does not generate sell signals.

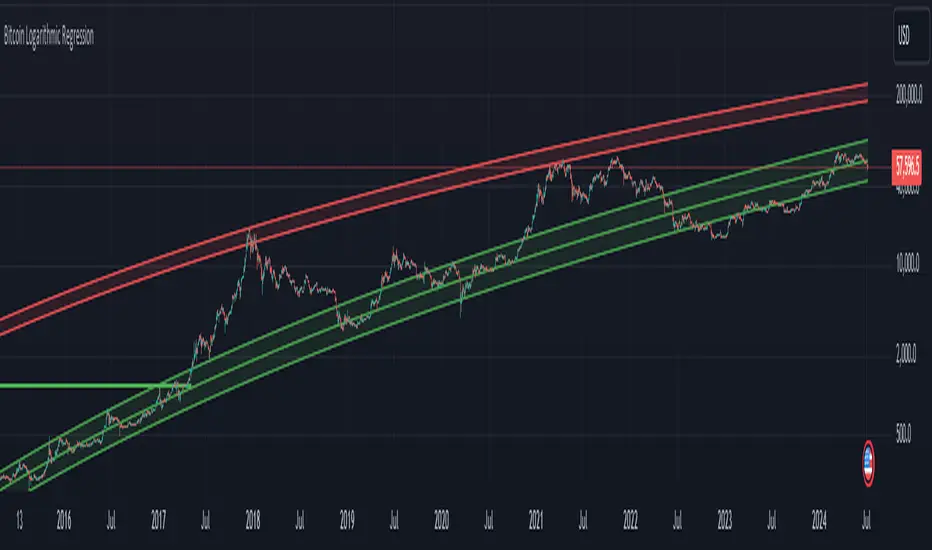
Bitcoin Logarithmic Regression
This indicator displays logarithmic regression channels for Bitcoin. A logarithmic regression is a function that increases or decreases rapidly at first, but then steadily slows as time moves. The original version of this indicator/model was created as an open source script by a user called Owain but is not available on TradingView anymore. So I decided to update the code to the latest version of pinescript and fine tune some of the parameters.
How to read and use the logarithmic regression:
There are 3 different regression lines or channels visible:
Green Channel: These lines represent different levels of support derived from the logarithmic regression model.
Purpose: The green channel is used to identify potential support levels where the price might find a bottom or bounce back upwards.
Interpretation:
If the price is approaching or touching the lower green lines, it might indicate a buying opportunity or an area where the price is considered undervalued.
------------------------------------------------
Red Channel: These lines represent different levels of resistance derived from the logarithmic regression model.
Purpose: The red channel is used to identify potential resistance levels where the price might encounter selling pressure or face difficulty moving higher.
Interpretation:
If the price is approaching or touching the upper red lines, it might indicate a selling opportunity or an area where the price is considered overvalued.
-------------------------------------------------
Purple Line This line represents to so-called "fair price" of Bitcoin according to the regression model.
Purpose: The purple line can be used to identify if the current price of Bitcoin is under- or overvalued.
Interpretation: A simple interpretation here would be that over time the price will have the tendency to always return to its "fair price", so starting to DCA more when price is under the line and less when it is over the line could be a suitable investment strategy.
----------------------------------------------------
Practical Application:
You can use this regression channel to build your own, long term, trading strategies. Notice how Bitcoin seems to always act in kind of the same 4 year cycle:
- Price likes to trade around the purple line at the time of the halvings
- After the halvings we see an extended sideways range for up to 300 days
- After the sideways range Bitcoin goes into a bull market frenzy (the area between the green and red channel)
- The price tops out at the upper red channel and then enters a prolonged bear market.
Buying around the purple line or lower line of the green channel and selling once the price reaches the red channel can be a suitable and very profitable strategy.
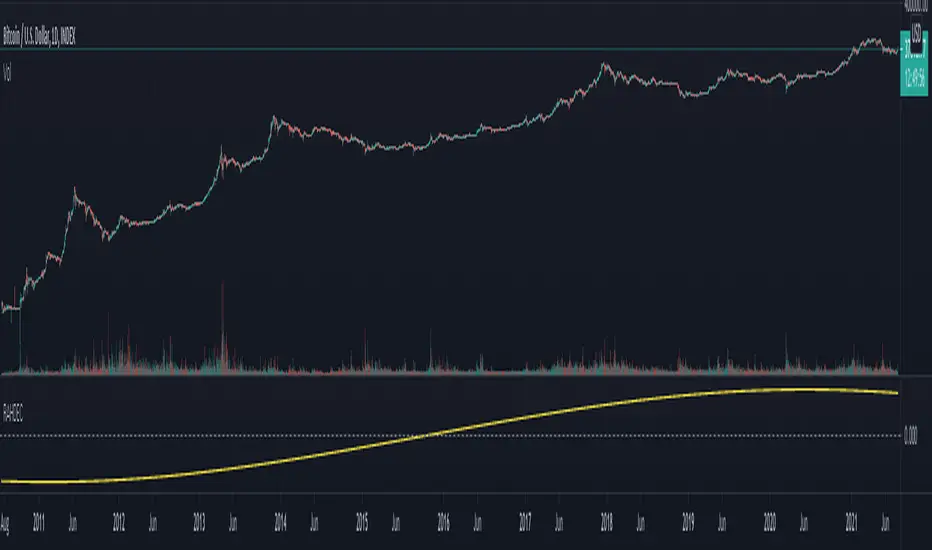
Bitcoin Market Cap wave model weeklyThis Bitcoin Market Cap wave model indicator is rooted in the foundation of my previously developed tool, the : Bitcoin wave model
To derive the Total Market Cap from the Bitcoin wave price model, I employed a straightforward estimation for the Total Market Supply (TMS). This estimation relies on the formula:
TMS <= (1 - 2^(-h)) for any h.This equation holds true for any value of h, which will be elaborated upon shortly. It is important to note that this inequality becomes the equality at the dates of halvings, diverging only slightly during other periods.
Bitcoin wave model is based on the logarithmic regression model and the sinusoidal waves, induced by the halving events.
This chart presents the outcome of an in-depth analysis of the complete set of Bitcoin price data available from October 2009 to August 2023.
The central concept is that the logarithm of the Bitcoin price closely adheres to the logarithmic regression model. If we plot the logarithm of the price against the logarithm of time, it forms a nearly straight line.
The parameters of this model are provided in the script as follows: log(BTCUSD) = 1.48 + 5.44log(h).
The secondary concept involves employing the inherent time unit of Bitcoin instead of days:
'h' denotes a slightly adjusted time measurement intrinsic to the Bitcoin blockchain. It can be approximated as (days since the genesis block) * 0.0007. Precisely, 'h' is defined as follows: h = 0 at the genesis block, h = 1 at the first halving block, and so forth. In general, h = block height / 210,000.
Adjustments are made to account for variations in block creation time.
The third concept revolves around investigating halving waves triggered by supply shock events resulting from the halvings. These halvings occur at regular intervals in Bitcoin's native time 'h'. All halvings transpire when 'h' is an integer. These events induce waves with intervals denoted as h = 1.
Consequently, we can model these waves using a sin(2pih - a) function. The parameter determining the time shift is assessed as 'a = 0.4', aligning with earlier expectations for halving events and their subsequent outcomes.
The fourth concept introduces the notion that the waves gradually diminish in amplitude over the progression of "time h," diminishing at a rate of 0.7^h.
Lastly, we can create bands around the modeled sinusoidal waves. The upper band is derived by multiplying the sine wave by a factor of 3.1*(1-0.16)^h, while the lower band is obtained by dividing the sine wave by the same factor, 3.1*(1-0.16)^h.
The current bandwidth is 2.5x. That means that the upper band is 2.5 times the lower band. These bands are forming an exceptionally narrow predictive channel for Bitcoin. Consequently, a highly accurate estimation of the peak of the next cycle can be derived.
The prediction indicates that the zenith past the fourth halving, expected around the summer of 2025, could result in Total Bitcoin Market Cap ranging between 4B and 5B USD.
The projections to the future works well only for weekly timeframe.
Enjoy the mathematical insights!

Bitcoin wave modelBitcoin wave model is based on the logarithmic regression model and the sinusoidal waves, induced by the halving events.
This chart presents the outcome of an in-depth analysis of the complete set of Bitcoin price data available from October 2009 to August 2023.
The central concept is that the logarithm of the Bitcoin price closely adheres to the logarithmic regression model. If we plot the logarithm of the price against the logarithm of time, it forms a nearly straight line.
The parameters of this model are provided in the script as follows: log (BTCUSD) = 1.48 + 5.44log(h).
The secondary concept involves employing the inherent time unit of Bitcoin instead of days:
'h' denotes a slightly adjusted time measurement intrinsic to the Bitcoin blockchain. It can be approximated as (days since the genesis block) * 0.0007. Precisely, 'h' is defined as follows: h = 0 at the genesis block, h = 1 at the first halving block, and so forth. In general, h = block height / 210,000.
Adjustments are made to account for variations in block creation time.
The third concept revolves around investigating halving waves triggered by supply shock events resulting from the halvings. These halvings occur at regular intervals in Bitcoin's native time 'h'. All halvings transpire when 'h' is an integer. These events induce waves with intervals denoted as h = 1.
Consequently, we can model these waves using a sin(2pih - a) function. The parameter determining the time shift is assessed as 'a = 0.4', aligning with earlier expectations for halving events and their subsequent outcomes.
The fourth concept introduces the notion that the waves gradually diminish in amplitude over the progression of "time h," diminishing at a rate of 0.7^h.
Lastly, we can create bands around the modeled sinusoidal waves. The upper band is derived by multiplying the sine wave by a factor of 3.1*(1-0.16)^h, while the lower band is obtained by dividing the sine wave by the same factor, 3.1*(1-0.16)^h.
The current bandwidth is 2.5x. That means that the upper band is 2.5 times the lower band. These bands are forming an exceptionally narrow predictive channel for Bitcoin. Consequently, a highly accurate estimation of the peak of the next cycle can be derived.
The prediction indicates that the zenith past the fourth halving, expected around the summer of 2025, could result in prices ranging between 200,000 and 240,000 USD.
Enjoy the mathematical insights!

Financial Astrology Vesta LongitudeVesta is one of the largest objects in the asteroid belt between Mars and Jupiter, the orbit duration is 3.63 years and seems to be very relevant celestial object in financial astrology. The experienced financial astrologer "Bill Meridian" indicates that this asteroid rules the security business, and paper securities such as bonds and stocks. We have confirmed through statistical research that adding this asteroid to astrology machine learning models provides an increase in daily trend predictions accuracy for crypto-currencies sector.
Our statistical analysis of Vesta zodiac sign location concluded that when is transiting the signs of Aries, Gemini, Cancer, Leo and Libra the daily trend is 59% or more of the days bullish. When Vesta is located at Capricorn is very bearish with 60% of the daily trend going in downward direction. In the other zodiac signs the daily trend was neutral showing most of the time a sideways pattern.
Is very interesting to note that the exact date July 21, 2021, when Vesta entered in Libra BTCUSD started the last bullish wave that finally broke the congestion zone of the 30K-35K and started a new bullish optimism. Pay attention on what happened in the previous cycle when Vesta was located in Libra and do your conclusions.
Note: Vesta longitude indicator is based on an ephemeris array that covers years 2010 to 2030, prior or after this years the data is not available, this daily ephemeris are based on UTC time so in order to align properly with the price bars times you should set UTC as your chart timezone.

Financial Astrology North Node (Rahu) DeclinationThe North Node (Rahu) declination is a long term cycle so don't seem to provide useful pattern for short/mid term trading, however is interesting to note that when the declination was within -6 to +6 degrees the price was congested within narrow price zone. As observed in all planets declinations indicators the boundary of moving from North to South or viceversa is critical to determine trend change but in the case of the Moon Nodes it seems to show that the planets energy becomes in equilibrium which causes that price are more stable.
Note: The North Node (Rahu) declination indicator is based on an ephemeris array that covers years 2010 to 2030, prior or after this years the data is not available, this daily ephemeris are based on UTC time so in order to align properly with the price bars times you should set UTC as your chart timezone.
VX-Time Quadrant Overlay (Quarterly Cycles) by Ikaru-s-The Time Quadrant Overlay is a purely time-based visualization tool designed to structure market time into repeating quarterly cycles across multiple timeframes.
It does not generate trade signals, entries, or bias.
Its sole purpose is to provide time context, so price action can be interpreted within a clear cyclical framework.
What this indicator does
The indicator divides time into four repeating quarters (Q1–Q4) and displays them simultaneously across different time horizons, such as:
Weekly
Daily (6-hour quarters)
90-minute cycles
Micro cycles (within 90-minute structure)
Each row represents a different time cycle, allowing traders to see time alignment, transitions, and overlaps at a glance.
Quarter Structure
Each cycle follows the same repeating sequence:
Q1 – Early phase
Q2 – Expansion / “True Open” phase
Q3 – Continuation
Q4 – Late phase / Transition
The quarters are visualized using color-coded boxes, making it easy to see:
where the market currently is in time
when a new quarter begins
when multiple cycles align or diverge
Quarter Start Marker
An optional Quarter Start Marker (vertical dashed line) can be enabled to highlight the start of a selected quarter (default: Q2).
This is intended as a time reference, not a signal:
useful for planning
useful for contextualizing reactions to levels
useful for session and cycle awareness
How to use it (practical)
This tool is best used to:
provide time structure to existing analysis
plan around upcoming time transitions
contextualize reactions to levels or areas
understand where price is acting within a cycle
It works well alongside:
discretionary price action
session-based trading
futures and index markets
any methodology that respects time as a variable
Customization
The indicator is fully customizable:
Enable / disable individual cycles
Adjust box transparency and history depth
Toggle labels and pane labels
Enable / disable quarter start markers
Select which quarter to highlight
This allows the tool to remain clean on higher timeframes and detailed on lower ones.
Important Notes
This is a visual framework, not a strategy.
No claims of predictive power are made.
Time structure does not replace risk management or execution logic.
The indicator is designed to adapt across markets, but interpretation remains discretionary.
Final Thoughts
Time is often treated as secondary to price.
This tool exists to make time visible, structured, and easy to work with — nothing more, nothing less.

Ichimoku PourSamadi Signal [TradingFinder] KijunSen Magic Number🔵 Introduction
The Ichimoku Kinko Hyo system is one of the most comprehensive market analysis tools ever created. Developed by Goichi Hosoda, a Japanese journalist in the 1930s, its purpose was to allow traders to recognize the balance between price, time, and momentum at a single glance. (In Japanese, Ichimoku literally means “one look.”)
At the core of the system lie five key components: Tenkan-sen (Conversion Line), Kijun-sen (Baseline), Chikou Span (Lagging Line), and the two leading spans, Senkou Span A and Senkou Span B, which together form the well-known Kumo or cloud representing both temporal structure and equilibrium zones in the market.
Although Ichimoku is commonly used to identify trends and support/resistance levels, a deeper layer of time philosophy exists within it. Ichimoku was not designed solely for price analysis but equally for time analysis.
In the classical model, the numerical cycles 9, 26, 52 reflect the natural rhythm of the market originally based on the Tokyo Stock Exchange’s trading schedule in the 1930s.
These values repeat across the system’s calculations, forming the foundation of Ichimoku’s time symmetry where price and time ultimately seek equilibrium.
In recent years, modern analysts have explored new approaches to extract time-based turning points from Ichimoku’s structure. One such approach is the analysis of flat segments on the Kijun-sen and Senkou B lines.
Whenever one of these lines remains flat for a period, it signals temporary balance between buyers and sellers; when the flat breaks, the market exits equilibrium and a new cycle begins.
This indicator is built precisely upon that philosophy. Following the timing methodology introduced by M.A. Poursamadi, the focus shifts away from price signals and line crossovers toward identifying flat periods on Kijun-sen (period 52) as time anchors.
From the first candle that changes the line’s slope, the tool begins a temporal count using a fixed sequence of key numbers: 5, 9, 13, 17, 26, 35, 43, 52, 63, 72, 81, 90.
Derived from both classical Ichimoku cycles and empirical testing, these numbers mark potential timing nodes where a market wave may end, a correction may begin, or a new leg may form.
Thus, this method serves not merely as another Ichimoku tool but as a temporal metronome for market structure a way to visualize moments when the market is ready to change rhythm, often before candles reveal it.
🔵 How to Use
The Kijun Timing BoX is built entirely on Ichimoku’s concept of time analysis.
Its core idea is that within every flat segment of the Kijun-sen, the market enters a temporary balance between opposing forces.
When that flat breaks, a new time cycle begins. From that first breakout candle, the indicator starts counting forward through the predefined time sequence(5, 9, 13, 17, 26, 35, 43, 52, 63, 72, 81, 90).
This counting framework creates a temporal map of market behavior, where each number represents an area where meaningful price fluctuations often occur.
A “meaningful fluctuation” does not necessarily imply reversal or continuation; rather, it marks a moment when the market’s internal energy balance shifts, typically visible as noticeable reactions on lower timeframes.
🟣 Identifying the Anchor Point
The first step is recognizing a valid flat zone on the Kijun-sen.
When this line remains flat for several candles and then changes slope, the indicator marks that bar as the Anchor, initiating the time count.
From that point onward, vertical gray lines appear at each interval in the key-number sequence, visualizing the time nodes ahead.
🟣 Reading the Timing Lines
Each numbered line represents a timing node a temporal point where a change in price rhythm is statistically more likely to occur.
At these nodes, the market may :
Enter a consolidation or minor correction phase.
Develop range-bound movement.
Or simply alter the speed and intensity of its move.
These behaviors do not imply a specific direction; they only highlight zones where time-based activity tends to cluster, giving traders a clearer view of cyclical rhythm.
🟣 Applying Time Analysis
The indicator’s primary use is to observe temporal order, not to predict price direction.
By tracking the distance between Anchors and the reactions that appear near major timing lines, traders can empirically identify each market’s characteristic rhythm—its own time DNA.
For example, one asset may consistently show significant fluctuations around the 13- and 26-bar marks,while another might react closer to 9 or 52. Recognizing such patterns helps traders understand how long typical cycles last before new phases of volatility emerge.
🟣 Combining with Other Tools
The indicator does not generate buy/sell signals on its own.
Its best use is in combination with price- or structure-based methods, to see whether meaningful price reactions occur around the same timing nodes.
In practice, it helps distinguish structured time-based fluctuations from random, noise-driven moves an insight often overlooked in conventional market analysis.
🔵 Settings
🟣 Logical Settings
KijunSen Period : Defines the baseline period used for timing analysis. Default = 52. It is the main line for detecting flats and generating time anchors.
Flat Event Filter : Controls how flat segments are validated before triggering a new timing event.
All : Every flat triggers a new Timing Box.
Automatic : Only flats longer than the historical average are used (recommended).
Custom : User manually defines the minimum flat length via Custom Count.
Update Timing Analysis BoX Per Event : If enabled, a new Timing Box is drawn each time a new flat event occurs. If disabled, the box completes its 90-bar window before refreshing.
🟣 Ichimoku Settings
TenkanSen Period : Defines the period for the Conversion Line (Tenkan-sen). Default = 9.
KijunSen Period : Sets the standard Ichimoku baseline (not the timing line). Default = 26.
Span B Period : Defines the period for Senkou Span B, the slower cloud boundary. Default = 52.
Shift Lines : Offsets cloud projection into the future. Default = 26.
🟣 Display Settings
Users can show or hide all Ichimoku lines Tenkan-sen, Kijun-sen, Chikou Span, Span A, and Span B as well as the Ichimoku Cloud.
They can also customize the color of each element to match personal chart preferences and improve visibility.
🔵 Conclusion
This analytical approach transforms Ichimoku’s time philosophy into a visual and measurable framework. A flat Kijun-sen represents a moment of market equilibrium; when its slope shifts, a new temporal cycle begins.
The purpose is not to forecast price direction but to highlight periods when meaningful fluctuations are more likely to develop.
Through this perspective, traders can observe the hidden rhythm of market time and expand their analysis beyond price into a broader time-cycle dimension.
Ultimately, the method revives Ichimoku’s original principle: the market can only be truly understood through the simultaneous harmony of price, time, and balance.

Ethereum Logarithmic Regression BandsOverview
This indicator displays logarithmic regression bands for Ethereum. Logarithmic regression is a statistical method used to model data where growth slows down over time. I initially created these bands in 2021 using a spreadsheet, and later coded them in TradingView in 2022. Over time, the bands proved effective at capturing bull market peaks and bear market lows. In 2025, I decided to share this indicator because I believe these logarithmic regression bands offer the best fit for the Ethereum chart.
How It Works
The logarithmic regression lines are fitted to the Ethereum (ETHUSD) chart using two key factors: the 'a' factor (slope) and the 'b' factor (intercept). The formula for logarithmic regression is 10^((a * ln) - b).
How to Use the Logarithmic Regression Bands
1. Lower Band:
The lower (blue) band forms a potential support area for Ethereum’s price. Historically, Ethereum has found its lows within this band during past market cycles. When the price is within the lower band, it suggests that Ethereum is undervalued.
2. Upper Band:
The upper (red) band forms a potential resistance area for Ethereum’s price. The logarithmic band is fitted to the past two market cycle peaks; therefore, there is not enough historical data to be sure it will reach the upper band again. However, the chance is certainly there! If the price is within the upper band, it indicates that Ethereum is overvalued and that a potential price correction may be imminent.
