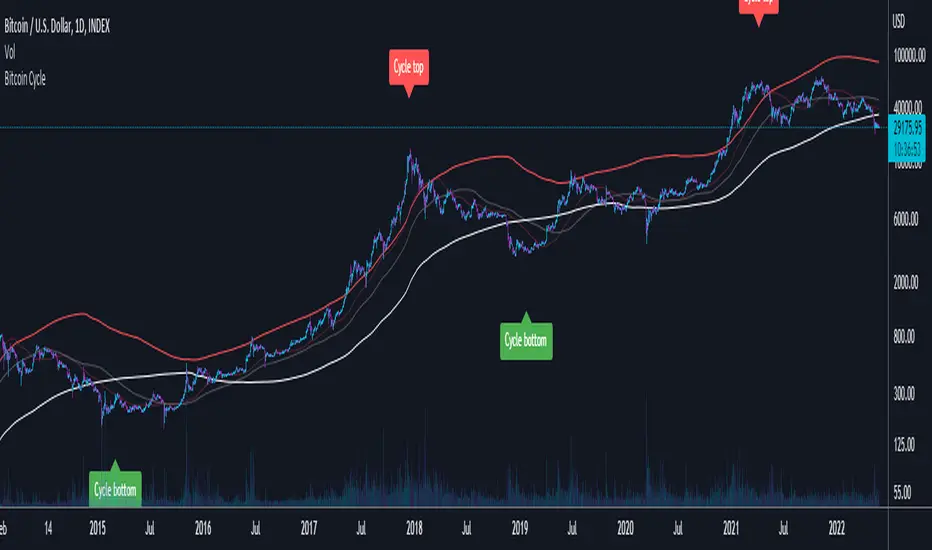
Bitcoin CycleThis script displays 4 different Moving Averages:
2 Year Moving Average (White)
1 Year Moving Average (Doubled in value, Red)
116 Day Moving Average (Transparent, Red)
232 Day Moving Average (Transparent, White)
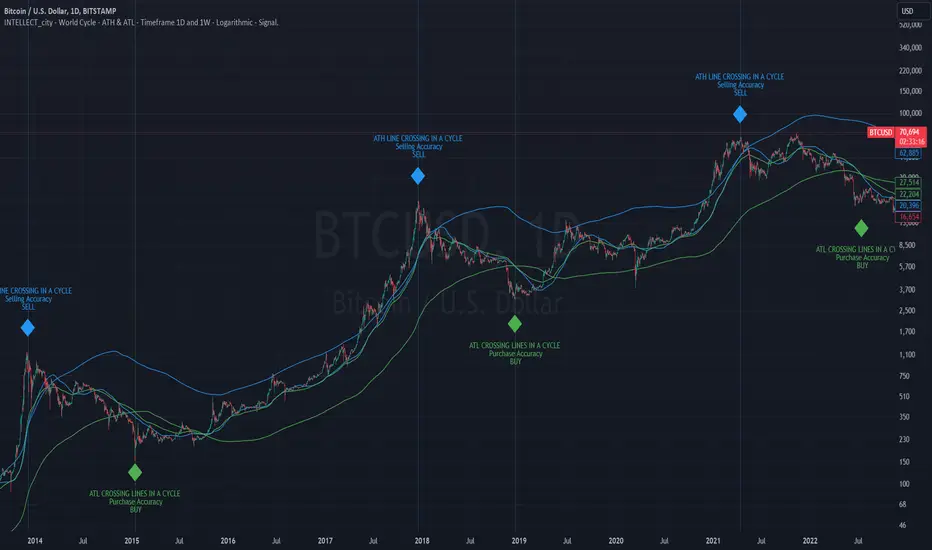
For the last cycles: once the 2 year MA crossed the 232 Day MA, it marked the cycle bottom within a few days and once the 1 year MA (x2) crossed the 116 Day MA, it marked the cycle top within a few days.
It is interesting to note that both 365/116 and 730/232 equal 3.1465, which is very close to Pi (3.142). It is actually the closest we can get to Pi when dividing 365 by another whole number.
Pine Script® indicator