VuManChu Cipher B + Divergences StrategyA Strategy using VuManChu Cipher B + Divergences for backtesting purpose.
Search in scripts for "Divergence"
Imbalance RSI Divergence Strategy# Imbalance RSI Divergence Strategy - User Guide
## What is This Strategy?
This strategy identifies **imbalance** zones in the market and combines them with **RSI divergence** to generate trading signals. It aims to capitalize on price gaps left by institutional investors and large volume movements.
### Main Settings
- **RSI Period (14)**: Period used for RSI calculation. Lower values = more sensitive, higher values = more stable signals.
- **ATR Period (10)**: Period for volatility measurement using Average True Range.
- **ATR Stop Loss Multiplier (2.0)**: How many ATR units to use for stop loss calculation.
- **Risk:Reward Ratio (4.0)**: Risk-reward ratio. 2.0 = 2 units of reward for 1 unit of risk.
- **Use RSI Divergence Filter (true)**: Enables/disables the RSI divergence filter.
### Imbalance Filters
- **Minimum Imbalance Size (ATR) (0.3)**: Minimum imbalance size in ATR units to filter out small imbalances.
- **Enable Lookback Limit (false)**: Activates historical lookback limitations.
- **Maximum Lookback Bars (300)**: Maximum number of bars to look back.
### Visual Settings
- **Show Imbalance Size**: Displays imbalance size in ATR units.
- **Show RSI Divergence Lines**: Shows/hides divergence lines.
- **Divergence Line Colors**: Colors for bullish/bearish divergence lines.
### Volatility-Based Adjustments
- **Low volatility markets**:
- Minimum Imbalance Size: 0.2-0.4 ATR
- ATR Stop Loss Multiplier: 1.5-2.0
- **High volatility markets**:
- Minimum Imbalance Size: 0.5-1.0 ATR
- ATR Stop Loss Multiplier: 2.5-3.5
### Risk Tolerance
- **Conservative approach**:
- Risk:Reward Ratio: 2.0-3.0
- RSI Divergence Filter: Enabled
- Minimum Imbalance Size: Higher (0.5+ ATR)
- **Aggressive approach**:
- Risk:Reward Ratio: 4.0-6.0
- Minimum Imbalance Size: Lower (0.2-0.3 ATR)
###Market Conditions
- **Trending markets**: Higher RSI Period (21-28)
- **Sideways markets**: Lower RSI Period (10-14)
- **Volatile markets**: Higher ATR Multiplier
## Recommended Testing Procedure
1. **Start with default settings** and backtest on 3-6 months of historical data
2. **Adjust RSI Period** to see which value produces better results
3. **Optimize ATR Multiplier** for stop loss levels
4. **Test different Risk:Reward ratios** comparatively
5. **Fine-tune Minimum Imbalance Size** to improve signal quality
## Important Considerations
- **False positive signals**: Imbalances may be less reliable during low volatility periods
- **Market openings**: First hours often produce more imbalances but can be riskier
- **News events**: Consider disabling strategy during major news releases
- **Backtesting**: Test across different market conditions (trending, sideways, volatile)
## Recommended Settings for Beginners
**Safe settings for new users:**
- RSI Period: 14
- ATR Period: 14
- ATR Stop Loss Multiplier: 2.5
- Risk:Reward Ratio: 3.0
- Minimum Imbalance Size: 0.5 ATR
- RSI Divergence Filter: Enabled
## Advanced Tips
### Signal Quality Improvement
- **Combine with market structure**: Look for imbalances near key support/resistance levels
- **Volume confirmation**: Higher volume during imbalance formation increases reliability
- **Multiple timeframe analysis**: Confirm signals on higher timeframes
### Risk Management
- **Position sizing**: Never risk more than 1-2% of account per trade
- **Maximum drawdown**: Set overall stop loss for the strategy
- **Market hours**: Consider avoiding low liquidity periods
### Performance Monitoring
- **Win rate**: Track percentage of profitable trades
- **Average R:R**: Monitor actual risk-reward achieved vs. target
- **Maximum consecutive losses**: Set alerts for strategy review
This strategy works best when combined with proper risk management and market analysis. Always backtest thoroughly before using real money and adjust parameters based on your specific market and trading style.

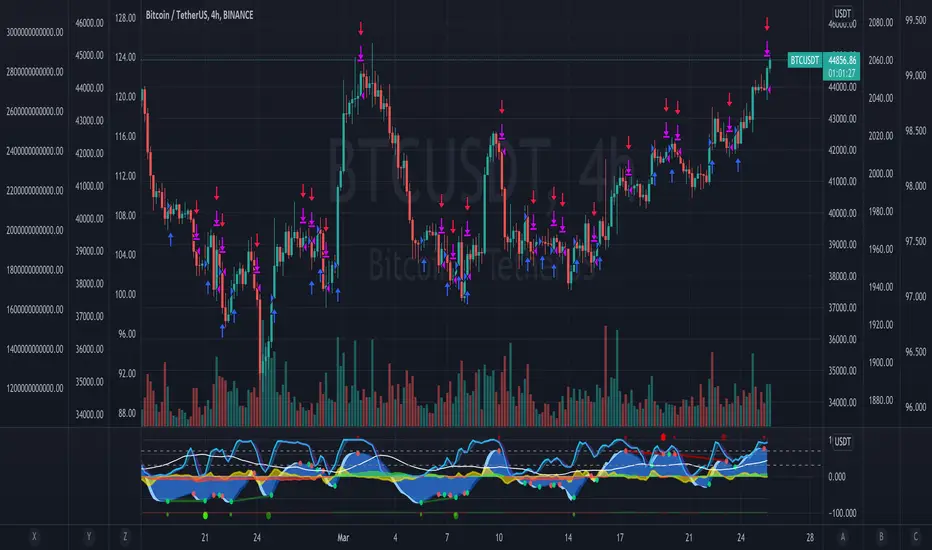
Kifier's MFI/STOCH Hidden Divergence/Trend BeaterMFI/STOCH Hidden Divergence/Trend Beater
General Idea:
My premise around this strategy was to make a general strategy for crypto that would help out with finding entry positions for when you’re bullish on a crypto and want to hold on for a while, and at the same time avoiding massive drops. Essentially a way to mix long term/ swing trading; I somewhat achieved my goal however it still requires a lot of logic tuning of the trend averages.
I’m a huge proponent of volume indicators and coupled with average closing price, I think this gives a really good idea of what is happening with the market. It gives an idea on the market and retail investor sentiment. This generally gives you logical entry positions (Although I don’t know how amazing that will work with all cryptos, there’s a fine line between a good strategy and one that just rides bubble market conditions, some would argue that’s still a success and others not)
How it works:
There are many components to the strategy that try to do different things:
First of all there are two types of entries, a MFI hidden divergence with a STOCH check, essentially it will only fire when a divergence is detected while STOCH is above 50%, however this might be changed in the future as due to the volatile nature of cryptos, the STOCH is not too effective. The second entry is a simple MFI/STOCH trend, if STOCH is above 50% and the trend is detected to be in a trending long, once a MFI crossover over the 50% line is detected an entry is placed, this is designed to get out profit where the divergence would otherwise be less accurate during strongly trending conditions.
-MFI is a great indicator, as a volume weighted momentum indicator I find it the most accurate of all, the STOCH however is a great indicator to get a general picture of simple market conditions and can filter out the emotional noise of retail investors.
-VWMA and an SMA (The bottom oscillator) gives an idea of the trend tacking into account of the volume, this serves as a more short term filter of the trend for filters.
-OBV checks are done between the OBV and an EMA of the OBV, to get the idea of a volume weighted long trend, which is important for crypto as there are massive rallies to go up due to retail greed, it’s great to jump onto it at the beginning, and get off before the stack of cards fall apart.
-ATR is used to detect when the market is relatively just ranging or moving sideways, which is where the hidden divergence entries are done, during predictable and profitable market conditions.
- Stop loss is based on the closest support of the entry, this is a nice medium of room to breath but also an actual stop loss.
Future plans and improvements:
Currently there’s a lot I want to improve, mostly the divergence detection and the overall sharpe ratio could be much better, but the current value of 0.5 gives me hope that the strategy is onto something. I also want to change TP from a percentage stop to something more dynamic but that might be too optimistic. The current plan is to paper trade test this either by manual or by a python bot, to see how it performs with some user input as well.

mark strategy2 divergence bot v0.5 for xbtusdHi first of all thanks for read this.
This is my second strategy for make trading, I optimized it for xbtusd with 30 min charts.
You can personalize some setting for reach a better result then me, these are the setting:
this script is only for long trade, so bearish divergence don't work
1)ema1
U can change this value for use another ema and use a faster or slower trend
2)ema2
U can change this value for use another ema and use a faster or slower trend
3)pivot right
U can change this value for watch a number of bar on your right
4)pivot left
U can change this value for watch a number of bar on your left
5)high range
U can change this value for watch a max number of bar
6)low range
U can change this value for watch a min number of bar
7)bullish
U can change this value for enable signal with bullish divergence
8)hidden bullish
U can change this value for enable signal with hidden bullish divergence
9)bearish
U can change this value for enable signal with bearish divergence
10)hidden bearish
U can change this value for enable signal with hidden bearish divergence
11)profit 1 %
U can change this value for the first take profit target
12)profit 2 %
U can change this value for the second take profit target
13)qty target 1 %
U can change this value for close a % of your trade at target 1
14)loss %
U can change this value for close the trade at a % of loss
Have nice day and send me a message if u will earn with my strategy.
If u want my code send me a message
for info send me a message

inwCoin Bullish/Bearish Divergence - Risk% StrategyEnglish
=========
inwCoin RSI Bullish/ Bearish Divergence Startegy.
RSI Bullish and Bearish divergence is a popular strategy that most people use to find the "reversal pattern" and bet on it.
...But is it really profitable in long run?
To find the answer, I write this strategy to test this hypothesis and the result is interesting.
------
How it work?
------
As you know, the main logic of bullish / bearish divergence are..
Buy Signal : RSI higher low in Oversold zone and price lower low
Sell Signal : RSI lower high in Overbought zone and price lower high
I also add some parameters to my strategy
1) Use stop loss + specific stop loss level
2) lookback period = RSI / Price lookback period to find divergence
----------
The result
----------
Not working at all.
It working ok in some period of time like in sideway market
But when uptrend established, it can't make any profit ( well, it's mean reversion strategy after all haha )
Also, when market keep crashing like in Nov 2018.
This strategy got stop out so many times before you can make 1 profitable trade....
But that trade won't last long because you have to take profit when you got bearish divergence signal.
----------
Conclusion
----------
Combine with trend following strategy.
This strategy might be able to fill the gap of sideway market.
But don't depend solely on this strategy because in long run, it can't beat the market.

Stochastic Divergence StrategyBackground bars:
Bearish
gradient from slightly bearish divergence to strong bearish divergence for red and a double bounce for pink
Bullish
gradient from slightly bearish divergence to strong bearish divergence for green and a double bounce for yellow
removable buy and sell signals in options
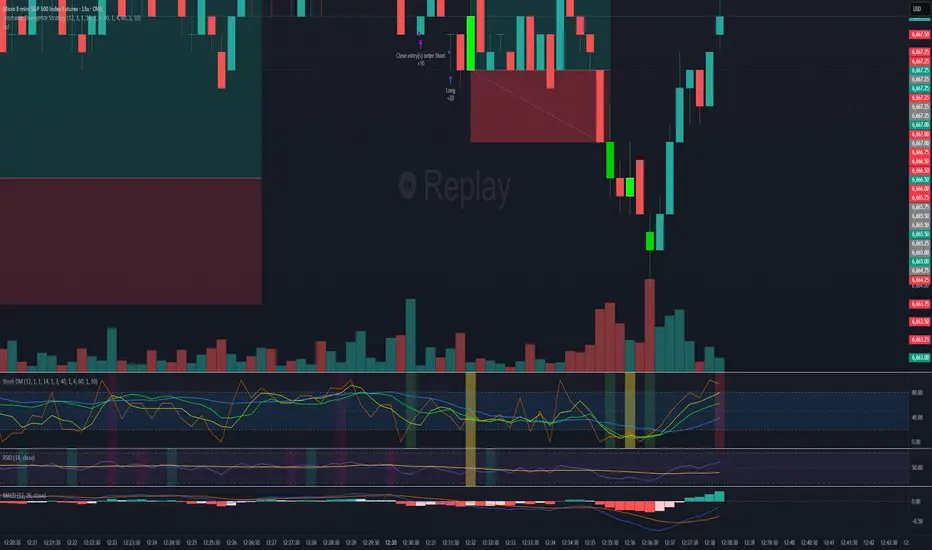
CVD Divergence + Volume HMA RSI MACD StrategyHow the script works:
The script calculates the HMA for trend direction. The HMA (shown in orange) is used as a filter: long trades are taken only if price is above the HMA, and short trades when below.
The CVD is computed by cumulatively adding volume on up bars and subtracting volume on down bars.
Pivot routines (with the input "Pivot Length") detect swing lows/highs for both price and CVD. A bullish divergence is flagged when the price makes a lower low while the CVD makes a higher low. Similarly, a bearish divergence is flagged when the price makes a higher high while the CVD makes a lower high.
Trading is triggered when the divergence condition also agrees with the HMA filter.
Feel free to further adjust the parameters or add risk‐management/exit rules as needed for your trading style.

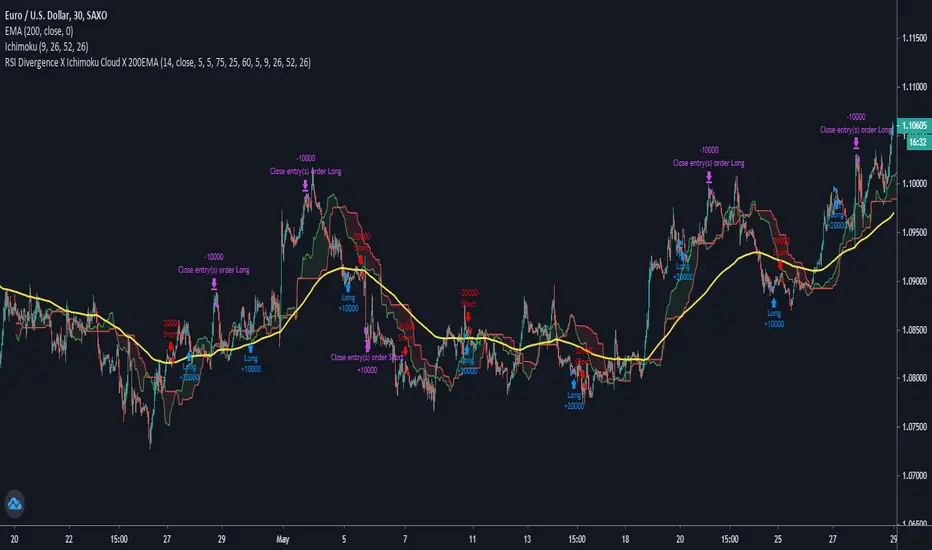
RSI Divergence X Ichimoku Cloud X 200EMAHi all,
This script is a combination of the RSI Divergence Strategy combined with Ichimoku Cloud and 200 EMA .
A long position is entered only when the RSI identifies a bullish divergence (either regular or hidden), and that the Ichimoku Cloud is above the 200 EMA . This is to ensure that there is a confirmation of a bullish trend before an entry.
Similarly, a short position is entered only when the RSI identified a bearish divergence (either regular or hidden), and that the Ichimoku Cloud is below the 200 EMA . This is to ensure that there is a confirmation of a bearish trend before an entry.
I find that this script works best on Intraday charts.
This is just a simple script I built on my third attempt of backtesting strategies on TradingView. Do give it a go and let me know if you guys have any feedback or comments about it. Happy trading!
RSI5_50 with DivergenceThis is variation of RSI Divergence strategy.
I have added a filter (long term RSI) to the Rules. strategy BUYs when RSI 50 period is above 50 line and there is divergence on the short term RSI
settings
=========
short term RSI period 5
long term RSI period 50
stopLoss is 8% --- if setting is enabled
BUY Rule
========
RSI 50 is above 50 line
short term RSI is showing divergence
Add to existing
==============
if already in position, BUY when shorTermRSI is crossing above 20
TakeProfit
=========
when longTermRSI reaches 60,65, 70 and 75 level , take partial profits .
(not when crossing down --- This may affect on profits , because when price goes down , it goes very fast )
Exit
=====
when longTermRSI is crossing down 30
OR stopLoss value hits
Note: When I tested this with GOOGL stock , I have got excellent results ... any experts there , please check everything is good with scripting ...
Happy Trading

Multi-Oscillator Divergence StrategyNote: This is a modified version of TradingView's built-in "Divergence Indicator" and applied in "Strategy" format to show back testing results
It finds bullish and bearish divergence in a selection of well known MA formulas: MACD, RSI, STOCH, DETRENDED PRICE OSCILLATOR, MOMENTUM.
I've found good results even on 1 minute charts!
In this example the chart backtest is utilizing the detrended price oscillator (DPO)
There are multiple variables, so the ability to find good back test can sometimes be "time consuming"
And please note that if you increase "Pivot LookBack Right" variable too high, then you will increase chance of repaint. Keep this variable as low as possible
I've also drawn my own solutions on the chart (red and green trend lines) to find good take profit and safe stop loss. In order to study this properly you need the own the chart. Scripts don't give you this option.
See private chart publication link to "own" the chart for yourself. Simply click on the "Share" button (it's the megaphone icon) and click on "Make it Mine"
I've found the best approach is to create 5 copies of indicator on 1 chart and have each running with different MA formula. This will give you a majority consensus type environment.
I will post study with alert conditions next
Good luck and enjoy!

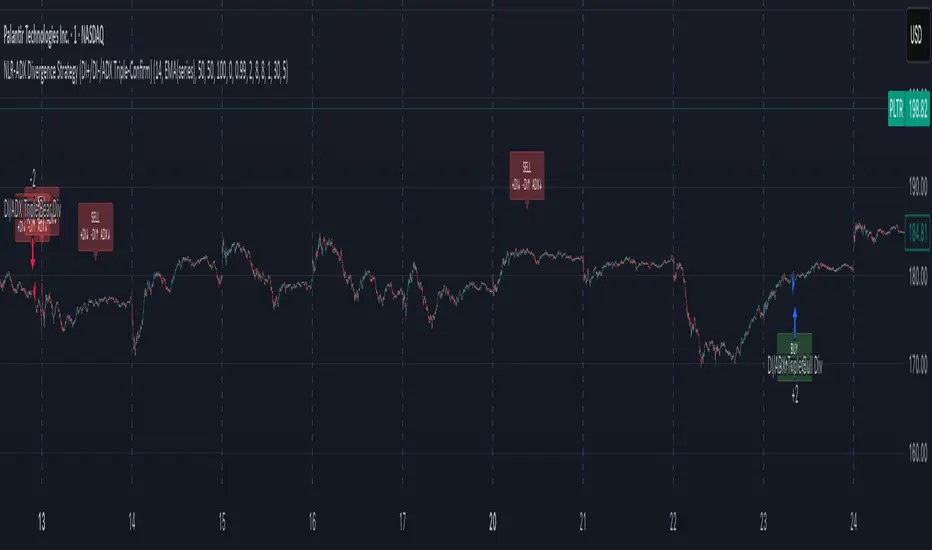
NLR-ADX Divergence Strategy Triple-ConfirmedHow it works
Builds a cleaner DMI/ADX
Recomputes classic +DI, −DI, ADX over a user-set length.
Then “non-linear regresses” each series toward a mean (your choice: dynamic EMA of the series or a fixed Static Mid like 50).
The further a value is from the mean, the stronger the pull (controlled by alphaMin/alphaMax and the γ exponent), giving smoother, more stable DI/ADX lines with less whipsaw.
Optional EMA smoothing on top of that.
Lock in values at confirmed pivots
Uses price pivots (left/right bars) to confirm swing lows and highs.
When a pivot confirms, the script captures (“freezes”) the current +DI, −DI, and ADX values at that bar and stores them. This avoids later drift from smoothing/EMAs.
Check for triple divergence
For a bullish setup (potential long):
Price makes a Lower Low vs. a prior pivot low,
+DI is higher than before (bulls quietly stronger),
−DI is lower (bears weakening),
ADX is lower (trend fatigue).
For a bearish setup (potential short)
Price makes a Higher High,
+DI is lower, −DI is higher,
ADX is lower.
Adds a “no-intersection” sanity check: between the two pivots, the live series shouldn’t snake across the straight line connecting endpoints. This filters messy, low-quality structures.
Trade logic
On a valid triple-confirm, places a strategy.entry (Long for bullish, Short for bearish) and optionally labels the bar (BUY or SELL with +DI/−DI/ADX arrows).
Simple flip behavior: if you’re long and a new short signal prints (or vice versa), it closes the open side and flips.
Key inputs you can tweak
Custom DMI Settings
DMI Length — base length for DI/ADX.
Non-Linear Regression Model
Mean Reference — EMA(series) (dynamic) or Static mid (e.g., 50).
Dynamic Mean Length & Deviation Scale Length — govern the mean and scale used for regression.
Min/Max Regression & Non-Linearity Exponent (γ) — how strongly values are pulled toward the mean (stronger when far away).
Divergence Engine
Pivot Left/Right Bars — how strict the swing confirmation is (larger = more confirmation, more delay).
Min Bars Between Pivots — avoids comparing “near-duplicate” swings.
Max Historical Pivots to Store — memory cap.
Crypto Scalper Divergence Macd Psar Ema 200This is a very efficient crypto scalper adapted to very short timeframes, however it can be optimized for other timeframes and assests as well.
Its components are
MACD
P SAR
EMA 200
Risk management
Rules for entry:
For short : we have an uptrend on PSAR , histogram is positive (divergence MACD) and close of a candle is below EMA 200
For long : we dont have an uptrend on PSAR, histogram is negative(divergence MACD) and close of a candle is above EMA 200
Rules for exit:
We exit when we either find a reverse condition than the entry one, or based on stop loss/take profit that are calculated on % movements of the price.
If you have any questions, let me know !

Ema-Weighted-GainStrategy Inputs: Capital=$10,000, Pyramiding=3, Default Quantity=1
Please note that the strategy buys when the WMA (Blue line) cross under zero and sell above it, your experience is very important in using this indicator. Do not follow the buy/sell signals. Read the plot as I explain in the Uses Section and make your own conclusion on how to use it.
Description,
This Strategy uses multiple Ema’s to calculate Weighted HPR's.
I have calculated the weight numbers based on Fibonacci.
Uses:
NOTE!! (Please Do not take those uses to be 100% Guaranteed. User your experience and judgment to decide your trade).
Zoom out to see all the arrows
White line (MA)
Blue line (WMA)
First
Ride Trends,
1-Downtrend: short
a-MA IS going down
b-Entry: WMA cross above or near the MA (White Arrows).
2-Uptrend:long
a-MA is going up
b-Entry: WMA goes below MA or Near it(Green Arrows).
Second
Trend Reversal
1-buy entry.
WMA at zero, or very close to it, in pullback (Yellow Arrows).
2-short entry
WMA at zero, or very close to it, in a bounce (Orange Arrows).
Third
Divergence as explained in the Red Arrows.
Conclusion,
Red Arrows= Divergence
Green Arrows= Buy entry (The stock is in uptrend)
Yellow Arrows= Buy entry (the stock is in downtrend and could reverse)
White arrows= short entry (the stock is in downtrend)
Orange arrows=short entry (the stock in uptrend and can reverse)
If you are interested, send a private message

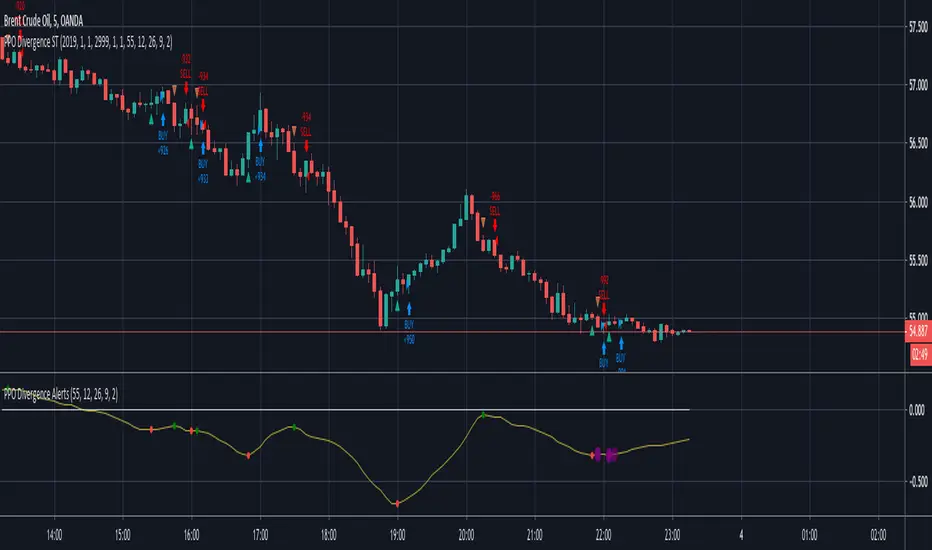
inwCoin Sto RSI Bullish/Bearish Divergence + Scalping StrategyStochastic RSI is well-known oscillator indicator for finding potential bottom/top within each timeframe.
Inspired by some dude from twitter that showing how his bot is working. So I tried to write this strategy to work with small timeframe.
After trial and error, I found out that if we take profit by using previous high of lookback period, we still able to make some profit with small TF.
How it work?
---------------
1) This strategy will find the STO RSI bullish or bearish divergence in 15 min timeframe, if found one, it will enter the trade long or short.
2) If price sideway and the candle since last entry is more than "Cooldown period", it will start looking for STO RSI bull/bear divergence again.
3) It will keep pyramid your entry to "max pyramid" option
4) If price close above or below previous high/low from "TP lookback period" option, it will take profit or take loss of that position.
Cautions
-----------
1) The result is good because in the pass 2 months, we enter bull trend for BTC and other crypto.. So chance that we able to close position with profit is alot higher than loss.
2) But if trend change. This scalping strategy is dangerous to use, because you will take loss down and your loss will build up every single day. ( Make sure to filter trend first )
3) I tried with bear trend with short trade, and it seem profitable. ( But you'll bankrupt if you run long scalp in downtrend, and vise versa )
Alert?
------
I also have alert version of this strategy, if you want to use, please let me know.

Dane: RSI MACD StrategyRSI / MACD Divergence Strategy . Published for customer verification and acceptance. Unfortunately, access can only be provided to the customer.
For those interested in custom development services, please visit the backtest-rookies (.com) website for more information.
Features
RSI & Price divergence detection
Open a trade window when trade conditions are met
Enter the trade on confirmation
Stop losses / take profit custom levels based of daily pivot values


Structure Break Out + rsi divergence + alma SIMPLIFIED OBJECTIVE (dyor, nfa, test different assets and diff TF)
The goal of this script is to act as a Reversal Sniper. Most traders lose money by trying to guess the top or bottom of a market too early. This strategy solves that by waiting for two specific events to happen together:
First, a hidden shift in momentum (RSI Divergence).
Second, a confirmed change in price direction (Crossing the ALMA 20 Blue Line).
This ensures you only enter a trade when the market has confirmed it is ready to reverse.
TRADING RULES
BUY SIGNAL (Long Position)
Step 1: Look for a GREEN DIV label below the candles. This warns you that sellers are exhausted.
Step 2: Wait for a GREEN TRIANGLE with the text GO. This confirms the price has crossed above the Blue Line.
Step 3: Enter the Buy trade immediately when the candle with the GO signal closes.
SELL SIGNAL (Short Position)
Step 1: Look for a RED DIV label above the candles. This warns you that buyers are exhausted.
Step 2: Wait for a RED TRIANGLE with the text GO. This confirms the price has crossed below the Blue Line.
Step 3: Enter the Sell trade immediately when the candle with the GO signal closes.
EXIT RULES (How to Close the Trade)
The script draws lines on the chart to help you manage the trade.
Scenario A: The Perfect Win (Target Hit)
If price hits the Green Line, the trade is closed automatically for a profit. This is your Risk-Reward Target.
Scenario B: The Trend Change (Reversal)
If the price turns around and crosses the Blue Line in the wrong direction, close the trade immediately. Do not wait for the stop loss. This protects your profits or keeps losses small.
Scenario C: The Safety Net (Stop Loss)
If price hits the Red Line, the trade is closed for a loss. This is your safety guard to prevent a small loss from becoming a big one.
IMPORTANT NOTES
Never trade a DIV label without a GO signal. The DIV is just a warning; the GO is the trigger.
- This strategy works best on 15-Minute and 1-Hour timeframes.
- If t
he Blue Line is flat, be careful, as the market may be ranging. Ideally, you want to see the Blue Line angling up or down.

TradePro's Trading Idea Cipher Divergence EMA Pb StrategyHere I present you on of Trade Pro's Trading Idea: Cipher B+ Divergence EMA Pullback Strategy.
Optimized the crypto pairBTC/USDT in the 30 minute chart.
There is the possibility to switch between short and long positions.
You can choose between 2 different take profit/stop loss types: The Lowest Low/ Highest High Stop Loss/ Take Profit and the ATR Take Profit/ Stop Loss.
-----------------------------------------------------------------------------------
How does the strategy work?
ENTRY
Long
The price must be above the 200 EMA .
The price needs to make a pullback into the 50 EMA .
Right after that, the Cipher B indicator must give a buy signal, it must be below the zero line and the Money Flow cloud must be green.
Short
Contrary to the premise of long positions.
EXIT
Lowest Low/ Highest High Exit
The Lowest Low (long) / highest high (short) serves as the stop loss. The TP is formed on the basis of a factor.
(Long for example: *Lowest Low* multiplied by *Profitfactor* = TP).
ATR Exit
The value of ATR at the time of buying is multiplied by the value entered in "Profit factor ATR" and "Stop factor ATR". As soon as the price reaches this value, it is closed.
Important
The script must be optimized for each coin or currency pair. However, only the values for the profit factor, the stop loss and Lowest Low / Highest High are relevant.
Also, by changing the Chanel Length and the Chanel Average, you can create strong profit changes.
The results of the strategy are without commissions and leverage.
If you have any questions or feedback, please let me know in the comments.
If you need more information about the strategy and want to know exactly how to apply it, check out my profile. There I have created a tutorial for the function of the script.

MACD++ Strategy [SystemAlpha]This is a strategy based on MACD Oscillator. Instead of using just the normal crossovers, we use trend filters, trailing stop loss and take profit targets. This strategy was developed for crypto, forex and stocks on daily timeframe but feel free to experiment on 15 minutes or higher using heikin ashi or normal candles
In this strategy you have a choice of:
Trend Filters:
- Average Directional Index ( ADX ) – buy when price is trend is up and sell when trend is down.
- Moving Average (MA) – buy when price close above the defined moving average and sell when price close below moving average
- Parabolic SAR – buy when SAR is above price is above price and sell when SAR is below price.
- All - Use ADX , MA and SAR as filters
For MA Filter , you can use the “TF MA Type” and "TF MA Period" parameter to select Simple or Exponential Moving Average and length.
Stop Loss:
- Average True Range (ATR) – ATR % stop as trailing stop loss.
- Parabolic SAR ( SAR ) – Parabolic SAR adapted as trailing stop loss.
For ATR , you can use the “ATR Trailing Stop Multiplier” parameter to set an initial offset for trailing stop loss.
Take Profit Target:
- Average True Range (ATR) – ATR % stop as trailing stop loss.
- Standard % – Percent as target profit
For ATR , you can use the “ATR Take Profit Multiplier” parameter to set an initial offset for trailing stop loss.
Additional feature include:
- Regular and Hidden Divergence display and alerts
STRATEGY ONLY:
- Set back test date range
- Set trade direction - Long, Short or Both
- Use timed exit - Select method and bars
- Method 1: Exit after specified number of bars.
- Method 2: Exit after specified number of bars, ONLY if position is currently profitable.
- Method 3: Exit after specified number of bars, ONLY if position is currently losing.
TradingView Links:
Alerts:
MACD:
How to use:
1. Apply the script by browsing through Indicators --> Invite-Only scripts and select the indicator
2. Once loaded, click the gear (settings) button to select/adjust the parameters based on your preference.
3. Wait for the next BUY or SELL signal to enter the trade!
Disclaimer:
The indicator and signals generated do not constitute investment advice; are provided solely for informational purposes and therefore is not an offer to buy or sell a security; are not warranted to be correct, complete or accurate; and are subject to change without notice.

Pivot Sniper (Double RSI, Safe Zones, Divergence, Trend Sensor)Pivot Sniper establishes safe zones to trade at the top half or bottom half of the market using 1000 bar highest high and lowest low respectively. It makes entry decisions scanning for a special RSI pattern and then confirms using Divergence and whether it is above or below a moving average. It also has a trend sensor that avoid betting against long running trends.
Use on a 5 minute chart only. It needs this resolution to make it's decisions. It is designed for forex only.
If you would like access to try this script out post below or message me.
Thanks, Doug