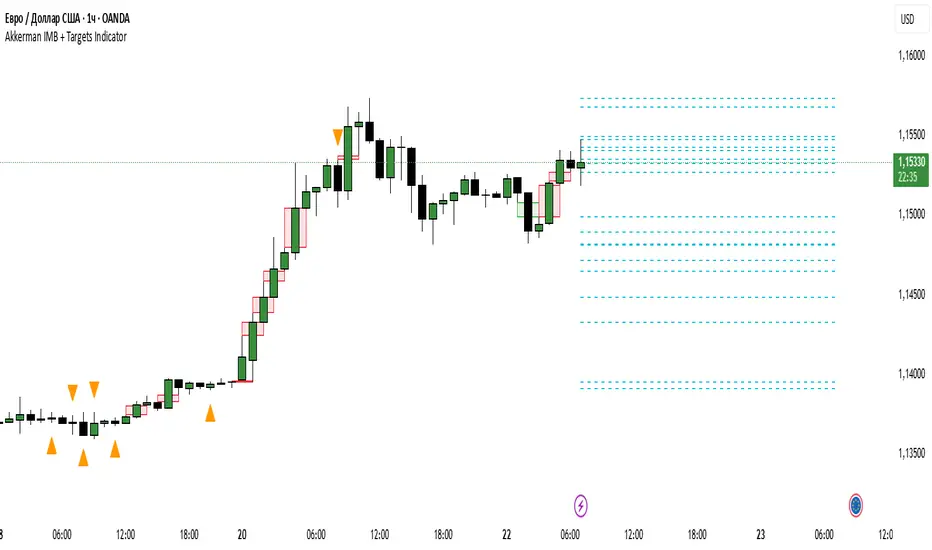
Akkerman IMB + Targets IndicatorAkkerman IMB + Targets Indicator
The Akkerman IMB + Targets Indicator is a powerful tool for traders who use the Smart Money Concept (SMC) methodology for intraday trading. This indicator combines several key elements of technical analysis, such as IMB (Imbalance) zones, liquidity zones, and intraday targets, to help traders identify significant levels on the chart for potential entry and exit points.
Main Features of the Indicator:
IMB (Imbalance) Zones:
The indicator detects IMB zones (imbalances) on the chart, which are often significant for the market because these zones can signal unsupported price moves where the market may either retrace or continue the move.
Green box — indicates a bullish IMB, where the price moves downward but does not reach the previous "low" level.
Red box — indicates a bearish IMB, where the price moves upward but does not reach the previous "high" level.
Liquidity Zones:
The indicator automatically identifies liquidity zones, which are critical levels for potential retracements or breakouts. These zones are determined by equal highs and lows on the chart (where the price has made similar highs or lows).
Triangles or lines highlight levels where significant buy or sell orders might be gathered.
Intraday Target Lines:
The indicator generates targets for intraday trading based on support and resistance levels over the last 10 periods.
These target lines on the chart indicate potential entry or exit points based on the lowest and highest prices over the past 10 bars, which represent key points for trading within the current session.
Indicator Settings:
Show IMB: Toggle to show or hide IMB zones on the chart.
Show Liquidity Zones: Toggle to show or hide liquidity zones on the chart.
Show Targets (Intraday): Toggle to show or hide intraday target lines.
Max Targets (maxTargets): Set the maximum number of targets to display on the chart.
How to Use:
IMB Zones help identify potential retracement or breakout zones on the market. These zones are a critical part of Smart Money analysis, as markets often retrace to these areas after significant price moves.
Liquidity Zones provide clues about where large orders may be gathered, which could lead to a retracement or breakout.
Intraday Targets assist in identifying important levels for entering or exiting trades within the current session to take advantage of short-term price movements.
Important Notes:
This indicator works best on the 1-hour timeframe (H1) for more accurate and stable signals.
For maximum effectiveness, it is recommended to combine this indicator with other technical indicators and analysis methods.
Search in scripts for "Fractal"
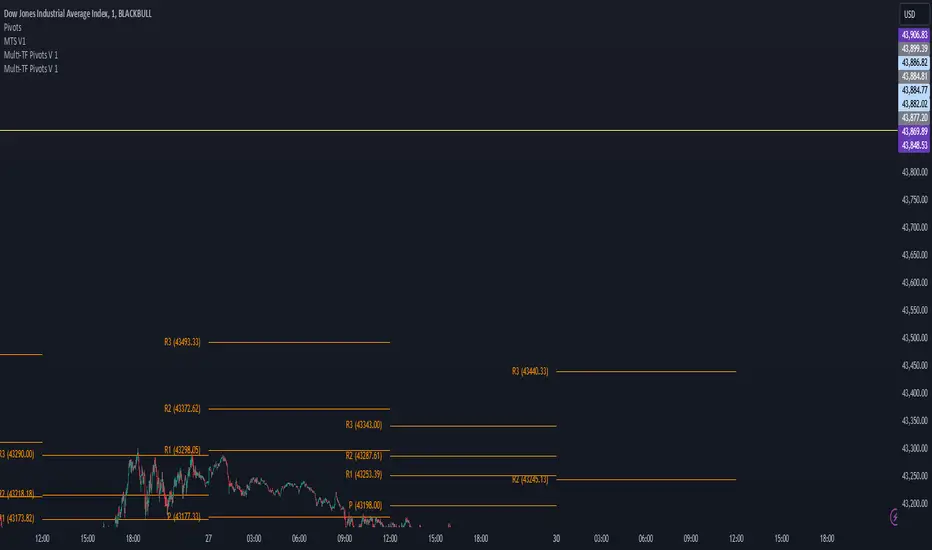
Multi-TF Pivots V1The Multi-TF Pivots Indicator is a powerful and customizable pivot point tool for TradingView. This script allows traders to calculate and display pivot points on a wide range of timeframes, from 1-minute to weekly intervals. It supports both Classic and Fibonacci pivot styles and includes options to customize line colors, label positions, and price visibility. The indicator is ideal for traders who rely on pivot points for intraday and swing trading strategies, offering a clear visual representation of key support and resistance levels. With its flexibility and comprehensive features, this indicator is an essential tool for precise technical analysis.
اندیکاتور Multi-TF Pivots یک ابزار قدرتمند و قابل تنظیم برای محاسبه و نمایش پیوت پوینتها در پلتفرم TradingView است. این اسکریپت به معاملهگران امکان میدهد پیوت پوینتها را در طیف گستردهای از تایمفریمها، از ۱ دقیقه تا هفتگی، محاسبه و نمایش دهند. این اندیکاتور از سبکهای پیوت Classic و Fibonacci پشتیبانی میکند و گزینههایی برای شخصیسازی رنگ خطوط، موقعیت برچسبها و نمایش قیمتها دارد. این ابزار برای معاملهگرانی که به پیوت پوینتها برای استراتژیهای معاملاتی روزانه و نوسانی متکی هستند ایدهآل است و نمایش بصری واضحی از سطوح کلیدی حمایت و مقاومت ارائه میدهد. با انعطافپذیری و ویژگیهای جامع خود، این اندیکاتور یک ابزار ضروری برای تحلیل تکنیکال دقیق است
Clube 369 LTA Concepts: Session Breaks & NYSE, Sunday OpenThe "Limitless LTA: Session Breaks & Sunday Open" indicator is a simple tool designed to help traders better understand market timing and track the opening price of the trading week. Here's what you need to know:
What It Does:
Displays vertical lines on the chart to mark specific times of interest, usually 18:00 PM UTC-5 over the last four days.
Plots a line representing the price of the first candle of the trading week, typically on a Sunday.
Customization:
Users can customize the appearance of the vertical lines by adjusting style, width, and color preferences.
Benefits:
Provides a visual reference for significant timestamps and the Sunday open price.
Helps traders understand market sentiment and potential trends.
In summary, the "Limitless Timestamp & Sunday Open" indicator is an accessible tool for traders to track important market timings and price movements, enhancing market analysis and decision-making.
Sunday Open Fixed on all timeframes.

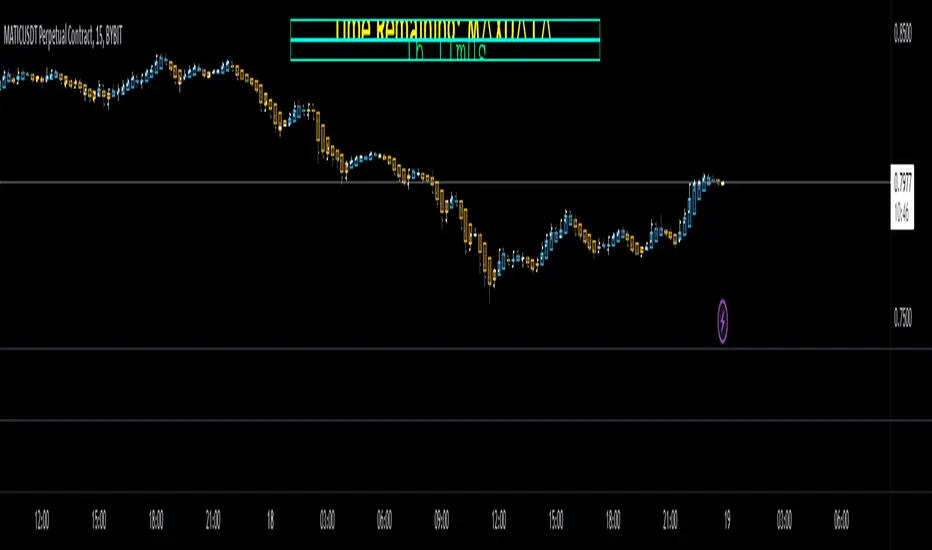
C-R Count-downThis custom countdown indicator is designed for traders who want to track the time remaining until a specific event, such as the end of a trading session or a defined trading period. The indicator's settings include the target time (excluding seconds), allowing users to set their own time horizon based on their strategy.
Settings:
Target Time: You can set the target time by simply entering the hour without seconds. For example, if you want to track the time remaining until the end of the trading session, enter the market closing time.
Display Sizes: It is possible to choose from three different display sizes to customize the appearance of the indicator according to your preferences.
Custom Text: Additionally, you have the option to add a motivational phrase or any relevant information inside the table. This can serve as a crucial reminder before the opening of the respective session.
Usage:
This indicator is particularly useful for intraday traders, especially scalpers, who want to plan their trading activities based on a specific duration. It provides quick and convenient visibility into the time remaining before a key event.
Notes:
Seconds are not considered in the settings unless your TradingView subscription supports seconds.
Ensure to adjust the target time according to the timezone of your trading platform.
Don't forget to add an offset (e.g., "-1" for UTC+1) if necessary. For example, if the timezone is set to Paris (UTC+1) and it's currently 9:50 PM, setting the indicator to 10:00 PM will display 10:10 PM. Thus, you'll need to add an offset of (-1) to get the correct countdown.
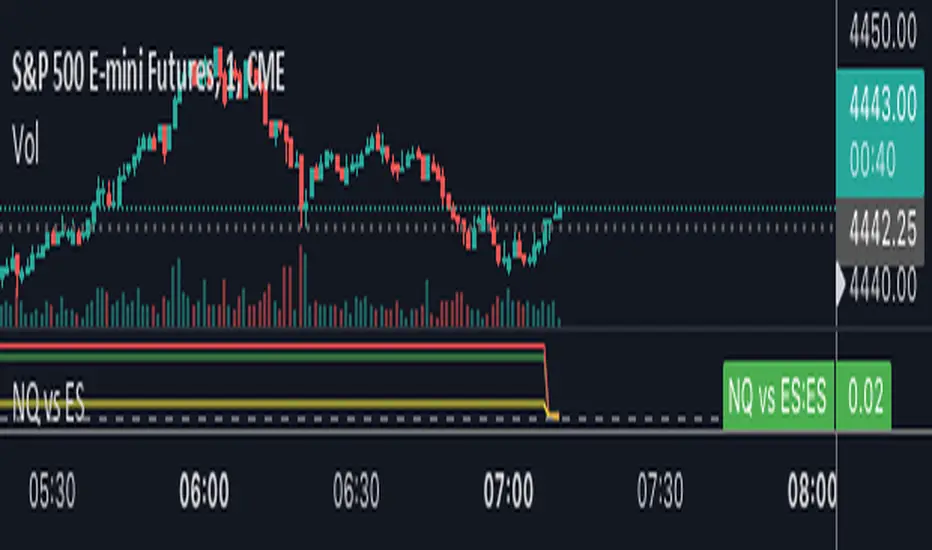
NQ vs ESThe script shows the spread between the realtime NQ and ES percentage change from the day before, from which it is possible to see if NQ is outperforming or underperforming the ES.
Customizable open prices by dokterfuseThis indicator is made for educational and study purposes only.
The reason I made this script was to have open price lines which are able to be customized to your preferred timeframe.
You can go to the settings and select your timeframe and the indicator will draw out the line with a text label.
Timeframes:
- 5m
- 15m
- 30m
- 1h
- 2h
- 4h
- 8h
I also made sure to have the options to draw out the daily, weekly, and monthly open so you don't have to add another script.
Planning to add NY-midnight open and 08.30 open in the next update

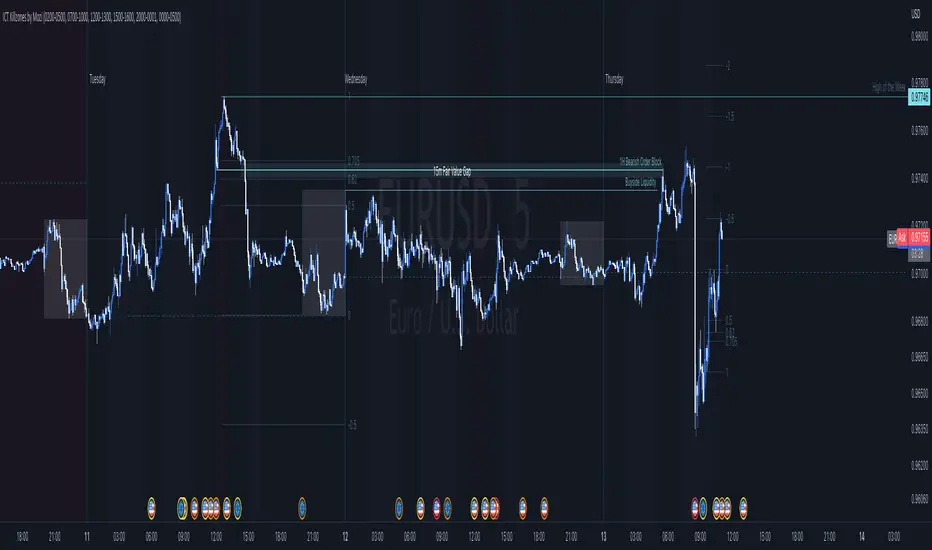
ICT Killzones by MoziThe ICT Killzone and important times indicator.
It highlights:
London Killzone
New York Killzone
New York Lunch Hour
New York Day End Hour
Asian Range
Judas Swing Time
In addition to this, it highlights the US and UK holidays with a background color and a label, so that you don't miss any bank holiday and you are sitting in front of your charts and are wondering, why the chart is not moving ;-)
I manually draw vertical lines at specific times like 08:30 London, 09:30 London, 08:30 New York, 09:30 New York, 11:00 New York (Take Profit Time)
ICT Killzones by MoziThe ICT Killzone and important times indicator.
It highlights:
London Killzone
New York Killzone
New York Lunch Hour
New York Day End Rallye
Asian Range
Judas Swing Time
In addition to this, it highlights the US and UK holidays with a background color and a label, so that you don't miss any bank holiday and you are sitting in front of your charts and are wondering, why the chart is not moving ;-)

Entanglement Penscript name: Entanglement Pen
For left traders, how to accurately find the bottom and top is very important, and there are various methods. I have shared the bottom type script composed of three bars before, but this type of bottom type is effective in a small range. So, this script is sharing " Entanglement Pen ", which can help us determine bottoms and tops on a global scale.
However, this script uses an approximate reduction method rather than the orthodox solution of entanglement.
After roughly finding the bottom and top, how to determine that these are the bottom and top that meet the definition of entanglement theory?
The main 2 methods of "approximate reduction" are:
(1) The price difference between the top and the bottom is large enough, that is: the lowest price at the top > the highest price at the bottom.
(2) The stock price before the top has continued to rise, that is: both the highest point and the lowest point are rising. In the same way, the stock price before the bottom has a continuous decline, that is: both the high and the low point are falling.
A big disadvantage of this script is that it needs to use future data. This is because:
When multiple bars meet the top definition in a short period of time, only the last bar is used, which is defined as a big top. So, when you see a top appear, you don't know it's not a real top, because it might be followed by a bar that also matches the definition of the top.
When displayed on the graph, bars that meet the top definition have a gray label, which is the small top. Each small top is a big top (with a blue label) at the beginning, and when another small top appears after it, it becomes a gray small top.
Regarding the limit on the number of bars by TradingView:
The logic of calculating the small top and the small bottom is relatively simple, it does not need to use future data, and the amount of calculation is small, so it is the default TradingView limit. (The limit is 2000 in the script, but in practice TradingView won't let us use such many bars)
The calculation logic of the big top and the big bottom is more complicated, and it needs to use future data. The calculation amount is very large, and only the most recent 150 bars can be calculated. The user can try to enter a larger value, but TradingView may report an error. If an error occurs, please enter a lower value. When loading for the first time, it takes a long time, which is indeed not common in general TradingView scripts, but please be patient.
The next version may add the alert function, that is: when the top and bottom appear, the alert function is called. But this only applies to small tops and bottoms, because when the alert is sent,, none of us know what data will be in the future.
Introduction in Chinese:
脚本名称:缠论笔
对于左侧交易者来说,如何准确地找到底部和顶部是非常重要的,方法也是多样的,之前已经分享了三根bar组成的底分型脚本,但这种底分型生效的范围较小,缺乏全局视野。所以,这次的脚本分享的是“缠论笔”,它能帮我们在全局尺度内确定底部和顶部。
不过,此脚本使用的是近似还原的方法,而非缠论的正统解法。
粗略找到底和顶之后,如何确定这就是符合缠论定义的底和顶呢?
“近似还原”的主要2个方法是:
(1)顶部与底部的价差足够大,即:顶部的最低价>底部的最高价。
(2)顶部之前的股价有持续的上涨,即:最高点和最低点都在上涨。同理,底部之前的股价有持续的下跌,即:最高点和最低点都在下跌。
这个脚本的一大缺点是:需要使用将来的数据。这是因为:
当短期内有多个bar都符合顶部定义时,只使用最后一个bar,定义为大顶。所以,当你看到一个顶部出现时,你不知道这不是真的顶部,因为它之后可能还会出现符合顶部定义的bar。
在图上显示时,符合顶部定义的bar有灰色的label,这是小顶。每一个小顶,刚开始时都是大顶(有蓝色的label),直到它之后又有小顶出现时,它就变成了灰色的小顶。
关于TradingView对bar数的限制:
计算小顶和小底的逻辑比较简单,不需要使用将来的数据,计算量较小,所以是默认的TradingView限制。(脚本中限制为2000,但实际上TradingView不会让我们使用那么多bar)
大顶和大底的计算逻辑比较复杂,需要使用将来的数据,计算量非常大,大约只能计算最近150根bar。用户可以尝试输入更大的数值,但TradingView可能会报错。若遇报错,则请输入更低的数值。初次加载时,需要等待较长时间,这确实在一般的TradingView脚本中并不常见,但还是请多些耐心。
下一版可能会增加alert功能,即:当顶部和底部出现时,调用alert函数。但这只适用于小顶和小底,因为警报发出时,我们谁也不知道将来的数据。

Multiple Time Frame Williams Alligator H1M5fractalist scalpers, chaos theorists and traders trading on 5 minute charts in the financial markets are often swamped by too many fractals; switching between charts back and forth can be a headache too; so here's an indicator script coded by yours truly to make our lives easier.
how it works?
apply MTFWA on a 5 minute chart; synchronise it with your 1 hour chart; draw the standard horizontal lines to mark fractals on your 1 hour chart...there you go; better fractals filtered to analyse your 5 minute chart; scalp your hearts out.
Multiple Time Frame Williams Alligator H1M5fractalist scalpers, chaos theorists and traders trading on 5 minute charts in the financial markets are often swamped by too many fractals; switching between charts back and forth to do multi time frame analysis can be a headache too; so here's an indicator script coded by yours truly to make our lives easier.
how it works?
apply MTFWA on a 5 minute chart; synchronise it with your 1 hour chart; draw the standard horizontal lines to mark fractals on your 1 hour chart...there you go; better fractals filtered to analyse your 5 minute chart; scalp your hearts out.

Multi Time Frame Williams Alligator H1M5fractalist scalpers, chaos theorists and traders trading on 5 minute charts in the financial markets are often swamped by too many fractals; switching between charts back and forth to do multi time frame analysis can be a headache too; so here's an indicator script coded by yours truly to make our lives easier.
how it works?
apply MTFWA on a 5 minute chart; synchronise it with your 1 hour chart; draw the standard horizontal lines to mark fractals on your 1 hour chart...there you go; better fractals filtered to analyse your 5 minute chart; scalp your hearts out.

Multi Time Frame Williams Alligator H1M5fractalist scalpers and chaos theorists traders trading on 5 minute charts in the financial markets are often swamped by too many fractals; switching between charts back and forth to do multi time frame analysis can be a headache too; so here's an indicator script coded by yours truly to make our lives easier.
how it works?
apply MTFWA on a 5 minute chart; synchronise it with your 1 hour chart; draw the standard horizontal lines to mark fractals on your 1 hour chart...there you go; better fractals filtered to analyse your 5 minute chart; scalp your hearts out.

Multi Time Frame Williams Alligator H1M5
fractalist scalpers and traders on 5 minute charts in the financial markets are often swamped by too many fractals; switching charts back and forth to do multi time frame analysis can be a headache too; so here's an indicator script coded by yours truly to make our lives easier.
how it works?
apply MTFWA on a 5 minute chart; sychronise it with your 1 hour chart; draw the standard horizontal line to mark fractals on your 1 hour chart...there you go; better fractals filtered to analyse your 5 minute chart; scalp your hearts out.

Trendio-alertFractal Sequence Trading System (Final Stable Version) identifies trends formed by two consecutive fractals based on three or five candlesticks.

fenxingFractal Sequence Trading System (Final Stable Version) identifies trends formed by two consecutive fractals based on three or five candlesticks.

MarketMastery Pivot Matrix by DGTThe MarketMastery Pivot Matrix™ is an advanced pivot point framework designed to provide comprehensive market context, bias assessment, and trend analysis. It integrates multiple pivot calculation methods, central pivot ranges, higher-timeframe references, and a suite of add-on indicators to deliver a complete market structure toolkit. Suitable for intraday, swing, and positional traders, the tool consolidates key support/resistance levels, equilibrium zones, directional flow, and volatility insights into a single, visually intuitive interface.
KEY FEATURES
⯌ Pivot Point Framework
The MarketMastery Pivot Matrix™ offers a complete solution for analyzing pivot points, price equilibrium, trend direction, and volatility. Supporting multiple pivot calculation methods—including Camarilla, Fibonacci, Swing, Traditional, and Woodie—it allows traders to customize analysis according to strategy and timeframe.
⯌ Central Pivot Range (CPR)
CPR is a core component of the Pivot Matrix™, offering a clear view of market structure and key decision zones. Traditionally used for intraday analysis, CPR is equally effective on higher timeframes (daily, weekly, monthly), highlighting support/resistance, market balance, and swing opportunities. Integrated within the Pivot Matrix™, it works seamlessly with other pivot components to provide a comprehensive trading framework across all timeframes.
⯌ Higher-Timeframe OHLC References
Displays previous session Open, High, Low, and Close from user-selected or dynamically calculated higher timeframes. Assists traders in assessing intraday support/resistance and session reactions.
⯌ Pivot High-Low Levels
Identifies key swing highs and lows as well as short-term potential pivot points. Highlights support/resistance zones, helping traders assess market structure, anticipate reversals, and spot trend continuation opportunities.
⯌ Directional Flow State
Combines ADX and DMI to provide clear insight into trend direction, strength, and momentum. Helps distinguish valid trending conditions from weak or ranging periods.
⯌ Mean Proximity State
Measures price deviation from equilibrium to classify balanced, extended, or extreme market states. Assists in evaluating potential reversion pressure and volatility expansion.
⯌ Logistic EMA Trend State (LEMA)
Applies a logistic transformation to price dynamics, smoothed by EMA for adaptive trend detection. Provides responsive trend visualization with reduced noise, helping identify trend direction and momentum.
⯌ Ichimoku Cloud Projection
Extends the Kumo cloud forward to visualize market bias, momentum, and dynamic support/resistance. Helps identify consolidation, trend direction, and equilibrium zones.
⯌ Linear Regression Channel
Fits a least-squares trend line to price, displaying slope and price dispersion. Helps traders identify trend direction, stability, and volatility.
⯌ Market Sentiment State
Evaluates market bias by analyzing price position relative to CPR and pivot levels. Provides a quick visual assessment of bullish, bearish, or neutral conditions.
⯌ Price Range & ATR State
Displays current and previous higher-timeframe ranges alongside ATR-based expected ranges. Helps assess volatility, monitor session expansion/contraction, and identify potential exhaustion zones.
DISCLAIMER
This script is intended for informational and educational purposes only. It does not constitute financial, investment, or trading advice. All trading decisions made based on its output are solely the responsibility of the user.
Paid script

SmartManiacSmartManiac — Smart Money Liquidity & Sentiment Indicator
Overview
SmartManiac is a comprehensive Smart Money Concepts (SMC) indicator that combines liquidity structure analysis with volume delta sentiment detection. It automatically maps key liquidity levels, identifies Fair Value Gaps (FVGs) across multiple timeframes, and detects potential reversal points using a multi-factor scoring system based on volume delta, liquidations, and price action.
Features
Liquidity Structure Mapping
Previous Day/Week/Month High & Low (PDH/PDL, PWH/PWL, PMH/PML) — automatically detected and drawn with priority-based labeling
Buy-Side & Sell-Side Liquidity (BSL/SSL) — swing highs and lows that act as liquidity targets
Session High/Low — Asia, London, and New York session levels with customizable times
Smart level merging — nearby levels are consolidated using ATR-based tolerance to reduce clutter
Swept level tracking — lines change to dashed/dotted when price sweeps through them
Fair Value Gap (FVG) Zones
Multi-timeframe FVG detection: 5m, 15m, 1H, 4H, Daily, Weekly
Auto-filtering based on chart timeframe — prevents lower TF clutter on higher TF charts
Status tracking: Untouched → Touched → Half-filled → Fully filled
Sweep FVGs — special zones created when FVG forms immediately after a liquidity sweep
Sweep Imbalances
Detects FVGs that form right after liquidity sweeps
Shows pending zones in gray, changes to green (bullish setup) or red (bearish setup) when price returns to the zone
Helps identify potential reversal entries after stop hunts
Volume Delta & Sentiment Analysis
Aggregated volume from multiple exchanges for accurate delta calculation
Z-score based extreme detection for buying/selling pressure
Cumulative Volume Delta (CVD) tracking
Peak FOMO / Depression Signals
4-factor percentile scoring system:
Factor 1: Delta Z-score before reversal (buying/selling pressure buildup)
Factor 2: Volume spike + price reversal bar
Factor 3: Delta reversal confirmation
Factor 4: Liquidations spike (requires external data source)
Signals show as 🔥 (FOMO top) or 💎 (Depression bottom)
Size varies by strength (tiny = moderate, small = strong)
Requires prior price move + reversal bar confirmation to reduce false signals
Sweep Visualization Boxes
Visual representation of liquidations and delta at sweep points
Box length normalized by √(line_length) for fair comparison
Helps assess sweep "quality" — stronger sweeps may lead to stronger reversals
Sweep Confirmation Markers
After a sweep, watches for 3 confirmation factors within 5 bars:
Opposite candle color
Opposite-side liquidations
Opposite-side delta
Shows - marker when all 3 confirm
Risk State Background
Optional background coloring for Risk-Off (selling + long liqs) and Risk-On (buying + short liqs) states
Helps identify broader market sentiment regime
Debug Inspector
Moveable vertical line to inspect any bar's factor values
Useful for understanding why signals triggered or didn't trigger
How to Use
Liquidity Levels — Watch for price approaching PDH/PDL/PWH/PWL/PMH/PML and BSL/SSL levels. These are likely targets for stop hunts.
Sweep + FVG — After a sweep (level turns dashed), look for an FVG to form in the opposite direction. Gray sweep FVG turning green/red indicates potential entry zone.
Peak Signals — 🔥 appears at potential tops after strong rallies with extreme buying that reverses. 💎 appears at potential bottoms after drops with extreme selling that reverses. Hover over labels to see factor breakdown.
Confirmation Dots — Green - below price = bullish sweep confirmed. Red - above price = bearish sweep confirmed.
Settings
The indicator offers extensive customization:
Toggle each feature on/off independently
Customize colors and transparency for all elements
Adjust sensitivity thresholds for signals
Configure session times for your timezone
Set liquidations data source from external indicator
External Data
For Factor 4 (Liquidations), connect an external liquidations indicator:
Add a liquidations indicator to your chart (e.g., TradingView's native Liquidations indicator)
In SmartManiac settings, select the Long and Short liquidation plots as sources
Note: TradingView's native indicator has inverted labels — swap if needed
Notes
Best used on liquid markets with volume data (BTC, ETH, major forex pairs)
Higher timeframes (1H, 4H) tend to produce more reliable signals
Combine with your own analysis — no indicator is 100% accurate
Liquidations data significantly improves signal quality but is optional
Credits
Developed by @cybermediaboy, 2025. Methodology partially based on CryptoVolium's Smart Money approach.

SMC MICRO ENTRY SETUPThis setup is designed based on Fair Value Gaps where trader can predict Bullish Or Bearish Trend with Market Structure and FVG, We may get Micro Levels for Buying and Selling with Small FVG Detection with Lower Time Frames, This setup will help trader to find good trades with Smart Money entries with FVG Order Blocks,
Same setup is only for Education Purposes don't take blind traded on it. Before taking any trade please concern with your Financial Advisor.
Green OB = Bullish Trend with Fresh Demand
Red OB = Bearish Trend with Fresh Supply
Gray OB = If Tested Red of Green OB it will automatic convert into Gray as a Entry Taken with OB

Multi-Confirmation Fib Zones This indicator combines **dynamic Fibonacci-style price zones** with a **multi-signal confirmation layer** to highlight areas where reactions are more likely to matter.
Core purpose
* Map out **contextual price areas** derived from recent market ranges.
* Provide a structured way to read potential **reaction / continuation zones** without relying on a single input.
Zone framework
* The tool continuously tracks the market’s recent extremes and builds **adaptive reference zones** around them.
* It can display both **bullish-context** and **bearish-context** zones, depending on the current market behavior.
Confirmation layer (confluence concept)
Instead of treating any zone touch as a signal, it evaluates **multiple market perspectives**, such as:
* momentum pressure,
* momentum shifts,
* short-term oscillation balance,
* participation / activity confirmation.
Signals are intended to be interpreted only when **several views align**, helping reduce false positives.
Practical use
* Useful for traders who want **structured levels + confirmation** in one visual workflow.
* Can support both **trend continuation** and **reaction-based setups**, depending on broader context.
* Best treated as a **decision support system** (a “dashboard”), not a standalone trade trigger.
Best conditions
* Works best when markets are **respecting ranges and reacting at obvious areas**.
* In extremely noisy, thin, or news-driven spikes, confirmations may desync and require more discretion.
*For educational and analytical purposes only. Always validate across different instruments and timeframes.*
LHAMA MTF Structure & Fibs [LTS]Overview
LHAMA MTF Structure & Fibs is a multi-purpose market structure toolkit that combines current-timeframe structure, higher-timeframe structure, Imbalance/FVG-based order blocks, and automatic Fibonacci retracements into a single chart overlay.
Current-Timeframe Structure
The indicator first maps current-timeframe market structure using swing highs and lows based on a user-defined pivot length (“Time-Horizon”):
Labels swing points as HH , HL , LH , and LL .
Draws BOS (Break of Structure) when price breaks beyond a prior swing.
Optionally identifies CHoCH (Change of Character) when a break occurs against the previous direction.
Lets you choose whether BOS/CHoCH confirmation uses closes or wicks .
Provides options to show/hide swing labels, choose line style (solid/dashed/dotted), and configure bullish/bearish colors.
Higher-Timeframe (HTF) Structure
On top of the local structure, the script builds a higher-timeframe structure map and projects it onto your active chart:
Aggregates price into HTF “bars” (e.g., 4h structure on a 5m chart).
Detects HTF pivots with their own pivot length setting.
Draws HTF BOS/CHoCH lines and labels back on the lower timeframe.
Lets you choose wick vs close confirmation for HTF breaks.
Optional “ pending ” HTF levels: lines extended from the latest HTF swing highs/lows that remain “waiting” until price breaks them.
This is designed to make it easier to see how intraday price is moving relative to the dominant higher-timeframe trend.
Order Blocks (Imbalance/FVG-Based)
The indicator detects simple bullish and bearish order blocks based on fair value gaps and prior sweeps:
Identifies bullish/bearish FVGs together with a sweep of a previous low/high.
Creates colored boxes anchored to an “anchor” candle and extends them forward.
Marks boxes as “broken” when price trades inside or through the opposite side.
Broken blocks can have reduced emphasis (more transparent, dashed border) and can optionally be deleted.
Show Nearest Only mode highlights only the closest active bullish and bearish blocks to reduce chart clutter.
Periodic cleanup removes very old boxes to maintain chart responsiveness.
Automatic Fibonacci Levels
The script can draw up to five customizable Fibonacci retracement levels using the HTF structure logic:
Measures swings using HTF pivots and extremes.
Historical mode : measures between two confirmed pivots in one direction.
Live mode : starts from the last confirmed pivot and tracks the evolving extreme; if price reverses through that pivot, measurement can flip to track the new leg.
Each Fib level has its own on/off toggle, ratio value, and color.
Draws a main swing line plus retracement lines projected slightly into the future.
Key Inputs & Customization
Market Structure (Current TF)
Pivot length (“Time-Horizon”).
BOS confirmation: candle close or wicks.
BOS/CHoCH line style and width.
Swing labels on/off and global label size.
Bullish/bearish colors.
Market Structure (HTF)
HTF timeframe selection.
Separate pivot length for HTF swings.
Close vs wick confirmation for HTF breaks.
HTF swing labels and CHoCH labels on/off.
Pending HTF levels: style, color, and visibility.
Order Block Settings
Bullish/bearish box colors and border width.
Maximum number of boxes to display.
Optional deletion of broken blocks.
“Show Nearest Only” filter to highlight the closest active zones.
Max bars to backscan for the anchor candle.
Cleanup frequency for removing very old boxes.
Fibonacci Settings
Show/hide auto Fibs.
Historical vs Live tracking mode.
Five user-defined ratios with individual toggles and colors.
