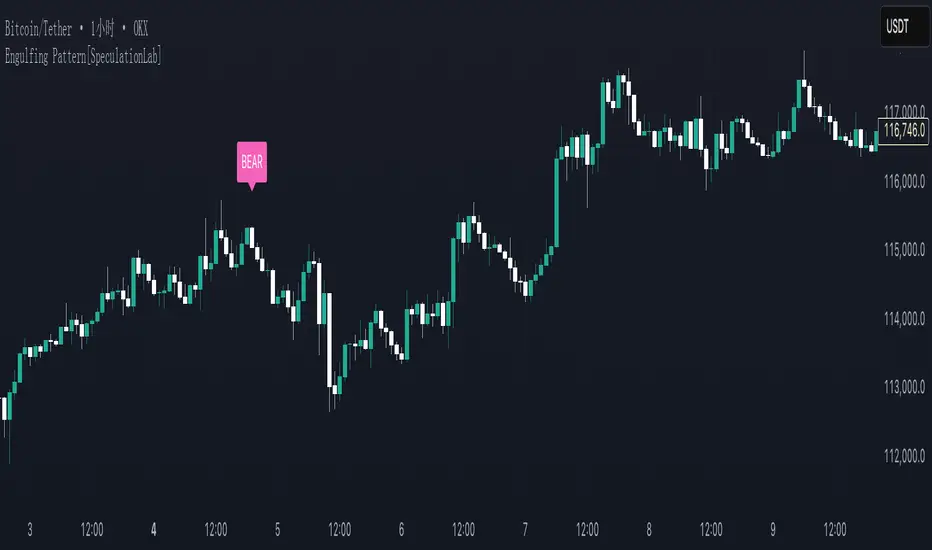
Engulfing Pattern[SpeculationLab]Overview
This script detects two types of engulfing / outer bar patterns and marks them directly on the chart:
Body Engulfing – The current candle’s body range (open–close) completely covers the entire range (high–low) of the previous candle.
Range Engulfing – The current candle’s full range (high–low, including wicks) completely covers the entire range (high–low) of the previous candle.
Direction logic:
Bull – The previous candle is bearish and the selected engulfing rule is met.
Bear – The previous candle is bullish and the selected engulfing rule is met.
Optional: Require the current candle to have the opposite color of the previous one.
This is an open-source pattern recognition tool for learning, backtesting, and chart review. It is not financial advice.
Key Features
Two detection modes:
body – Body engulfs previous entire range
range – Wicks engulf previous entire range
Direction detection based on the previous candle’s color, with optional opposite-color confirmation
Chart markers: “BULL” /“BEAR” above bars
Alert-ready: built-in conditions for bullish and bearish engulfing patterns
Parameters
Engulfing Type: body / range
body: Current body must fully cover the previous candle’s high–low range
range: Current full range (high–low) must fully cover the previous candle’s high–low range
Require Opposite Previous Candle (default: off):
When enabled, the engulfing pattern must also have the opposite color from the previous candle to trigger
Usage Tips
Engulfing patterns are price action structures; combine with trend, key levels, and volume for context
Signals confirm on bar close (barstate.isconfirmed) to reduce repainting
Can be used with personal risk management rules (stop-loss, take-profit, filters)
Disclaimer
For educational and research purposes only – not financial advice
Past performance of patterns does not guarantee future results
Trading involves risk; always manage it responsibly
This script is open-source – feel free to learn from or modify it, but credit the original source and author (SpeculationLab)
脚本简介
本脚本用于识别两类包裹/外包形态,并在图表上以标记提示:
Body(实体包裹):当前K线的实体区间(开—收)完全覆盖上一根K线的整个区间(上一根的高—低)。
Range(影线外包):当前K线的影线区间(高—低)完全覆盖上一根K线的整个区间(上一根的高—低)。
方向判定:
Bull(多):上一根为阴线且满足所选包裹规则;
Bear(空):上一根为阳线且满足所选包裹规则;
可选项:要求“当前K线颜色与上一根相反”后再确认(见参数)。
本脚本为开源形态识别工具,适合技术分析学习、回测与复盘,不构成任何投资建议。
主要功能
两种识别模式:body(实体包裹上一根整段) / range(影线包裹上一根整段)。
方向识别:按上一根K线颜色判断多空;可选“当前颜色与上一根相反”的二次确认。
图表提示:plotshape 在K线上方标注 “BULL / BEAR”。
提醒支持:内置 Bullish Engulf / Bearish Engulf 提醒条件。
参数说明
Engulfing Type:body / range
body:当前实体须完全覆盖上一根的高—低整段;
range:当前高—低须完全覆盖上一根的高—低整段。
Require Opposite Previous Candle(默认关闭):
开启后,除满足包裹规则外,还需当前K线颜色与上一根相反才触发标记。
使用建议
包裹/外包是价格行为结构,建议结合趋势、关键价位、成交量等因素综合判断。
信号在收盘时确认(barstate.isconfirmed),以减少重绘干扰。
可与个人风格的风险控制规则(止损、止盈、过滤条件)配合使用。
合规与免责声明
本脚本仅用于技术研究与学习,不构成任何形式的投资建议或收益承诺。
历史形态并不代表未来结果,交易有风险,请自行评估并承担责任。
本脚本开源,欢迎学习与二次开发;转载或改用请注明来源与作者(SpeculationLab / 投机实验室)。
Search in scripts for "Pattern recognition"
Neural Adaptive VWAPNeural Adaptive VWAP with ML Features is an advanced trading indicator that enhances traditional Volume Weighted Average Price (VWAP) calculations through machine learning-inspired adaptive algorithms and predictive volume modeling.
🌟 Key Features:
🧠 Machine Learning-Inspired Adaptation
Dynamic weight adjustment system that learns from prediction errors
Multi-feature volume prediction using time-of-day patterns, price momentum, and volatility
Adaptive learning mechanism that improves accuracy over time
📊 Enhanced VWAP Calculation
Combines actual and predicted volume for forward-looking VWAP computation
Session-based reset with proper daily anchoring
Confidence bands based on rolling standard deviation for dynamic support/resistance
🎯 Advanced Signal Generation
Volume-confirmed crossover signals to reduce false entries
Color-coded candle visualization based on VWAP position
Multi-level strength indicators (strong/weak bullish/bearish zones)
⚙️ Intelligent Feature Engineering
Normalized volume analysis with statistical z-score
Time-series pattern recognition for intraday volume cycles
Price momentum and volatility integration
Sigmoid activation functions for realistic predictions
📈 How It Works:
The indicator employs a sophisticated feature engineering approach that extracts meaningful patterns from:
Volume Patterns: Normalized volume analysis and historical comparisons
Temporal Features: Time-of-day and minute-based cyclical patterns
Market Dynamics: Price momentum, volatility, and rate of change
Adaptive Learning: Error-based weight adjustment similar to neural network training
Unlike static VWAP indicators, this system continuously adapts its calculation methodology based on real-time market feedback, making it more responsive to changing market conditions while maintaining the reliability of traditional VWAP analysis.
🔧 Customizable Parameters:
VWAP Length (1-200 bars)
Volume Pattern Lookback (5-50 periods)
Learning Rate (0.001-0.1) for adaptation speed
Prediction Horizon (1-10 bars ahead)
Adaptation Period for weight updates
📊 Visual Elements:
Blue Line: Adaptive VWAP with predictive elements
Red/Green Bands: Dynamic confidence zones
Colored Candles: Position-based strength visualization
Signal Arrows: Volume-confirmed entry points
Info Table: Real-time performance metrics and weight distribution
🎯 Best Use Cases:
Intraday Trading: Enhanced execution timing with volume prediction
Institutional-Style Execution: Improved VWAP-based order placement
Trend Following: Adaptive trend identification with confidence zones
Support/Resistance Trading: Dynamic levels that adjust to market conditions

Abusuhil Bullish Candles (Label + Table)Abusuhil Bullish Candles is a pattern recognition indicator designed to identify key bullish reversal candlestick formations including Hammer, Bullish Engulfing, Morning Star, Piercing Line, Three White Soldiers, and Three Inside Up.
The script includes optional filters such as Stochastic and Volume Confirmation, providing more precise signal detection.
Each pattern and filter is fully customizable via settings. Alerts are also included to support active trading workflows.
This script was written originally and does not copy open-source indicators. It's ideal for traders seeking visual clarity on bullish opportunities with professional-grade logic.
مؤشر الشموع الصعودية هو مؤشر احترافي يكتشف أبرز نماذج الانعكاس الصعودي في الشموع اليابانية مثل: Hammer، Bullish Engulfing، Morning Star، Piercing Line، Three White Soldiers، و Three Inside Up.
يوفر المؤشر فلاتر إضافية مثل فلتر Stochastic وفلتر الفوليوم لتعزيز دقة الإشارات. جميع الإعدادات قابلة للتعديل بما يتناسب مع احتياج كل متداول.
يحتوي المؤشر أيضًا على تنبيهات تلقائية لدعم استراتيجيات التداول اللحظي. تمت برمجة المؤشر من الصفر ويعتمد على منطق خاص غير منسوخ من سكربتات مفتوحة المصدر.
--------------------------------------------------------------------------------------------------------------------
🇸🇦 التحديثات – النسخة الجديدة (Abusuhil Bullish Candles)
✅ تم تغيير الملصقات بشكل أوضح: باستخدام دوائر ملونة أسفل الشموع بدلًا من المربعات لتفادي التراكب.
🟦 إضافة جدول تفاعلي على الشارت يعرض أسماء النماذج وألوانها المخصصة.
🎨 إمكانية تغيير ألوان كل نموذج من الإعدادات حسب رغبة المستخدم.
🧩 تفعيل/تعطيل كل نموذج على حدة من خلال إعدادات منفصلة.
🔔 إضافة تنبيه احترافي واحد يتم تفعيله عند تحقق أي نموذج نشط من النماذج المحددة.
📋 توافق كامل مع سياسة TradingView:
لا يحتوي على أكواد منسوخة أو مبنية على مؤشرات داخلية.
لا تكرار للوظائف أو العناوين.
وصف واضح مع تحكم كامل للمستخدم.
🇬🇧 Updates – Latest Version (Abusuhil Bullish Candles)
✅ Clearer Signal Labels: Now uses colored circles under candles instead of labels to avoid overlapping.
🟦 Interactive Table showing pattern names and user-defined colors.
🎨 Customizable colors for each candlestick pattern from the settings menu.
🧩 Toggle each pattern independently using dedicated checkboxes.
🔔 Single professional alert condition that triggers only when any enabled pattern is detected.
📋 Fully compliant with TradingView's publishing policy:
No reused or built-in indicator code.
No duplicated logic or misleading titles.
Clean and modular design with full user customization.

Candle/Keltner Channels BUY SELLWhy Use Candlesticks?
They help traders visualize price action
Used in technical analysis and price pattern recognition (e.g., Doji, Engulfing, Hammer)
Assist in determining entry and exit points
Why Traders Use Keltner Channels?
Keltner Channels are widely used by traders for identifying trends, detecting volatility, and spotting trade opportunities.
1. Trend Identification
The middle line (EMA) shows the general trend.
If price consistently stays above the middle line, it indicates a strong uptrend.
If price stays below, it signals a downtrend.
Use: Traders follow the trend direction to enter trades in line with momentum.
2. Volatility Measurement
The width of the channel expands and contracts based on Average True Range (ATR).
Wider channels = high volatility, tighter channels = low volatility.
Use: Helps traders decide when to expect breakouts or calm periods.
3. Breakout Signals
A break above the upper band can signal a bullish breakout.
A break below the lower band can signal a bearish breakout.
Use: Traders use this for momentum trading and breakout entries.
4. Overbought/Oversold Conditions
Price touching or crossing the upper band may suggest it's overbought.
Price touching or crossing the lower band may suggest it's oversold.
Use: Traders combine this with RSI or MACD to confirm reversal setups.
5. Trade Entry and Exit
When price pulls back to the middle EMA during a trend, it may present a buy/sell opportunity.
Exits can also be planned if price returns inside the bands after a breakout.
Use: Helps with precise entry and exit timing.
6. Combines Well With Other Indicators
Commonly used with:
RSI (for confirmation)
MACD (for momentum)
Candlestick patterns (for price action signals)
Combining Candlestick Patterns with Keltner Channels gives traders a powerful method to confirm entries, spot reversals, and improve accuracy. Here’s why this combination works so well:
1. Context for Candlestick Signals
Candlestick patterns (like doji, engulfing, or pin bars) show potential price reversals, but they need context to be reliable. Keltner Channels provide that context:
A bullish candlestick near the lower band suggests a stronger buy signal.
A bearish candlestick near the upper band strengthens a sell signal.
2. Filtering False Signals
Candlestick patterns occur frequently, and not all are meaningful.
The location within the Keltner Channel helps filter out weak or false patterns.
Example: A bullish engulfing candle outside the lower band = high-probability reversal.
3. Improved Entry Timing
Traders wait for a candlestick pattern confirmation when price touches or crosses a Keltner band.
This avoids premature entries and allows tighter stop-losses.
4. Better Risk-Reward Setup
Candlestick entry near channel extremes (upper/lower band) lets traders place stop-losses just beyond recent highs/lows.
The target can be the opposite side of the channel or the middle EMA.
5. Visual Simplicity
Keltner Channels + Candles are visually intuitive.
Even beginner traders can easily recognize:
Overextended candles near channel edges.
Confirmed breakouts or reversals.
This Timeframe 5 min : XAUUSD

Dskyz Adaptive Futures Elite (DAFE)Dskyz Adaptive Futures Edge (DAFE)
imgur.com
A Dynamic Futures Trading Strategy
DAFE adapts to market volatility and price action using technical indicators and advanced risk management. It’s built for high-stakes futures trading (e.g., MNQ, BTCUSDT.P), offering modular logic for scalpers and swing traders alike.
Key Features
Adaptive Moving Averages
Dynamic Logic: Fast and slow SMAs adjust lengths via ATR, reacting to momentum shifts and smoothing in calm markets.
Signals: Long entry on fast SMA crossing above slow SMA with price confirmation; short on cross below.
RSI Filtering (Optional)
Momentum Check: Confirms entries with RSI crossovers (e.g., above oversold for longs). Toggle on/off with custom levels.
Fine-Tuning: Adjustable lookback and thresholds (e.g., 60/40) for precision.
Candlestick Pattern Recognition
Eng|Enhanced Detection: Identifies strong bullish/bearish engulfing patterns, validated by volume and range strength (vs. 10-period SMA).
Conflict Avoidance: Skips trades if both patterns appear in the lookback window, reducing whipsaws.
Multi-Timeframe Trend Filter
15-Minute Alignment: Syncs intrabar trades with 15-minute SMA trends; optional for flexibility.
Dollar-Cost Averaging (DCA) New!
Scaling: Adds up to a set number of entries (e.g., 4) on pullbacks/rallies, spaced by ATR multiples.
Control: Caps exposure and resets on exit, enhancing trend-following potential.
Trade Execution & Risk Management
Entry Rules: Prioritizes moving averages or patterns (user choice), with volume, volatility, and time filters.
Stops & Trails:
Initial Stop: ATR-based (2–3.5x, volatility-adjusted).
Trailing Stop: Locks profits with configurable ATR offset and multiplier.
Discipline
Cooldown: Pauses post-exit (e.g., 0–5 minutes).
Min Hold: Ensures trades last a set number of bars (e.g., 2–10).
Visualization & Tools
Charts: Overlays MAs, stops, and signals; trend shaded in background.
Dashboard: Shows position, P&L, win rate, and more in real-time.
Debugging: Logs signal details for optimization.
Input Parameters
Parameter Purpose Suggested Use
Use RSI Filter - Toggle RSI confirmation *Disable 4 price-only
trading
RSI Length - RSI period (e.g., 14) *7–14 for sensitivity
RSI Overbought/Oversold - Adjust for market type *Set levels (e.g., 60/40)
Use Candlestick Patterns - Enables engulfing signals *Disable for MA focus
Pattern Lookback - Pattern window (e.g., 19) *10–20 bars for balance
Use 15m Trend Filter - Align with 15-min trend *Enable for trend trades
Fast/Slow MA Length - Base MA lengths (e.g., 9/19) *10–25 / 30–60 per
timeframe
Volatility Threshold - Filters volatile spikes *Max ATR/close (e.g., 1%)
Min Volume - Entry volume threshold *Avoid illiquid periods
(e.g., 10)
ATR Length - ATR period (e.g., 14) *Standard volatility
measure
Trailing Stop ATR Offset - Trail distance (e.g., 0.5) *0.5–1.5 for tightness
Trailing Stop ATR Multi - Trail multiplier (e.g., 1.0) *1–3 for trend room
Cooldown Minutes - Post-exit pause (e.g., 0–5) *Prevents overtrading
Min Bars to Hold - Min trade duration (e.g., 2) *5–10 for intraday
Trading Hours - Active window (e.g., 9–16) *Focus on key sessions
Use DCA - Toggle DCA *Enable for scaling
Max DCA Entries - Cap entries (e.g., 4) *Limit risk exposure
DCA ATR Multiplier Entry spacing (e.g., 1.0) *1–2 for wider gaps
Compliance
Realistic Testing: Fixed quantities, capital, and slippage for accurate backtests.
Transparency: All logic is user-visible and adjustable.
Risk Controls: Cooldowns, stops, and hold periods ensure stability.
Flexibility: Adapts to various futures and timeframes.
Summary
DAFE excels in volatile futures markets with adaptive logic, DCA scaling, and robust risk tools. Currently in prop account testing, it’s a powerful framework for precision trading.
Caution
DAFE is experimental, not a profit guarantee. Futures trading risks significant losses due to leverage. Backtest, simulate, and monitor actively before live use. All trading decisions are your responsibility.

Hammer Detector### Hammer Pattern Detector
The Hammer Pattern Detector is a specialized technical analysis tool designed to identify high-probability hammer candlestick patterns. This indicator uses precise mathematical calculations to detect hammer patterns that meet specific criteria, helping traders identify potential market reversals.
#### Key Features
- Precise detection of hammer patterns based on shadow-to-body ratios
- Customizable parameters for fine-tuning pattern recognition
- Visual alerts with markers above qualifying candles
- Built-in alert functionality for real-time notifications
#### Parameters
1. **Shadow Length Multiplier (min)**: Controls how many times longer the lower shadow must be compared to the candle body (default: 2.0)
2. **Maximum Upper Shadow (%)**: Sets the maximum allowed length for the upper shadow as a percentage of total candle length (default: 10%)
3. **Minimum Body to High Distance (%)**: Defines how close the body must be to the high of the candle (default: 90%)
#### Detection Criteria
The indicator identifies hammer patterns based on three main conditions:
- Lower shadow must be at least twice the length of the body (adjustable)
- Upper shadow must be minimal (max 10% of total candle length by default)
- Candle body must be positioned near the high of the candle
#### Use Cases
- Identifying potential trend reversals
- Finding entry points in oversold conditions
- Confirming support levels
- Part of a broader reversal strategy
#### Tips for Best Results
- Use in conjunction with support/resistance levels
- Combine with volume analysis for confirmation
- Consider overall market context and trend
- Adjust parameters based on your trading timeframe
#### Installation
1. Add the indicator to your chart
2. Adjust the parameters according to your trading style
3. Optional: Set up alerts for real-time notifications
#### About
Created by WK
Version: 1.0
All rights reserved ©WK
For questions or suggestions, please reach out through TradingView.

Artaking 2Components of the Indicator:
Moving Averages:
Short-Term Moving Average (MA): This is a 50-period Simple Moving Average (SMA) applied to the closing price. It is used to track the short-term trend of the market.
Long-Term Moving Average (MA): This is a 200-period SMA used to track the long-term trend.
Day Trading Moving Average: A 20-period SMA is used specifically for day trading signals, focusing on shorter-term price movements.
Purpose:
The crossing of these moving averages (short-term crossing above or below long-term) provides basic buy and sell signals, indicative of potential trend reversals or continuations.
ADX (Average Directional Index) for Trend Strength:
ADX Calculation: The ADX is calculated using a 14-period length with 14-period smoothing. The ADX value indicates the strength of a trend, regardless of direction.
Strong Trend Condition: The indicator considers a trend to be strong if the ADX value is above 25. This threshold helps filter out trades during weak or sideways markets.
Purpose:
To ensure that the strategy only generates signals when there is a strong trend, thus avoiding whipsaws in low volatility or range-bound conditions.
Support Levels:
Support Level Calculation: The indicator calculates the lowest close over the last 100 periods. This level is used to identify significant support zones where the price might find a floor.
Purpose:
Support levels are critical in identifying potential areas where the price might bounce, making them ideal for setting stop losses or identifying buy opportunities.
Volatility Spike (Proxy for News Trading):
ATR (Average True Range) Calculation: The indicator uses a 14-period ATR to measure market volatility. A volatility spike is identified when the ATR is greater than 1.5 times the 14-period SMA of the ATR.
Purpose:
This serves as a proxy for news events or other sudden market movements that could make the market unpredictable. The indicator avoids generating signals during these periods to reduce the risk of being caught in a volatile, potentially news-driven move.
Fibonacci Retracement Levels:
61.8% Fibonacci Level: Calculated from the highest high and lowest low over the long MA period, this retracement level is widely regarded as a significant support or resistance level.
Purpose:
Position traders often use Fibonacci levels to identify potential reversal points. The indicator incorporates the 61.8% level to fine-tune entries and exits.
Candlestick Patterns for Price Action Trading:
Bullish Engulfing Pattern: A bullish reversal pattern where a green candle fully engulfs the previous red candle.
Bearish Engulfing Pattern: A bearish reversal pattern where a red candle fully engulfs the previous green candle.
Purpose:
These patterns are classic signals used in price action trading to identify potential reversals at key levels, especially when they align with other conditions like support/resistance or Fibonacci levels.
Signal Generation:
The indicator generates buy and sell signals by combining the above elements:
Buy Signal:
A buy signal is triggered when:
The short-term MA crosses above the long-term MA (indicating a potential uptrend).
The trend is strong (ADX > 25).
The current price is near or below the 61.8% Fibonacci retracement level, suggesting a potential reversal.
No significant volatility spike is detected, ensuring the market isn’t reacting unpredictably to news.
Sell Signal:
A sell signal is triggered when:
The short-term MA crosses below the long-term MA (indicating a potential downtrend).
The trend is strong (ADX > 25).
The current price is near or above the 61.8% Fibonacci retracement level, suggesting potential resistance.
No significant volatility spike is detected.
Day Trading Signals:
Independent of the main trend signals, the indicator also generates intraday buy and sell signals when the price crosses above or below the 20-period day trading MA.
Price Action Signals:
The indicator can trigger buy or sell signals based purely on price action, such as the occurrence of bullish or bearish engulfing patterns. This is optional and can be enabled or disabled.
Alerts:
The indicator includes built-in alert conditions that notify the trader when a buy or sell signal is generated. This allows traders to act immediately without having to constantly monitor the charts.
Practical Application:
This indicator is versatile and can be used across various trading styles:
Position Trading: The long-term MA, Fibonacci retracement, and ADX provide a solid foundation for identifying long-term trends and potential entry/exit points.
Day Trading: The short-term MA and day trading MA offer quick signals for intraday trading.
Price Action: Candlestick pattern recognition allows for precise entry points based on market sentiment and behavior.
News Trading: The volatility spike filter helps avoid trading during periods of market instability, often driven by news events.
Conclusion:
The Comprehensive Trading Strategy Indicator is a robust tool designed to help traders navigate various market conditions by integrating multiple strategies into a single, coherent framework. It provides clear, actionable signals while filtering out potentially dangerous trades during volatile or weak market conditions. Whether you're a long-term trader, a day trader, or someone who relies on price action, this indicator can be a valuable addition to your trading toolkit.

Enhanced Forex IndicatorDescription of the "Enhanced Forex Indicator"
The "Enhanced Forex Indicator" is designed for traders who want a comprehensive technical analysis tool on the TradingView platform. This script integrates Exponential Moving Averages (EMAs), support and resistance zones, and candlestick pattern recognition to provide actionable trading signals, particularly useful for Forex and other financial markets. The script is suitable for intraday trading and swing trading.
Components of the Indicator
Exponential Moving Averages (EMAs):
Short EMA (Blue Line): Faster responding average, good for identifying recent trend changes.
Long EMA (Red Line): Slower moving average, helps in confirming longer-term trends.
Support and Resistance Zones:
Resistance Zone (Red): Area where potential selling pressure could overcome buying pressure, halting price increases temporarily or reversing them.
Support Zone (Green): Area where potential buying pressure could overcome selling pressure, supporting prices and preventing them from falling further.
Candlestick Patterns:
Bullish Engulfing Pattern (Green Triangle Up 'BE'): Suggests a potential upward reversal or start of a bullish trend.
Bearish Engulfing Pattern (Red Triangle Down 'BE'): Indicates a potential downward reversal or start of a bearish trend.
Buy/Sell Signals:
Buy Signal (Green Label 'BUY'): Triggered when the price is above both EMAs and a bullish engulfing pattern is detected.
Sell Signal (Red Label 'SELL'): Triggered when the price is below both EMAs and a bearish engulfing pattern is detected.
Trading Setup:
Entry: Consider entering a buy position when the 'BUY' signal appears, indicating bullish conditions. Enter a sell position when the 'SELL' signal appears, indicating bearish conditions.
Exit: Look for closing signals opposite your entry or use predefined take profit and stop loss levels. For instance, exit a buy position on a 'SELL' signal or when the price drops below the support zone.
Risk Management:
Set stop losses just below the support zone for buy orders and above the resistance zone for sell orders to protect against significant losses.
Adjust position sizes according to your risk tolerance and account balance.
Considerations:
Use this indicator in conjunction with other analysis tools and fundamental data to confirm signals and strengthen your trading strategy.
Periodically backtest the strategy based on this indicator to ensure its effectiveness in current market conditions.
Optimization:
Adjust the lengths of the EMAs and the buffer size of the support and resistance zones to better fit the asset's volatility and your trading timeframe.

Session HeatmapIntraday Seasonality
Overview
Analyzes historical patterns by time of day. Identifies when volatility, volume, and open interest changes tend to be highest or lowest.
Features
Multiple Metrics: TR (volatility), Volume, and Open Interest changes
Flexible Grouping: View patterns by weekday or month to spot day-of-week or seasonal effects
Heatmap Visualization: Blue (low) to Red (high) color scale for quick pattern recognition
Percentile Mode: Reduces outlier impact by using 5th-95th percentile range
Timezone Support: Display in UTC alongside your local time
Metrics Explained
TR: Volatility - when markets move most
Volume: Liquidity - when participation is highest
OI Increase: When new positions are opened
OI Decrease: When positions are closed
OI Net: Net open interest change
Usage
Set your timezone and preferred slot size (30min/1H)
Choose a date range (relative or custom)
Select a metric to analyze
Use "Group By" to see weekday or monthly patterns
Switch to Percentile color scale if outliers dominate
Notes
Chart timeframe should be equal to or smaller than Slot Size
OI metrics require Binance Perpetual symbols
DST is not automatically adjusted; consider seasonal shifts for US/EU sessions

Structure Analysis + Hammer Alert# Structure Resistance + Hammer Alert
## 📊 Indicator Overview
This indicator integrates Structure Breakout Analysis with Candlestick Pattern Recognition, helping traders identify market trend reversal points and strong momentum signals. Through visual markers and background colors, you can quickly grasp the bullish/bearish market structure.
---
## 🎯 Core Features
### 1️⃣ Structure Resistance System
- Auto-plot Previous High/Low: Automatically marks key support/resistance based on pivot points
- Structure Breakout Detection: Shows "BULL" when price breaks above previous high, "BEAR" when breaking below previous low
- Trend Background Color: Green background for bullish structure, red background for bearish structure
### 2️⃣ Bullish Momentum Candles (Hammer Patterns)
Detects candles with long lower shadows, indicating strong buying pressure at lows:
- 💪Strong Bull (Bullish Hammer): Green marker, bullish close with significant lower shadow
- 💪Weak Bull (Bearish Hammer): Teal marker, bearish close but strong lower shadow
### 3️⃣ Bearish Momentum Candles (Inverted Hammer/Shooting Star)
Detects candles with long upper shadows, indicating strong selling pressure at highs:
- 💪Weak Bear (Bullish Inverted Hammer): Orange marker, bullish close but significant upper shadow
- 💪Strong Bear (Shooting Star): Red marker, bearish close with significant upper shadow
### 4️⃣ Smart Marker Sizing
Markers automatically adjust size based on current trend:
- With-Trend Signals: Larger markers (e.g., hammer in bullish trend)
- Counter-Trend Signals: Smaller markers (e.g., shooting star in bullish trend)
- Neutral Trend: Medium-sized markers
---
## ⚙️ Parameter Settings
### Structure Resistance Parameters
- Swing Length: Default 5, higher values = clearer structure but fewer signals
- Show Lines/Labels: Toggle on/off options
### Bullish Momentum (Hammer) Parameters
- Lower Shadow/Body Ratio: Default 2.0, lower shadow must be 2x body size
- Upper Shadow/Body Ratio Limit: Default 0.2, upper shadow cannot be too long
- Body Position Ratio: Default 2.0, ensures body is at the top of candle
### Bearish Momentum (Inverted Hammer) Parameters
- Upper Shadow/Body Ratio: Default 2.0, upper shadow must be 2x body size
- Lower Shadow/Body Ratio Limit: Default 0.2, lower shadow cannot be too long
- Body Position Ratio: Default 2.0, ensures body is at the bottom of candle
### Filter & Display Settings
- Minimum Body Size: Filters out doji-like candles with tiny bodies
- Pattern Type Toggles: Show/hide different pattern types individually
- Background Transparency: Adjust background color intensity (higher = more transparent)
- Label Distance: Adjust marker distance from candles
---
## 📈 Usage Guidelines
### Trading Signal Interpretation
**Long Signals (Strongest to Weakest):**
1. Bullish Structure + Bullish Hammer (💪Strong Bull) → Strongest long signal
2. Bullish Structure + Bearish Hammer (💪Weak Bull) → Secondary long signal
3. Bearish Structure + Hammer → Potential reversal signal
**Short Signals (Strongest to Weakest):**
1. Bearish Structure + Shooting Star (💪Strong Bear) → Strongest short signal
2. Bearish Structure + Bullish Inverted Hammer (💪Weak Bear) → Secondary short signal
3. Bullish Structure + Shooting Star → Potential reversal signal
### Practical Tips
✅ Trend Following: Prioritize large marker signals (aligned with trend)
✅ Structure Confirmation: Wait for structure breakout before entry to avoid false breaks
✅ Multiple Timeframes: Confirm trend direction with higher timeframes
⚠️ Counter-Trend Caution: Small marker signals (counter-trend) require stricter risk management
---
## 🔔 Alert Setup
This indicator provides 9 alert conditions:
- Individual Patterns: Bullish Hammer, Bearish Hammer, Bullish Inverted Hammer, Shooting Star
- Combined Signals: Bullish Momentum, Bearish Momentum, Bull/Bear Momentum
- Structure Breakouts: Bullish Structure Break, Bearish Structure Break
---
## 💡 FAQ
**Q: Why do hammers sometimes appear without markers?**
A: Check "Minimum Body Size" setting - the candle body may be too small and filtered out
**Q: Too many or too few markers?**
A: Adjust "Lower Shadow/Body Ratio" or "Upper Shadow/Body Ratio" parameters - higher ratios = stricter conditions
**Q: How to see only the strongest signals?**
A: Disable "Bearish Hammer" and "Bullish Inverted Hammer", keep only "Bullish Hammer" and "Shooting Star"
**Q: Can it be used on all timeframes?**
A: Yes, but recommended for 15-minute and higher timeframes - shorter timeframes have more noise
---
## 📝 Disclaimer
⚠️ This indicator is a supplementary tool and should be used with other technical analysis methods
⚠️ Past performance does not guarantee future results - always practice proper risk management
⚠️ Recommended to test on demo account before live trading
---
**Version:** Pine Script v6
**Applicable Markets:** Stocks, Futures, Cryptocurrencies, and all markets

Multi-Confluence Signal System📊 OPTIMIZED MULTI-CONFLUENCE SIGNAL SYSTEM
A professional-grade trading indicator that combines multiple technical analysis methods to generate high-probability buy and sell signals. Designed for daily timeframe Bitcoin/crypto trading with optimized parameters based on real market backtesting.
🎯 KEY FEATURES:
- Multi-Confluence Scoring (8 components) - Each signal shows strength rating
- Smart Top & Bottom Detection - Catches reversals using price action patterns
- Ichimoku Cloud Integration - Dynamic support/resistance visualization
- Dual EMA System (20/50) - Clear trend identification
- RSI + MACD + Volume Confirmation - Multi-indicator validation
- Signal Alternation - Only shows directional changes (no repeated signals)
- Minimal Bar Spacing - Prevents signal clustering and overtrading
✅ OPTIMIZED FOR:
- Catching parabolic tops with rejection wicks
- Identifying capitulation bottoms in downtrends
- Avoiding false signals during consolidation
- 4-8 quality signals per 4-month period on daily charts
- Works in both trending and volatile markets
🔧 TECHNICAL COMPONENTS:
- EMA 20/50 trend system
- RSI (14) with adjusted overbought/oversold levels (68/32)
- MACD for momentum confirmation
- Ichimoku Cloud for trend context
- Volume analysis (1.3x threshold)
- Candlestick pattern recognition (engulfing, hammers, shooting stars)
- Capitulation detection for extreme moves
- Price extension filters (±5-10% from EMAs)
⚠️ BEST PRACTICES:
- Optimized for Daily timeframe
- Combine with your own risk management
- Higher scores = higher probability trades
- Wait for signal confirmation on candle close
- Use in conjunction with key support/resistance levels
💡 SIGNAL LOGIC:
BUY signals trigger on: Capitulation candles, extreme oversold + reversal patterns, MACD turnarounds in downtrends, or high confluence scores with bullish patterns
SELL signals trigger on: Rejection wicks at tops, bearish engulfings with overbought RSI, parabolic extensions, MACD reversals, or high confluence scores with bearish patterns
📈 Created through iterative backtesting and optimization on Bitcoin price action from 2024-2025.
⭐ Free to use • Leave feedback • Happy trading!

VIX Regime AnalyzerVIX Regime Analyzer
The VIX Regime Analyzer is an analytical tool that examines historical VIX patterns to provide insights into how your asset typically performs under similar volatility conditions.
Key Features:
Historical Pattern Matching: Automatically scans up to 1,000 bars of history to find all periods when VIX was at levels similar to today, using customizable tolerance ranges (absolute or percentage-based).
Forward-Looking Statistics: For each VIX regime match, calculates what actually happened to your asset over the next 1, 5, 10, and 20 trading days, providing both average returns and probability of positive outcomes.
Regime Classification System: Intelligently categorizes the current market environment as bullish or bearish: Visual Historical Context:
Background shading throughout your chart highlights every historical period when VIX matched current levels, color-coded by subsequent performance (green for gains, red for losses).
User Inputs:
VIX Level Tolerance (+/-): How closely VIX must match (default: ±5 points)
Use Relative Tolerance (%): Switch to percentage-based matching for consistency across different VIX levels
Lookback Period: How many bars to analyze
Highlight Historical VIX Matches: Toggle background highlighting of past matching periods
The Data Table
The statistics box appears in the right handside of your chart and contains three main sections:
Section 1: VIX REGIME
Current VIX: The live VIX closing price
Range: The tolerance band being searched (e.g., if VIX is 18 with ±5 tolerance, range is 13-23)
Historical Samples: Number of matching periods found in the lookback window (minimum 10 required for statistical validity)
Section 2: FORWARD RETURN
Shows the average percentage change in your asset over different timeframes following similar VIX levels:
Avg Next Day: What typically happened by the next trading session
Avg Next 5 Days: Average 5-day forward performance
Avg Next 10 Days: Average 10-day forward performance
Avg Next 20 Days: Average 20-day forward performance (approximately 1 month)
Section 3: PROBABILITY UP
Shows the win rate - the percentage of times your asset closed higher after VIX matched current levels:
Next Day: Probability of being up the next session
Next 5 Days: Probability of being up after 5 days
Next 10 Days: Probability of being up after 10 days
Next 20 Days: Probability of being up after 20 days
Colors:
🟢 Green: Bullish regimes (various strengths)
🔴 Red: Bearish regimes (various strengths)
🟡 Yellow: Choppy/uncertain regime
When "Highlight Historical VIX Matches" is enabled:
Scroll back through your chart and you'll see colored backgrounds highlighting every period when VIX matched today's level. The color tells you whether that match led to gains (green) or losses (red). This provides instant visual pattern recognition - you can quickly see if similar VIX levels historically led to bullish or bearish outcomes.
Practical Example:
If you see that most historical periods with similar VIX levels are highlighted in green, it suggests the current VIX level has historically been a bullish signal for your asset.
How The Indicator Makes Decisions
The regime classification uses both magnitude AND probability to avoid false signals:
Example of Strong Classification:
Average 5-day return: +1.5%
Win rate: 65%
Result: STRONG BULLISH (both high return and high probability)
Example of Weak Signal:
Average 5-day return: +2.0%
Win rate: 35%
Result: CHOPPY (high average but low consistency = unreliable)
This dual-factor approach ensures the indicator doesn't mislead you with regimes that had a few huge winners but mostly losers, or vice versa.
Best Practices
Combine with your existing strategy: Use this as a regime filter rather than standalone signals
Check sample size: More historical matches = more reliable statistics
Consider multiple timeframes: If 5-day and 20-day metrics disagree, proceed with caution
Asset-specific tuning: Different assets may require different tolerance settings
VIX spikes: The indicator is particularly useful during VIX spikes to understand if panic is justified
What Makes This Different
Unlike simple VIX indicators that just plot the fear index, this tool:
Quantifies the actual impact of VIX levels on YOUR specific asset
Provides probability-based forecasts rather than subjective interpretation
Shows historical context visually so you can see patterns at a glance
Uses rigorous statistical criteria to avoid false regime classifications

[LTS] Marubozu Candle StrategyOVERVIEW
The Marubozu Candle Strategy identifies and trades wickless candles (Marubozu patterns) with dynamic take-profit and stop-loss levels based on market volatility. This indicator combines traditional Japanese candlestick pattern recognition with modern volatility-adjusted risk management and includes a comprehensive performance tracking dashboard.
A Marubozu candle is a powerful continuation pattern characterized by the complete absence of wicks on one side, indicating strong directional momentum. This strategy specifically detects:
- Bullish Marubozu: Close > Open AND Low = Open (no lower wick)
- Bearish Marubozu: Close < Open AND High = Open (no upper wick)
When price returns to test these levels, the indicator generates trading signals with predefined risk-reward parameters.
CORE METHODOLOGY
Detection Logic:
The script scans each bar for Marubozu formations using precise price comparisons. When a wickless candle appears, a horizontal line extends from the opening price, marking it as a potential support (bullish) or resistance (bearish) level. These levels remain active until price touches them or until the maximum line limit is reached.
EMA Filter (Optional):
An exponential moving average filter enhances signal quality by requiring proper trend alignment. For bullish signals, price must be above the EMA when touching the level. For bearish signals, price must be below the EMA. This filter reduces counter-trend trades and improves win rates in trending markets. Users can disable this filter for range-bound conditions.
Dynamic Risk Management:
The strategy employs ATR-based (Average True Range) position sizing rather than fixed point values. This approach adapts to market volatility automatically:
- In low volatility: Tighter stops and targets
- In high volatility: Wider stops and targets proportional to market movement
Default settings use a 2:1 reward-to-risk ratio (1x ATR for take-profit, 0.5x ATR for stop-loss), but users can adjust these multipliers to match their trading style.
HOW IT WORKS
Step 1 - Pattern Detection:
On each bar, the indicator evaluates whether the candle qualifies as a Marubozu by comparing the high, low, open, and close prices. When detected, the opening price becomes the key level.
Step 2 - Level Management:
Horizontal lines extend from each Marubozu's opening price. The indicator maintains two separate arrays: one for unbroken levels (actively extending) and one for broken levels (historical reference). Users can configure how many of each type to display, preventing chart clutter while maintaining relevant context.
Step 3 - Signal Generation:
When price returns to touch a Marubozu level, the indicator evaluates the EMA filter condition. If the filter passes (or is disabled), the script draws TP/SL boxes showing the expected profit and loss zones based on current ATR values.
Step 4 - Trade Tracking:
Each valid signal enters the tracking system, which monitors subsequent price action to determine outcomes. The script identifies whether the take-profit or stop-loss was hit first (discarding trades where both trigger on the same candle to avoid ambiguous results).
PERFORMANCE DASHBOARD
The integrated dashboard provides real-time strategy analytics to automatically convert results to dollar values for any instrument:
Tracked Metrics:
- Total Trades: Complete count of closed positions
- Wins/Losses: Individual counts with color coding
- Win Rate: Success percentage with dynamic color (green >= 50%, red < 50%)
- Total P&L: Cumulative profit/loss in dollars
- Avg Win: Mean dollar amount per winning trade
- Avg Loss: Mean dollar amount per losing trade
NOTE: The dollar values shown in the dashboard are for trading only a single share/contract/etc. You will need to manually multiply those numbers by the amount of shares/contracts you are trading to get a true value.
The dollar conversion works automatically across all markets:
- Futures contracts (ES, NQ, CL, etc.) use their contract specifications
- Forex pairs use standard lot calculations
- Stocks and crypto use their respective point values
This eliminates manual calculation and provides immediate performance feedback in meaningful currency terms.
CUSTOMIZATION OPTIONS
ATR Settings:
- ATR Period: Lookback length for volatility calculation (default: 14)
- TP Multiplier: Take-profit distance as multiple of ATR (default: 3.0)
- SL Multiplier: Stop-loss distance as multiple of ATR (default: 1.5)
EMA Settings:
- EMA Length: Period for trend filter calculation (default: 9)
- Use EMA Filter: Toggle trend confirmation requirement (default: enabled)
Visual Settings:
- Bullish Color: Color for long signals and wins (default: green)
- Bearish Color: Color for short signals and losses (default: red)
- EMA Color: Color for trend filter line (default: orange)
- Line Width: Thickness of Marubozu level lines (1-5, default: 2)
- EMA Width: Thickness of EMA line (1-5, default: 2)
Line Management:
- Max Unbroken Lines: Limit for active extending lines (default: 10)
- Max Broken Lines: Limit for historical touched lines (default: 5)
Dashboard Settings:
- Show Dashboard: Toggle performance display on/off
- Dashboard Position: Corner placement (4 options)
- Dashboard Size: Text size selection (Tiny/Small/Normal/Large)
HOW TO USE
1. Add the indicator to your chart
2. Adjust ATR multipliers based on your risk tolerance (higher values = more conservative)
3. Configure the EMA filter based on market conditions (enable for trending, disable for ranging)
4. Set line limits to match your visual preference and chart timeframe
5. Monitor the dashboard to track strategy performance in real-time
6. Use the TP/SL boxes as reference levels for manual trades or automation
Best Practices:
- Enable EMA filter in strongly trending markets
- Disable EMA filter if you want more trade signals but at lower quality
- Increase ATR multipliers in highly volatile markets
- Decrease ATR multipliers for tighter, more frequent trades
- Review avg win/loss ratio to ensure positive expectancy
UNIQUE FEATURES
Unlike basic Marubozu detectors, this strategy provides:
1. Automatic level tracking with memory management
2. Volatility-adjusted risk parameters instead of fixed values
3. Optional trend confirmation via EMA filter
4. Real-time performance analytics with automatic dollar conversion
5. Separate tracking of wins/losses with individual averages
6. Configurable visual display to prevent chart clutter
7. Complete transparency with all logic visible in open-source code

MFx Radar (Money Flow x-Radar)Description:
MFx Radar is a precision-built multi-timeframe analysis tool designed to identify high-probability trend shifts and accumulation/distribution events using a combination of WaveTrend dynamics, normalized money flow, RSI, BBWP, and OBV-based trend biasing.
Multi-Timeframe Trend Scanner
Analyze trend direction across 5 customizable timeframes using WaveTrend logic to produce a clear trend consensus.
Smart Money Flow Detection
Adaptive hybrid money flow combines CMF and MFI, normalized across lookback periods, to pinpoint shifts in accumulation or distribution with high sensitivity.
Event-Based Labels & Alerts
Minimalist "Accum" and "Distr" text labels appear at key inflection points, based on hybrid flow flips — designed to highlight smart money moves without clutter.
Trigger & Pattern Recognition
Built-in logic detects anchor points, trigger confirmations, and rare "Snake Eye" formations directly on WaveTrend, enhancing trade timing accuracy.
Visual Dashboard Table
A real-time table provides score-based insight into signal quality, trend direction, and volume behavior, giving you a full picture at a glance.
MFx Radar helps streamline discretionary and system-based trading decisions by surfacing key confluences across price, volume, and momentum all while staying out of your way visually.
How to Use MFx Radar
MFx Radar is a multi-timeframe market intelligence tool designed to help you spot trend direction, momentum shifts, volume strength, and high-probability trade setups using confluence across price, flow, and timeframes.
Where to find settings To see the full visual setup:
After adding the script, open the Settings gear. Go to the Inputs tab and enable:
Show Trigger Diamonds
Show WT Cross Circles
Show Anchor/Trigger/Snake Eye Labels
Show Table
Show OBV Divergence
Show Multi-TF Confluence
Show Signal Score
Then, go to the Style tab to adjust colors and fills for the wave plots and hybrid money flow. (Use published chart as a reference.)
What the Waves and Colors Mean
Blue WaveTrend (WT1 / WT2). These are the main momentum waves.
WT1 > WT2 = bullish momentum
WT1 < WT2 = bearish momentum
Above zero = bullish bias
Below zero = bearish bias
When WT1 crosses above WT2, it often marks the beginning of a move — these are shown as green trigger diamonds.
VWAP-MACD Line
The yellow fill helps spot volume-based momentum.
Rising = trend acceleration
Use together with BBWP (bollinger band width percentile) and hybrid money flow for confirmation.
Hybrid Money Flow
Combines CMF and MFI, normalized and smoothed.
Green = accumulation
Red = distribution
Transitions are key — especially when price moves up, but money flow stays red (a divergence warning).
This is useful for spotting fakeouts or confirming smart money shifts.
Orange Vertical Highlights
Shows when price is rising, but money flow is still red.
Often a sign of hidden distribution or "exit pump" behavior.
Table Dashboard (Bottom-Right)
BBWP (Volatility Pulse)
When BBWP is low (<20), it signals consolidation — a breakout is likely to follow.
Use this with ADX and WaveTrend position to anticipate directional breakouts.
Trend by ADX
Shows whether the market is trending and in which direction.
Combined with money flow and RSI, this gives strong confirmation on breakouts.
OBV HTF Bias
Gives higher timeframe pressure (bullish/bearish/neutral).
Helps avoid taking counter-trend trades.
Pattern Labels (WT-Based)
A = Anchor Wave — WT hitting oversold
T = Trigger Wave — WT turning back up after anchor
👀 = Snake Eyes — Rare pattern, usually signaling strong reversal potential
These help in timing entries, especially when they align with other signals like BBWP breakouts, confluence, or smart money flow flips.
Multi-Timeframe (MTF) Consensus
The system checks WaveTrend on 5 different timeframes and gives:
Color-coded signals on each TF
A final score: “Mostly Up,” “Mostly Down,” or “Mixed”
When MTFs align with wave crosses, BBWP expansion, and hybrid money flow shifts, the probability of sustained move is higher.
Divergence Spotting (Advanced Tip)
Watch for:Price rising while money flow is red → Possible trap / early exit
Price dropping while money flow is green → Early accumulation
Combine this with anchor-trigger patterns and MTF trend support for spotting bottoms or tops early.
Final Tips
Use WT trigger crosses as initial signal. Confirm with money flow direction + color flip
Look at BBWP for breakout timing. Use table as your decision dashboard
Favor trades that align with MTF consensus

KCandle Strategy 1.0# KCandle Strategy 1.0 - Trading Strategy Description
## Overview
The **KCandle Strategy** is an advanced Pine Script trading system based on bullish and bearish engulfing candlestick patterns, enhanced with sophisticated risk management and position optimization features.
## Core Logic
### Entry Signal Generation
- **Pattern Recognition**: Detects bullish and bearish engulfing candlestick formations
- **EMA Filter**: Uses a customizable EMA (default 25) to filter trades in the direction of the trend
- **Entry Levels**:
- **Long entries** at 25% of the candlestick range from the low
- **Short entries** at 75% of the candlestick range from the low
- **Signal Validation**: Orange candlesticks indicate valid setup conditions
### Risk Management System
#### 1. **Stop Loss & Take Profit**
- Configurable stop loss in pips
- Risk-reward ratio setting (default 2:1)
- Visual representation with colored lines and labels
#### 2. **Break-Even Management**
- Automatically moves stop loss to break-even when specified R:R is reached
- Customizable break-even offset for added protection
- Prevents losing trades after reaching profitability
#### 3. **Trailing Stop System**
- **Activation Trigger**: Activates when position reaches specified R:R level
- **Distance Control**: Maintains trailing stop at defined distance from entry
- **Step Management**: Moves stop loss forward in incremental R steps
- **Dynamic Protection**: Locks in profits while allowing for continued upside
### Advanced Features
#### Position Management
- **Pyramiding Support**: Optional multiple position entries with size reduction
- **Order Expiration**: Pending orders automatically cancel after specified bars
- **Position Sizing**: Percentage-based allocation with pyramid level adjustments
#### Visual Interface
- **Real-time Monitoring**: Comprehensive information panel with all strategy metrics
- **Historical Tracking**: Visual representation of past trades and levels
- **Color-coded Indicators**: Different colors for break-even, trailing, and standard stops
- **Debug Options**: Optional labels for troubleshooting and optimization
## Key Parameters
### Basic Settings
- **EMA Length**: Trend filter period
- **Stop Loss**: Risk per trade in pips
- **Risk/Reward**: Target profit ratio
- **Order Validity**: Duration of pending orders
### Risk Management
- **Break-Even R:R**: Profit level to trigger break-even
- **Trailing Activation**: R:R level to start trailing
- **Trailing Distance**: Stop distance from entry when trailing
- **Trailing Step**: Increment for stop loss advancement
## Strategy Benefits
1. **Objective Entry Signals**: Based on proven candlestick patterns
2. **Trend Alignment**: EMA filter ensures trades align with market direction
3. **Robust Risk Control**: Multiple layers of protection (SL, BE, Trailing)
4. **Profit Optimization**: Trailing stops maximize winning trade potential
5. **Flexibility**: Extensive customization options for different market conditions
6. **Visual Clarity**: Complete visual feedback for trade management
## Ideal Use Cases
- **Swing Trading**: Medium-term positions with trend-following approach
- **Breakout Trading**: Capturing momentum from engulfing patterns
- **Risk-Conscious Trading**: Suitable for traders prioritizing capital preservation
- **Multi-Timeframe**: Adaptable to various timeframes and instruments
---
*The KCandle Strategy combines traditional technical analysis with modern risk management techniques, providing traders with a comprehensive tool for systematic market participation.*

Silver BulletSilver Bullet is a trading tool built for finding cleaner, higher-probability setups. It focuses on key windows of market movement and adds helpful tools like daily range levels and candlestick patterns.
Whether you’re trading breakouts or reversals, Silver Bullet gives you a clearer view of the market and more confidence in your setups.
⸻
🔹 Trading Setup #1: Macro Time
The Macro Time setting offers two modes: Macro Bullet and Silver Bullet. Both help traders focus on specific times when the market tends to deliver clean moves.
• Macro Bullet is based on the high and low of a full macro session. It automatically detects the session’s range and bias, then offers optimal entries for either Long or Short setups. Once the session resolves, it provides Fibonacci-based levels for entry, target, and stop loss.
• Silver Bullet is based on ICT concepts and focuses on the hourly range for London, NY AM, and NY PM sessions. It’s designed for quick time blocks and highlights key levels as the session unfolds.
To use this setup, set Macro Time to “ICT Sessions” and select your preferred mode under Bullet Mode.
⸻
🔹 Trading Setup #2: Daily Range
Enable Daily Range to draw Fibonacci levels based on either the previous day’s candle or the current day’s developing range. These levels help you identify potential support, resistance, and midpoint zones throughout the day.
With the current day’s range, levels automatically update in real time as new highs or lows form — keeping your chart aligned with evolving price action.
⸻
🔹 Trading Setup #3: Candlestick Patterns
Turn on Candlestick Patterns to automatically highlight clean reversal signals such as Hammers, Hanging Men, Shooting Stars, and Tweezers. Each pattern is detected using specific criteria and trend filters to reduce noise and improve reliability. They work especially well as confirmation signals around key levels or session zones.
Silver Bullet brings structure, clarity, and precision to your intraday trading. By combining time-based bias, price action levels, and pattern recognition, it helps you trade with purpose — not guesswork. Use one setup or combine all three for a complete view of the market, tailored to your style and session of choice.

IU Engulfing Candlestick PatternDISCRIPTION
📈 The IU Engulfing Candlestick Pattern indicator spotlights both bullish and bearish engulfing formations in real‑time. It shades each pattern with a transparent box and drops a concise label so you can catch potential reversals at a glance—no clutter, no noise, just the candles that matter.
USER INPUTS :
1. Pattern Recognition Based on = “Both” | “Wicks” | “Body” ( Default Both )
• Both → only highlights candles that satisfy **both** wick‑and‑body engulfing rules
• Wicks → checks full candle range (high‑to‑low)
• Body → checks only the real bodies (open‑to‑close)
2. Show Labels ( Default true )
If ticked then it will show the text as "Bullish Engulfing" or "Bearish Engulfing".
3. Show The Box ( Default true)
if ticked then it will show the green or red boxes.
INDICATOR LOGIC:
🔹 Bullish Engulfing (green box)
– Current bar closes higher than it opens and fully “wraps” the prior bar per your chosen rule.
🔹 Bearish Engulfing (red box)
– Current bar closes lower than it opens and fully “wraps” the prior bar per your chosen rule.
🔸 When a pattern confirms:
1. The script records the local high/low range.
2. Draws a semi‑transparent box spanning the engulfing pair.
3. Prints a compact up/down label exactly at the reaction point.
4. Fires a once‑per‑bar alert (“Bullish Engulfing” / “Bearish Engulfing”) you can route to webhooks or notifications.
WHY IT IS UNIQUE:
✨ Combines classic body‑only engulfing with an optional wick filter, letting traders demand stricter confirmation when markets are noisy.
✨ Box overlays visually segment the engulfed range—clearer than single‑bar markers.
✨ Lightweight: one input, zero repaint, and capped at 500 boxes to keep charts responsive.
✨ Ready‑to‑use alerts—no extra code needed for automation.
HOW USER CAN BENIFIT FROM IT :
- Spot early reversal zones or continuation thrusts without scanning candle by candle.
- Pair the alerts with trading bots, TradingView strategy testers, or mobile push notifications.
- Adapt the strictness (Body vs. Wicks vs. Both) to suit different assets, timeframes, or volatility regimes.
- Use the colored range boxes as dynamic support/resistance references for entries, targets, and stop‑loss placement.
📌 Tip: Test on multiple instruments and timeframes to find the sweet spot that matches your risk profile. This script is for educational purposes—always combine with sound risk management and confirm signals with broader market context.
Disclaimer :
This Video is not financial advice, it's for educational purposes only highlighting the power of coding( pine script) in TradingView, I am not a SEBI-registered advisor. Trading and investing involve risk, and you should consult with a qualified financial advisor before making any trading decisions. I do not guarantee profits or take responsibility for any losses you may incur.

Day of Week Highlighter# 📅 Day of Week Highlighter - Global Market Edition
**Enhanced visual trading tool that highlights each day of the week with customizable colors across all major global financial market timezones.**
## 🌍 Global Market Coverage
This indicator supports **27 major financial market timezones**, including:
- **Asia-Pacific**: Tokyo, Sydney, Hong Kong, Singapore, Shanghai, Seoul, Mumbai, Dubai, Auckland (New Zealand)
- **Europe**: London, Frankfurt, Zurich, Paris, Amsterdam, Moscow, Istanbul
- **Americas**: New York, Chicago, Toronto, São Paulo, Buenos Aires
- **Plus UTC and other key financial centers**
## ✨ Key Features
### 🎨 **Fully Customizable Colors**
- Individual color picker for each day of the week
- Transparent overlays that don't obstruct price action
- Professional color scheme defaults
### 🌐 **Comprehensive Timezone Support**
- 27 major global financial market timezones
- Automatic daylight saving time adjustments
- Perfect for multi-market analysis and global trading
### ⚙️ **Flexible Display Options**
- Toggle individual days on/off
- Optional day name labels with size control
- Clean, professional appearance
### 📊 **Trading Applications**
- **Market Session Analysis**: Identify trading patterns by day of week
- **Multi-Market Coordination**: Track different markets in their local time
- **Pattern Recognition**: Spot day-specific market behaviors
- **Risk Management**: Avoid trading on historically volatile days
## 🔧 How to Use
1. **Add to Chart**: Apply the indicator to any timeframe
2. **Select Timezone**: Choose your preferred market timezone from the dropdown
3. **Customize Colors**: Set unique colors for each day in the settings panel
4. **Enable/Disable Days**: Toggle specific days on or off as needed
5. **Optional Labels**: Show day names with customizable label sizes
## 💡 Pro Tips
- Use different color intensities to highlight your preferred trading days
- Combine with other session indicators for comprehensive market timing
- Perfect for swing traders who want to identify weekly patterns
- Ideal for international traders managing multiple market sessions
## 🎯 Perfect For
- Day traders tracking intraday patterns
- Swing traders analyzing weekly cycles
- International traders managing multiple markets
- Anyone wanting better visual organization of their charts
**Works on all timeframes and instruments. Set it once, trade with confidence!**
---
*Compatible with Pine Script v6 | No repainting | Lightweight performance*

Hourly Volatility Explorer📊 Hourly Volatility Explorer: Master The Market's Pulse
Unlock the hidden rhythms of price action with this sophisticated volatility analysis tool. The Hourly Volatility Explorer reveals the most potent trading hours across multiple time zones, giving you a strategic edge in timing your trades.
🌟 Key Features:
⏰ Multi-Timezone Analysis
• GMT (UTC+0)
• EST (UTC-5) - New York
• BST (UTC+1) - London
• JST (UTC+9) - Tokyo
• AEST (UTC+10) - Sydney
Perfect for tracking major market sessions and their overlaps!
📈 Dynamic Visualization
• Color-gradient hourly bars for instant pattern recognition
• Real-time volatility comparison
• Interactive data table with comprehensive statistics
• Automatic highlighting of peak volatility periods
🎯 Strategic Applications:
Day Trading:
• Identify optimal trading windows
• Avoid low-liquidity periods
• Capitalize on session overlaps
• Fine-tune entry/exit timing
Risk Management:
• Set appropriate stop losses based on hourly volatility
• Adjust position sizes for different market hours
• Optimize risk-reward ratios
• Plan around high-impact hours
Global Market Analysis:
• Track volatility across all major sessions
• Spot institutional trading patterns
• Identify quiet vs. active periods
• Monitor 24/7 market dynamics
💡 Perfect For:
• Forex traders navigating global sessions
• Crypto traders in 24/7 markets
• Day traders optimizing execution times
• Algorithmic traders fine-tuning strategies
• Risk managers calibrating exposure
📊 Advanced Features:
• Rolling 3-month analysis for reliable patterns
• Precise pip movement calculations
• Sample size tracking for statistical validity
• Real-time current hour comparison
• Color-coded visual system for instant insights
⚡ Pro Trading Tips:
• Use during major session overlaps for maximum opportunity
• Compare patterns across different instruments
• Combine with volume analysis for deeper insights
• Track seasonal variations in hourly patterns
• Build trading schedules around peak hours
🎓 Educational Value:
• Understand market microstructure
• Learn global market dynamics
• Master timezone relationships
• Develop timing intuition
🛠️ Customization:
• Adjustable lookback period
• Flexible pip multiplier
• Multiple timezone options
• Visual preference settings
Whether you're scalping the 1-minute chart or managing longer-term positions, the Hourly Volatility Explorer provides the precise timing intelligence needed for today's global markets.
Transform your trading schedule from guesswork to science. Know exactly when markets move, why they move, and how to position yourself for maximum opportunity.
#TechnicalAnalysis #Trading #Volatility #MarketTiming #DayTrading #Forex #Crypto #TradingView #PineScript #MarketAnalysis #TradingStrategy #RiskManagement #GlobalMarkets #FinancialMarkets #TradingTools #MarketStructure #PriceAction #Scalping #SwingTrading #AlgoTrading

Heiken Ashi Supertrend ATR-SL StrategyThis indicator combines Heikin Ashi candle pattern analysis with Supertrend to generate high-probability trading signals with built-in risk management. It identifies potential entries and exits based on specific Heikin Ashi candlestick formations while providing automated ATR-based stop loss management.
Trading Logic:
The system generates long signals when a green Heikin Ashi candle forms with no bottom wick (indicating strong bullish momentum). Short signals appear when a red Heikin Ashi candle forms with no top wick (showing strong bearish momentum). The absence of wicks on these candles signals a high-conviction market move in the respective direction.
Exit signals are triggered when:
1. An opposite pattern forms (red candle with no top wick exits longs; green candle with no bottom wick exits shorts)
2. The ATR-based stop loss is hit
3. The break-even stop is activated and then hit
Technical Approach:
- Select Heiken Ashi Canldes on your Trading View chart. Entried are based on HA prices.
- Supertrend and ATR-based stop losses use real price data (not HA values) for trend determination
- ATR-based stop losses automatically adjust to market volatility
- Break-even functionality moves the stop to entry price once price moves a specified ATR multiple in your favor
Risk Management:
- Default starting capital: 1000 units
- Default risk per trade: 10% of equity (customizable in strategy settings)
- Hard Stop Loss: Set ATR multiplier (default: 2.0) for automatic stop placement
- Break Even: Configure ATR threshold (default: 1.0) to activate break-even stops
- Appropriate position sizing relative to equity and stop distance
Customization Options:
- Supertrend Settings:
- Enable/disable Supertrend filtering (trade only in confirmed trend direction)
- Adjust Factor (default: 3.0) to change sensitivity
- Modify ATR Period (default: 10) to adapt to different timeframes
Visual Elements:
- Green triangles for long entries, blue triangles for short entries
- X-marks for exits and stop loss hits
- Color-coded position background (green for long, blue for short)
- Clearly visible stop loss lines (red for hard stop, white for break-even)
- Comprehensive position information label with entry price and stop details
Implementation Notes:
The indicator tracks positions internally and maintains state across bars to properly manage stop levels. All calculations use confirmed bars only, with no repainting or lookahead bias. The system is designed for swing trading on timeframes from 1-hour and above, where Heikin Ashi patterns tend to be more reliable.
This indicator is best suited for traders looking to combine the pattern recognition strengths of Heikin Ashi candles with the trend-following capabilities of Supertrend, all while maintaining disciplined risk management through automated stops.

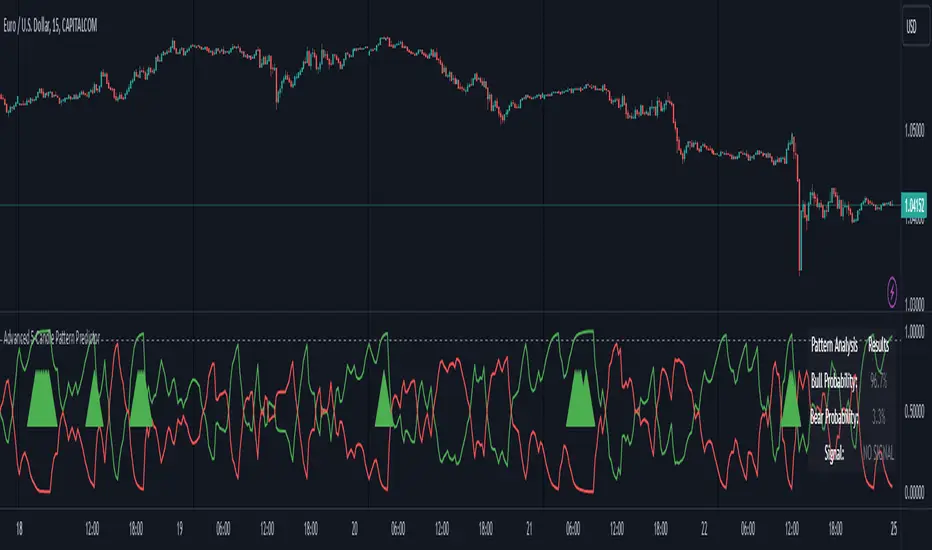
Advanced 5-Candle Pattern PredictorThis advanced indicator uses machine learning techniques and multiple analysis methods to predict potential bullish or bearish moves based on the last 5 candles. It combines volume analysis, momentum indicators, and pattern recognition to generate high-probability trading signals.
Key Features:
- Sophisticated 5-candle pattern analysis
- Volume-confirmed signals
- Multi-timeframe trend analysis
- Advanced momentum tracking
- Real-time probability scoring
How It Works:
The indicator analyzes multiple factors for each candle:
1. Body/wick ratios and relationships
2. Volume correlation with price movement
3. Momentum shifts between candles
4. Trend strength and direction
5. Technical indicator confluence (RSI, MACD)
Signals are generated only when:
- Pattern probability exceeds the threshold (default 75%)
- Volume confirms the movement
- Multiple technical factors align
- Trend strength supports the direction
Parameters:
- Probability Threshold: Minimum probability required for signal generation (0.6-1.0)
- Volume Threshold: Required volume multiplication factor (1.0-3.0)
Visual Feedback:
- Green line: Bullish probability
- Red line: Bearish probability
- Gray dashed line: Threshold level
- Large green/red arrows: High-probability signals
- Detailed information table showing current probabilities and signals
Usage Tips:
1. Higher threshold values generate fewer but potentially more reliable signals
2. Look for confluence between probability scores and volume confirmation
3. Use in conjunction with your regular trading strategy for confirmation
4. Best used on timeframes 15m and above for more reliable patterns
Warning:
Past performance does not guarantee future results. This indicator should be used as part of a complete trading strategy with proper risk management.
Jackson Volume breaker Indication# Jackson Volume Breaker Beta
### Advanced Volume Analysis Indicator
## Description
The Jackson Volume Breaker Beta is a sophisticated volume analysis tool that helps traders identify buying and selling pressure by analyzing price action and volume distribution. This indicator separates and visualizes buying and selling volume based on where the price closes within each candle's range, providing clear insights into market participation and potential trend strength.
## Key Features
1. **Smart Volume Distribution**
- Automatically separates buying and selling volume
- Color-coded volume bars (Green for buying, Red for selling)
- Winning volume always displayed on top for quick visual reference
2. **Real-time Volume Analysis**
- Shows current candle's buy/sell ratio
- Displays total volume with smart number formatting (K, M, B)
- Percentage-based volume distribution
3. **Technical Overlays**
- 20-period Volume Moving Average
- Dynamic scaling relative to price action
- Clean, uncluttered visual design
## How to Use
### Installation
1. Add the indicator to your chart
2. Adjust the Volume Scale input based on your preference (default: 0.08)
3. Toggle the Moving Average display if desired
### Reading the Indicator
#### Volume Bars
- **Green Bars**: Represent buying volume
- **Red Bars**: Represent selling volume
- **Stacking**: The larger volume (winning side) is always displayed on top
- **Height**: Relative to the actual volume, scaled for chart visibility
#### Information Table
The top-right table shows three key pieces of information:
1. **Left Percentage**: Winning side's volume percentage
2. **Middle Percentage**: Losing side's volume percentage
3. **Right Number**: Total volume (abbreviated)
### Trading Applications
1. **Trend Confirmation**
- Strong buying volume in uptrends confirms bullish pressure
- High selling volume in downtrends confirms bearish pressure
- Volume divergence from price can signal potential reversals
2. **Support/Resistance Breaks**
- High volume on breakouts suggests stronger moves
- Low volume on breaks might indicate false breakouts
- Monitor volume distribution for break direction confirmation
3. **Reversal Identification**
- Volume shift from selling to buying can signal potential bottoms
- Shift from buying to selling can indicate potential tops
- Use with price action for better entry/exit points
## Input Parameters
1. **Volume Scale (0.01 to 1.0)**
- Controls the height of volume bars
- Default: 0.08
- Adjust based on your chart size and preference
2. **Show MA (True/False)**
- Toggles 20-period volume moving average
- Useful for identifying volume trends
- Default: True
3. **MA Length (1+)**
- Changes the moving average period
- Default: 20
- Higher values for longer-term volume trends
## Best Practices
1. **Multiple Timeframe Analysis**
- Compare volume patterns across different timeframes
- Look for volume convergence/divergence
- Use higher timeframes for major trend confirmation
2. **Combine with Other Indicators**
- Price action patterns
- Support/resistance levels
- Momentum indicators
- Trend indicators
3. **Volume Pattern Recognition**
- Monitor for unusual volume spikes
- Watch for volume climax patterns
- Identify volume dry-ups
## Tips for Optimization
1. Adjust the Volume Scale based on your chart size
2. Use smaller timeframes for detailed volume analysis
3. Compare current volume bars to historical patterns
4. Watch for volume/price divergences
5. Monitor volume distribution changes near key price levels
## Note
This indicator works best when combined with proper price action analysis and risk management strategies. It should not be used as a standalone trading system but rather as part of a comprehensive trading approach.
## Version History
- Beta Release: Initial public version
- Features buy/sell volume separation, moving average, and real-time analysis
- Optimized for both intraday and swing trading timeframes
## Credits
Developed by Jackson based on other script creators
Special thanks to the trading community for feedback and suggestions

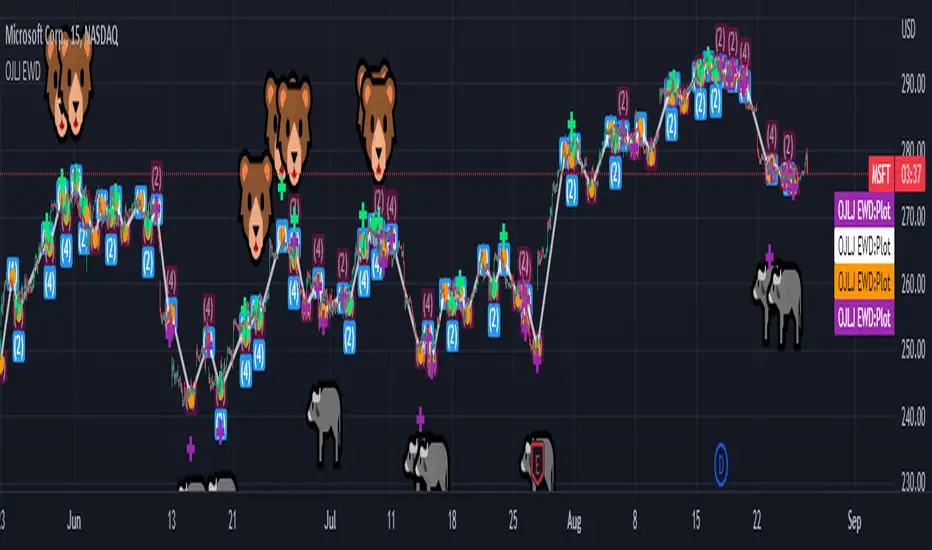
OJLJ Elliott Waves detector (Free)This script is made to identify Elliot Waves by setting a zigzag line as principal source, it identifies patterns with the most common rules, in the chart you will see a number in each wave detected, a wave could have the characteristics to be two different waves so it will be plotted the options that could be, To identify which one is most trustable I suggest to use the Fibonacci levels options as an additional note this is a free update to my existing script.
Features:
+ All waves ? (Option to show just the 5 Wave patterns recognition)
+ Draw zigzag line (Option to show the zigzag line)
+ Supports Multiple instruments, from FOREX to Stocks
+ It works on all the timeframes
+ Show Fib levels (Option to show the Fibonacci levels)
+ Fibonacci levels fit test (Green crosses mark were should a Bull wave be to fit with a Fibonacci Level While the purple crosses show were should the wave fit to be a bear trend, the more closer with the point of the wave the most trustable Example, a 5 Wave Bull could also be a 2 Bear Wave, if the green cross is closer to the orange point of the wave then is a 5 Wave Bull, if the purple cross is closer to the orange point)
+ A background color also show when a 5 pattern is identified
+ The way to plot the zigzag can be changed with 3 Input options
Characteristics to add in future updates (Please if you like it you can support me with coins):
+ Detect more than 1 cycle at the same time
+ Use a volume indicator to identify how many volume was traded in each wave
+ Implement the use of the EWO ( Elliot Wave Oscillator)
+ Improve the display
+ Identify ABC patterns
+ Add triangles and Zigzag formations