Relative Volume Indicator (RVOL)Relative Volume Indicator (RVOL) is a powerful tool designed for intraday traders who want to quickly identify key areas of interest based on relative volume activity.
This indicator compares the current candle’s volume with the historical average volume over a customizable lookback period (default is 20). It highlights when volume is:
🔴 Below average
🟡 Average
🟢 Above average
🟣 Extremely high
⚙️ Customizable Settings:
Lookback period for average volume
Volume thresholds (average, above average, extreme)
Custom colors for each volume zone
🎯 Best suited for:
Scalping strategies
Breakout confirmation
Volume-based entries at key support/resistance levels
Spotting unusual or algorithmic trading activity
📈 Works across all timeframes.
🎨 Fully customizable from the settings panel.
🔔 Alerts coming in future versions.
Search in scripts for "Relative"

Relative StrengthRelative Strength Colored
This script plots Relative strength Compared to TSLA Index.
You can change it to your requirement .

Relative Performance Indicator - TrendSpider StyleRelative Performance Indicator - TrendSpider Style
📈 Overview
This Relative Performance (RP) indicator measures how your stock is performing compared to a benchmark index, displayed as a percentile ranking from 0-100. Based on TrendSpider's methodology, it answers the critical question: "Is this stock a leader or a laggard?"
Unlike simple ratio charts, this indicator uses percentile ranking to normalize relative performance, making it easy to identify when a stock is showing exceptional strength (>80) or concerning weakness (<20) compared to its historical relationship with the benchmark.
✨ Key Features
Three Calculation Modes:
Quarterly: 3-month relative performance for swing trading
Yearly: Weighted 4-quarter performance for position trading
TechRank: Composite of 6 technical indicators for multi-factor analysis
Clean Visual Design:
Green fills above 80 (strong outperformance)
Red fills below 20 (significant underperformance)
Dotted median line at 50 for quick reference
Current value label for instant reading
Flexible Benchmarks:
Compare against major indices (SPY, QQQ, IWM)
Sector ETFs for within-sector analysis
Custom symbols for specialized comparisons
Built-in Alerts:
Strong performance zone entry (>80)
Weak performance zone entry (<20)
Median crossovers (50 level)
📊 How To Use
Buy Signals:
RP crosses above 80: Stock entering leadership status
RP holding above 60: Maintaining relative strength
RP rising while price consolidating: Accumulation phase
Sell/Avoid Signals:
RP drops below 50: Losing relative strength
RP below 20: Significant underperformance
RP falling while price rising: Bearish divergence
Sector Rotation:
Compare multiple assets to find strongest sectors
Rotate into high RP assets (>70)
Exit low RP positions (<30)
🎯 Reading The Values
80-100: Exceptional outperformance - Strong buy/hold
60-80: Moderate outperformance - Hold positions
40-60: Market perform - No edge
20-40: Underperformance - Caution/reduce
0-20: Severe underperformance - Avoid/exit
⚙️ Calculation Method
Calculates percentage performance of both your stock and the benchmark
Finds the performance differential
Ranks this differential against historical values using percentile analysis
Normalizes to 0-100 scale for easy interpretation
This percentile approach adapts to different market conditions and volatility regimes, providing consistent signals whether in trending or choppy markets.
💡 Pro Tips
For Growth Stocks: Use quarterly mode with QQQ as benchmark
For Value Stocks: Use yearly mode with SPY as benchmark
For Small Caps: Compare against IWM, not SPY
For Sector Analysis: Use sector ETFs (XLK, XLF, XLE, etc.)
Combine with Price Action: High RP + price breakout = powerful signal
⚠️ Important Notes
RP is relative, not absolute - stocks can fall with high RP if the market falls harder
Choose appropriate benchmarks for meaningful comparisons
Best used in conjunction with price action and volume analysis
Historical lookback period affects sensitivity (adjustable in settings)
🔧 Customization
Fully customizable visual settings, thresholds, calculation periods, and smoothing options. Adjust the normalization lookback period (default 252 days) to fine-tune sensitivity to your trading timeframe.
📌 Credit
Inspired by TrendSpider's Relative Performance implementation, adapted for TradingView with enhanced customization options and Pine Script v6 optimization.
Tags to include: relativeperformance, relativestrength, percentile, ranking, sectorrotation, benchmark, outperformance, trendspider, marketbreadth, strengthindicator
Category: Momentum Indicators / Trend Analysis
Feel free to modify this description to match your style or add any specific points you want to emphasize!

Relative Price Strength (RPS)Relative Price Strength (RPS) is a technical analysis indicator that measures the performance of a specific symbol relative to a benchmark or "Base Symbol".
It's essentially a ratio that compares the price of the specific symbol to the price of the benchmark.
Rising RPS: Indicates that the symbol is outperforming the benchmark.
Falling RPS: Suggests that the symbol is underperforming the benchmark.
RSP is smoothed over a period for better visualization.

Relative Strength RankRelative Strength Rank Indicator
( ( Long Term Price Change + Short Term Price Change ) / 2 ) / 10 Day ATR

Relative Momentum IndexRelative Momentum Index indicator script. This indicator was originally developed by Roger Altman (Stocks & Commodities V. 11:2 (57-60)).
RMI with momentum period of 1 will be equal to an RSI when they have the same period and source price.

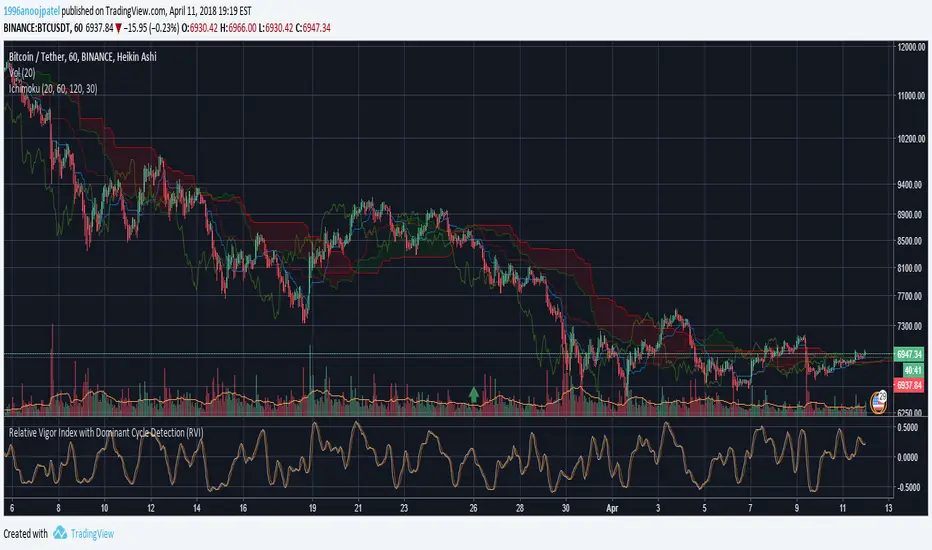
Relative Vigor Index with Dominant Cycle Detection (RVI)Relative Vigor Index with Dominant Cycle Detection. As Ehler's mentioned, fixed length look back is inherently flawed when it is possible to extract a length from a dominant price cycle. may be less effective if signal to noise ratio is greater than 2, but that usually would not happen at >5m candles, and honestly shouldn't be looking at RV(igor)I when price is moving sideways.
Read just like an RVGI, but adjusted to the current time frame. To reduce noise, changing to heiken ashi will help with signals as well. Let me know if there are improvements!
Made for JD, the OG.
Relative strength to Index set up as per Leaf_WestRelative Strength to index as used by Leaf_West. If you follow his methods be aware of the different moving averages for the different time periods. From Leaf_West: "on my weekly and monthly R/S charts, I include a 13 EMA of the R/S (brown dash line) and an 8 SMA of the 13 EMA (pink solid line). The indicator on the bottom of the weekly/monthly charts is an 8 period momentum indicator of the R/S line. The red horizontal line is drawn at the zero line.
For daily or 130-minute time periods (or shorter), my R/S charts are slightly different - the moving averages of the R/S line include a 20EMA (brown dash line), a 50 EMA (blue dash line) and an 8 SMA of the20 EMA (pink solid line). The momentum indicator is also slightly different from the weekly/monthly charts – here I use a 12 period calculation (vs 8 SMA period for the weekly/monthly charts)." Leaf's methods do evolve and so watch for any changes to the preferred MAs etc..
Relative Volume at TimeThe Relative Volume at Time indicator (RVOL) is a simple modification of the original Relative Volume at Time script available in TradingView’s public library. It doesn’t change how the indicator works but includes two small adjustments:
Added Color Options – The ability to customize the colors of the volume bars, which was important to me as I use this indicator all the time and wanted more visually suitable colors.
Renamed Short Title – The abbreviation "RVOL" replaces "RelVol", as it's a more commonly used term in trading.
Aside from these small tweaks, the indicator retains all of its original functionality, including the ability to set an anchor timeframe, choose between Regular and Cumulative volume calculation modes, and adjust unconfirmed volume for incomplete bars.
This version exists simply because I needed a more personalized display for an indicator that I rely on daily.
How It Works
The Relative Volume at Time indicator compares the current volume to the average volume at the same time in previous sessions. This helps determine if today’s activity is higher or lower than usual.
Examples
On a daily chart (1D timeframe, length = 10), each volume bar compares today's volume to the average volume at the same time over the last 10 days. If today’s volume is higher than usual at this moment, the bar will reflect that.
On an hourly chart (1H timeframe, length = 5), each hourly volume bar compares the current hour’s volume to the same hour in the past 5 days. If the 10 AM bar is high, it means today's 10 AM volume is greater than the average of the past 5 sessions at 10 AM.
On a weekly chart (1W timeframe, length = 8), the indicator compares this week’s volume to the average of the last 8 weeks. A higher bar means this week is seeing significantly more volume than usual.
This logic applies to any timeframe. It always compares the current volume to past volumes at the same point in time.
@Julien_Eche

Relative Strength against IndexThis is a very simple script to compare the performance of a single stock against its index, by adding / subtracting points for particular price action on up /down - days in the index.
For instance: If the index is down <-1ATR and the stock is not, it's +1 point. If the index is up >1ATR and the stock is up less than half, it's -1 point.
Basic idea (vs the commonly used "relative strength comparison") is that regular relative strength action over a time tells more about accumulaiton than pure price outperformance.
Formula can probably be made better - I'm open to suggestions...

Relative Performance between between Stock and SPXSimply plots the close to close performance of your instrument vs SPX below your main chart
Offers further SMA of EMA of such relative performance to get a better idea of the relative strength against the major market
Relative Strength vs XAUIts a simple relative strength chart, right now i have set it with Gold, as it is outperforming most of indices globally.
Relative Strength ComparisonThis indicator compares the difference in percentage change between two symbols
over a user-specified number of bars.
Default settings will show the difference between the current symbol and the
S&P 500 ETF (SPY) over 10 bars. It can be used to determine if the stock is
showing relative strength or weakness compared to the overall market.

Relative Index StrengthThis script shows relative strength of custom stock compared to Index. It is helpful in detecting how strongly a stock is performing when compared to an Index.
When the index is falling but the custom stock is rising, indicator shows this in red with its relative strength compared to index, indicating the stock is moving strongly against market trend.
When the index and the custom stock are moving in same direction, indicator remains neutral, indicating the stock is aligned with the market trend.
Relative Strength index 2xRelative Strength Index 2×
The RSI*2 by AZly is an advanced dual-RSI indicator that allows traders to analyze momentum from two distinct perspectives — short-term and medium-term — on a single chart. It combines RSI precision with multi-timeframe flexibility, giving a clear view of both immediate and underlying momentum trends.
⚙️ How It Works
This indicator calculates and plots two fully independent RSI lines, each with customizable settings:
RSI 1 (Main RSI) : Captures medium-term momentum, ideal for trend and context.
RSI 2 (Fast RSI) : Reacts quickly to short-term moves, identifying overbought and oversold conditions.
Both RSIs include:
Custom timeframe, source, and smoothing method (SMA, EMA, WMA, VWMA, HMA, SMMA).
Gradient zones to visualize momentum strength and reversals.
Adjustable levels and colors for clear chart presentation.
📘 Andrew Cardwell Zones (RSI 1)
RSI 1 uses Andrew Cardwell’s “range rules” to distinguish bullish and bearish momentum phases:
Bullish Range: RSI holds between 40–80, finding support around 40–45.
Bearish Range: RSI stays between 20–60, with rallies capped near 55–60.
A breakout from one range into another often signals a trend phase transition — marking potential trend beginnings or endings.
⚡ Overbought/Oversold Zones (RSI 2)
RSI 2 is designed for fast reactions and reversal detection:
95–100: Extreme overbought zone — potential exhaustion and short setup.
5–0: Extreme oversold zone — potential exhaustion and long setup.
Crossing these levels highlights short-term momentum exhaustion , often preceding pullbacks or strong price reversals.
💡 Why It’s Better
Compared to traditional RSI indicators, this version provides superior control and insight:
Dual independent RSIs with separate timeframes and smoothing.
Cardwell-style range recognition for better context of trend strength.
Extreme bands for fast RSI 2 to time entries with precision.
Dynamic gradient zones for intuitive visual interpretation.
Multi-timeframe flexibility that adapts to any trading style.
🎯 Trading Concepts
Trend Confirmation:
RSI 1 above 50 (bullish range) confirms uptrend bias; below 50 (bearish range) confirms downtrend.
Reversal Setup:
RSI 2 hitting extreme zones (above 95 or below 5) while RSI 1 stays steady often signals exhaustion and reversal setups.
Divergence Confirmation:
When RSI 2 diverges from price and RSI 1 supports the direction, it strengthens reversal probability.
Range Transition:
A shift in RSI 1’s range (from bearish to bullish or vice versa) confirms a major change in market structure.
🕒 Trade Timing (Entry Ideas)
Timing is one of the indicator’s strongest features.
Wait for RSI 2 to reach an extreme zone (above 95 or below 5).
Then confirm the direction with RSI 1 — trades are most effective when RSI 1’s range aligns with the anticipated move.
Buy Setup:
RSI 1 in bullish range + RSI 2 rebounds upward from the 5 zone.
Sell Setup:
RSI 1 in bearish range + RSI 2 turns down from the 95 zone.
Best Timing:
Enter when RSI 2 crosses back inside the 10–90 range in the same direction as RSI 1’s trend.
This captures momentum just as it resumes — avoiding early or late entries.
🔷 M & W Patterns (RSI 2)
RSI 2 also reveals short-term exhaustion structures:
“ M ” Formation: Two RSI peaks near 95–100 — bearish reversal setup.
“ W ” Formation: Two RSI troughs near 0–5 — bullish reversal setup.
These shapes often appear before price reversals, offering early momentum clues.
⚠️ Important Trading Guidance
It is strongly recommended not to trade against the prevailing trend or attempt to pick exact tops or bottoms. The indicator works best when used in alignment with trend direction. Counter-trend entries carry higher risk and lower probability.
📊 Recommended Use
Ideal for momentum traders, scalpers, and multi-timeframe analysts seeking precise timing and context. Works on all markets — forex, crypto, stocks, indexes, and commodities.

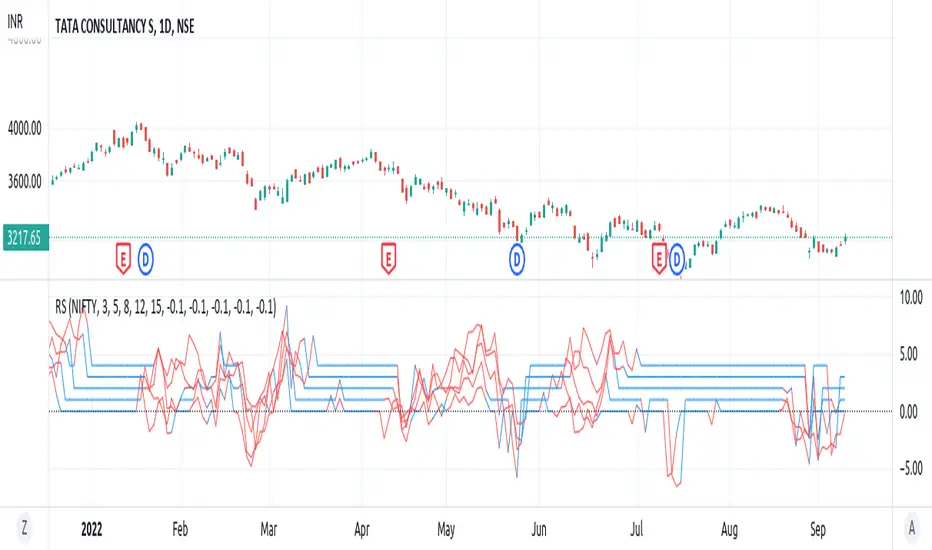
RELATIVE STRENGTHstudy(" RELATIVE STRENGTH", shorttitle="RS")
a = tickerid
b = input("NIFTY",type=symbol)
as = security(a,period,close)
bs = security(b,period,close)
plot(as/bs, title="RS" ,color=blue)

Relative Strength Universal
Relative strength is a ratio between two assets, generally it is a stock and a market average (index). RS implementation details are explained here .
This script automatically decides benchmark index for RS calculation based on market cap input values and input benchmark indices values.
Relative strength calculation:
"To calculate the relative strength of a particular stock, divide the percentage change over some time period by the percentage change of a particular index over the same time period". This indicator value oscillates around zero. If the value is greater than zero, the investment has been relatively strong during the selected period; if the value is less than zero, the investment has been relatively weak.
In this script, You can input market cap values and all are editable fields. If company market cap value is grater than 75000(Default value) then stock value will be compared with Nifty index. If company market cap is between 75000 and 25000 then stock value will be compared with midcap 150 to calculate RS. If marketcap is greater than 5000 and less than 25000 then RS will be calculated based on smallcap250. If marketcap is less than 5000 and greater than 500 then it will be compared with NIFTY_MICROCAP250

Relative Performance SuiteOverview
The Relative Performance Suite (RPS) is a versatile and comprehensive indicator designed to evaluate an asset's performance relative to a benchmark. By offering multiple methods to measure performance, including Relative Performance, Alpha, and Price Ratio, this tool helps traders and investors assess asset strength, resilience, and overall behavior in different market conditions.
Key Features:
✅ Multiple Performance Measures:
Choose from various relative performance calculations, including:
Relative Performance:
Measures how much an asset has outperformed or underperformed its benchmark over a given period.
Relative Performance (Proportional):
A proportional version of relative performance,
factoring in scaling effects.
Relative Performance (MA Based):
Uses moving averages to smooth performance fluctuations.
Alpha:
A measure of an asset’s performance relative to what would be expected based on its beta and the benchmark’s return. It represents the excess return above the risk-free rate after adjusting for market risk.
Price Ratio:
Compares asset prices directly to determine relative value over time.
✅ Customizable Moving Averages:
Apply different moving average types (SMA, EMA, SMMA, WMA, VWMA) to smooth price inputs and refine calculations.
✅ Beta Calculation:
Includes a Beta measure used in Alpha calculation, which users can toggle the visibility of helping users understand an asset's sensitivity to market movements.
✅ Risk-Free Rate Adjustment:
Incorporate risk-free rates (e.g., US Treasury yields, Fed Funds Rate) for a more accurate calculation of Alpha.
✅ Logarithmic Returns Option:
Users can switch between standard returns and log returns for more refined performance analysis.
✅ Dynamic Color Coding:
Identify outperformance or underperformance with intuitive color coding.
Option to color bars based on relative strength, making chart analysis easier.
✅ Customizable Tables for Data Display:
Overview table summarizing key metrics.
Explanation table offering insights into how values are derived.
How to Use:
Select a Benchmark: Choose a comparison symbol (e.g., TOTAL or SPX ).
Pick a Performance Metric: Use different modes to analyze relative performance.
Customize Calculation Methods: Adjust moving averages, timeframes, and log returns based on preference.
Interpret the Colors & Tables: Utilize the dynamic coloring and tables to quickly assess market conditions.
Ideal For:
Traders looking to compare individual asset performance against an index or benchmark.
Investors analyzing Alpha & Beta to understand risk-adjusted returns.
Market analysts who want a visually intuitive and data-rich performance tracking tool.
This indicator provides a powerful and flexible way to track relative asset strength, helping users make more informed trading decisions.

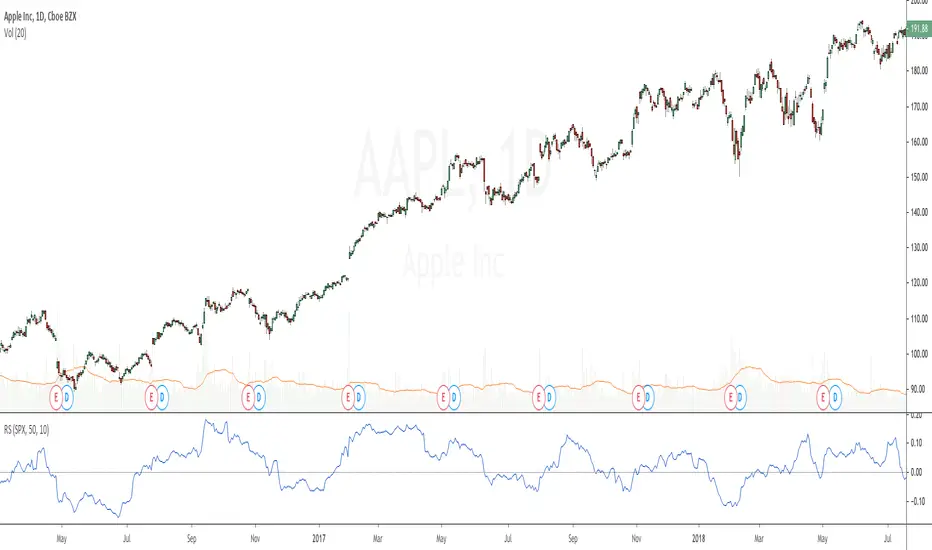
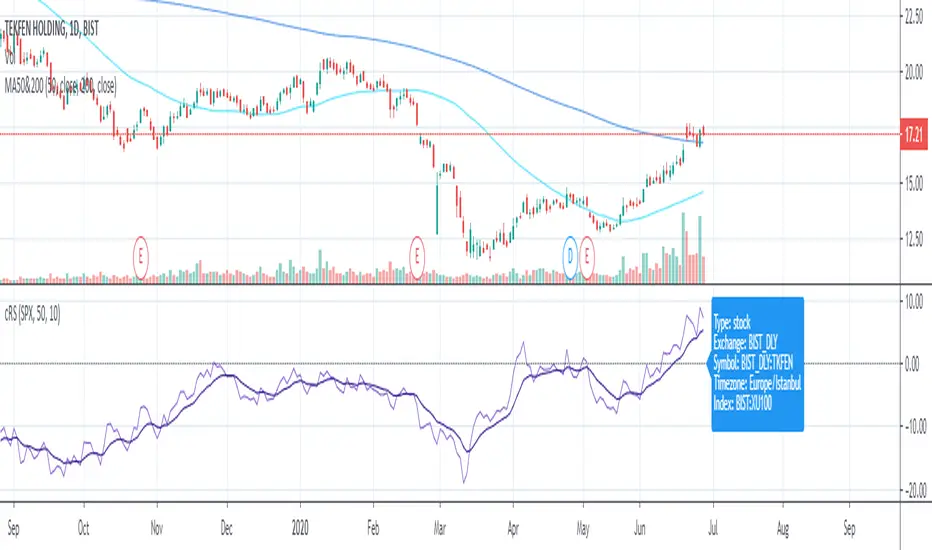
Relative StrengthRelative strength is a ratio between two assets, most often a stock and a market average (index). This implementation uses the method described here and the second method described here to calculate its value: "To calculate the relative strength of a particular stock, divide the percentage change over some time period by the percentage change of a particular index over the same time period". This indicator oscillates around zero. If the value is greater than zero, the investment has been relatively strong during the selected period; if the value is less than zero, the investment has been relatively weak. The period and the comparative symbol can be set in the settings for the indicator (the defaults are 50 and SPX), there you can also find an option to turn on a moving average.
Relative StrengthRelative strength is a calculation of the price trend of a stock or a financial instrument in comparison to another instrument, stock, or industry. It shall be determined by taking the price of one commodity and dividing it by another.
Relative strength is a strategy used for determining value stocks and is used in momentum investing as well. It involves investing in stocks that have done well, in relation to their index or benchmark. For example, a relative strength investor might pick technology companies that have outperformed the Nasdaq Composite Index or large-cap stocks that are lagging against the S&P 500 index(Adjustable in the settings).
This indiator will give you a plot for relative strength between the current pair with another pair (adjustable in the settings), with a plotshape for RSNHBP & RSNH
Features :
1. Relative Strength
2. Double EMA of Relative Strength
3. RSNHBP & RSNH
How to use it :
1. Adjust All the settings parameter
2. For Alerting, Just use any alert function call, it will give you an alert of RSNHBP and RSNH

Relative Strength (IBD Style)This script is meant to give you a Relative Strength indication of the stock. The goal is to use a similar calculation as used by IBD.
It calculates the performance of the current stock for the last year (most recent quarter is weighted double) and compares it to the performance of a reference index or ticker (default is "SPY").
IBD would give you a value between 0 and 100 because this value is the percentile within all stocks. This is not possible with Pine Script at the moment.
So here you get a Relative Strength value that is >0 if the stock is stronger than the index and <0 if it is weaker than the index.
You can still compare the Relative Strength values between stocks (bigger is better) but you won't know which percentile it is right off the bat.

Relative Strength Auto ComparisonRelative Strength Comparison with automatic selection of relevant index
Added support for most european and north american exchanges.
Relative Performance Indicator by ComLucro - 2025_V01The "Relative Performance Indicator by ComLucro - 2025_V01" is a powerful tool designed to analyze an asset's performance relative to a benchmark index over multiple timeframes. This indicator provides traders with a clear view of how their chosen asset compares to a market index in short, medium, and long-term periods.
Key Features:
Customizable Lookback Periods: Analyze performance across three adjustable periods (default: 20, 50, and 200 bars).
Relative Performance Analysis: Calculate and visualize the difference in percentage performance between the asset and the benchmark index.
Dynamic Summary Label: Displays a detailed breakdown of the asset's and index's performance for the latest bar.
User-Friendly Interface: Includes customizable colors and display options for clear visualization.
How It Works:
The script fetches closing prices of both the asset and a benchmark index.
It calculates percentage changes over the selected lookback periods.
The indicator then computes the relative performance difference between the asset and the index, plotting it on the chart for easy trend analysis.
Who Is This For?:
Traders and investors who want to compare an asset’s performance against a benchmark index.
Those looking to identify trends and deviations between an asset and the broader market.
Disclaimer:
This tool is for educational purposes only and does not constitute financial or trading advice. Always use it alongside proper risk management strategies and backtest thoroughly before applying it to live trading.
Chart Recommendation:
Use this script on clean charts for better clarity. Combine it with other technical indicators like moving averages or trendlines to enhance your analysis. Ensure you adjust the lookback periods to match your trading style and the timeframe of your analysis.
Additional Notes:
For optimal performance, ensure the benchmark index's data is available on your TradingView subscription. The script uses fallback mechanisms to avoid interruptions when index data is unavailable. Always validate the settings and test them to suit your trading strategy.
