EAOBS by MIGVersion 1
1. Strategy Overview Objective: Capitalize on breakout movements in Ethereum (ETH) price after the Asian open pre-market session (7:00 PM–7:59 PM EST) by identifying high and low prices during the session and trading breakouts above the high or below the low.
Timeframe: Any (script is timeframe-agnostic, but align with session timing).
Session: Pre-market session (7:00 PM–7:59 PM EST, adjustable for other time zones, e.g., 12:00 AM–12:59 AM GMT).
Risk-Reward Ratios (R:R): Targets range from 1.2:1 to 5.2:1, with a fixed stop loss.
Instrument: Ethereum (ETH/USD or ETH-based pairs).
2. Market Setup Session Monitoring: Monitor ETH price action during the pre-market session (7:00 PM–7:59 PM EST), which aligns with the Asian market open (e.g., 9:00 AM–9:59 AM JST).
The script tracks the highest high and lowest low during this session.
Breakout Triggers: Buy Signal: Price breaks above the session’s high after the session ends (7:59 PM EST).
Sell Signal: Price breaks below the session’s low after the session ends.
Visualization: The session is highlighted on the chart with a white background.
Horizontal lines are drawn at the session’s high and low, extended for 30 bars, along with take-profit (TP) and stop-loss (SL) levels.
3. Entry Rules Long (Buy) Entry: Enter a long position when the price breaks above the session’s high price after 7:59 PM EST.
Entry price: Just above the session high (e.g., add a small buffer, like 0.1–0.5%, to avoid false breakouts, depending on volatility).
Short (Sell) Entry: Enter a short position when the price breaks below the session’s low price after 7:59 PM EST.
Entry price: Just below the session low (e.g., subtract a small buffer, like 0.1–0.5%).
Confirmation: Use a candlestick close above/below the breakout level to confirm the entry.
Optionally, add volume confirmation or a momentum indicator (e.g., RSI or MACD) to filter out weak breakouts.
Position Size: Calculate position size based on risk tolerance (e.g., 1–2% of account per trade).
Risk is determined by the stop-loss distance (10 points, as defined in the script).
4. Exit Rules Take-Profit Levels (in points, based on script inputs):TP1: 12 points (1.2:1 R:R).
TP2: 22 points (2.2:1 R:R).
TP3: 32 points (3.2:1 R:R).
TP4: 42 points (4.2:1 R:R).
TP5: 52 points (5.2:1 R:R).
Example for Long: If session high is 3000, TP levels are 3012, 3022, 3032, 3042, 3052.
Example for Short: If session low is 2950, TP levels are 2938, 2928, 2918, 2908, 2898.
Strategy: Scale out of the position (e.g., close 20% at TP1, 20% at TP2, etc.) or take full profit at a preferred TP level based on market conditions.
Stop-Loss: Fixed at 10 points from the entry.
Long SL: Session high - 10 points (e.g., entry at 3000, SL at 2990).
Short SL: Session low + 10 points (e.g., entry at 2950, SL at 2960).
Trailing Stop (Optional):After reaching TP2 or TP3, consider trailing the stop to lock in profits (e.g., trail by 10–15 points below the current price).
5. Risk Management per Trade: Limit risk to 1–2% of your trading account per trade.
Calculate position size: Account Size × Risk % ÷ (Stop-Loss Distance × ETH Price per Point).
Example: $10,000 account, 1% risk = $100. If SL = 10 points and 1 point = $1, position size = $100 ÷ 10 = 0.1 ETH.
Daily Risk Limit: Cap daily losses at 3–5% of the account to avoid overtrading.
Maximum Exposure: Avoid taking both long and short positions simultaneously unless using separate accounts or strategies.
Volatility Consideration: Adjust position size during high-volatility periods (e.g., major news events like Ethereum upgrades or macroeconomic announcements).
6. Trade Management Monitoring :Watch for breakouts after 7:59 PM EST.
Monitor price action near TP and SL levels using alerts or manual checks.
Trade Duration: Breakout lines extend for 30 bars (script parameter). Close trades if no TP or SL is hit within this period, or reassess based on market conditions.
Adjustments: If the market shows strong momentum, consider holding beyond TP5 with a trailing stop.
If the breakout fails (e.g., price reverses before TP1), exit early to minimize losses.
7. Additional Considerations Market Conditions: The 7:00 PM–7:59 PM EST session aligns with the Asian market open (e.g., Tokyo Stock Exchange open at 9:00 AM JST), which may introduce higher volatility due to Asian trading activity.
Avoid trading during low-liquidity periods or extreme volatility (e.g., major crypto news).
Check for upcoming events (e.g., Ethereum network upgrades, ETF decisions) that could impact price.
Backtesting: Test the strategy on historical ETH data using the session high/low breakouts for the 7:00 PM–7:59 PM EST window to validate performance.
Adjust TP/SL levels based on backtest results if needed.
Broker and Fees: Use a low-fee crypto exchange (e.g., Binance, Kraken, Coinbase Pro) to maximize R:R.
Account for trading fees and slippage in your position sizing.
Time zone Adjustment: Adjust session time input for your time zone (e.g., "0000-0059" for GMT).
Ensure your trading platform’s clock aligns with the script’s time zone (default: America/New_York).
8. Example Trade Scenario: Session (7:00 PM–7:59 PM EST) records a high of 3050 and a low of 3000.
Long Trade: Entry: Price breaks above 3050 (e.g., enter at 3051).
TP Levels: 3063 (TP1), 3073 (TP2), 3083 (TP3), 3093 (TP4), 3103 (TP5).
SL: 3040 (3050 - 10).
Position Size: For a $10,000 account, 1% risk = $100. SL = 11 points ($11). Size = $100 ÷ 11 = ~0.09 ETH.
Short Trade: Entry: Price breaks below 3000 (e.g., enter at 2999).
TP Levels: 2987 (TP1), 2977 (TP2), 2967 (TP3), 2957 (TP4), 2947 (TP5).
SL: 3010 (3000 + 10).
Position Size: Same as above, ~0.09 ETH.
Execution: Set alerts for breakouts, enter with limit orders, and monitor TPs/SL.
9. Tools and Setup Platform: Use TradingView to implement the Pine Script and visualize breakout levels.
Alerts: Set price alerts for breakouts above the session high or below the session low after 7:59 PM EST.
Set alerts for TP and SL levels.
Chart Settings: Use a 1-minute or 5-minute chart for precise session tracking.
Overlay the script to see high/low lines, TP levels, and SL levels.
Optional Indicators: Add RSI (e.g., avoid overbought/oversold breakouts) or volume to confirm breakouts.
10. Risk Warnings Crypto Volatility: ETH is highly volatile; unexpected news can cause rapid price swings.
False Breakouts: Breakouts may fail, especially in low-volume sessions. Use confirmation signals.
Leverage: Avoid high leverage (e.g., >5x) to prevent liquidation during volatile moves.
Session Accuracy: Ensure correct session timing for your time zone to avoid misaligned entries.
11. Performance Tracking Journaling :Record each trade’s entry, exit, R:R, and outcome.
Note market conditions (e.g., trending, ranging, news-driven).
Review: Weekly: Assess win rate, average R:R, and adherence to the plan.
Monthly: Adjust TP/SL or session timing based on performance.
Search in scripts for "Trailing stop"

CTA-min D1 — Donchian 55/20 Trend Breakout (ATR Risk)What it is
A clean, daily trend-following breakout inspired by classic CTA/Turtle logic. It buys strength and sells weakness, then lets winners run with a channel-based trailing stop. No curve-fitting, no clutter—just rules.
How it trades
Timeframe: Daily (D1)
Entry: Close breaks the previous 55-bar Donchian channel (above for longs, below for shorts).
Exit/Trail: Trailing stop at the 20-bar Donchian channel on the opposite side (no fixed TP).
Risk: Initial stop = ATR(N) × stopMult (ATR is smoothed). Position size risks riskPct% of equity based on stop distance.
Labels: “BUY/SELL” only on the entry bar; “STOP BUY/STOP SELL” only on the exit bar.
Pyramiding: Off (one position at a time).
Regime Alignment with EMAs (recommended filter, not enforced by code)
Add EMA 50 and EMA 200 to the D1 chart.
Long bias: take BUY signals only when EMA50 > EMA200 (bullish regime).
Short bias: take SELL signals only when EMA50 < EMA200 (bearish regime).
Optional: for extra selectivity, require the H4 EMAs (50/200) to align with D1 before acting on a signal.
Inputs
entryN (55), exitN (20), atrLen (20), atrSmooth (10), stopMult (2.0), riskPct (0.5%–1.0% recommended).
Works well on (tested by user)
BTCUSD (Bitcoin), EURUSD, GBPJPY, NAS100/US100, USDJPY, AUDUSD, XAGUSD (Silver), US30 (Dow), JP225 (Nikkei), EURGBP, NZDUSD, EURCHF, USDCHF.
How to use
Apply to D1 charts. Review once per day after the daily close and execute next session open to mirror backtest assumptions. Best used as a portfolio strategy across multiple uncorrelated markets. Use the EMA alignment above as a discretionary regime filter to reduce false breakouts.
Notes
For educational use. Markets involve risk; past performance does not guarantee future results. Use responsible position sizing.

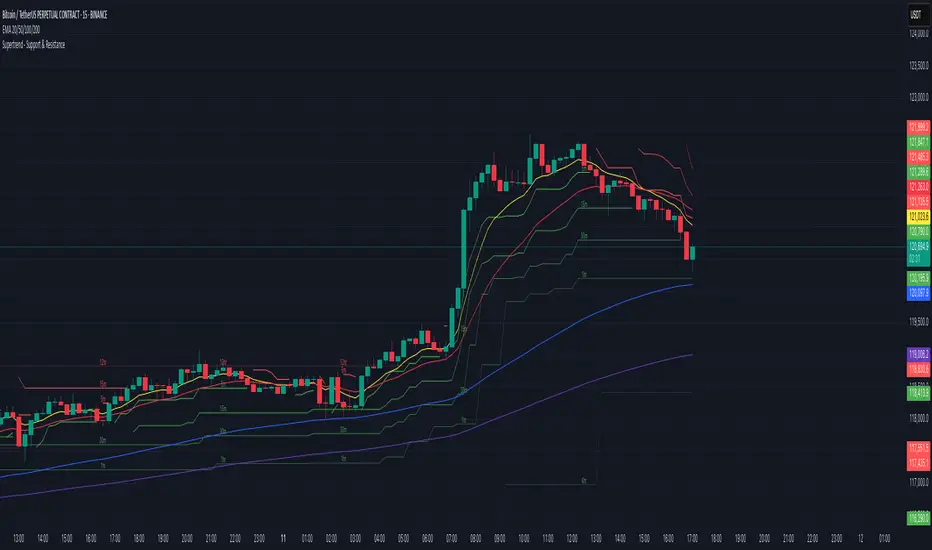
Supertrend - Support & ResistanceSupertrend – Multi-Timeframe Support & Resistance
This script overlays multiple Supertrend bands from higher timeframes on a single chart and treats them as dynamic support and resistance. The goal is simple: see the bigger picture without leaving your current timeframe.
What it does
• Calculates Supertrend using the same ATR Length and Factor across 5m, 15m, 30m, 1h, 4h, 8h, 12h, and 1D.
• Pulls each timeframe via request.security(..., lookahead_off) so values only update on candle close. No look-ahead, no “teleporting” lines.
• Plots each timeframe’s Supertrend as an on-chart band with increasing transparency the higher you go, so you can visually separate short-term vs higher-timeframe structure.
• Colors indicate direction:
• Green = bearish band above price (acting as resistance)
• Red = bullish band below price (acting as support)
• Drops compact labels (5m, 15m, 30m, etc.) every 20 bars right on the corresponding Supertrend level, so you can quickly identify which line belongs to which timeframe.
Why this helps
Supertrend is great for trend definition and trailing stops. But one timeframe alone can whipsaw you. By stacking multiple timeframes:
• Confluence stands out. When several higher-TF bands cluster, price often reacts.
• You see where intraday pullbacks are likely to pause (lower TF bands) and where trend reversals are more meaningful (higher TF bands).
• It’s easier to align entries with the dominant trend while still timing them on your working timeframe.
How it works (quick refresher)
Supertrend uses ATR to offset a median price with a multiplier (Factor). When price crosses the band, direction flips and the trailing line switches sides. This script exposes:
• ATR Length (default 10): sensitivity of the ATR. Smaller = tighter band, more flips. Larger = smoother, fewer flips.
• Factor (default 3.0): multiplier applied to ATR. Larger = wider band, more conservative.
The same settings are used for all timeframes for clean, apples-to-apples comparisons.
How to use it
• Trend alignment: Prefer longs when most higher-TF lines are below price (red support). Prefer shorts when most are above price (green resistance).
• Pullback entries: In an uptrend, look for pullbacks into a lower-TF red band that lines up near a higher-TF red band. That overlap is your “zone.”
• Breakout confirmation: A strong break and close beyond a higher-TF band carries more weight than a lower-TF poke.
• Stops and targets: Use the nearest opposing band as a logic point. For example, in a long, if price loses the lower-TF red band and the next higher-TF band is close overhead, trim or tighten.
Signals you can read at a glance
• Stacking: Multiple red bands beneath price = strong bullish structure. Multiple green bands above price = strong bearish structure.
• Compression: Bands from different TFs squeezing together often precede expansion.
• Flip zones: When a higher-TF band flips side, treat that level as newly minted support/resistance.
Design choices in the code
• lookahead_off on all request.security calls avoids repainting from future data.
• Increasing transparency as the timeframe rises makes lower-TF context visible without drowning the chart.
• Labels every 20 bars keep the chart readable while still giving you frequent anchors.
Good to know (limits and tips)
• This is an overlay of closed-bar Supertrend values from higher TFs. Intrabar moves can still exceed a band before close; final signal prints at candle close of that timeframe.
• Using the same ATR/factor across TFs makes confluence easier to judge. If you need independent tuning per TF, you can clone the security calls and add separate inputs.
• On very low timeframes with many symbols, multiple request.security calls can be heavy. If performance drops, hide one or two higher TFs or increase the label spacing.
Risk note
This is a context tool, not an auto-trader. Combine it with structure (HH/HL vs LH/LL), volume, and your execution rules. Always test on your market and timeframe before committing real capital.
Buy Dip Multiple Positions🎯 Objective
This strategy aims to capture aggressive dip-buying opportunities during volume-confirmed price reversals in short term downtrending markets. It is optimized for multi-entry precision, adaptive stop management, and real-time trade monitoring.
It allows traders to execute multiple long entries and dynamically trail stops to maximize gains while capping risk. Designed with modular inputs, this strategy is ideal for intraday momentum scalping and swing trading alike.
🔧 How It Operates
The strategy triggers buy entries when three conditions align:
Reversal Candle: Current close < prior low × 0.998
Volume Confirmation: Current volume exceeds average of prior 2 bars × 1.2
Price Surge Threshold: Current close below user-defined % of close from N bars ago
Once a reversal candle is confirmed, the strategy:
Calculates position size based on user-defined risk parameters
Allows up to a max number of simultaneous trades
Trailing Stop kicks in 2 bars after entry, climbing by a user-defined % each bar
Exit occurs when price hits either the trailing stop or target price
🛠️ Inputs
Users can customize all major aspects of the strategy:
Max Simultaneous Trades: Default 20
Trailing Stop Increase per Bar (%): Default 1%
Initial Stop (% of Reversal Low): Default 85%
Target Price (% Above Reversal Low): Default 60%
Price Surge Threshold (% of Past Close): Default 89%
Surge Lookback Bars: Default 14
Show Active Trade Dot: Toggle to display green trade status dot
📊 Visual Overlays
The chart displays the following:
Marker Description
🟢 Green Dot Active trade (toggleable)
🔴 Red Dot Max trades reached
📈 Trailing Stop Applied internally but not plotted (can be added)
📊 Metrics Plots of win rate, winning/losing trade counts
📎 Notes
Strategy uses strategy.cash allocation logic
Entry size adapts to account equity and risk per trade
All parameters are accessible via the settings panel
Built entirely in Pine Script v5
This strategy balances flexibility and precision, giving traders control over entry timing, capital allocation, and stop behavior. Ideal for those looking to automate dip-buy setups with tactical overlays and visual alerts.

Alpha - Combined BreakoutThis Pine Script indicator, "Alpha - Combined Breakout," is a combination between Smart Money Breakout Signals and UT Bot Alert, The UT Bot Alert indicator was initially developer by Yo_adriiiiaan
The idea of original code belongs HPotter.
This Indicator helps you identify potential trading opportunities by combining two distinct strategies: Smart Money Breakout and a modified UT Bot (likely a variation of the Ultimate Trend Bot). It provides visual signals, draws lines for potential take profit (TP) and stop loss (SL) levels, and includes a dashboard to track performance metrics.
Tutorial:
Understanding and Using the "Alpha - Combined Breakout" Indicator
This indicator is designed for traders looking for confirmation of market direction and potential entry/exit points by blending structural analysis with a trend-following oscillator.
How it Works (General Concept)
The indicator combines two main components:
Smart Money Breakout: This part identifies significant breaks in market structure, which "smart money" traders often use to gauge shifts in supply and demand. It looks for higher highs/lows or lower highs/lows and flags when these structural points are broken.
UT Bot: This is a trend-following component that generates buy and sell signals based on price action relative to an Average True Range (ATR) based trailing stop.
You can choose to use these signals independently or combined to generate trading alerts and visual cues on your chart. The dashboard provides a quick overview of how well the signals are performing based on your chosen settings and display mode.
Parameters and What They Do
Let's break down each input parameter:
1. Smart Money Inputs
These settings control how the indicator identifies market structure and breakouts.
swingSize (Market Structure Time-Horizon):
What it does: This integer value defines the number of candles used to identify significant "swing" (pivot) points—highs and lows.
Effect: A larger swingSize creates a smoother market structure, focusing on longer-term trends. This means signals might appear less frequently and with some delay but could be more reliable for higher timeframes or broader market movements. A smaller swingSize will pick up more minor market structure changes, leading to more frequent but potentially noisier signals, suitable for lower timeframes or scalping.
Analogy: Think of it like a zoom level on your market structure map. Higher values zoom out, showing only major mountain ranges. Lower values zoom in, showing every hill and bump.
bosConfType (BOS Confirmation Type):
What it does: This string input determines how a Break of Structure (BOS) is confirmed. You have two options:
'Candle Close': A breakout is confirmed only if a candle's closing price surpasses the previous swing high (for bullish) or swing low (for bearish).
'Wicks': A breakout is confirmed if any part of the candle (including its wick) surpasses the previous swing high or low.
Effect: 'Candle Close' provides stronger, more conservative confirmation, as it implies sustained price movement beyond the structure. 'Wicks' provides earlier, more aggressive signals, as it captures momentary breaches of the structure.
Analogy: Imagine a wall. 'Candle Close' means the whole person must get over the wall. 'Wicks' means even a finger touching over the top counts as a breach.
choch (Show CHoCH):
What it does: A boolean (true/false) input to enable or disable the display of "Change of Character" (CHoCH) labels. CHoCH indicates the first structural break against the current dominant trend.
Effect: When true, it helps identify early signs of a potential trend reversal, as it marks where the market's "character" (its tendency to make higher highs/lows or lower lows/highs) first changes.
BULL (Bullish Color) & BEAR (Bearish Color):
What they do: These color inputs allow you to customize the visual appearance of bullish and bearish signals and lines drawn by the Smart Money component.
Effect: Purely cosmetic, helps with visual identification on the chart.
sm_tp_sl_multiplier (SM TP/SL Multiplier (ATR)):
What it does: A float value that acts as a multiplier for the Average True Range (ATR) to calculate the Take Profit (TP) and Stop Loss (SL) levels specifically when you're in "Smart Money Only" mode. It uses the ATR calculated by the UT Bot's nLoss_ut as its base.
Effect: A higher multiplier creates wider TP/SL levels, potentially leading to fewer trades but larger wins/losses. A lower multiplier creates tighter TP/SL levels, potentially leading to more frequent but smaller wins/losses.
2. UT Bot Alerts Inputs
These parameters control the behavior and sensitivity of the UT Bot component.
a_ut (UT Key Value (Sensitivity)):
What it does: This integer value adjusts the sensitivity of the UT Bot.
Effect: A higher value makes the UT Bot less sensitive to price fluctuations, resulting in fewer and potentially more reliable signals. A lower value makes it more sensitive, generating more signals, which can include more false signals.
Analogy: Like a noise filter. Higher values filter out more noise, keeping only strong signals.
c_ut (UT ATR Period):
What it does: This integer sets the look-back period for the Average True Range (ATR) calculation used by the UT Bot. ATR measures market volatility.
Effect: This period directly influences the calculation of the nLoss_ut (which is a_ut * xATR_ut), thus defining the distance of the trailing stop loss and take profit levels. A longer period makes the ATR smoother and less reactive to sudden price spikes. A shorter period makes it more responsive.
h_ut (UT Signals from Heikin Ashi Candles):
What it does: A boolean (true/false) input to determine if the UT Bot calculations should use standard candlestick data or Heikin Ashi candlestick data.
Effect: Heikin Ashi candles smooth out price action, often making trends clearer and reducing noise. Using them for UT Bot signals can lead to smoother, potentially delayed signals that stay with a trend longer. Standard candles are more reactive to raw price changes.
3. Line Drawing Control Buttons
These crucial boolean inputs determine which type of signals will trigger the drawing of TP/SL/Entry lines and flags on your chart. They act as a priority system.
drawLinesUtOnly (Draw Lines: UT Only):
What it does: If checked (true), lines and flags will only be drawn when the UT Bot generates a buy/sell signal.
Effect: Isolates UT Bot signals for visual analysis.
drawLinesSmartMoneyOnly (Draw Lines: Smart Money Only):
What it does: If checked (true), lines and flags will only be drawn when the Smart Money Breakout logic generates a bullish/bearish breakout.
Effect: Overrides drawLinesUtOnly if both are checked. Isolates Smart Money signals.
drawLinesCombined (Draw Lines: UT & Smart Money (Combined)):
What it does: If checked (true), lines and flags will only be drawn when both a UT Bot signal AND a Smart Money Breakout signal occur on the same bar.
Effect: Overrides both drawLinesUtOnly and drawLinesSmartMoneyOnly if checked. Provides the strictest entry criteria for line drawing, looking for strong confluence.
Dashboard Metrics Explained
The dashboard provides performance statistics based on the lines drawing control button selected. For example, if "Draw Lines: UT Only" is active, the dashboard will show stats only for UT Bot signals.
Total Signals: The total number of buy or sell signals generated by the selected drawing mode.
TP1 Win Rate: The percentage of signals where the price reached Take Profit 1 (TP1) before hitting the Stop Loss.
TP2 Win Rate: The percentage of signals where the price reached Take Profit 2 (TP2) before hitting the Stop Loss.
TP3 Win Rate: The percentage of signals where the price reached Take Profit 3 (TP3) before hitting the Stop Loss. (Note: TP1, TP2, TP3 are in order of distance from entry, with TP3 being furthest.)
SL before any TP rate: This crucial metric shows the number of times the Stop Loss was hit / the percentage of total signals where the stop loss was triggered before any of the three Take Profit levels were reached. This gives you a clear picture of how often a trade resulted in a loss without ever moving into profit target territory.
Short Tutorial: How to Use the Indicator
Add to Chart: Open your TradingView chart, go to "Indicators," search for "Alpha - Combined Breakout," and add it to your chart.
Access Settings: Once added, click the gear icon next to the indicator name on your chart to open its settings.
Choose Your Signal Mode:
For UT Bot only: Uncheck "Draw Lines: Smart Money Only" and "Draw Lines: UT & Smart Money (Combined)". Ensure "Draw Lines: UT Only" is checked.
For Smart Money only: Uncheck "Draw Lines: UT Only" and "Draw Lines: UT & Smart Money (Combined)". Ensure "Draw Lines: Smart Money Only" is checked.
For Combined Signals: Check "Draw Lines: UT & Smart Money (Combined)". This will override the other two.
Adjust Parameters:
Start with default settings. Observe how the signals appear on your chosen asset and timeframe.
Refine Smart Money: If you see too many "noisy" market structure breaks, increase swingSize. If you want earlier breakouts, try "Wicks" for bosConfType.
Refine UT Bot: Adjust a_ut (Sensitivity) to get more or fewer UT Bot signals. Change c_ut (ATR Period) if you want larger or smaller TP/SL distances. Experiment with h_ut to see if Heikin Ashi smoothing suits your trading style.
Adjust TP/SL Multiplier: If using "Smart Money Only" mode, fine-tune sm_tp_sl_multiplier to set appropriate risk/reward levels.
Interpret Signals & Lines:
Buy/Sell Flags: These indicate the presence of a signal based on your selected drawing mode.
Entry Line (Blue Solid): This is where the signal was generated (usually the close price of the signal candle).
SL Line (Red/Green Solid): Your calculated stop loss level.
TP Lines (Dashed): Your three calculated take profit levels (TP1, TP2, TP3, where TP3 is the furthest target).
Smart Money Lines (BOS/CHoCH): These lines indicate horizontal levels where market structure breaks occurred. CHoCH labels might appear at the first structural break against the prior trend.
Monitor Dashboard: Pay attention to the dashboard in the top right corner. This dynamically updates to show the win rates for each TP and, crucially, the "SL before any TP rate." Use these statistics to evaluate the effectiveness of the indicator's signals under your current settings and chosen mode.
*
Set Alerts (Optional): You can set up alerts for any of the specific signals (UT Bot Long/Short, Smart Money Bullish/Bearish, or the "Line Draw" combined signals) to notify you when they occur, even if you're not actively watching the chart.
By following this tutorial, you'll be able to effectively use and customize the "Alpha - Combined Breakout" indicator to suit your trading strategy.

Warrior Trading Momentum Strategy
# 🚀 Warrior Trading Momentum Strategy - Day Trading Excellence
## Strategy Overview
This comprehensive Pine Script strategy replicates the proven methodologies taught by Ross Cameron and the Warrior Trading community. Designed for active day traders, it identifies high-probability momentum setups with strict risk management protocols.
## 📈 Core Trading Setups
### 1. Gap and Go Trading
- **Primary Focus**: Stocks gapping up 2%+ with volume confirmation
- **Entry Logic**: Breakout above gap open with momentum validation
- **Volume Filter**: 2x average volume requirement for quality setups
### 2. ABCD Pattern Recognition
- **Pattern Detection**: Automated identification of classic ABCD reversal patterns
- **Validation**: A-B and C-D move relationship analysis
- **Entry Trigger**: D-point breakout with volume confirmation
### 3. VWAP Momentum Plays
- **Strategy**: Entries near VWAP with bounce confirmation
- **Distance Filter**: Configurable percentage distance for optimal entries
- **Direction Bias**: Above VWAP bullish momentum validation
### 4. Red to Green Reversals
- **Setup**: Reversal patterns after consecutive red candles
- **Confirmation**: Volume spike with bullish close required
- **Momentum**: Trend change validation with RSI support
### 5. Breakout Momentum
- **Logic**: Breakouts above recent highs with volume
- **Filters**: EMA20 and RSI confirmation for quality
- **Trend**: Established momentum direction validation
## ⚡ Key Features
### Smart Risk Management
- **Position Sizing**: Automatic calculation based on account risk percentage
- **Stop Loss**: 2 ATR-based stops for volatility adjustment
- **Take Profit**: Configurable risk-reward ratios (default 1:2)
- **Trailing Stops**: Profit protection with adjustable triggers
### Advanced Filtering System
- **Time Filters**: Market hours trading with lunch hour avoidance
- **Volume Confirmation**: Multi-timeframe volume analysis
- **Momentum Indicators**: RSI and moving average trend validation
- **Quality Control**: Multiple confirmation layers for signal accuracy
### PDT-Friendly Design
- **Trade Limiting**: Built-in daily trade counter for accounts under $25K
- **Selective Trading**: Priority scoring system for A+ setups only
- **Quality over Quantity**: Maximum 2-3 high-probability trades per day
## 🎯 Optimal Usage
### Best Timeframes
- **Primary**: 5-minute charts for entry timing
- **Secondary**: 1-minute for precise execution
- **Context**: Daily charts for gap analysis
### Ideal Market Conditions
- **Volatility**: High-volume, momentum-driven markets
- **Stocks**: Market cap $100M+, average volume 1M+ shares
- **Sectors**: Technology, biotech, growth stocks with news catalysts
### Account Requirements
- **Minimum**: $500+ for proper position sizing
- **Recommended**: $25K+ for unlimited day trading
- **Risk Tolerance**: Active day trading experience preferred
## 📊 Performance Optimization
### Entry Criteria (All Must Align)
1. ✅ Time filter (market hours, avoid lunch)
2. ✅ Volume spike (2x+ average volume)
3. ✅ Momentum confirmation (RSI 50-80)
4. ✅ Trend alignment (above EMA20)
5. ✅ Pattern completion (setup-specific)
### Risk Parameters
- **Maximum Risk**: 1-2% per trade
- **Position Size**: 25% of account maximum
- **Stop Loss**: 2 ATR below entry
- **Take Profit**: 2:1 risk-reward minimum
## 🔧 Customization Options
### Gap Trading Settings
- Minimum gap percentage threshold
- Volume multiplier requirements
- Gap validation criteria
### Pattern Recognition
- ABCD ratio parameters
- Swing point sensitivity
- Pattern completion filters
### Risk Management
- Risk-reward ratio adjustment
- Maximum daily trade limits
- Trailing stop trigger levels
### Time and Session Filters
- Trading session customization
- Lunch hour avoidance toggle
- Market condition filters
## ⚠️ Important Disclaimers
### Risk Warning
- **High Risk**: Day trading involves substantial risk of loss
- **Capital Requirements**: Only trade with risk capital
- **Experience**: Strategy requires active monitoring and experience
- **Market Conditions**: Performance varies with market volatility
### PDT Considerations
- **Day Trading Rules**: Accounts under $25K limited to 3 day trades per 5 days
- **Compliance**: Strategy includes trade counting for PDT compliance
- **Alternative**: Consider swing trading modifications for smaller accounts
### Backtesting vs Live Trading
- **Slippage**: Real trading involves execution delays and slippage
- **Commissions**: Factor in broker fees for accurate performance
- **Market Impact**: Large positions may affect fill prices
- **Psychological Factors**: Live trading involves emotional challenges
## 📚 Educational Value
This strategy serves as an excellent learning tool for understanding:
- Professional day trading methodologies
- Risk management principles
- Pattern recognition techniques
- Volume and momentum analysis
- Multi-timeframe analysis
## 🤝 Community and Support
Based on proven Warrior Trading methodologies with active community support. Strategy includes comprehensive plotting and information tables for educational purposes and trade analysis.
---
**Disclaimer**: This strategy is for educational purposes. Past performance does not guarantee future results. Always practice proper risk management and never risk more than you can afford to lose.
**Tags**: #DayTrading #Momentum #WarriorTrading #GapAndGo #ABCD #VWAP #PatternTrading #RiskManagement

MACD + RSI + EMA + BB + ATR Day Trading StrategyEntry Conditions and Signals
The strategy implements a multi-layered filtering approach to entry conditions, requiring alignment across technical indicators, timeframes, and market conditions .
Long Entry Requirements
Trend Filter: Fast EMA (9) must be above Slow EMA (21), price must be above Fast EMA, and higher timeframe must confirm uptrend
MACD Signal: MACD line crosses above signal line, indicating increasing bullish momentum
RSI Condition: RSI below 70 (not overbought) but above 40 (showing momentum)
Volume & Volatility: Current volume exceeds 1.2x 20-period average and ATR shows sufficient market movement
Time Filter: Trading occurs during optimal hours (9:30-11:30 AM ET) when market volatility is typically highest
Exit Strategies
The strategy employs multiple exit mechanisms to adapt to changing market conditions and protect profits :
Stop Loss Management
Initial Stop: Placed at 2.0x ATR from entry price, adapting to current market volatility
Trailing Stop: 1.5x ATR trailing stop that moves up (for longs) or down (for shorts) as price moves favorably
Time-Based Exits: All positions closed by end of trading day (4:00 PM ET) to avoid overnight risk
Best Practices for Implementation
Settings
Chart Setup: 5-minute timeframe for execution with 15-minute chart for trend confirmation
Session Times: Focus on 9:30-11:30 AM ET trading for highest volatility and opportunity

ATR Overlay with Trailing Flip [ask2maniish]📘 ATR Overlay with Trailing Flip
🔍 Overview
The ATR Overlay with Trailing Flip is a dynamic, visually-enhanced overlay indicator designed to assist traders in trend detection, trailing stop management, and volatility-based decision making. It leverages the Average True Range (ATR) with optional dynamic multipliers, filters, and alerts to enhance trade execution precision.
⚙️ Features Summary
✅ Static & dynamic ATR multiplier
✅ Customizable trailing stop logic
✅ Volume & Bollinger Band filters
✅ Buy/Sell label signals with alerts
✅ ATR bands with color fill
✅ Optional candle coloring based on trend
✅ Table showing current ATR multiplier
✅ Fully customizable visual controls
🔧 User Inputs
📘 Info Panel
ATR Usage Guide
Tooltip with trading-style recommendations:
Scalping: ATR 5–10, Intraday: ATR 10–14 , Swing: ATR 14–21 , Position: ATR 21–50
📊 Visual Elements
📈 Plots
Upper/Lower ATR Bands
ATR Fill Zone
Dynamic Trailing Stop Line
🕯 Candle Coloring
Candles colored green (uptrend) or red (downtrend)
Wick coloring matches body
🏷 Signal Labels
"BUY" below candle when trend flips up
"SELL" above candle when trend flips down
📊 Table (Top Right)
Displays current multiplier value:
If static: Static: x.x
If dynamic: percentage format based on ATR ratio
🔔 Alerts
Two alert conditions:
Flip to Long → "📈 ATR flip to LONG"
Flip to Short → "📉 ATR flip to SHORT"
Sound can be enabled for real-time feedback.
🧠 Best Practices
Combine this tool with support/resistance or order flow indicators
Use dynamic ATR during volatile periods for better adaptability
Filter signals in ranging markets with BBand Width Filter
For scalping, reduce ATR period and multiplier for tighter risk
🛠️ Customization Tips
Adjust trailingPeriod for tighter/looser stops
Use color inputs to match your charting theme
Disable features (labels/fill) to declutter chart

UT Bot + Hull MA Confirmed Signal DelayOverview
This indicator is designed to detect high-probability reversal entry signals by combining "UT Bot Alerts" (UT Bot Alerts script adapted from QuantNomad - Originally developed by Yo_adriiiiaan and idea of original code for "UT Bot Alerts" from HPotter ) with confirmation from a Hull Moving Average (HMA) Developed by Alan Hull . It focuses on capturing momentum shifts that often precede trend reversals, helping traders identify potential entry points while filtering out false signals.
🔍 How It Works
This strategy operates in two stages:
1. UT Bot Momentum Trigger
The foundation of this script is the "UT Bot Alerts" , which uses an ATR-based trailing stop to detect momentum changes. Specifically:
The script calculates a dynamic stop level based on the Average True Range (ATR) multiplied by a user-defined sensitivity factor (Key Value).
When price closes above this trailing stop and the short-term EMA crosses above the stop, a potential buy setup is triggered.
Conversely, when price closes below the trailing stop and the short-term EMA crosses below, a potential sell setup is triggered.
These UT Bot alerts are designed to identify the initial shift in market direction, acting as the first filter in the signal process.
2. Hull MA Confirmation
To reduce noise and false triggers from the UT Bot alone, this script delays the entry signal until price confirms the move by crossing the Hull Moving Average (or its variants: HMA, THMA, EHMA) in the same direction as the UT Bot trigger:
A Buy Signal is generated only when:
A UT Bot Buy condition is active, and
The price closes above the Hull MA.
Or, if a UT Bot Buy condition was recently triggered but price hadn’t yet crossed above the Hull MA, a delayed buy is signaled when price finally breaks above it.
A Sell Signal is generated only when:
A UT Bot Sell condition is active, and
The price closes below the Hull MA.
Similarly, a delayed sell signal can occur if price breaks below the Hull MA shortly after a UT Bot Sell trigger.
This dual-confirmation process helps traders avoid premature entries and improves the reliability of reversal signals.
📈 Best Use Cases
Reversal Trading: This strategy is particularly well-suited for catching early trend reversals rather than trend continuations. It excels at identifying momentum pivots that occur after pullbacks or exhaustion moves.
Heikin Ashi Charts Recommended: The script offers a Heikin Ashi mode for smoothing out noise and enhancing visual clarity. Using Heikin Ashi candles can further reduce whipsaws and highlight cleaner shifts in trend direction.
MACD Alignment: For best results, trade in the direction of the MACD trend or use it as a filter to avoid counter-trend trades.
⚠️ Important Notes
Entry Signals Only: This indicator only plots entry points (Buy and Sell signals). It does not define exit strategies, so users should manage trades manually using trailing stops, profit targets, or other exit indicators.
No Signal = No Confirmation: You may see a UT Bot trigger without a corresponding Buy/Sell signal. This means the price did not confirm the move by crossing the Hull MA, and therefore the setup was considered too weak or incomplete.
⚙️ Customization
UT Bot Sensitivity: Adjust the “Key Value” and “ATR Period” to make the UT Bot more or less reactive to price action.
Use Heikin Ashi: Toggle between standard candles or Heikin Ashi in the indicator settings for a smoother trading experience.
The HMA length may also be modified in the indicator settings from its standard 55 length to increase or decrease the sensitivity of signal.
This strategy is best used by traders looking for a structured, logic-based way to enter early into reversals with added confirmation to reduce risk. By combining two independent systems—momentum detection (UT Bot) and trend confirmation (Hull MA)—it aims to provide high-confidence entries without overwhelming complexity.
Let the indicator guide your entries—you manage the exits.
Examples of use:
Futures:
Stock:
Crypto:
As shown in the snapshots this strategy, like most, works the best when price action has a sizeable ATR and works the least when price is choppy. Therefore it is always best to use this system when price is coming off known support or resistance levels and when it is seen to respect short term EMA's like the 9 or 15.
My personal preference to use this system is for day trading on a 3 or 5 minute chart. But it is valid for all timeframes and simply marks a high probability for a new trend to form.
Sources:
Quant Nomad - www.tradingview.com
Yo_adriiiiaan - www.tradingview.com
HPotter - www.tradingview.com
Hull Moving Average - alanhull.com

Guppy Multiple Moving Average (GMMA)The GMMA Momentum Indicator plots 12 EMAs on your chart, divided into two groups:
Short-term EMAs (6 lines, default periods: 3, 5, 8, 10, 12, 15): Represent short-term trader sentiment and momentum.
Long-term EMAs (6 lines, default periods: 30, 35, 40, 45, 50, 60): Reflect long-term investor behavior and broader market trends.
By analyzing the interaction between these two groups, the indicator identifies:
Bullish and bearish trends based on the relative positions of the short- and long-term EMAs.
Momentum strength through the spread or convergence of the EMAs.
Potential reversals or breakouts via compression signals.
This PineScript version enhances the traditional GMMA by adding visual cues like background colors, bearish signals, and compression detection, making it ideal for swing traders seeking clear, actionable insights.
The GMMA Momentum Indicator provides several key features:
1. Trend Identification
Bullish Trend: When the short-term EMAs (green lines) are above the long-term EMAs (blue lines) and spreading apart, it signals strong upward momentum. The chart background turns light green to highlight this condition.
Bearish Trend: When the short-term EMAs cross below the long-term EMAs and converge, it indicates downward momentum. The background turns light red, and an orange downward triangle appears above the bar to mark a new bearish signal.
2. Momentum Analysis
The spread between the short-term EMAs reflects the strength of short-term momentum. A wide spread suggests strong momentum, while a tight grouping indicates weakening momentum or consolidation. Similarly, the long-term EMAs act as dynamic support or resistance, guiding traders on the broader trend.
3. Compression Detection
Compression occurs when both the short-term and long-term EMAs converge, signaling low volatility and a potential breakout or reversal. A yellow upward triangle appears below the bar when compression is detected, alerting traders to watch for price action.
4. Visual Cues
Green short-term EMAs: Show short-term trader activity.
Blue long-term EMAs: Represent long-term investor sentiment.
Background colors: Light green for bullish trends, light red for bearish trends, and transparent for neutral conditions.
Orange downward triangles: Mark new bearish trends.
Yellow upward triangles: Indicate compression, hinting at potential breakouts.
How to Use the GMMA Momentum Indicator for Swing Trading
Swing trading involves capturing price moves over days to weeks, and the GMMA Momentum Indicator is an excellent tool for this strategy. Here’s how to use it effectively:
1. Identifying Trade Entries
Buy Opportunities:
Look for a bullish trend (green background) where the short-term EMAs are above the long-term EMAs and spreading apart, indicating strong momentum.
A compression signal (yellow triangle) followed by a breakout above resistance or a bullish candlestick pattern can confirm an entry.
Example: On a daily chart, if the short-term EMAs cross above the long-term EMAs and the background turns green, consider entering a long position, especially if volume supports the move.
Sell Opportunities:
Watch for a bearish signal (orange downward triangle) or a bearish trend (red background) where the short-term EMAs cross below the long-term EMAs.
Example: If the short-term EMAs collapse below the long-term EMAs and an orange triangle appears, it may signal a shorting opportunity or a time to exit longs.
2. Managing Trades
Use the long-term EMAs as dynamic support (in uptrends) or resistance (in downtrends) to set stop-loss levels or trail stops.
Monitor the spread of the short-term EMAs. A widening spread suggests the trend is strong, while convergence may indicate it’s time to take profits or tighten stops.
3. Anticipating Reversals
Compression signals (yellow triangles) highlight periods of low volatility, often preceding significant price moves. Combine these with price action (e.g., breakouts or reversals) or other indicators (e.g., RSI or volume) for confirmation.
Example: If a compression signal appears near a key support level and the price breaks upward, it could signal the start of a new bullish swing.
4. Best Practices
Timeframes: The indicator works well on daily or 4-hour charts for swing trading, but you can adjust the EMA periods for shorter (e.g., 1-hour) or longer (e.g., weekly) timeframes.
Confirmation: Combine the GMMA with other tools like support/resistance levels, candlestick patterns, or oscillators (e.g., MACD) to reduce false signals.
Risk Management: Always use proper position sizing and stop-losses, as EMAs are lagging indicators and may produce delayed signals in choppy markets.

Dskyz (DAFE) AI Adaptive Regime - Beginners VersionDskyz (DAFE) AI Adaptive Regime - Pro: Revolutionizing Trading for All
Introduction
In the fast-paced world of financial markets, traders need tools that can keep up with ever-changing conditions while remaining accessible. The Dskyz (DAFE) AI Adaptive Regime - Pro is a groundbreaking TradingView strategy that delivers advanced, AI-driven trading capabilities to everyday traders. Available on TradingView (TradingView Scripts), this Pine Script strategy combines sophisticated market analysis with user-friendly features, making it a standout choice for both novice and experienced traders.
Core Functionality
The strategy is built to adapt to different market regimes—trending, ranging, volatile, or quiet—using a robust set of technical indicators, including:
Moving Averages (MA): Fast and slow EMAs to detect trend direction.
Average True Range (ATR): For dynamic stop-loss and volatility assessment.
Relative Strength Index (RSI) and MACD: Multi-timeframe confirmation of momentum and trend.
Average Directional Index (ADX): To identify trending markets.
Bollinger Bands: For assessing volatility and range conditions.
Candlestick Patterns: Recognizes patterns like bullish engulfing, hammer, and double bottoms, confirmed by volume spikes.
It generates buy and sell signals based on a scoring system that weighs these indicators, ensuring trades align with the current market environment. The strategy also includes dynamic risk management with ATR-based stops and trailing stops, as well as performance tracking to optimize future trades.
What Sets It Apart
The Dskyz (DAFE) AI Adaptive Regime - Pro distinguishes itself from other TradingView strategies through several unique features, which we compare to common alternatives below:
| Feature | Dskyz (DAFE) | Typical TradingView Strategies|
|---------|-------------|------------------------------------------------------------|
| Regime Detection | Automatically identifies and adapts to **four** market regimes | Often static or limited to trend/range detection |
| Multi‑Timeframe Analysis | Uses higher‑timeframe RSI/MACD for confirmation | Rarely incorporates multi‑timeframe data |
| Pattern Recognition | Detects candlestick patterns **with volume confirmation** | Limited or no pattern recognition |
| Dynamic Risk Management | ATR‑based stops and trailing stops | Often uses fixed stops or basic risk rules |
| Performance Tracking | Adjusts thresholds based on past performance | Typically static parameters |
| Beginner‑Friendly Presets | Aggressive, Conservative, Optimized profiles | Requires manual parameter tuning |
| Visual Cues | Color‑coded backgrounds for regimes | Basic or no visual aids |
The Dskyz strategy’s ability to integrate regime detection, multi-timeframe analysis, and user-friendly presets makes it uniquely versatile and accessible, addressing the needs of everyday traders who want professional-grade tools without the complexity.
-Key Features and Benefits
[Why It’s Ideal for Everyday Traders
⚡The Dskyz (DAFE) AI Adaptive Regime - Pro democratizes advanced trading by offering professional-grade tools in an accessible package. Unlike many TradingView strategies that require deep technical knowledge or fail in changing market conditions, this strategy simplifies complex analysis while maintaining robustness. Its presets and visual aids make it easy for beginners to start, while its adaptive features and performance tracking appeal to advanced traders seeking an edge.
🔄Limitations and Considerations
Market Dependency: Performance varies by market and timeframe. Backtesting is essential to ensure compatibility with your trading style.
Learning Curve: While presets simplify use, understanding regimes and indicators enhances effectiveness.
No Guaranteed Profits: Like all strategies, success depends on market conditions and proper execution. The Reddit discussion highlights skepticism about TradingView strategies’ universal success (Reddit Discussion).
Instrument Specificity: Optimized for futures (e.g., ES, NQ) due to fixed tick values. Test on other instruments like stocks or forex to verify compatibility.
📌Conclusion
The Dskyz (DAFE) AI Adaptive Regime - Pro is a revolutionary TradingView strategy that empowers everyday traders with advanced, AI-driven tools. Its ability to adapt to market regimes, confirm signals across timeframes, and manage risk dynamically. sets it apart from typical strategies. By offering beginner-friendly presets and visual cues, it makes sophisticated trading accessible without sacrificing power. Whether you’re a novice looking to trade smarter or a pro seeking a competitive edge, this strategy is your ticket to mastering the markets. Add it to your chart, backtest it, and join the elite traders leveraging AI to dominate. Trade like a boss today! 🚀
Use it with discipline. Use it with clarity. Trade smarter.
**I will continue to release incredible strategies and indicators until I turn this into a brand or until someone offers me a contract.
-Dskyz

Momentum Volume Divergence (MVD) EnhancedMomentum Volume Divergence (MVD) Enhanced is a powerful indicator that detects price-momentum divergences and momentum suppression for reversal trading. Optimized for XRP on 1D charts, it features dynamic lookbacks, ATR-adjusted thresholds, and SMA confirmation. Signals include strong divergences (triangles) and suppression warnings (crosses). Includes a detailed user guide—try it out and share your feedback!
Setup: Add to XRP 1D chart with defaults (mom_length_base=8, vol_length_base=10). Signals: Red triangle (sell), Green triangle (buy), Orange cross (bear warning), Yellow cross (bull warning). Confirm with 5-day SMA crossovers. See full guide for details!
Disclaimer: This indicator is for educational purposes only, not financial advice. Trading involves risk—use at your discretion.
Momentum Volume Divergence (MVD) Enhanced Indicator User Guide
Version: Pine Script v6
Designed for: TradingView
Recommended Use: XRP on 1-day (1D) chart
Date: March 18, 2025
Author: Herschel with assistance from Grok 3 (xAI)
Overview
The Momentum Volume Divergence (MVD) Enhanced indicator is a powerful tool for identifying price-momentum divergences and momentum suppression patterns on XRP’s 1-day (1D) chart. Plotted below the price chart, it provides clear visual signals to help traders spot potential reversals and trend shifts.
Purpose
Detect divergences between price and momentum for buy/sell opportunities.
Highlight momentum suppression as warnings of fading trends.
Offer actionable trading signals with intuitive markers.
Indicator Components
Main Plot
Volume-Weighted Momentum (vw_mom): Blue line showing momentum adjusted by volume.
Above 0 = bullish momentum.
Below 0 = bearish momentum.
Zero Line: Gray dashed line at 0, separating bullish/bearish zones.
Key Signals
Strong Bearish Divergence:
Marker: Red triangle at the top.
Meaning: Price makes a higher high, but momentum weakens, confirmed by a drop below the 5-day SMA.
Action: Potential sell/short signal.
Strong Bullish Divergence:
Marker: Green triangle at the bottom.
Meaning: Price makes a lower low, but momentum strengthens, confirmed by a rise above the 5-day SMA.
Action: Potential buy/long signal.
Bearish Suppression:
Marker: Orange cross at the top + red background.
Meaning: Strong bullish momentum with low volume in a volume downtrend, suggesting fading strength.
Action: Warning to avoid longs or exit early.
Bullish Suppression:
Marker: Yellow cross at the bottom + green background.
Meaning: Strong bearish momentum with low volume in a volume uptrend, suggesting fading weakness.
Action: Warning to avoid shorts or exit early.
Debug Plots (Optional)
Volume Ratio: Gray line (volume vs. its MA) vs. yellow line (threshold).
Momentum Threshold: Purple lines (positive/negative momentum cutoffs).
Smoothed Momentum: Orange line (raw momentum).
Confirmation SMA: Purple line (price trend confirmation).
Labels
Text labels (e.g., "Bear Div," "Bull Supp") mark detected patterns.
How to Use the Indicator
Step-by-Step Trading Process
1. Monitor the Chart
Load your XRP 1D chart with the indicator applied.
Observe the blue vw_mom line and signal markers.
2. Spot a Signal
Primary Signals: Look for red triangles (strong_bear) or green triangles (strong_bull).
Warnings: Note orange crosses (suppression_bear) or yellow crosses (suppression_bull).
3. Confirm the Signal
For Strong Bullish Divergence (Buy):
Green triangle appears.
Price closes above the 5-day SMA (purple line) and a recent swing high.
Optional: Volume ratio (gray line) exceeds the threshold (yellow line).
For Strong Bearish Divergence (Sell):
Red triangle appears.
Price closes below the 5-day SMA and a recent swing low.
Optional: Volume ratio (gray line) falls below the threshold (yellow line).
4. Enter the Trade
Long:
Buy at the close of the signal bar.
Stop loss: Below the recent swing low or 2 × ATR(14) below entry.
Short:
Sell/short at the close of the signal bar.
Stop loss: Above the recent swing high or 2 × ATR(14) above entry.
5. Manage the Trade
Take Profit:
Aim for a 2:1 or 3:1 risk-reward ratio (e.g., risk $0.05, target $0.10-$0.15).
Or exit when an opposite suppression signal appears (e.g., orange cross for longs).
Trailing Stop:
Move stop to breakeven after a 1:1 RR move.
Trail using the 5-day SMA or 2 × ATR(14).
Early Exit:
Exit if a suppression signal appears against your position (e.g., suppression_bull while short).
6. Filter Out Noise
Avoid trades if a suppression signal precedes a divergence within 2-3 days.
Optional: Add a 50-day SMA on the price chart:
Longs only if price > 50-SMA.
Shorts only if price < 50-SMA.
Example Trades (XRP 1D)
Bullish Trade
Signal: Green triangle (strong_bull) at $0.55.
Confirmation: Price closes above 5-SMA and $0.57 high.
Entry: Buy at $0.58.
Stop Loss: $0.53 (recent low).
Take Profit: $0.63 (2:1 RR) or exit on suppression_bear.
Outcome: Price hits $0.64, exit at $0.63 for profit.
Bearish Trade
Signal: Red triangle (strong_bear) at $0.70.
Confirmation: Price closes below 5-SMA and $0.68 low.
Entry: Short at $0.67.
Stop Loss: $0.71 (recent high).
Take Profit: $0.62 (2:1 RR) or exit on suppression_bull.
Outcome: Price drops to $0.61, exit at $0.62 for profit.
Tips for Success
Combine with Price Levels:
Use support/resistance zones (e.g., weekly pivots) to confirm entries.
Monitor Volume:
Rising volume (gray line above yellow) strengthens signals.
Adjust Sensitivity:
Too many signals? Increase div_strength_threshold to 0.7.
Too few signals? Decrease to 0.3.
Backtest:
Review 20-30 past signals on XRP 1D to assess performance.
Avoid Choppy Markets:
Skip signals during low volatility (tight price ranges).
Troubleshooting
No Signals:
Lower div_strength_threshold to 0.3 or mom_threshold_base to 0.2.
Check if XRP’s volatility is unusually low.
False Signals:
Increase sma_confirm_length to 7 or add a 50-SMA filter.
Indicator Not Loading:
Ensure the script compiles without errors.
Customization (Optional)
Change Colors: Edit color.* values (e.g., color.red to color.purple).
Add Alerts: Use TradingView’s alert menu for "Strong Bearish Divergence Confirmed," etc.
Test Other Assets: Experiment with BTC or ETH, adjusting inputs as needed.
Disclaimer
This indicator is for educational purposes only and not financial advice. Trading involves risk, and past performance does not guarantee future results. Use at your own discretion.
Setup: Use on XRP 1D with defaults (mom_length_base=8, vol_length_base=10). Signals: Red triangle (sell), Green triangle (buy), Orange cross (bear warning), Yellow cross (bull warning). Confirm with 5-day SMA cross. Stop: 2x ATR(14). Profit: 2:1 RR or suppression exit. Full guide available separately!

Advanced Adaptive Grid Trading StrategyThis strategy employs an advanced grid trading approach that dynamically adapts to market conditions, including trend, volatility, and risk management considerations. The strategy aims to capitalize on price fluctuations in both rising (long) and falling (short) markets, as well as during sideways movements. It combines multiple indicators to determine the trend and automatically adjusts grid parameters for more efficient trading.
How it Works:
Trend Analysis:
Short, long, and super long Moving Averages (MA) to determine the trend direction.
RSI (Relative Strength Index) to identify overbought and oversold levels, and to confirm the trend.
MACD (Moving Average Convergence Divergence) to confirm momentum and trend direction.
Momentum indicator.
The strategy uses a weighted scoring system to assess trend strength (strong bullish, moderate bullish, strong bearish, moderate bearish, sideways).
Grid System:
The grid size (the distance between buy and sell levels) changes dynamically based on market volatility, using the ATR (Average True Range) indicator.
Grid density also adapts to the trend: in a strong trend, the grid is denser in the direction of the trend.
Grid levels are shifted depending on the trend direction (upwards in a bear market, downwards in a bull market).
Trading Logic:
The strategy opens long positions if the trend is bullish and the price reaches one of the lower grid levels.
It opens short positions if the trend is bearish and the price reaches one of the upper grid levels.
In a sideways market, it can open positions in both directions.
Risk Management:
Stop Loss for every position.
Take Profit for every position.
Trailing Stop Loss to protect profits.
Maximum daily loss limit.
Maximum number of positions limit.
Time-based exit (if the position is open for too long).
Risk-based position sizing (optional).
Input Options:
The strategy offers numerous settings that allow users to customize its operation:
Timeframe: The chart's timeframe (e.g., 1 minute, 5 minutes, 1 hour, 4 hours, 1 day, 1 week).
Base Grid Size (%): The base size of the grid, expressed as a percentage.
Max Positions: The maximum number of open positions allowed.
Use Volatility Grid: If enabled, the grid size changes dynamically based on the ATR indicator.
ATR Length: The period of the ATR indicator.
ATR Multiplier: The multiplier for the ATR to fine-tune the grid size.
RSI Length: The period of the RSI indicator.
RSI Overbought: The overbought level for the RSI.
RSI Oversold: The oversold level for the RSI.
Short MA Length: The period of the short moving average.
Long MA Length: The period of the long moving average.
Super Long MA Length: The period of the super long moving average.
MACD Fast Length: The fast period of the MACD.
MACD Slow Length: The slow period of the MACD.
MACD Signal Length: The period of the MACD signal line.
Stop Loss (%): The stop loss level, expressed as a percentage.
Take Profit (%): The take profit level, expressed as a percentage.
Use Trailing Stop: If enabled, the strategy uses a trailing stop loss.
Trailing Stop (%): The trailing stop loss level, expressed as a percentage.
Max Loss Per Day (%): The maximum daily loss, expressed as a percentage.
Time Based Exit: If enabled, the strategy exits the position after a certain amount of time.
Max Holding Period (hours): The maximum holding time in hours.
Use Risk Based Position: If enabled, the strategy calculates position size based on risk.
Risk Per Trade (%): The risk per trade, expressed as a percentage.
Max Leverage: The maximum leverage.
Important Notes:
This strategy does not guarantee profits. Cryptocurrency markets are volatile, and trading involves risk.
The strategy's effectiveness depends on market conditions and settings.
It is recommended to thoroughly backtest the strategy under various market conditions before using it live.
Past performance is not indicative of future results.

Trend Zone Moving Averages📈 Trend Zone Moving Averages
The Trend Zone Moving Averages indicator helps traders quickly identify market trends using the 50SMA, 100SMA, and 200SMA. With dynamic background colors, customizable settings, and real-time alerts, this tool provides a clear view of bullish, bearish, and extreme trend conditions.
🔹 Features:
Trend Zones with Dynamic Background Colors
Green → Bullish Trend (50SMA > 100SMA > 200SMA, price above 50SMA)
Red → Bearish Trend (50SMA < 100SMA < 200SMA, price below 50SMA)
Yellow → Neutral Trend (Mixed signals)
Dark Green → Extreme Bullish (Price above all three SMAs)
Dark Red → Extreme Bearish (Price below all three SMAs)
Customizable Moving Averages
Toggle 50SMA, 100SMA, and 200SMA on/off from the settings.
Perfect for traders who prefer a cleaner chart.
Real-Time Trend Alerts
Get instant notifications when the trend changes:
🟢 Bullish Zone Alert – When price enters a bullish trend.
🔴 Bearish Zone Alert – When price enters a bearish trend.
🟡 Neutral Zone Alert – When trend shifts to neutral.
🌟 Extreme Bullish Alert – When price moves above all SMAs.
⚠️ Extreme Bearish Alert – When price drops below all SMAs.
✅ Perfect for Any Market
Works on stocks, forex, crypto, and commodities.
Adaptable for day traders, swing traders, and investors.
⚙️ How to Use: Trend Zone Moving Averages Strategy
This strategy helps traders identify and trade with the trend using the Trend Zone Moving Averages indicator. It works across stocks, forex, crypto, and commodities.
🟢 Bullish Trend Strategy (Green Background)
Objective: Look for buying opportunities when the market is in an uptrend.
Entry Conditions:
✅ Background is Green (Bullish Zone).
✅ Price is above the 50SMA (confirming strength).
✅ Price pulls back to the 50SMA and bounces OR breaks above a key resistance level.
Stop Loss:
🔹 Place below the most recent swing low or just under the 50SMA.
Take Profit:
🔹 First target at the next resistance level or recent swing high.
🔹 Second target if price continues higher—trail stops to lock in profits.
🔴 Bearish Trend Strategy (Red Background)
Objective: Look for shorting opportunities when the market is in a downtrend.
Entry Conditions:
✅ Background is Red (Bearish Zone).
✅ Price is below the 50SMA (confirming weakness).
✅ Price pulls back to the 50SMA and rejects OR breaks below a key support level.
Stop Loss:
🔹 Place above the most recent swing high or just above the 50SMA.
Take Profit:
🔹 First target at the next support level or recent swing low.
🔹 Second target if price keeps falling—trail stops to secure profits.
🌟 Extreme Trend Strategy (Dark Green / Dark Red Background)
Objective: Trade with momentum when the market is in a strong trend.
Entry Conditions:
✅ Dark Green Background → Extreme Bullish: Price is above all three SMAs (strong uptrend).
✅ Dark Red Background → Extreme Bearish: Price is below all three SMAs (strong downtrend).
Trade Execution:
🔹 For longs (Dark Green): Look for breakout entries above resistance or pullbacks to the 50SMA.
🔹 For shorts (Dark Red): Look for breakdown entries below support or rejections at the 50SMA.
Risk Management:
🔹 Use tighter stop losses and trail profits aggressively to maximize gains.
🟡 Neutral Trend Strategy (Yellow Background)
Objective: Avoid trading or wait for a breakout.
What to Do:
🔹 Avoid trading in this zone—price is indecisive.
🔹 Wait for confirmation (background turns green/red) before taking a trade.
🔹 Use alerts to notify you when the trend resumes.
📌 Final Tips
Use this strategy with price action for extra confirmation.
Combine with support/resistance levels to improve accuracy.
Set alerts for trend changes so you never miss an opportunity.
Enjoy!

Fibonacci-Only Strategy V2Fibonacci-Only Strategy V2
This strategy combines Fibonacci retracement levels with pattern recognition and statistical confirmation to identify high-probability trading opportunities across multiple timeframes.
Core Strategy Components:
Fibonacci Levels: Uses key Fibonacci retracement levels (19% and 82.56%) to identify potential reversal zones
Pattern Recognition: Analyzes recent price patterns to find similar historical formations
Statistical Confirmation: Incorporates statistical analysis to validate entry signals
Risk Management: Includes customizable stop loss (fixed or ATR-based) and trailing stop features
Entry Signals:
Long entries occur when price touches or breaks the 19% Fibonacci level with bullish confirmation
Short entries require Fibonacci level interaction, bearish confirmation, and statistical validation
All signals are visually displayed with color-coded markers and dashboard
Trading Method:
When a triangle signal appears, open a position on the next candle
Alternatively, after seeing a signal on a higher timeframe, you can switch to a lower timeframe to find a more precise entry point
Entry signals are clearly marked with visual indicators for easy identification
Risk Management Features:
Adjustable stop loss (percentage-based or ATR-based)
Optional trailing stops for protecting profits
Multiple take-profit levels for strategic position exit
Customization Options:
Timeframe selection (1m to Daily)
Pattern length and similarity threshold adjustment
Statistical period and weight configuration
Risk parameters including stop loss and trailing stop settings
This strategy is particularly well-suited for cryptocurrency markets due to their tendency to respect Fibonacci levels and technical patterns. Crypto's volatility is effectively managed through the customizable stop-loss and trailing-stop mechanisms, making it an ideal tool for traders in digital asset markets.
For optimal performance, this strategy works best on higher timeframes (30m, 1h and above) and is not recommended for low timeframe scalping. The Fibonacci pattern recognition requires sufficient price movement to generate reliable signals, which is more consistently available in medium to higher timeframes.
Users should avoid trading during sideways market conditions, as the strategy performs best during trending markets with clear directional movement. The statistical confirmation component helps filter out some sideways market signals, but it's recommended to manually avoid ranging markets for best results.

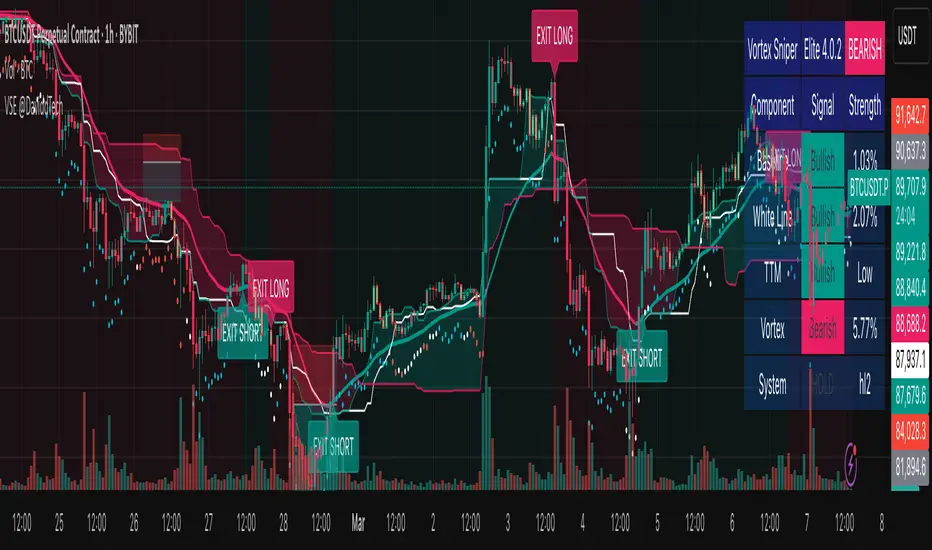
Vortex Sniper Elite @DaviddTechVortex Sniper Elite @DaviddTech
Vortex Sniper Elite @DaviddTech is a comprehensive trading system designed to deliver high-probability trade setups across all market conditions. By seamlessly integrating adaptive baseline detection, squeeze momentum analysis, and advanced vortex filtering, this indicator provides traders with a complete edge-based approach to market analysis.
🔥 Key Features:
Complete Model Integration:
Baseline: Advanced McGinley Dynamic indicator for superior trend detection
Confirmation #1: Enhanced TTM Squeeze for momentum and volatility analysis
Confirmation #2: Dual Tether Line system for dynamic market structure mapping
Volatility Filter: Specialized Vortex indicator for precision entry timing
Adaptive Stop Loss: Proprietary trailing stop system based on ATR calculations
Advanced Visual Dashboard:
Real-time component analysis with strength metrics
Color-coded signal status for immediate trade assessment
Squeeze state monitoring with visual confirmation
Vortex divergence strength percentage for optimal entries
Premium Signal Detection:
Multi-timeframe compatible system for scaling strategies
Automated buy/sell signals at optimal entry points
Clear exit signals for risk management
Squeeze momentum visualization for timing precision
DaviddTech Alpha Edge System:
Gradient transparency algorithm for visual trend strength confirmation
Bar coloring system based on momentum direction
Background highlighting for active signal states
Dashboard for ease of understanding
💰 Trading Applications:
Sniper Entries: Utilize the Vortex confirmation to pinpoint precise entry points
Trend Alignment: McGinley baseline establishes the primary market direction
Volatility Awareness: TTM Squeeze identifies optimal market conditions
Risk Management: Set stops based on the adaptive trailing stop system
Position Management: Monitor dashboard metrics for changing market conditions
Vortex Sniper Elite @DaviddTech represents the culmination of the DaviddTech methodology in one cohesive system. Whether you're a day trader seeking precise entries or a swing trader looking for significant market moves, this indicator delivers the structured approach needed to consistently extract profits from any market condition.
DaviddTech Trading System Explained:
The DaviddTech methodology follows a strict component-based approach:
The Baseline establishes the primary trend direction, acting as your first filter
Confirmation Indicators validate potential trade setups only when aligned with the baseline
The Volatility/Volume Indicator ensures you only enter trades with sufficient directional momentum
A Trailing Stop System provides mathematically optimized exit points
Vortex Sniper Elite integrates all these components into a visually intuitive system that eliminates guesswork and enforces disciplined trading decisions.
Recommended Settings:
This indicator comes pre-configured with optimized parameters, but feel free to adjust based on your timeframe:
For day trading: Reduce Baseline and TTM lengths by 30-40%
For swing trading: Consider increasing Tether and Trail Stop lengths by 25-50%
For scalping: Focus on Vortex confirmation with shorter timeframes
Best Practices:
Wait for all components to align before entering trades
Use the dashboard to evaluate the strength of each signal
Monitor squeeze states for potential volatility expansion
Let the trailing stop system handle your exits
Backtest across multiple timeframes to find your optimal settings
UT Bot Alerts – Time Filtered with ExitsThis indicator combines several technical approaches to generate precise entry and exit signals, while incorporating time filters that ensure signals are sent only during desired time windows and with defined cooldown periods. It is based on the original idea by QuantNomad.
Main Components:
ATR-based Trailing Stop:
Using the Average True Range (ATR) and an adjustable multiplier ("Key Value"), a dynamic trailing stop is calculated that adapts to the current price. This trailing stop forms the basis for the signal generation.
EMA-based Entry Signals:
A very short exponential moving average (EMA, period 1) is used in combination with the trailing stop to identify clear buy (long) and sell (short) signals via crossovers. An additional buffer zone helps reduce false signals.
Persistent Trade State:
The current state (long, short, or neutral) is maintained so that the system remains in the trend until a new signal is generated.
Linear Regression as Reference:
A linear regression line computed over a defined period serves as a reference for determining exit levels.
Exit Signals with Delay:
Exit signals are generated when the price deviates from the linear regression line by a defined percentage (Exit Signal Deviation) and the condition persists for at least a specified number of bars (Exit Signal Delay). Only one exit signal is issued per trade to avoid excessive exits.
Time Filters and Cooldown:
Session Filter: A user-defined session (e.g., "2200-0500") can disable signals during specified periods.
Cooldown Period: After a signal is triggered, a cooldown phase (in minutes) can be set during which no new signals are sent.
Visual Display and Alerts:
Entry Signals: Buy and sell signals are displayed as labels (green for long, red for short).
Exit Signals: Exit signals appear as triangles, with the exit long signal text displayed in white.
Reference Lines:
The upper exit level (Exit Short Level) is drawn as a solid line in turquoise (color.aqua).
The lower exit level (Exit Long Level) is drawn as a solid line in yellow.
Additionally, the ATR trailing stop and the linear regression line are clearly plotted on the chart.
Alerts can be configured for all signal types.
In Summary:
The indicator delivers precise entry signals based on an ATR trailing stop and a short EMA, supplemented by dynamic exit levels determined via linear regression. With integrated time filters (session and cooldown) and a flexible exit mechanism, this indicator offers controlled trade management—ideal for traders who wish to receive signals only during desired time periods.
Original Author: QuantNomad

EMA 5 Alert Candle ShortThe 5 EMA (Exponential Moving Average) Strategy is a simple yet effective trading strategy that helps traders identify short-term trends and potential entry and exit points. This strategy is widely used in intraday and swing trading, particularly in forex, stocks, and crypto markets.
Components of the 5 EMA Strategy
5 EMA: A fast-moving average that reacts quickly to price movements.
15-minute or 1-hour timeframe (commonly used, but adaptable to other timeframes).
Candlestick Patterns: To confirm entry signals.
How the 5 EMA Strategy Works
Buy (Long) Setup:
Price Above the 5 EMA: The price should be trading above the 5 EMA.
Pullback to the 5 EMA: A minor retracement or consolidation near the 5 EMA.
Bullish Candlestick Confirmation: A bullish candle (e.g., engulfing or pin bar) forms near the 5 EMA.
Entry: Enter a long trade at the close of the bullish candle.
Stop Loss: Place below the recent swing low or 5-10 pips below the 5 EMA.
Take Profit: Aim for a risk-reward ratio of at least 1:2 or trail the stop using a higher EMA (e.g., 10 or 20 EMA).
Sell (Short) Setup:
Price Below the 5 EMA: The price should be trading below the 5 EMA.
Pullback to the 5 EMA: A small retracement towards the 5 EMA.
Bearish Candlestick Confirmation: A bearish candle (e.g., engulfing or pin bar) near the 5 EMA.
Entry: Enter a short trade at the close of the bearish candle.
Stop Loss: Place above the recent swing high or 5-10 pips above the 5 EMA.
Take Profit: Aim for a 1:2 risk-reward ratio or use a trailing stop.
Additional Filters for Better Accuracy
Higher Timeframe Confirmation: Check the trend on a higher timeframe (e.g., 1-hour or 4-hour).
Volume Confirmation: Enter trades when volume is increasing.
Avoid Sideways Market: Use the strategy only when the market is trending.
Advantages of the 5 EMA Strategy
✔️ Simple and easy to use.
✔️ Works well in trending markets.
✔️ Helps traders capture short-term momentum.
Disadvantages
❌ Less effective in choppy or sideways markets.
❌ Requires discipline in following stop-loss rules.

SuperTrend AI Oscillator StrategySuperTrend AI Oscillator Strategy
Overview
This strategy is a trend-following approach that combines the SuperTrend indicator with oscillator-based filtering.
By identifying market trends while utilizing oscillator-based momentum analysis, it aims to improve entry precision.
Additionally, it incorporates a trailing stop to strengthen risk management while maximizing profits.
This strategy can be applied to various markets, including Forex, Crypto, and Stocks, as well as different timeframes. However, its effectiveness varies depending on market conditions, so thorough testing is required.
Features
1️⃣ Trend Identification Using SuperTrend
The SuperTrend indicator (a volatility-adjusted trend indicator based on ATR) is used to determine trend direction.
A long entry is considered when SuperTrend turns bullish.
A short entry is considered when SuperTrend turns bearish.
The goal is to capture clear trend reversals and avoid unnecessary trades in ranging markets.
2️⃣ Entry Filtering with an Oscillator
The Super Oscillator is used to filter entry signals.
If the oscillator exceeds 50, it strengthens long entries (indicating strong bullish momentum).
If the oscillator drops below 50, it strengthens short entries (indicating strong bearish momentum).
This filter helps reduce trades in uncertain market conditions and improves entry accuracy.
3️⃣ Risk Management with a Trailing Stop
Instead of a fixed stop loss, a SuperTrend-based trailing stop is implemented.
The stop level adjusts automatically based on market volatility.
This allows profits to run while managing downside risk effectively.
4️⃣ Adjustable Risk-Reward Ratio
The default risk-reward ratio is set at 1:2.
Example: A 1% stop loss corresponds to a 2% take profit target.
The ratio can be customized according to the trader’s risk tolerance.
5️⃣ Clear Trade Signals & Visual Support
Green "BUY" labels indicate long entry signals.
Red "SELL" labels indicate short entry signals.
The Super Oscillator is plotted in a separate subwindow to visually assess trend strength.
A real-time trailing stop is displayed to support exit strategies.
These visual aids make it easier to identify entry and exit points.
Trading Parameters & Considerations
Initial Account Balance: Default is $7,000 (adjustable).
Base Currency: USD
Order Size: 10,000 USD
Pyramiding: 1
Trading Fees: $0.94 per trade
Long Position Margin: 50%
Short Position Margin: 50%
Total Trades (M5 Timeframe): 1,032
Visual Aids for Clarity
This strategy includes clear visual trade signals to enhance decision-making:
Green "BUY" labels for long entries
Red "SELL" labels for short entries
Super Oscillator plotted in a subwindow with a 50 midline
Dynamic trailing stop displayed for real-time trend tracking
These visual aids allow traders to quickly identify trade setups and manage positions with greater confidence.
Summary
The SuperTrend AI Oscillator Strategy is developed based on indicators from Black Cat and LuxAlgo.
By integrating high-precision trend analysis with AI-based oscillator filtering, it provides a strong risk-managed trading approach.
Important Notes
This strategy does not guarantee profits—performance varies based on market conditions.
Past performance does not guarantee future results. Markets are constantly changing.
Always test extensively with backtesting and demo trading before using it in live markets.
Risk management, position sizing, and market conditions should always be considered when trading.
Conclusion
This strategy combines trend analysis with momentum filtering, enhancing risk management in trading.
By following market trends carefully, making precise entries, and using trailing stops, it seeks to reduce risk while maximizing potential profits.
Before using this strategy, be sure to test it thoroughly via backtesting and demo trading, and adjust the settings to match your trading style.

[3Commas] HA & MAHA & MA
🔷What it does: This tool is designed to test a trend-following strategy using Heikin Ashi candles and moving averages. It enters trades after pullbacks, aiming to let profits run once the risk-to-reward ratio reaches 1:1 while securing the position.
🔷Who is it for: It is ideal for traders looking to compare final results using fixed versus dynamic take profits by adjusting parameters and trade direction—a concept applicable to most trading strategies.
🔷How does it work: We use moving averages to define the market trend, then wait for opposite Heikin Ashi candles to form against it. Once these candles reverse in favor of the trend, we enter the trade, using the last swing created by the pullback as the stop loss. By applying the breakeven ratio, we protect the trade and let it run, using the slower moving average as a trailing stop.
A buy signal is generated when:
The previous candle is bearish (ha_bear ), indicating a pullback.
The fast moving average (ma1) is above the slow moving average (ma2), confirming an uptrend.
The current candle is bullish (ha_bull), showing trend continuation.
The Heikin Ashi close is above the fast moving average (ma1), reinforcing the bullish bias.
The real price close is above the open (close > open), ensuring bullish momentum in actual price data.
The signal is confirmed on the closed candle (barstate.isconfirmed) to avoid premature signals.
dir is undefined (na(dir)), preventing repeated signals in the same direction.
A sell signal is generated when:
The previous candle is bullish (ha_bull ), indicating a temporary upward move before a potential reversal.
The fast moving average (ma1) is below the slow moving average (ma2), confirming a downtrend.
The current candle is bearish (ha_bear), showing trend continuation to the downside.
The Heikin Ashi close is below the fast moving average (ma1), reinforcing bearish pressure.
The real price close is below the open (close < open), confirming bearish momentum in actual price data.
The signal is confirmed after the candle closes (barstate.isconfirmed), avoiding premature entries.
dir is undefined (na(dir)), preventing consecutive signals in the same direction.
In simple terms, this setup looks for trend continuation after a pullback, confirming entries with both Heikin Ashi and real price action, supported by moving average alignment to avoid false signals.
If the price reaches a 1:1 risk-to-reward ratio, the stop will be moved to the entry point. However, if the slow moving average surpasses this level, it will become the new exit point, acting as a trailing stop
🔷Why It’s Unique
Easily visualizes the benefits of using risk-to-reward ratios when trading instead of fixed percentages.
Provides a simple and straightforward approach to trading, embracing the "keep it simple" concept.
Offers clear visualization of DCA Bot entry and exit points based on user preferences.
Includes an option to review the message format before sending signals to bots, with compatibility for multi-pair and futures contract pairs.
🔷 Considerations Before Using the Indicator
⚠️Very important: The indicator must be used on charts with real price data, such as Japanese candlesticks, line charts, etc. Do not use it on Heikin Ashi charts, as this may lead to unrealistic results.
🔸Since this is a trend-following strategy, use it on timeframes above 4 hours, where market noise is reduced and trends are clearer. Also, carefully review the statistics before using it, focusing on pairs that tend to have long periods of well-defined trends.
🔸Disadvantages:
False Signals in Ranges: Consolidating markets can generate unreliable signals.
Lagging Indicator: Being based on moving averages, it may react late to sudden price movements.
🔸Advantages:
Trend Focused: Simplifies the identification of trending markets.
Noise Reduction: Uses Heikin Ashi candles to identify trend continuation after pullbacks.
Broad Applicability: Suitable for forex, crypto, stocks, and commodities.
🔸The strategy provides a systematic way to analyze markets but does not guarantee successful outcomes. Use it as an additional tool rather than relying solely on an automated system.
Trading results depend on various factors, including market conditions, trader discipline, and risk management. Past performance does not ensure future success, so always approach the market cautiously.
🔸Risk Management: Define stop-loss levels, position sizes, and profit targets before entering any trade. Be prepared for potential losses and ensure your approach aligns with your overall trading plan.
🔷 STRATEGY PROPERTIES
Symbol: BINANCE:BTCUSDT (Spot).
Timeframe: 4h.
Test Period: All historical data available.
Initial Capital: 10000 USDT.
Order Size per Trade: 1% of Capital, you can use a higher value e.g. 5%, be cautious that the Max Drawdown does not exceed 10%, as it would indicate a very risky trading approach.
Commission: Binance commission 0.1%, adjust according to the exchange being used, lower numbers will generate unrealistic results. By using low values e.g. 5%, it allows us to adapt over time and check the functioning of the strategy.
Slippage: 5 ticks, for pairs with low liquidity or very large orders, this number should be increased as the order may not be filled at the desired level.
Margin for Long and Short Positions: 100%.
Indicator Settings: Default Configuration.
MA1 Length: 9.
MA2 Length: 18.
MA Calculations: EMA.
Take Profit Ratio: Disable. Ratio 1:4.
Breakeven Ratio: Enable, Ratio 1:1.
Strategy: Long & Short.
🔷 STRATEGY RESULTS
⚠️Remember, past results do not guarantee future performance.
Net Profit: +324.88 USDT (+3.25%).
Max Drawdown: -81.18 USDT (-0.78%).
Total Closed Trades: 672.
Percent Profitable: 35.57%.
Profit Factor: 1.347.
Average Trade: +0.48 USDT (+0.48%).
Average # Bars in Trades: 13.
🔷 HOW TO USE
🔸 Adjust Settings:
The default values—MA1 (9) and MA2 (18) with EMA calculation—generally work well. However, you can increase these values, such as 20 and 40, to better identify stronger trends.
🔸 Choose a Symbol that Typically Trends:
Select an asset that tends to form clear trends. Keep in mind that the Strategy Tester results may show poor performance for certain assets, making them less suitable for sending signals to bots.
🔸 Experiment with Ratios:
Test different take profit and breakeven ratios to compare various scenarios—especially to observe how the strategy performs when only the trade is protected.
🔸This is an example of how protecting the trade works: once the price moves in favor of the position with a 1:1 risk-to-reward ratio, the stop loss is moved to the entry price. If the Slow MA surpasses this level, it will act as a trailing stop, aiming to follow the trend and maximize potential gains.
🔸In contrast, in this example, for the same trade, if we set a take profit at a 1:3 risk-to-reward ratio—which is generally considered a good risk-reward relationship—we can see how a significant portion of the upward move is left on the table.
🔸Results Review:
It is important to check the Max Drawdown. This value should ideally not exceed 10% of your capital. Consider adjusting the trade size to ensure this threshold is not surpassed.
Remember to include the correct values for commission and slippage according to the symbol and exchange where you are conducting the tests. Otherwise, the results will not be realistic.
If you are satisfied with the results, you may consider automating your trades. However, it is strongly recommended to use a small amount of capital or a demo account to test proper execution before committing real funds.
🔸Create alerts to trigger the DCA Bot:
Verify Messages: Ensure the message matches the one specified by the DCA Bot.
Multi-Pair Configuration: For multi-pair setups, enable the option to add the symbol in the correct format.
Signal Settings: Enable whether you want to receive long or short signals (Entry | TP | SL), copy and paste the the messages for the DCA Bots configured.
Alert Setup:
When creating an alert, set the condition to the indicator and choose "alert() function call only.
Enter any desired Alert Name.
Open the Notifications tab, enable Webhook URL, and paste the Webhook URL.
For more details, refer to the section: "How to use TradingView Custom Signals".
Finalize Alerts: Click Create, you're done! Alerts will now be sent automatically in the correct format.
🔷 INDICATOR SETTINGS
MA 1: Fast MA Length
MA 2: Slow MA Length
MA Calc: MA's Calculations (SMA,EMA, RMA,WMA)
TP Ratio: This is the take profit ratio relative to the stop loss, where the trade will be closed in profit.
BE Ratio: This is the breakeven ratio relative to the stop loss, where the stop loss will be updated to breakeven or if the MA2 is greater than this level.
Strategy: Order Type direction in which trades are executed.
Use Custom Test Period: When enabled signals only works in the selected time window. If disabled it will use all historical data available on the chart.
Test Start and End: Once the Custom Test Period is enabled, here you select the start and end date that you want to analyze.
Check Messages: Enable the table to review the messages to be sent to the bot.
Entry | TP | SL: Enable this options to send Buy Entry, Take Profit (TP), and Stop Loss (SL) signals.
Deal Entry and Deal Exit : Copy and paste the message for the deal start signal and close order at Market Price of the DCA Bot. This is the message that will be sent with the alert to the Bot, you must verify that it is the same as the bot so that it can process properly so that it executes and starts the trade.
DCA Bot Multi-Pair: You must activate it if you want to use the signals in a DCA Bot Multi-pair in the text box you must enter (using the correct format) the symbol in which you are creating the alert, you can check the format of each symbol when you create the bot.
👨🏻💻💭 We hope this tool helps enhance your trading. Your feedback is invaluable, so feel free to share any suggestions for improvements or new features you'd like to see implemented.
__
The information and publications within the 3Commas TradingView account are not meant to be and do not constitute financial, investment, trading, or other types of advice or recommendations supplied or endorsed by 3Commas and any of the parties acting on behalf of 3Commas, including its employees, contractors, ambassadors, etc.

JMA Quantum Edge: Adaptive Precision Trading System JMA Quantum Edge: Adaptive Precision Trading System - Enhanced Visuals & Risk Management
Get ready to experience a groundbreaking trading strategy that adapts in real-time to market conditions! This powerful, open-source script combines advanced technical analysis with state-of-the-art risk management tools, designed to give you the edge you need in today's dynamic markets.
What It Does:
Adaptive JMA Indicator:
Utilizes a custom Jurik Moving Average (JMA) that adjusts its sensitivity based on market volatility, ensuring you get precise signals even in the most fluctuating environments.
Dynamic Risk Management:
Features built-in support for partial exits (scaling out) to secure profits, along with an optional Kelly Criterion-based position sizing that tailors your exposure based on historical performance metrics.
Robust Error Handling:
Incorporates market condition filters—like minimum volume and maximum allowed gap percentage—to ensure trades are only executed under favorable conditions.
Vivid Visual Enhancements:
Enjoy an animated background that reflects market momentum, dynamic pivot markers, and clearly drawn trend channels. Plus, interactive tables provide real-time performance analytics and detailed error metrics.
Fully Customizable:
With a comprehensive set of inputs, you can easily tailor the strategy to your personal trading style and market preferences. Adjust everything from JMA parameters to refresh intervals for tables and labels!
How to Use It:
Add the Script:
Copy and paste the script into the Pine Script Editor on TradingView and click “Add to Chart.”
Configure Your Settings:
Customize your risk management (capital, commission, position sizing, partial exits, etc.) and tweak the JMA settings to match your preferred trading style. Use the extensive input panel to adjust visuals, alerts, and more.
Backtest & Optimize:
Run the strategy in the Strategy Tester to analyze its historical performance. Monitor real-time analytics and error metrics via the interactive tables, and fine-tune your parameters for optimal performance.
Go Live with Confidence:
Once you're satisfied with the backtest results, use the generated signals for live trading, and let the system help you stay ahead in fast-paced markets!
How to use the imputs:
This cutting-edge strategy is designed to adapt to changing market conditions and offers you complete control over your trading parameters. Here’s a breakdown of what each group of inputs does and how you should use them:
Risk Management & Trade Settings
Recalculate on Every Tick:
What it does: When enabled, the strategy recalculates on every price update.
Recommendation: Leave it true for fast charts.
Initial Capital:
What it does: Sets your starting capital for backtesting, which influences position sizing and performance metrics.
Recommendation: Start with $10,000 (or adjust according to your trading capital).
Commission (%):
What it does: Simulates the cost per trade.
Recommendation: Use a realistic rate (e.g., 0.04%).
Position Size & Quantity Type:
What they do: Define how large each trade will be. Choose between a fixed unit amount or a percentage of equity.
Recommendation: For beginners, the default fixed value is a good start. Experiment later with percentage-based sizing if needed.
Order Comment:
What it does: Adds a label to your orders for easier tracking.
Allow Reverse Orders:
What it does: If disabled, the strategy will close opposing positions before entering a new trade, reducing conflicts.
Enable Dynamic Position Sizing:
What it does: Adjusts trade size based on current volatility.
Recommendation: Beginners may start with this disabled until they understand basic sizing.
Partial Exit Inputs:
What they do:
Enable Partial Exits: When turned on, you can scale out of your position to lock in profits.
Partial Exit Profit (%): The profit percentage that triggers a partial exit.
Partial Exit Percentage: The percentage of your current position to exit. Recommendation: Use defaults (e.g., 5% profit, 50% exit) to secure profits gradually.
Kelly Criterion Option:
What it does: When enabled, adjusts your position sizing using historical performance (win rate and profit factor).
Recommendation: Beginners might leave this disabled until comfortable with backtest performance metrics.
Market Condition Filters:
What they do:
Minimum Volume: Ensures trades occur only when there’s sufficient market activity.
Maximum Gap (%): Prevents trading if there’s an unusually large gap between the previous close and current open. Recommendation: Defaults work well for most markets. If trades seem erratic, consider tightening these limits.
JMA Settings
Price Source:
What it does: The input series for the JMA calculation, typically set to the closing price.
JMA Length:
What it does: Controls the smoothing period of the JMA. Lower values are more sensitive; higher values smooth out the noise. Recommendation: Start with 21.
JMA Phase & Power:
What they do: Adjust how responsive the JMA is. Phase controls timing; power adjusts the intensity. Recommendation: Default settings (63 phase and 3 power) are a balanced starting point.
Visual Settings & Style
Show JMA Line, Pivot Lines, and Pivot Labels:
What they do: Toggle visual elements on your chart for easier signal identification.
Pivot History Count:
What it does: Limits how many historical pivot markers are displayed.
Color Settings (Up/Down Neon Colors):
What they do: Set the visual cues for buy and sell signals.
Pivot Marker & Line Style:
What they do: Choose the style and thickness of your pivot markers and lines.
Show Stats Panel:
What it does: Displays real-time performance and error metrics.
Dynamic Background & Visual Enhancements
Animate Background:
What it does: Changes the background color based on market momentum.
Show Trend Channels & Volume Zones:
What they do: Draw trend channels and highlight areas of high volatility/volume.
Show Data-Rich Labels:
What it does: Displays key metrics like volume, error percentage, and momentum on the chart.
High Volatility Threshold:
What it does: Determines the multiplier for when the chart background should change due to high volatility.
Multi-Timeframe Settings
Higher Timeframe:
What it does: Uses a higher timeframe’s JMA for trend confirmation. Recommendation: Use Daily ('D') or Weekly ('W') for broader trend analysis.
Show HTF Trend Zone & Opacity:
What they do: Display a visual zone from the higher timeframe to help confirm trends.
6. Trailing Stop Settings
Trailing Stop ATR Factor & Offset Multiplier:
What they do: Calculate trailing stops based on the Average True Range (ATR), adjusting stop distances dynamically. Recommendation: Default settings are a good balance but can be fine-tuned based on asset volatility.
Alerts & Notifications
Alerts on Pivot Formation & JMA Crossover:
What they do: Notify you when key events occur.
Dynamic Power Threshold:
What it does: Sets the sensitivity for dynamic alerts.
8. Static Stop Loss / Take Profit
Static Stop Loss (%) & Take Profit (%):
What they do: Allow you to set fixed stop loss or take profit levels. Recommendation: Leave them at 0 to disable if you prefer dynamic risk management, or set them if you have strict risk/reward preferences.
Advanced Settings
ATR Length:
What it does: Determines the period for ATR calculation, impacting trailing stop sensitivity. Recommendation: Start with 14.
Optimization Feedback & Enhanced Error Analysis
Error Metric Length & Error Threshold (%):
What they do: Calculate error metrics (like average error, skewness, and kurtosis) to help you fine-tune the JMA. Recommendation: Use the defaults and adjust if the error metrics seem off during backtesting.
UI - User-Driven Tweaking & Table Customization
Parameter Tweaker Panel, Debug/Performance Table Settings:
What they do: Provide interactive tables that display real-time performance, error metrics, and allow you to monitor strategy parameters.
Refresh Frequency Options (Table & Label Refresh Intervals):
What they do: Set how often the tables and labels update.
Recommendation: Start with an interval of 1 bar; increase it if your chart is too busy.
Important for Beginners:
Default Settings:
All default values have been chosen for balanced performance across different markets. If you ever experience unexpected behavior, start by resetting the inputs to their defaults.
Step-by-Step Adjustments:
Experiment by changing one setting at a time while observing how the strategy’s signals and performance metrics change. This will help you understand the impact of each parameter.
Resetting to Defaults:
If things seem off or you’re not getting the expected results, you can always reset the indicator. Either reload the script or use the “Reset Inputs” option (if available) to revert to the default settings.
Jump in, experiment, and enjoy the power of adaptive precision trading. This strategy is built to grow with your skills—have fun exploring and refining your trading edge!
Happy trading!

MTF Signal XpertMTF Signal Xpert – Detailed Description
Overview:
MTF Signal Xpert is a proprietary, open‑source trading signal indicator that fuses multiple technical analysis methods into one cohesive strategy. Developed after rigorous backtesting and extensive research, this advanced tool is designed to deliver clear BUY and SELL signals by analyzing trend, momentum, and volatility across various timeframes. Its integrated approach not only enhances signal reliability but also incorporates dynamic risk management, helping traders protect their capital while navigating complex market conditions.
Detailed Explanation of How It Works:
Trend Detection via Moving Averages
Dual Moving Averages:
MTF Signal Xpert computes two moving averages—a fast MA and a slow MA—with the flexibility to choose from Simple (SMA), Exponential (EMA), or Hull (HMA) methods. This dual-MA system helps identify the prevailing market trend by contrasting short-term momentum with longer-term trends.
Crossover Logic:
A BUY signal is initiated when the fast MA crosses above the slow MA, coupled with the condition that the current price is above the lower Bollinger Band. This suggests that the market may be emerging from a lower price region. Conversely, a SELL signal is generated when the fast MA crosses below the slow MA and the price is below the upper Bollinger Band, indicating potential bearish pressure.
Recent Crossover Confirmation:
To ensure that signals reflect current market dynamics, the script tracks the number of bars since the moving average crossover event. Only crossovers that occur within a user-defined “candle confirmation” period are considered, which helps filter out outdated signals and improves overall signal accuracy.
Volatility and Price Extremes with Bollinger Bands
Calculation of Bands:
Bollinger Bands are calculated using a 20‑period simple moving average as the central basis, with the upper and lower bands derived from a standard deviation multiplier. This creates dynamic boundaries that adjust according to recent market volatility.
Signal Reinforcement:
For BUY signals, the condition that the price is above the lower Bollinger Band suggests an undervalued market condition, while for SELL signals, the price falling below the upper Bollinger Band reinforces the bearish bias. This volatility context adds depth to the moving average crossover signals.
Momentum Confirmation Using Multiple Oscillators
RSI (Relative Strength Index):
The RSI is computed over 14 periods to determine if the market is in an overbought or oversold state. Only readings within an optimal range (defined by user inputs) validate the signal, ensuring that entries are made during balanced conditions.
MACD (Moving Average Convergence Divergence):
The MACD line is compared with its signal line to assess momentum. A bullish scenario is confirmed when the MACD line is above the signal line, while a bearish scenario is indicated when it is below, thus adding another layer of confirmation.
Awesome Oscillator (AO):
The AO measures the difference between short-term and long-term simple moving averages of the median price. Positive AO values support BUY signals, while negative values back SELL signals, offering additional momentum insight.
ADX (Average Directional Index):
The ADX quantifies trend strength. MTF Signal Xpert only considers signals when the ADX value exceeds a specified threshold, ensuring that trades are taken in strongly trending markets.
Optional Stochastic Oscillator:
An optional stochastic oscillator filter can be enabled to further refine signals. It checks for overbought conditions (supporting SELL signals) or oversold conditions (supporting BUY signals), thus reducing ambiguity.
Multi-Timeframe Verification
Higher Timeframe Filter:
To align short-term signals with broader market trends, the script calculates an EMA on a higher timeframe as specified by the user. This multi-timeframe approach helps ensure that signals on the primary chart are consistent with the overall trend, thereby reducing false signals.
Dynamic Risk Management with ATR
ATR-Based Calculations:
The Average True Range (ATR) is used to measure current market volatility. This value is multiplied by a user-defined factor to dynamically determine stop loss (SL) and take profit (TP) levels, adapting to changing market conditions.
Visual SL/TP Markers:
The calculated SL and TP levels are plotted on the chart as distinct colored dots, enabling traders to quickly identify recommended exit points.
Optional Trailing Stop:
An optional trailing stop feature is available, which adjusts the stop loss as the trade moves favorably, helping to lock in profits while protecting against sudden reversals.
Risk/Reward Ratio Calculation:
MTF Signal Xpert computes a risk/reward ratio based on the dynamic SL and TP levels. This quantitative measure allows traders to assess whether the potential reward justifies the risk associated with a trade.
Condition Weighting and Signal Scoring
Binary Condition Checks:
Each technical condition—ranging from moving average crossovers, Bollinger Band positioning, and RSI range to MACD, AO, ADX, and volume filters—is assigned a binary score (1 if met, 0 if not).
Cumulative Scoring:
These individual scores are summed to generate cumulative bullish and bearish scores, quantifying the overall strength of the signal and providing traders with an objective measure of its viability.
Detailed Signal Explanation:
A comprehensive explanation string is generated, outlining which conditions contributed to the current BUY or SELL signal. This explanation is displayed on an on‑chart dashboard, offering transparency and clarity into the signal generation process.
On-Chart Visualizations and Debug Information
Chart Elements:
The indicator plots all key components—moving averages, Bollinger Bands, SL and TP markers—directly on the chart, providing a clear visual framework for understanding market conditions.
Combined Dashboard:
A dedicated dashboard displays key metrics such as RSI, ADX, and the bullish/bearish scores, alongside a detailed explanation of the current signal. This consolidated view allows traders to quickly grasp the underlying logic.
Debug Table (Optional):
For advanced users, an optional debug table is available. This table breaks down each individual condition, indicating which criteria were met or not met, thus aiding in further analysis and strategy refinement.
Mashup Justification and Originality
MTF Signal Xpert is more than just an aggregation of existing indicators—it is an original synthesis designed to address real-world trading complexities. Here’s how its components work together:
Integrated Trend, Volatility, and Momentum Analysis:
By combining moving averages, Bollinger Bands, and multiple oscillators (RSI, MACD, AO, ADX, and an optional stochastic), the indicator captures diverse market dynamics. Each component reinforces the others, reducing noise and filtering out false signals.
Multi-Timeframe Analysis:
The inclusion of a higher timeframe filter aligns short-term signals with longer-term trends, enhancing overall reliability and reducing the potential for contradictory signals.
Adaptive Risk Management:
Dynamic stop loss and take profit levels, determined using ATR, ensure that the risk management strategy adapts to current market conditions. The optional trailing stop further refines this approach, protecting profits as the market evolves.
Quantitative Signal Scoring:
The condition weighting system provides an objective measure of signal strength, giving traders clear insight into how each technical component contributes to the final decision.
How to Use MTF Signal Xpert:
Input Customization:
Adjust the moving average type and period settings, ATR multipliers, and oscillator thresholds to align with your trading style and the specific market conditions.
Enable or disable the optional stochastic oscillator and trailing stop based on your preference.
Interpreting the Signals:
When a BUY or SELL signal appears, refer to the on‑chart dashboard, which displays key metrics (e.g., RSI, ADX, bullish/bearish scores) along with a detailed breakdown of the conditions that triggered the signal.
Review the SL and TP markers on the chart to understand the associated risk/reward setup.
Risk Management:
Use the dynamically calculated stop loss and take profit levels as guidelines for setting your exit points.
Evaluate the provided risk/reward ratio to ensure that the potential reward justifies the risk before entering a trade.
Debugging and Verification:
Advanced users can enable the debug table to see a condition-by-condition breakdown of the signal generation process, helping refine the strategy and deepen understanding of market dynamics.
Disclaimer:
MTF Signal Xpert is intended for educational and analytical purposes only. Although it is based on robust technical analysis methods and has undergone extensive backtesting, past performance is not indicative of future results. Traders should employ proper risk management and adjust the settings to suit their financial circumstances and risk tolerance.
MTF Signal Xpert represents a comprehensive, original approach to trading signal generation. By blending trend detection, volatility assessment, momentum analysis, multi-timeframe alignment, and adaptive risk management into one integrated system, it provides traders with actionable signals and the transparency needed to understand the logic behind them.

Quantitative Breakout Bands (AIBitcoinTrend)Quantitative Breakout Bands (AIBitcoinTrend) is an advanced indicator designed to adapt to dynamic market conditions by utilizing a Kalman filter for real-time data analysis and trend detection. This innovative tool empowers traders to identify price breakouts, evaluate trends, and refine their trading strategies with precision.
👽 What Are Quantitative Breakout Bands, and Why Are They Unique?
Quantitative Breakout Bands combine advanced filtering techniques (Kalman Filters) with statistical measures such as mean absolute error (MAE) to create adaptive price bands. These bands adjust to market conditions dynamically, providing insights into volatility, trend strength, and breakout opportunities.
What sets this indicator apart is its ability to incorporate both position (price) and velocity (rate of price change) into its calculations, making it highly responsive yet smooth. This dual consideration ensures traders get reliable signals without excessive lag or noise.
👽 The Math Behind the Indicator
👾 Kalman Filter Estimation:
At the core of the indicator is the Kalman Filter, a recursive algorithm used to predict the next state of a system based on past observations. It incorporates two primary elements:
State Prediction: The indicator predicts future price (position) and velocity based on previous values.
Error Covariance Adjustment: The process and measurement noise parameters refine the prediction's accuracy by balancing smoothness and responsiveness.
👾 Breakout Bands Calculation:
The breakout bands are derived from the mean absolute error (MAE) of price deviations relative to the filtered trendline:
float upperBand = kalmanPrice + bandMultiplier * mae
float lowerBand = kalmanPrice - bandMultiplier * mae
The multiplier allows traders to adjust the sensitivity of the bands to market volatility.
👾 Slope-Based Trend Detection:
A weighted slope calculation measures the gradient of the filtered price over a configurable window. This slope determines whether the market is trending bullish, bearish, or neutral.
👾 Trailing Stop Mechanism:
The trailing stop employs the Average True Range (ATR) to calculate dynamic stop levels. This ensures positions are protected during volatile moves while minimizing premature exits.
👽 How It Adapts to Price Movements
Dynamic Noise Calibration: By adjusting process and measurement noise inputs, the indicator balances smoothness (to reduce noise) with responsiveness (to adapt to sharp price changes).
Trend Responsiveness: The Kalman Filter ensures that trend changes are quickly identified, while the slope calculation adds confirmation.
Volatility Sensitivity: The MAE-based bands expand and contract in response to changes in market volatility, making them ideal for breakout detection.
👽 How Traders Can Use the Indicator
👾 Breakout Detection:
Bullish Breakouts: When the price moves above the upper band, it signals a potential upward breakout.
Bearish Breakouts: When the price moves below the lower band, it signals a potential downward breakout.
The trailing stop feature offers a dynamic way to lock in profits or minimize losses during trending moves.
👾 Trend Confirmation:
The color-coded Kalman line and slope provide visual cues:
Bullish Trend: Positive slope, green line.
Bearish Trend: Negative slope, red line.
👽 Why It’s Useful for Traders
Dynamic and Adaptive: The indicator adjusts to changing market conditions, ensuring relevance across timeframes and asset classes.
Noise Reduction: The Kalman Filter smooths price data, eliminating false signals caused by short-term noise.
Comprehensive Insights: By combining breakout detection, trend analysis, and risk management, it offers a holistic trading tool.
👽 Indicator Settings
Process Noise (Position & Velocity): Adjusts filter responsiveness to price changes.
Measurement Noise: Defines expected price noise for smoother trend detection.
Slope Window: Configures the lookback for slope calculation.
Lookback Period for MAE: Defines the sensitivity of the bands to volatility.
Band Multiplier: Controls the band width.
ATR Multiplier: Adjusts the sensitivity of the trailing stop.
Line Width: Customizes the appearance of the trailing stop line.
Disclaimer: This indicator is designed for educational purposes and does not constitute financial advice. Please consult a qualified financial advisor before making investment decisions.
