Foresight Cone (HoltxF1xVWAP) [KedArc Quant]Description:
This is a time-series forecasting indicator that estimates the next bar (F1) and projects a path a few bars ahead. It also draws a confidence cone based on how accurate the recent forecasts have been. You can optionally color the projection only when price agrees with VWAP.
Why it’s different
* One clear model: Everything comes from Holt’s trend-aware forecasting method—no mix of unrelated indicators.
* Transparent visuals: You see the next-bar estimate (F1), the forward projection, and a cone that widens or narrows based on recent forecast error.
* Context, not signals: The VWAP option only changes colors. It doesn’t add trade rules.
* No look-ahead: Accuracy is measured using the forecast made on the previous bar versus the current bar.
Inputs (what they mean)
* Source: Price series to forecast (default: Close).
* Preset: Quick profiles for fast, smooth, or momentum markets (see below).
* Alpha (Level): How fast the model reacts to new prices. Higher = faster, twitchier.
* Beta (Trend): How fast the model updates the slope. Higher = faster pivots, more flips in chop.
* Horizon: How many bars ahead to project. Bigger = wider cone.
* Residual Window: How many bars to judge recent accuracy. Bigger = steadier cone.
* Confidence Z: How wide the cone should be (typical setting ≈ “95% style” width).
* Show Bands / Draw Forward Path: Turn the cone and forward lines on/off.
* Color only when aligned with VWAP: Highlights projections only when price agrees with the trend side of VWAP.
* Colors / Show Panel: Styling plus a small panel with RMSE, MAPE, and trend slope.
Presets (when to pick which)
* Scalp / Fast (1-min): Very responsive; best for quick moves. More twitch in chop.
* Smooth Intraday (1–5 min): Calmer and steadier; a good default most days.
* Momentum / Breakout: Quicker slope tracking during strong pushes; may over-react in ranges.
* Custom: Set your own values if you know exactly what you want.
What is F1 here?
F1 is the model’s next-bar fair value. Crosses of price versus F1 can hint at short-term momentum shifts or mean-reversion, especially when viewed with VWAP or the cone.
How this helps
* Gives a baseline path of where price may drift and a cone that shows normal wiggle room.
* Helps you tell routine noise (inside cone) from information (edges or breaks outside the cone).
* Keeps you aware of short-term bias via the trend slope and F1.
How to use (step by step)
1. Add to chart → choose a Preset (start with Smooth Intraday).
2. Set Horizon around 8–15 bars for intraday.
3. (Optional) Turn on VWAP alignment to color only when price agrees with the trend side of VWAP.
4. Watch where price sits relative to the cone and F1:
* Inside = normal noise.
* At edges = stretched.
* Outside = possible regime change.
5. Check the panel: if RMSE/MAPE spike, expect a wider cone; consider a smoother preset or a higher timeframe.
6. Tweak Alpha/Beta only if needed: faster for momentum, slower for chop.
7. Combine with your own plan for entries, exits, and risk.
Accuracy Panel — what it tells you
Preset & Horizon: Shows which preset you’re using and how many bars ahead the projection goes. Longer horizons mean more uncertainty.
RMSE (error in price units): A “typical miss” measured in the chart’s currency (e.g., ₹).
Lower = tighter fit and a usually narrower cone. Rising = conditions getting noisier; the cone will widen.
MAPE (error in %): The same idea as RMSE but in percent.
Good for comparing different symbols or timeframes. Sudden spikes often hint at a regime change.
Slope T: The model’s short-term trend reading.
Positive = gentle up-bias; negative = gentle down-bias; near zero = mostly flat/drifty.
How to read it at a glance
Calm & directional: RMSE/MAPE steady or falling + Slope T positive (or negative) → trends tend to respect the cone’s mid/upper (or mid/lower) area.
Choppy/uncertain: RMSE/MAPE climbing or jumping → expect more whipsaw; rely more on the cone edges and higher-TF context.
Flat tape: Slope T near zero → mean-revert behavior is common; treat cone edges as stretch zones rather than breakout zones.
Warm-up & tweaks
Warm-up: Right after adding the indicator, the panel may be blank for a short time while it gathers enough bars.
Too twitchy? Switch to Smooth Intraday or increase the Residual Window.
Too slow? Use Scalp/Fast or Momentum/Breakout to react quicker.
Timeframe tips
* 1–3 min: Scalp/Fast or Momentum/Breakout; horizon \~8–12.
* 5–15 min: Smooth Intraday; horizon \~12–15.
* 30–60 min+: Consider a larger residual window for a steadier cone.
FAQ
Q: Is this a strategy or an indicator?
A: It’s an indicator only. It does not place orders, TP/SL, or run backtests.
Q: Does it repaint?
A: The next-bar estimate (F1) and the cone are calculated using only information available at that time. The forward path is a projection drawn on the last bar and will naturally update as new bars arrive. Historical bars aren’t revised with future data.
Q: What is F1?
A: F1 is the indicator’s best guess for the next bar.
Price crossing above/below F1 can hint at short-term momentum shifts or mean-reversion.
Q: What do “Alpha” and “Beta” do?
A: Alpha controls how fast the indicator reacts to new prices
(higher = faster, twitchier). Beta controls how fast the slope updates (higher = quicker pivots, more flips in chop).
Q: Why does the cone width change?
A: It reflects recent forecast accuracy. When the market gets noisy, the cone widens. When the tape is calm, it narrows.
Q: What does the Accuracy Panel tell me?
A:
* Preset & Horizon you’re using.
* RMSE: typical forecast miss in price units.
* MAPE: typical forecast miss in percent.
* Slope T: short-term trend reading (up, down, or flat).
If RMSE/MAPE rise, expect a wider cone and more whipsaw.
Q: The panel shows “…” or looks empty. Why?
A: It needs a short warm-up to gather enough bars. This is normal after you add the indicator or change settings/timeframes.
Q: Which timeframe is best?
A:
* 1–3 min: Scalp/Fast or Momentum/Breakout, horizon \~8–12.
* 5–15 min: Smooth Intraday, horizon \~12–15.
Higher timeframes work too; consider a larger residual window for steadier cones.
Q: Which preset should I start with?
A: Start with Smooth Intraday. If the market is trending hard, try Momentum/Breakout.
For very quick tapes, use Scalp/Fast. Switch back if things get choppy.
Q: What does the VWAP option do?
A: It only changes colors (highlights when price agrees with the trend side of VWAP).
It does not add or remove signals.
Q: Are there alerts?
A: Yes—alerts for price crossing F1 (up/down). Use “Once per bar close” to reduce noise on fast charts.
Q: Can I use this on stocks, futures, crypto, or FX?
A: Yes. It works on any symbol/timeframe. You may want to adjust Horizon and the Residual Window based on volatility.
Q: Can I use it with Heikin Ashi or other non-standard bars?
A: You can, but remember you’re forecasting the synthetic series of those bars. For pure price behavior, use regular candles.
Q: The cone feels too wide/too narrow. What do I change?
A:
* Too wide: lower Alpha/Beta a bit or increase the Residual Window.
* Too narrow (misses moves): raise Alpha/Beta slightly or try Momentum/Breakout.
Q: Why do results change when I switch timeframe or symbol?
A: Different noise levels and trends. The accuracy stats reset per chart, so the cone adapts to each context.
Q: Any limits or gotchas?
A: Extremely large Horizon may hit TradingView’s line-object limits; reduce Horizon or turn
off extra visuals if needed. Big gaps or news spikes will widen errors—expect the cone to react.
Q: Can this predict exact future prices?
A: No. It provides a baseline path and context. Always combine with your own rules and risk management.
Glossary
* TS (Time Series): Data over time (prices).
* Holt’s Method: A forecasting approach that tracks a current level and a trend to predict the next bars.
* F1: The indicator’s best guess for the next bar.
* F(h): The projected value h bars ahead.
* VWAP: Volume-Weighted Average Price—used here for optional color alignment.
* RMSE: Typical forecast miss in price units (how far off, on average).
* MAPE: Typical forecast miss in percent (scale-free, easy to compare).
Notes & limitations
* The panel needs a short warm-up; stats may be blank at first.
* The cone reflects recent conditions; sudden volatility changes will widen it.
* This is a tool for context. It does not place trades and does not promise results.
⚠️ Disclaimer
This script is provided for educational purposes only.
Past performance does not guarantee future results.
Trading involves risk, and users should exercise caution and use proper risk management when applying this strategy.
Search in scripts for "VWAP"

Granular Candle-by-Candle VWAPGranular Candle-by-Candle VWAP is a customizable Volume Weighted Average Price (VWAP) indicator designed for TradingView. Unlike traditional VWAP indicators that operate on the chart's primary timeframe, this script enhances precision by incorporating lower timeframe (e.g., 1-minute) data into VWAP calculations. This granular approach provides traders with a more detailed and accurate representation of the average price, accounting for intra-bar price and volume movements. The indicator dynamically adjusts to the chart's current timeframe and offers a range of customization options, including price type selection, visual styling, and alert configurations.
Customizable Features
Users have extensive control over various aspects of the Granular Candle-by-Candle VWAP indicator. Below are the key features that can be customized to align with individual trading preferences:
🎛️ Customizable Features
Users have extensive control over various aspects of the Granular Candle-by-Candle VWAP indicator. Below are the key features that can be customized to align with individual trading preferences:
🔢 Lookback Period
Description: Defines the number of lower timeframe bars used in the VWAP calculation.
Customization:
Input: VWAP Lookback Period (Number of Lower Timeframe Bars)
Default Value: 20 bars
Range: Minimum of 1 bar
Purpose: Allows traders to adjust the sensitivity of the VWAP. A smaller lookback period makes the VWAP more responsive to recent price changes, while a larger period smoothens out fluctuations.
📈 Price Type Selection
Description: Determines which price metric is used in the VWAP calculation.
Customization:
Input: Price Type for VWAP Calculation
Options:
Open: Uses the opening price of each lower timeframe bar.
High: Uses the highest price of each lower timeframe bar.
Low: Uses the lowest price of each lower timeframe bar.
Close: Uses the closing price of each lower timeframe bar.
OHLC/4: Averages the Open, High, Low, and Close prices.
HL/2: Averages the High and Low prices.
Typical Price: (High + Low + Close) / 3
Weighted Close: (High + Low + 2 × Close) / 4
Default Value: Close
Purpose: Offers flexibility in how the average price is calculated, allowing traders to choose the price metric that best fits their analysis style.
🕒 Lower Timeframe Selection
Description: Specifies the lower timeframe from which data is fetched for granular VWAP calculations.
Customization:
Input: Lower Timeframe for Granular Data
Default Value: 1 minute ("1")
Options: Any valid TradingView timeframe (e.g., "1", "3", "5", "15", etc.)
Purpose: Enables traders to select the granularity of data used in the VWAP calculation, enhancing the indicator's precision on higher timeframe charts.
🎨 VWAP Line Customization
Description: Adjusts the visual appearance of the VWAP line based on price position relative to the VWAP.
Customizations:
Color When Price is Above VWAP:
Input: VWAP Color (Price Above)
Default Value: Green
Color When Price is Below VWAP:
Input: VWAP Color (Price Below)
Default Value: Red
Line Thickness:
Input: VWAP Line Thickness
Default Value: 2
Range: Minimum of 1
Line Style:
Input: VWAP Line Style
Options: Solid, Dashed, Dotted
Default Value: Solid
Purpose: Enhances visual clarity, allowing traders to quickly assess price positions relative to the VWAP through color coding and line styling.
🔔 Alerts and Notifications
Description: Provides real-time notifications when the price crosses the VWAP.
Customizations:
Enable/Disable Alerts:
Input: Enable Alerts for Price Crossing VWAP
Default Value: Enabled (true)
Alert Conditions:
Price Crossing Above VWAP:
Trigger: When the closing price crosses from below to above the VWAP.
Alert Message: "Price has crossed above the Granular VWAP."
Price Crossing Below VWAP:
Trigger: When the closing price crosses from above to below the VWAP.
Alert Message: "Price has crossed below the Granular VWAP."
Purpose: Keeps traders informed of significant price movements relative to the VWAP, facilitating timely trading decisions.
📊 Plotting and Visualization
Description: Displays the calculated Granular VWAP on the chart with user-defined styling.
Customization Options:
Color, Thickness, and Style: As defined in the VWAP Line Customization section.
Track Price Feature:
Parameter: trackprice=true
Function: Ensures that the VWAP line remains visible even when the price moves far from the VWAP.
Purpose: Provides a clear and persistent visual reference of the VWAP on the chart, aiding in trend analysis and support/resistance identification.
⚙️ Performance Optimizations
Description: Ensures the indicator runs efficiently, especially on higher timeframes with large datasets.
Strategies Implemented:
Minimized Security Calls: Utilizes two separate request.security calls to fetch necessary data, balancing functionality and performance.
Efficient Calculations: Employs built-in functions like ta.sum for rolling calculations to reduce computational load.
Conditional Processing: Alerts are processed only when enabled, preventing unnecessary computations.
Purpose: Maintains smooth chart performance and responsiveness, even when using lower timeframe data for granular calculations.

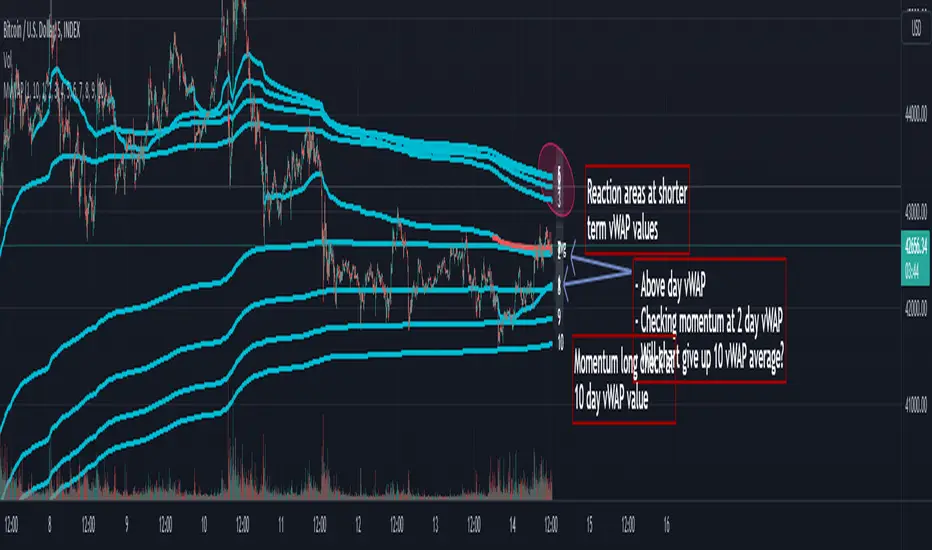
Multi Day vWAP (Customizable) with AverageIntroducing the Multi-Day vWAP indicator that is fully customizable with average indicator option.
High level overview (default settings):
Default is 10 plots with each setting 1 day apart (1-10 day look back)
Labels for each plot are turned on by default (labels will default to your value, more below)
Use Style tab in options to change colors, plot style, and turn on/off individual plots
Average is turned off by default (style panel will show it's on-- go to Inputs panel and select "Show vWAP Average" to turn on)
Best use case is go to Visibility Panel in options and turn off for Days, Weeks, and Months
To turn off all labels at once go to Style tab and unselect "Labels" checkbox
If you want plots to be as small as possible in Inputs panel set the Plot Width to 0 (zero)
Detail Overview
This indicator will plot your custom daily vWAP values.
You can change the lookback period. If you change the lookback period the label will match your custom value.
For instance, if you change vWAP 1 value to "5", the label for this plot will be 5.
Average Notes:
The average will average all the vWAP values by the divisor. The default is to average all values by 10.
The average will always start to plot from the shortest lookback period. It is not possible to have the average plot before that point.
Trading Tips (default settings)
The simple way to use the vWAP is to treat them as magnets.
For intance,
Generally if price is trading below all the vWAP plots the chart is in a momentum short enviroment. All vWAP areas can be used for upside resistance/reaction areas.
If price is trading above the chart is in a momentum long enviroment and pullbacks can to vWAP levels can be looked as areas of support/reaction.
For instance:
Price is above the current day vWAP and looking to test the previous day vWAP value.
As it approaches the 2 value you are expecting this area to be a reaction area (good trade entry area) for a continuation short trade. Possibly to check back into the current day vWAP value.
I should share that this is a simple way to trade with the vWAP (true success with vWAP is understanding that price trades in vWAP channels).
Stacking and Strong Momentum
The other pattern you should look for is stacking.
For instance on this CL chart:
This chart is strong momentum long.
All 10 day vWAP plots are stacked on top of each other.
Previous action tested below all vWAPs. Price traded thru and came back and retested. Finally closing above all and above the vWAP avearge (red).
When the day vWAP was broke the next target you look for is the 2 vWAP. This reaction area held up and momentum long continued and continuing to trade above current day vWAP.
7 Day Rolling Example (Larger Timeframe)
Another great way to use this indicator is to customize the values for rolling 7 days (5 days for cash markets).
To do this set values to: 7, 14, 21, 28, 35, 42, 49, 56, 63, 70
For instance, this BTC chart:
This chart provides a good example of what you'll find when a chart is at a pivot point.
Price is checking in at the average to remain momentum long.
Upside longer term vWAP plots have been tested and had expected reaction.
Price is trading above the shorter term values.
Simple TA here will note if chart continues to trade above and takes out upper vWAPs long momentum is gaining ground.
On the downside if price trades thru the lower vWAP plots you would expect further downside. In this scenario you would be mindful to expect upside tests before (which could be good entry/reaction areas).
NQ example with 7 day values:
Overall chart is momentum short.
7 is above 14, 21
Maybe early sign of bottom.
If price takes out these values and holds above the buyers have quite a few challenges above.
Simple Multi VWAPSimple Multi VWAP - Release Notes
Overview
**Simple Multi VWAP** is a powerful Volume Weighted Average Price (VWAP) indicator that allows you to display up to **four independent VWAP lines** simultaneously on your chart, each with its own customisable anchor period. This provides traders with a comprehensive view of volume-weighted price levels across different timeframes, enabling better analysis of price action and support/resistance levels.
Key Features
Multiple VWAP Lines
- Display up to **4 independent VWAP lines** on a single chart
- Each VWAP can be individually enabled or disabled
- Each VWAP maintains its own anchor period independently
Flexible Anchor Periods
Choose from **10 different anchor periods** for each VWAP:
- **Session** - Resets daily
- **Week** - Resets weekly
- **Month** - Resets monthly
- **Quarter** - Resets quarterly
- **Year** - Resets annually
- **Decade** - Resets every 10 years
- **Century** - Resets every 100 years
- **Earnings** - Resets on earnings announcements
- **Dividends** - Resets on dividend payments
- **Splits** - Resets on stock splits
Native Styling Support
- Full integration with TradingView's native style dialog
- Right-click any VWAP line to customise:
- Colour
- Line style (solid, dashed, dotted, etc.)
- Line thickness
- Opacity
- Default colours provided for easy identification:
- **VWAP #1**: Orange (#f19d37)
- **VWAP #2**: Purple (#7859bc)
- **VWAP #3**: Red (#df484b)
- **VWAP #4**: Cyan (#54b9d1)
Global Settings
- **Source**: Choose the price source (default: Close)
- **Offset**: Shift VWAP lines forward/backward in time
- **Hide on 1D or Above**: Automatically hide VWAPs on daily or higher timeframes
How to Use
Basic Setup
1. **Add the Indicator**: Search for "Simple Multi VWAP" in TradingView's indicator library
2. **Enable VWAPs**: Check the boxes next to the VWAPs you want to display
3. **Select Anchor Periods**: Choose the anchor period for each enabled VWAP using the dropdown next to each VWAP toggle
4. **Customise Styling**: Right-click any VWAP line → "Style" to customise appearance
Recommended Configurations
Intraday Trading
- **VWAP #1**: Session (daily reset)
- **VWAP #2**: Week (weekly reset)
- **VWAP #3**: Month (monthly reset)
Swing Trading
- **VWAP #1**: Week (weekly reset)
- **VWAP #2**: Month (monthly reset)
- **VWAP #3**: Quarter (quarterly reset)
Long-term Analysis
- **VWAP #1**: Month (monthly reset)
- **VWAP #2**: Quarter (quarterly reset)
- **VWAP #3**: Year (yearly reset)
- **VWAP #4**: Decade (decade reset)
Input Settings
Global Settings
- **Source**: Price source for all VWAP calculations (default: Close)
- **Offset**: Number of bars to shift the VWAP lines (default: 0)
- **Hide VWAP on 1D or Above**: Toggle to hide all VWAPs on daily/weekly/monthly charts
VWAP Settings
Each VWAP has two settings displayed on the same line:
- **Enable Toggle**: Checkbox to show/hide the VWAP line (labelled as "VWAP#1", "VWAP#2", etc.)
- **Anchor Period**: Dropdown to select the reset period (labelled as "---> Anchor Period")
*Note: All VWAP settings are grouped under a single "VWAPs" group for easy organisation.*
Technical Details
Calculation Method
The indicator uses TradingView's built-in `ta.vwap()` function, which calculates:
**VWAP** = Σ(Price × Volume) / Σ(Volume)
The calculation resets based on the selected anchor period, ensuring accurate volume-weighted averages for each timeframe.
Event-Based Anchors
For Earnings, Dividends, and Splits anchors, the indicator uses TradingView's data requests to detect these events automatically, ensuring precise reset points.
Use Cases
Support and Resistance Levels
Multiple VWAPs help identify key support and resistance zones across different timeframes. Price often respects these levels, making them valuable for entry and exit decisions.
Trend Analysis
Compare price action against multiple VWAPs to gauge trend strength:
- Price above all VWAPs = Strong uptrend
- Price below all VWAPs = Strong downtrend
- Mixed positioning = Consolidation or trend change
Mean Reversion
When price deviates significantly from VWAP, it may indicate overextension and potential mean reversion opportunities.
Entry/Exit Signals
- **Long Entry**: Price crosses above VWAP with volume confirmation
- **Short Entry**: Price crosses below VWAP with volume confirmation
- **Exit**: Price returns to VWAP after a significant move
Tips & Best Practices
1. **Start Simple**: Begin with 1-2 VWAPs to avoid chart clutter
2. **Match Timeframes**: Use anchor periods that align with your trading timeframe
3. **Combine with Volume**: VWAP works best when combined with volume analysis
4. **Use Multiple Timeframes**: Apply the indicator to multiple chart timeframes for confirmation
5. **Customise Colours**: Use distinct colours for each VWAP to easily identify them
Notes
- The indicator requires volume data to function properly
- VWAP calculations are most accurate on intraday charts
- Event-based anchors (Earnings, Dividends, Splits) require symbol data availability
- All VWAPs share the same source input for consistency
Version Information
**Current Version**: 1.0.0

Obsidian Flux Matrix# Obsidian Flux Matrix | JackOfAllTrades
Made with my Senior Level AI Pine Script v6 coding bot for the community!
Narrative Overview
Obsidian Flux Matrix (OFM) is an open-source Pine Script v6 study that fuses social sentiment, higher timeframe trend bias, fair-value-gap detection, liquidity raids, VWAP gravitation, session profiling, and a diagnostic HUD. The layout keeps the obsidian palette so critical overlays stay readable without overwhelming a price chart.
Purpose & Scope
OFM focuses on actionable structure rather than marketing claims. It documents every driver that powers its confluence engine so reviewers understand what triggers each visual.
Core Analytical Pillars
1. Social Pulse Engine
Sentiment Webhook Feed: Accepts normalized scores (-1 to +1). Signals only arm when the EMA-smoothed value exceeds the `sentimentMin` input (0.35 by default).
Volume Confirmation: Requires local volume > 30-bar average × `volSpikeMult` (default 2.0) before sentiment flags.
EMA Cross Validation: Fast EMA 8 crossing above/below slow EMA 21 keeps momentum aligned with flow.
Momentum Alignment: Multi-timeframe momentum composite must agree (positive for longs, negative for shorts).
2. Peer Momentum Heatmap
Multi-Timeframe Blend: RSI + Stoch RSI fetched via request.security() on 1H/4H/1D by default.
Composite Scoring: Each timeframe votes +1/-1/0; totals are clamped between -3 and +3.
Intraday Readability: Configurable band thickness (1-5) so scalpers see context without losing space.
Dynamic Opacity: Stronger agreement boosts column opacity for quick bias checks.
3. Trend & Displacement Framework
Dual EMA Ribbon: Cyan/magenta ribbon highlights immediate posture.
HTF Bias: A higher-timeframe EMA (default 55 on 4H) sets macro direction.
Displacement Score: Body-to-ATR ratio (>1.4 default) detects impulses that seed FVGs or VWAP raids.
ATR Normalization: All thresholds float with volatility so the study adapts to assets and regimes.
4. Intelligent Fair Value Gap (FVG) System
Gap Detection: Three-candle logic (bullish: low > high ; bearish: high < low ) with ATR-sized minimums (0.15 × ATR default).
Overlap Prevention: Price-range checks stop redundant boxes.
Spacing Control: `fvgMinSpacing` (default 5) avoids stacking from the same impulse.
Storage Caps: Max three FVGs per side unless the user widens the limit.
Session Awareness: Kill zone filters keep taps focused on London/NY if desired.
Auto Cleanup: Boxes delete when price closes beyond their invalidation level.
5. VWAP Magnet + Liquidity Raid Engine
Session or Rolling VWAP: Toggle resets to match intraday or rolling preferences.
Equal High/Low Scanner: Looks back 20 bars by default for liquidity pools.
Displacement Filter: ATR multiplier ensures raids represent genuine liquidity sweeps.
Mean Reversion Focus: Signals fire when price displaces back toward VWAP following a raid.
6. Session Range Breakout System
Initial Balance Tracking: First N bars (15 default) define the session box.
Breakout Logic: Requires simultaneous liquidity spikes, nearby FVG activity, and supportive momentum.
Z-Score Volume Filter: >1.5σ by default to filter noisy moves.
7. Lifestyle Liquidity Scanner
Volume Z-Scores: 50-bar baseline highlights statistically significant spikes.
Smart Money Footprints: Bottom-of-chart squares color-code buy vs sell participation.
Panel Memory: HUD logs the last five raid timestamps, direction, and normalized size.
8. Risk Matrix & Diagnostic HUD
HUD Structure: Table in the top-right summarizes HTF bias, sentiment, momentum, range state, liquidity memory, and current risk references.
Signal Tags: Aggregates SPS, FVG, VWAP, Range, and Liquidity states into a compact string.
Risk Metrics: Swing-based stops (5-bar lookback) + ATR targets (1.5× default) keep risk transparent.
Signal Families & Alerts
Social Pulse (SPS): Volume-confirmed sentiment alignment; triangle markers with “SPS”.
Kill-Zone FVG: Session + HTF alignment + FVG tap; arrow markers plus SL/TP labels.
Local FVG: Captures local reversals when HTF bias has not flipped yet.
VWAP Raid: Equal-high/low raids that snap toward VWAP; “VWAP” label markers.
Range Breakout: Initial balance violations with liquidity and imbalance confirmation; circle markers.
Liquidity Spike: Z-score spikes ≥ threshold; square markers along the baseline.
Visual Design & Customization
Theme Palette: Primary background RGB (12,6,24). Accent shading RGB (26,10,48). Long accents RGB (88,174,255). Short accents RGB (219,109,255).
Stylized Candles: Optional overlay using theme colors.
Signal Toggles: Independently enable markers, heatmap, and diagnostics.
Label Spacing: Auto-spacing enforces ≥4-bar gaps to prevent text overlap.
Customization & Workflow Notes
Adjust ATR/FVG thresholds when volatility shifts.
Re-anchor sentiment to your webhook cadence; EMA smoothing (default 5) dampens noise.
Reposition the HUD by editing the `table.new` coordinates.
Use multiples of the chart timeframe for HTF requests to minimize load.
Session inputs accept exchange-local time; align them to your market.
Performance & Compliance
Pure Pine v6: Single-line statements, no `lookahead_on`.
Resource Safe: Arrays trimmed, boxes limited, `request.security` cached.
Repaint Awareness: Signals confirm on close; alerts mirror on-chart logic.
Runtime Safety: Arrays/loops guard against `na`.
Use Cases
Measure when social sentiment aligns with structure.
Plan ICT-style intraday rebalances around session-specific FVG taps.
Fade VWAP raids when displacement shows exhaustion.
Watch initial balance breaks backed by statistical volume.
Keep risk/target references anchored in ATR logic.
Signal Logic Snapshot
Social Pulse Long/Short: `sentimentEMA` gated by `sentimentMin`, `volSpike`, EMA 8/21 cross, and `momoComposite` sign agreement. Keeps hype tied to structural follow-through.
Kill-Zone FVG Long/Short: Requires session filter, HTF EMA bias alignment, and an active FVG tap (`bullFvgTap` / `bearFvgTap`). Labels include swing stops + ATR targets pulled from `swingLookback` and `liqTargetMultiple`.
Local FVG Long/Short: Uses `localBullish` / `localBearish` heuristics (EMA slope, displacement, sequential closes) to surface intraday reversals even when HTF bias has not flipped.
VWAP Raids: Detect equal-high/equal-low sweeps (`raidHigh`, `raidLow`) that revert toward `sessionVwap` or rolling VWAP when displacement exceeds `vwapAlertDisplace`.
Range Breakouts: Combine `rangeComplete`, breakout confirmation, liquidity spikes, and nearby FVG activity for statistically backed initial balance breaks.
Liquidity Spikes: Volume Z-score > `zScoreThreshold` logs direction, size, and timestamp for the HUD and optional review workflows.
Session Logic & VWAP Handling
Kill zone + NY session inputs use TradingView’s session strings; `f_inSession()` drives both visual shading and whether FVG taps are tradeable when `killZoneOnly` is true.
Session VWAP resets using cumulative price × volume sums that restart when the daily timestamp changes; rolling VWAP falls back to `ta.vwap(hlc3)` for instruments where daily resets are less relevant.
Initial balance box (`rangeBars` input) locks once complete, extends forward, and stays on chart to contextualize later liquidity raids or breakouts.
Parameter Reference
Trend: `emaFastLen`, `emaSlowLen`, `htfResolution`, `htfEmaLen`, `showEmaRibbon`, `showHtfBiasLine`.
Momentum: `tf1`, `tf2`, `tf3`, `rsiLen`, `stochLen`, `stochSmooth`, `heatmapHeight`.
Volume/Liquidity: `volLookback`, `volSpikeMult`, `zScoreLen`, `zScoreThreshold`, `equalLookback`.
VWAP & Sessions: `vwapMode`, `showVwapLine`, `vwapAlertDisplace`, `killSession`, `nySession`, `showSessionShade`, `rangeBars`.
FVG/Risk: `fvgMinTicks`, `fvgLookback`, `fvgMinSpacing`, `killZoneOnly`, `liqTargetMultiple`, `swingLookback`.
Visualization Toggles: `showSignalMarkers`, `showHeatmapBand`, `showInfoPanel`, `showStylizedCandles`.
Workflow Recipes
Kill-Zone Continuation: During the defined kill session, look for `killFvgLong` or `killFvgShort` arrows that line up with `sentimentValid` and positive `momoComposite`. Use the HUD’s risk readout to confirm SL/TP distances before entering.
VWAP Raid Fade: Outside kill zone, track `raidToVwapLong/Short`. Confirm the candle body exceeds the displacement multiplier, and price crosses back toward VWAP before considering reversions.
Range Break Monitor: After the initial balance locks, mark `rangeBreakLong/Short` circles only when the momentum band is >0 or <0 respectively and a fresh FVG box sits near price.
Liquidity Spike Review: When the HUD shows “Liquidity” timestamps, hover the plotted squares at chart bottom to see whether spikes were buy/sell oriented and if local FVGs formed immediately after.
Metadata
Author: officialjackofalltrades
Platform: TradingView (Pine Script v6)
Category: Sentiment + Liquidity Intelligence
Hope you Enjoy!

VolumatrixVolumatrix is an enhanced volume weighted price indicator with advanced features
Created by CryptoJew & CryptoTiger on 04-06-2021
👋 Definition
Volumatrix turns current and historical price data into enhanced volume weighted price plots that allow you to visually grasp the momentum of any given market.
It’s easy to use and provides an accurate reading about an ongoing trend. This indicator is optimized to catch trend movements as soon as possible and to maximize certainty.
🙌 Overview
The Volumatrix indicator is based on an enhanced VWAP calculation, which serves as a present and upcoming price movement indication.
The further away the VWAP Wave is from the Zero Line, the more powerful the momentum is in that direction.
Conversely, the closer the VWAP Wave is to the Zero Line, the less momentum it has.
⭐️ Features
Volumatrix consists of the following features:
VWAP Waves: Visualizes the market's momentum in an easy-to-understand way by drawing colored waves.
VWAP Average: Acts as a calibration line for current wave movements.
Bearish & Bullish Dots: Indicates and confirms immediate trend changes by printing dual-colored dots.
E MA Backgrounds: Shows the general direction of the market, based on the exponential moving average (EMA).
In-depth alerts: Help traders discover potential trades with less time.
☝️ Basics
The Volume Weighted Average Price plays an essential role, as the Volumatrix indicator uses an enhanced VWAP calculation.
The volume weighted average price (VWAP) is a great technical trading indicator used by traders as it accounts for both price and volume.
VWAP signals the ratio of the cumulative share price to the cumulative volume traded over a given time.
It is essential because it provides traders with advanced insight into the trend and value of an asset.
Unlike moving averages, VWAP assigns more weight to price points with high volume.
This allows one to understand price points of interest, gauge relative strength, and identify prime entries/exits.
VWAP works with any interval: seconds, minutes, hours, days, weeks, months, years, etc...
However, keep in mind that VWAP can also experience some lag, much like a moving average.
Lag is inherent in the indicator because it's a calculation of an average using past data.
🧮 Calculation
Volume Weighted Average Price (VWAP) is constructed with two parameters, namely, price and volume, in 5 steps:
1. Calculate the Typical Price for the period.
((High + Low + Close)/3)
2. Multiply the Typical Price by the period Volume
(Typical Price x Volume)
3. Create a Cumulative Total of Typical Price
Cumulative(Typical Price x Volume)
4. Create a Cumulative Total of Volume
Cumulative(Volume)
5. Divide the Cumulative Totals
VWAP = Cumulative(Typical Price x Volume) / Cumulative(Volume)
🔍 Trend Identification - What to look for
VWAP is an excellent way to identify the trend of a market.
When using Volumatrix, you are looking for multiple confirmations that take place simultaneously.
The more confirmations that occur at the same time; the more certain the indicator will be.
You can identify the direction of a market by looking out for a few critical confirming signals.
📈 Bullish Trend Confirmations:
VWAP Wave overcrossing Zero Line :
When the VWAP Wave is crossing over the Zero Line, it indicates an immediate bullish trend.
This is one of the most certain moves that one can detect in Volumatrix.
This means that the price is about to change direction.
This is the case for any timeframe: seconds, minutes, hours, days, week, month, year, etc.
VWAP Wave color turning bullish:
When a bullish trend is about to happen, the VWAP Wave will change its color to yellow and finally to green.
That way, one can preemptively detect an upcoming bullish move.
In general, the VWAP Wave can change to 3 different colors.
Green means bullish.
Bullish Dots:
From time to time, bullish green dots will appear.
When combined with other indications, the Bullish Dots can be handy in confirming an upcoming or present uptrend.
That said, one should never solely rely on dots when deciding whether the trend is bullish or not.
Instead, if a trader sees a green dot, it should be taken as a hint to look for further bullish indications.
EMA Background:
One can identify the general trend of a market by looking at the background color of the indicator.
When the background is green, one can assume that a bullish trend is present.
The background color changes based on the exponential moving average (EMA).
By default, the 200 EMA is set. Change this value based on your timeframe preferences.
VWAP Average:
When the white VWAP Average line crosses above the Zero Line, it acts as an additional trend confirmation when combined with the VWAP waves.
As the VWAP average does not weigh in the short-term movements too heavily, it is less affected by immediate volatility.
Therefore, traders usually use the VWAP Average as a calibration tool to interpret the VWAP Waves more precisely.
📉 Bearish Trend Confirmations:
VWAP Wave under crossing Zero Line:
When the VWAP Wave is crossing under the Zero Line, it indicates an immediate bearish trend.
This is one of the most certain moves that one can detect in Volumatrix. This means that the price is about to change direction.
This is the case for any timeframe: seconds, minutes, hours, days, week, month, year, etc.
VWAP Wave turning bearish:
When a bearish trend is about to happen, the VWAP Wave will change its color to yellow and then finally to red.
That way, one can preemptively detect an upcoming bearish move. In general, the VWAP Wave can change to 3 different colors.
Red means bearish.
Bearish Dots:
From time to time, bearish red dots will appear.
When combined with other indications, the bearish dots can be handy in confirming an upcoming or present downtrend.
That said, one should never solely rely on dots when deciding whether the trend is bearish or not.
Instead, if a trader sees a red dot, it should be taken as a hint to look for further bearish indications.
EMA Background:
One can identify the general trend of a market by looking at the background color of the indicator.
When the background is red, one can assume that a bearish trend is present.
The background color changes based on the exponential moving average (EMA).
By default, the 200 EMA is set. Change this value based on your timeframe preferences.
VWAP Average:
When the white VWAP Average line crosses below the Zero Line, it acts as an additional trend confirmation if combined with the VWAP waves.
As the VWAP average does not weigh in the short-term movements too heavily, it is less affected by immediate volatility.
Therefore, traders usually use the VWAP Average as a calibration tool to interpret the VWAP Waves more precisely.
💤 Sideways Trend Confirmations:
VWAP Average:
When the VWAP Average is parallel and hovering around the Zero Line, either above or below it, that will indicate a sideways trend.
🚦 Usage - How and where to use it
The Volumatrix indicator is a universal indicator that works with any market capable of calculating a VWAP.
It’s currently being used in the following markets: cryptocurrency market, stock market, gold market and oil (just to name a few).
❗️ Requirements:
This indicator does not require any additional indicators as traders usually do in price action trading.
Basically, one just needs to follow the crossings, dots, and colors to get maximum certainty.
As a bonus, we recommend traders take advantage of TradingView’s multi-chart to catch more simultaneous confirmations.
🗣 Example Strategy: The 4 Timeframe Strategy
One can use the Volumatrix indicator along with the 4 timeframe strategy.
For example, open the 4 hour, 1 hour, 30 minute, and 5minute intervals simultaneously from left to right in a multi-chart layout.
Then lookout for the following conditions to meet:
OPEN LONG TRADE IF: On the 1-hour interval + 30-minute interval, Bullish Dots appear simultaneously
AND: On the 4-hour interval, the VWAP Wave is above the Zero Line
AND: On the 5-minute interval VWAP Wave is about to cross over the Zero Line or has already minimally crossed up.
OPEN SHORT TRADE IF: On the 1-hour interval + 30-minute interval, Bearish Dots appear simultaneously
AND: On the 4-hour interval VWAP Wave is below the Zero Line
AND: On the 5-minute interval VWAP Wave is about to cross under the Zero Line or has already minimally crossed down.
💡 Tips
Use TradingView’s 4-multi-chart layout to catch potential trades faster.
Use the indicator on a computer for optimal performance.
Set your computer screen to higher resolutions to get a better overview.
🔔 Alerts
With Volumatrix, you can use in-depth alerts like:
Bullish Dot
When a green dot at the bottom of the indicator appears
Bearish Dot
When a red dot at the bottom of the indicator appears
VWAP Wave Crossing Over Zero Line
When the VWAP Wave crosses over the Zero Line
VWAP Wave Crossing Under Zero Line
When the VWAP Wave crosses under the Zero Line
VWAP Wave Crossing Over Zero Line + Bullish Dot
When the VWAP Wave crosses over the Zero Line and a Bullish Dot appears
VWAP Wave Crossing Under Zero Line + Bearish Dot
When the VWAP Wave crosses over the Zero Line and a Bearish Dot appears
VWAP Average Crossing Over Zero Line
When the VWAP Average crosses over the Zero Line
VWAP Average Crossing Under Zero Line
When the VWAP Average crosses under the Zero Line
🔧 Settings
🔢 Inputs
These settings will change the behavior and outcome of the indicator.
EMA
Determines the number of previous candles that should be taken into calculation for the EMA background.
The value of the EMA can be changed to one's preferred value in accordance with the chosen interval.
The default value is 200.
🎨 Style
These settings will change the appearance of the indicator
VWAP Waves
Determines the color, opacity, thickness, and shape for the VWAP Waves.
The default shape is area.
The default colors are red, yellow & green.
VWAP Average
Determines the color, opacity, thickness, and shape for the VWAP Average.
The default shape is line.
The default color is white.
Zero Line
Determines the color, opacity, thickness, and shape for the Zero Line.
The default shape is a line.
The default color is white.
EMA Background
Determines the color & opacity for the Dynamic Background.
The default colors are black, red & green.
Bullish Dot
Determines the color, shape, opacity & location for the bullish dot.
The default shape is a circle.
The default color is green.
Bearish Dot
Determines the color, shape, opacity & location for the bearish dot.
The default shape is a circle.
The default color is red.
✅ Summary
Volumatrix is a unique indicator because, unlike many other VWAP tools, it's suited for simple as well as advanced analysis.
It’s a solid tool for immediately identifying the underlying trend of an asset.
Of course, this is true for any indicator based on the VWAP, which calculates an average using past data.
Still, Volumatrix is superior in this realm as it enhances the VWAP in its calculation and its visualization, while it comes with many advanced features.
❓ Questions
If you have any questions, just ask them here or in the Volumatrix community.
📚 Terminology
Bearish Dots: Red dots appearing at the bottom of the Volumatrix indicator.
Bullish Dots: Green dots appearing at the bottom of the Volumatrix indicator.
EMA: Exponential Moving Average - Tracks the price of an asset over time while giving more importance to recent price data.
Volume: A measure of how much of a given asset has traded in a period.
VWAP: Volume Weighted Average Price - The ratio of the value traded to total volume traded over time.
VWAP Average: Represents the average of the VWAP waves in the Volumatrix indicator.
VWAP Wave: The colorful waves representing the enhanced VWAP in the Volumatrix indicator.
Zero Line: It’s the indicator’s baseline and determines the beginning and end of a certain trend.
🙏 Acknowledgments
First, we would like to thank TradingView & PineCoders for this fantastic platform and technology.
We are also very grateful to our loyal trading community for constantly supporting our efforts.
We are looking forward to continuously improving this indicator for you.

Option Premium + VWAP Dashboard1. What this indicator does
This tool creates a live option chain style dashboard on your chart for index options on NSE.
For a selected expiry and a band of strikes around a reference strike, it shows:
Strike price
CE LTP (Last Traded Price)
PE LTP
CE + PE total premium
Combined VWAP of CE + PE
Individual VWAP of CE
Individual VWAP of PE
Inference column describing who is stronger
(buyers or sellers, CE side or PE side, or mixed)
Rows are color coded based on which side is dominating around VWAP, so you get a quick visual sense of:
At which strikes buyers are aggressive
At which strikes sellers are aggressive
Where premiums are trading near VWAP and stay neutral
You can place this dashboard anywhere on the chart and adjust font size and colors as per your preference.
2. Supported indices
You can use this indicator on the following indices:
NIFTY
BANKNIFTY
FINNIFTY
MIDCAP
SENSEX
Input:
Spot Symbol = choose from BANKNIFTY, NIFTY, FINNIFTY, MIDCAP, SENSEX
Internally, the script maps this choice to the corresponding TradingView symbol:
NIFTY → NSE:NIFTY
BANKNIFTY → NSE:BANKNIFTY
FINNIFTY → NSE:CNXFINANCE
MIDCAP → NSE:CNXMIDCAP
SENSEX → BSE:SENSEX
For options, it uses an option prefix derived from this selection:
For all NSE index options → BANKNIFTY, NIFTY, FINNIFTY, MIDCAP
For SENSEX options → BSX (as per your earlier convention)
Options are then constructed in this format:
PREFIX + YYMMDD + C/P + Strike
Example: NIFTY251120C20000
So the expiry date must be set correctly, otherwise TradingView will not find the options.
3. How the logic works internally
For each strike in the selected range, the script:
Builds the CE and PE symbols using:
Underlying prefix (opt_prefix)
Expiry date in YYMMDD format
C or P
Strike price
Fetches from request.security() on your current chart timeframe:
ce_close, pe_close
ce_vwap, pe_vwap
Calculates:
combined_prem = CE LTP + PE LTP
combined_vwap = CE VWAP + PE VWAP
Compares premiums and VWAPs and creates a detailed inference string, for example:
"Optn buyers stronger | Both buyers strong"
"Optn sellers stronger | CE sellers, PE buyers"
"Near VWAP | Mixed"
Chooses row background color based on which side is stronger:
CE buyers strong → BG CE Buyers Strong
PE buyers strong → BG PE Buyers Strong
CE sellers strong → BG CE Sellers Strong
PE sellers strong → BG PE Sellers Strong
If none of the above is clearly dominant, the row is kept neutral.
This gives you an immediate view of:
Where option buyers are aggressively lifting offers
Where option sellers are dominating
Where the market is balanced near VWAP
4. Expiry settings
How to change expiry to get the correct option chain
The indicator uses a manual expiry input:
Group: Expiry Settings
Input: Expiry (manual)
Internally, it extracts:
year(expiry_manual)
month(expiry_manual)
dayofmonth(expiry_manual)
Then it converts this to YYMMDD and builds option symbols.
How to set this correctly:
Open the indicator settings.
Go to “Expiry Settings”.
In Expiry (manual) select the correct date and time of the option expiry.
For NSE weekly or monthly index options, you can simply select the calendar date of the expiry.
Time is not critical for symbol naming, it is used only to obtain year, month, day, but keeping it at market open time (for example, 09:15) is a good habit.
After changing the expiry:
The title row will update to show the new expiry as DD-MM-YY.
The script will start requesting data for symbols with that YYMMDD in their names.
If you see na in most rows, it usually means:
The expiry date does not match the actual symbol format on TradingView.
The strike prices are too far away from existing contracts.
You are using an expiry where this index does not have options.
In that case, double check the expiry date and strike range.
5. Strike settings
The script gives you a flexible way to control which strikes are shown.
Group: Strike Settings
5.1 Automatic strike interval
By default, the indicator uses index specific strike steps:
BANKNIFTY or SENSEX → 100 point interval
NIFTY or FINNIFTY → 50 point interval
MIDCAP also defaults to 50 points
This is controlled internally by:
use_manual_interval = false
and auto_interval is chosen based on the index.
Use case:
If you want a quick standard layout for a typical option chain view, simply leave “Use Manual Strike Interval” unchecked and let the script choose the appropriate interval automatically.
5.2 Manual strike interval
You can override the default step using:
Use Manual Strike Interval (bool)
Manual Strike Interval (int, default 50)
When Use Manual Strike Interval is true, the script will:
Ignore the automatic index based step.
Use your chosen step size for all strikes.
When to use manual interval:
When the exchange has changed strike spacing for a particular series.
When you want a denser view (for example, 25 point steps in NIFTY) around ATM.
When you want a wider spacing for a broad overview, for example, 200 or 500 point steps.
5.3 Reference strike and range
Two important inputs:
Reference Strike (manual)
Default: 26000
This is the center of the table. The script builds strikes above and below this level.
Strikes Above / Below Reference
Default: 5
The script calculates:
start_strike = ref_strike - half_range * strike_interval
Total number of strikes = 2 * half_range + 1
So with:
Reference Strike = 26000
Strike Interval = 100
Strikes Above / Below = 5
You will get strikes from 25500 to 26500 in steps of 100.
How to choose the reference strike in practice:
Set it close to the current spot price or the ATM strike.
For intraday trading, most of your focus is usually on:
ATM
2 or 3 strikes ITM and OTM on each side
If NIFTY is around 22,250, set Reference Strike to 22200 or 22250 based on available strikes.
If BANKNIFTY is around 49,800, set it to 49800 or 50000.
This keeps the dashboard concentrated around active and liquid strikes that you actually trade.
6. Dashboard layout and appearance
Group: Dashboard Layout
Dashboard Location
Choose where the table appears on your chart.
Options: top left, top center, top right, middle left, middle center, middle right, bottom left, bottom center, bottom right.
Font Size
Choose from Tiny, Small, Normal, Large, Huge depending on your screen size and personal preference.
Group: Colors
You can customize:
Header Background
Title Background
Header Text color
Row backgrounds based on strength:
BG CE Buyers Strong
BG PE Sellers Strong
BG CE Sellers Strong
BG PE Buyers Strong
Row BG neutral for mixed or unclear situations
Suggestion:
Keep buyers related backgrounds in green shades.
Keep sellers related backgrounds in red shades.
Keep neutral in grey.
This matches the logic in the Inference column and makes interpretation much easier.
7. How to read the “Inference” column
The inference logic checks:
Is total premium above or below total VWAP?
Is CE above its VWAP?
Is PE above its VWAP?
Then it combines this into messages like:
“Optn buyers stronger | Both buyers strong”
Both CE and PE trade above their respective VWAPs, and combined premium is above combined VWAP.
Buyers are clearly dominant at that strike.
“Optn sellers stronger | Both sellers strong”
Both CE and PE trade below VWAPs, and combined premium is below combined VWAP.
Sellers are in control at that strike.
“Optn buyers stronger | CE buyers stronger”
Combined premium is above combined VWAP, CE trades above its VWAP, PE is not as strong.
CE side buyers are leading.
“Optn buyers stronger | PE buyers stronger”
Similar, but PE side buyers are leading.
“Optn sellers stronger | CE sellers, PE buyers” or “PE sellers, CE buyers”
Mixed conditions, one side is selling aggressively while the other side has some buyer support.
“Near VWAP | Mixed”
Both premiums are hovering near their VWAP, market is balanced at that strike.
Use this to quickly decide:
Where to avoid trading due to mixed and choppy behaviour.
Where buyers or sellers are clearly dominating and trend can be extended or exhausted.
8. Practical usage tips
Use on intraday timeframes
The script uses timeframe.period for VWAP and LTP calculation. Use it on 1 minute, 3 minute, 5 minute, 15 minute charts for intraday decision making.
Align with index trend
Combine this dashboard with your main price action and trend tools.
For example, if the index trend is strongly up and the ATM and slightly OTM calls show “buyers stronger” with green backgrounds, it can support continuation trades.
Watch shifts in dominance
If you see a cluster of strikes shifting from “buyers stronger” to “sellers stronger”, that can signal distribution or trend exhaustion.
Change expiry when series rolls
For weekly options, you must change Expiry (manual) every week to get the correct option chain.
For monthly and quarterly contracts, update it whenever you roll over to a new series.
Adjust manual interval and reference strike
Before the session starts, quickly adjust:
Reference Strike near current spot
Strikes Above / Below based on how wide a range you want to watch
Optional Manual Strike Interval if you prefer finer or wider spacing
This ensures the dashboard shows the most relevant and liquid strikes instead of cluttering your screen with far OTM data.
9. Limitations and notes
This script depends on correct symbol naming on TradingView for NSE index options.
If the broker or data feed uses a different format, some rows may show na.
Expiry detection is manual by design.
Pine Script cannot reliably auto detect NSE weekly expiry series for every situation, so you are given full manual control to avoid wrong symbol requests.
If you change expiry or strike settings and see an error or many na values, try:
Checking the expiry date.
Bringing reference strike closer to spot.
Refreshing the chart if TradingView needs to load new option symbols.

Dynamic HL VWAP+ | Current & Prev🔴 Dynamic HL VWAP+ | Current & Previous 🔴
A precision volume-weighted tool for traders who want more than just standard VWAP.
🧠 What It Does
The Dynamic HL VWAP+ is a powerful custom-built indicator that anchors Volume Weighted Average Price (VWAP) lines not from the session open, but from the highest and lowest points of dynamically detected price cycles.
Unlike traditional VWAPs, this tool recalculates its anchor points from:
🔺 The most recent swing high (Highest Price in Lookback Period)
Please note currently it's limited to the default value or lower, as any higher, and it will conflict with Pine's restriction on "memory allocation" system for this kind of effort. Will update if there is any change in that.
🔻 The most recent swing low (Lowest Price in Lookback Period)
Then it does the same for the previous cycle (before the current lookback window), allowing you to see how price is behaving relative to past and present price extremes.
⚙️ Key Features
✅ Dynamic Anchoring
Anchors VWAPs from the most recent High and Low over a user-defined lookback period (len).
✅ Multi-Cycle Context
Plots both Current and Previous high/low-anchored VWAPs for contextual analysis.
✅ VWAP from Highs and Lows Separately
You’ll see how price reacts around bullish (High VWAP) and bearish (Low VWAP) pressures—great for scalping, pullbacks, and reversion plays.
✅ Line Visibility Control
You decide which lines to show:
Current High VWAP
Current Low VWAP
Previous High VWAP
Previous Low VWAP
✅ Lightweight and Label-Free
Optimized for performance. No labels, no alerts, just clean and effective plotting.
📈 How to Use
1. Trend Confirmation
When price holds above the Low VWAP or breaks the High VWAP, it signals trend strength.
If price rejects at High VWAP or fails to hold Low VWAP, it's a potential reversal/retest zone.
2. Reversion-to-Mean Plays
Look for price moving far from the VWAP lines and then curling back.
Works great on volatile intraday moves or swing setups.
3. Compare Current vs. Previous Cycle
If current VWAPs are higher than the previous ones, it shows bullish progress.
Converging VWAPs from prior and current cycles often indicate a squeeze or decision point.
📊 Example Scenarios
Example 1 – Intraday Bounce Play:
Price drops into a prior cycle’s Low VWAP line and forms a base—an ideal area to look for long scalps.
Example 2 – Breakout Retest:
Price breaks above the Current High VWAP, then comes back to retest it. If it holds, the breakout is likely valid.
Example 3 – Reversal Setup:
Price is trending up but fails at Current High VWAP and breaks down below Current Low VWAP—watch for short signals.
🛠 Settings
Lookback Bars: Defines how far back to look for the current swing High/Low (default = 66).
VWAP Source: Use ohlc4 for a balanced average, or customize to your preference.
Visibility Toggles: Easily enable/disable each of the four VWAP lines.
🧪 Best Timeframes & Markets
Works across all timeframes
Great for futures, crypto, stocks
Especially useful on 15m–1H intraday charts and 4H–D for swings
💬 Final Thoughts
If you're tired of static VWAPs that only anchor from the open, the Dynamic HL VWAP+ gives you a more price-reactive, context-aware, and actionable VWAP structure.
Ideal for:
Day traders looking for mean-reversion plays
Swing traders targeting pullbacks
Anyone who wants smarter VWAP lines built on recent price structure
This is an educational idea and publication, past performance or what you may see on chart might not be replicable for you. Use at your own risk.
Regards

ZenAlgo - BoxerThis indicator plots multi-period Volume-Weighted Average Price (VWAP) ranges and deviation bands across several timeframes — specifically weekly, monthly, quarterly, semi-annual, and yearly. It is designed to visualize how price evolves relative to statistically weighted value areas within each period, based on both traded price and volume distribution.
Each timeframe layer is drawn independently, using its own cumulative VWAP and standard deviation calculation, and displayed as horizontal ranges aligned precisely with calendar periods. This structure allows the chart to show where price currently trades relative to past value zones and how each higher-timeframe VWAP acts as a dynamic reference for mean reversion or continuation.
Calculation Logic
1. Source and Base Inputs
The indicator uses the average of high, low, and close as its price source.
Stocks reset daily at session open.
2. VWAP and Deviation Computation
For each active timeframe, it accumulates the product of price and volume and divides it by cumulative volume, forming a continuously updated VWAP within that period.
The dispersion of price around VWAP is measured through a volume-weighted variance, converted to standard deviation.
These values form symmetrical bands around the VWAP (±1σ, ±2σ, etc.), describing the statistically typical price spread.
3. Range Drawing and Persistence
When a new period begins (e.g., a new week or month), the script finalizes the previous VWAP and deviation values, fixes them to time coordinates representing the full duration of that completed period, and draws corresponding lines or boxes across the entire range.
The user can control how many historical periods remain visible, ensuring performance and clarity even on high-frequency charts.
Each band can be toggled independently (for example ±1, ±2, ±3 deviations), and colors are adjustable per timeframe.
4. Adaptive Time Anchors
The start of each timeframe is aligned with calendar boundaries.
For stocks, the start time aligns with 9:30 New York time to coincide with market open for NYSE.
Each new anchor triggers a reset of cumulative data and creation of a new VWAP range.
5. Visualization Structure
The weekly layer is drawn first and can optionally display live VWAP bands extending backward for a user-defined number of weeks.
Monthly, quarterly, semi-annual, and yearly layers use the same computation principle but with independent accumulation windows.
The central VWAP line is dashed, while outer deviation levels are drawn as dotted or solid lines depending on their multiplier.
Boxes are rendered for key deviation intervals (e.g., ±2σ) to highlight broader value zones.
Interpretation
The VWAP represents the mean price weighted by traded volume for the given period.
Deviation bands describe statistically typical distance from that mean; outer bands mark less frequent extremes.
When price remains within ±1σ or ±2σ, it suggests balance around fair value.
Repeated touches or breaks beyond outer deviations indicate expansion or compression of volatility relative to prior periods.
Overlaps of VWAPs from multiple timeframes reveal multi-period confluence zones, useful for observing where long-term and short-term value agree or diverge.
Recommended Timeframes by Range Type
Weekly Range
Recommended timeframe: 30m to 12h
Suggested options: 30m, 1h, 2h, 3h, 4h, 6h, 8h, 12h
Using lower timeframes (like 5m) is technically possible, but higher ones provide smoother visualization and better readability.
Monthly Range
Recommended timeframe: 1h to 1D
Suggested options: 1h, 2h, 3h, 4h, 6h, 8h, 12h, 1D
Lower timeframes such as 30m may not display the full monthly range due to TradingView’s bar limits, so use higher TFs for complete coverage.
Quarterly Range
Recommended timeframe: 4h to 1W
Suggested options: 4h, 6h, 8h, 12h, 1D, 1W
Quarterly ranges benefit from higher timeframes to ensure that enough historical data is visible without exceeding chart limits.
Semi-Annual Range
Recommended timeframe: 12h to 1M
Suggested options: 12h, 1D, 1W, 1M
Lower timeframes would require too many bars to load a full six-month range; higher TFs offer a clearer overview.
Yearly Range
Recommended timeframe: 1D to 1M or higher
Suggested options: 1D, 1W, 1M
Yearly ranges often cannot display correctly on low timeframes (e.g. 1h) because of TradingView’s maximum bar limits — for instance, five years of 1h data exceeds 40,000 bars. Use higher TFs for accurate rendering.
Added Value Compared to Common Free VWAP Indicators
Incorporates five independent timeframes simultaneously (week, month, quarter, half-year, year) with exact calendar anchoring and timezone handling.
Calculates volume-weighted deviation for each layer, maintaining consistent statistical scale across assets.
Provides historical box persistence , allowing comparison of completed VWAP structures instead of only current running lines.
Enables selective visibility, bandwidth control, and precise visual differentiation through adjustable colors and line weights.
Limitations and Notes
The indicator does not generate trading signals. It is purely analytical and descriptive.
On very low timeframes or illiquid assets, deviation values may fluctuate if volume data is inconsistent.
Historical boxes are approximate in length for months with fewer than 31 days; this simplification has negligible effect on interpretation.
High visual density may occur when enabling many deviations or timeframes at once; users should limit visible history for performance.
Best Usage Practices
Apply on intraday charts (5–240 min) to study how price interacts with weekly or higher-timeframe VWAP zones.
Observe convergence of VWAPs from multiple periods to locate significant equilibrium levels.
Use outer deviations to frame potential exhaustion or re-entry zones rather than directional predictions.
Combine with independent volume- or structure-based analysis for context.
SOL Dashboard v6 — Investor / Swing / Scalp (VWAP, ATR, RS (SCP)
**SOL Dashboard v6 — Investor / Swing / Scalp (VWAP, ATR, RSI, BTC\Ð influence, noise-filters)**
**In short:** a universal indicator for SOLUSDT (Spot/Futures), combining three analysis horizons — Investor (D1), Swing (H1/H4), and Scalp (5m/3m/1m) — in a single script. It provides clean signals (arrows), a summary table of layer states, alerts, as well as a set of noise filters (VWAP/RSI/volume/EMA “gap”/candle body requirement/cooldown). Optional BTC/ETH trend influence filters are available. Suitable for both spot and futures.
---
### What the indicator does
**Investor (HTF, default D1):** market background. EMA(50/200) → defines long-term phase (BULL/BEAR/NEUTRAL).
**Swing (MTF, default H1):** medium-term direction. EMA(20/50) + weekly VWAP (option).
**Scalp (LTF, default 5m):** quick entries. EMA(9/21) → SCALP BUY/SELL arrows strictly at the crossover candle, plus filters.
---
### Visual elements
* EMA lines for each layer (toggled on/off).
* VWAP lines: daily (scalp filter) and weekly (swing filter).
* SCALP BUY / SCALP SELL arrows (optional).
* Table in the top-right corner: Investor/Swing/Scalp modes and hints (including BTC/ETH states if influence is enabled).
* (Optional) Debug label — shows which filter is blocking the signal (RSI/VWAP/GAP/BODY/VOL/AGREE/CD).
---
### Signals (arrow logic)
**Base trigger:** crossover(EMA Fast, EMA Slow) on bar close (default EMA9/21 for LTF).
Arrows appear only if confirmations are met:
1. EMA slope matches signal (both rising for BUY / both falling for SELL).
2. Candle closed on the “correct” side of both EMAs (above/below).
3. Noise filters (toggleable/configurable):
* VWAP (daily): BUY only above VWAP; SELL only below.
* RSI(14): BUY if RSI>50; SELL if RSI<50.
* EMA-Gap (%): minimum difference between Fast/Slow EMAs (avoids micro-crossovers in chop).
* Body ratio: minimum body-to-range ratio (filters out dojis/wicks).
* Volume filter: volume ≥ median over N bars (default 20).
* Cooldown: minimum bars between same-direction signals.
4. Trend agreement (optional): requires alignment with Swing and BTC/ETH Swing modes.
**Result:** an arrow appears at the crossover only if all active filters are satisfied.
---
### Alerts
* **SCALP BUY (filtered):** “ETH/SOL scalp BUY (cross-confirmed)”
* **SCALP SELL (filtered):** “ETH/SOL scalp SELL (cross-confirmed)”
* (Optional) EXIT signals (if included in your build): exit on opposite side of EMA25 or VWAP.
---
### BTC/ETH influence (optional)
* Toggleable trend filters:
* Script checks BTCUSDT and/or ETHUSDT Swing states (EMA20/50 on H1/H4).
* BUY only if BTC/ETH are in BULL and SOL(H1) is BULL.
* SELL only if all corresponding Swing modes are BEAR.
This increases accuracy in trending markets (can be disabled in chop if you want more entries).
---
### Recommended presets
**1) Conservative (cleaner, less noise):**
* LTF = 5m (or 3m); EMA 9/21
* VWAP daily: ON, RSI: ON
* minEmaGapPct: 0.12–0.14%
* minBodyRatio: 0.60–0.70
* cooldownBars: 7–10
* BTC/ETH agreement: ON
* confirmBars: 1 (or 0 in trends)
**2) Base (balanced):**
* LTF = 5m; EMA 9/21
* VWAP: ON, RSI: ON
* minEmaGapPct: 0.08–0.12%
* minBodyRatio: 0.55–0.65
* cooldownBars: 5–7
* BTC/ETH agreement: ON in trend / OFF in chop
* confirmBars: 0 (or 1 in chop)
**3) Aggressive (more entries):**
* LTF = 3m or 1m; EMA 7/14 (or 7/25 if enabled)
* VWAP: ON, RSI: ON
* minEmaGapPct: 0.06–0.08%
* minBodyRatio: 0.50
* cooldownBars: 3–5
* BTC/ETH agreement: OFF in chop
* confirmBars: 0 (or 1 if too many false signals)
---
### How to read the summary table
* **Investor (D1):** EMA50 vs EMA200 → BULL/BEAR/NEUTRAL.
* **Swing (H1/H4):** EMA20 vs EMA50 (+ W-VWAP) → trade direction.
* **Scalp (LTF):** EMA Fast vs EMA Slow → short-term phase.
* **BTC / ETH (Swing):** their states (if influence enabled).
👉 Alignment of Investor + Swing + Scalp in one direction = maximum trend strength.
👉 Disagreement = reduce position size / wait for confirmation.
---
### Practical application
* **Entries:** SCALP arrows in Swing direction (and optionally BTC/ETH) + above/below VWAP.
* **Stops:** recommended ATR(14, LTF) × 1.6–2.0 (or beyond EMA21/EMA25).
* **Targets:** at least 1.8–2.2 R, take 30–50% at +1R, leave remainder as trailing (EMA9/EMA25/VWAP).
* **Trend filter:** trade longs mainly when price > daily VWAP and Swing = BULL (and vice versa).
---
### Settings (key parameters)
* Independent TFs for Investor / Swing / Scalp.
* EMA Fast/Slow set separately for each layer.
* VWAP (Daily/Weekly) as toggleable filters.
* RSI filter (BUY >50 / SELL <50).
* Noise filters: EMA-Gap, Body ratio, Volume ≥ median, Cooldown.
* Trend agreement: BTC/ETH Swing + SOL Swing.
* Debug mode: shows which filter is blocking a signal.
---
### FAQ
**Why no arrows when “crossover is visible”?**
Because arrows are plotted on bar close only if all active filters (VWAP/RSI/GAP/BODY/VOL/AGREE/CD) are satisfied. Enable Debug to see which filter blocks the signal.
**When to enable BTC/ETH influence?**
In trending markets → ON (accuracy ↑). In chop, if you want more entries → OFF.
**Works on Spot/Futures?**
Yes. But remember: futures fees are charged on position notional, not margin — factor this into risk management.
---
### Disclaimer
This is a research tool. Not financial advice. Trading crypto assets and derivatives carries high risk (especially with leverage). Always use stop-losses and manage risk per trade.
---
\#SOL #SOLUSDT #Scalping #Swing #Investor #VWAP #EMA #RSI #ATR #Crypto #Futures #NoiseFilters #BTCInfluence #ETHInfluence #TrendFilter #TradingView

The Forexation: Super Trend SignalsOverview:
The Forexation: Super Trend Signals (STS) indicator was crafted to enhance visualization of market trends by integrating multiple technical analysis tools and adding logic to them so they color bullish, bearish, counter trends, and cautious trends. By combining standard and higher-timeframe Supertrends with dynamic EMAs and VWAP, STS offers a multi-dimensional view of market dynamics. This synergy allows traders to:
Assess Trend Strength and Alignment
Identify Momentum Shifts and Reversals
Gauge Market Sentiment through Volume-Weighted Pricing
Filter Out Market Noise for Clearer Signals
Key Features and Synergy:
1. Dual Supertrend Analysis:
Standard Supertrend:
Utilizes the Average True Range (ATR) and a multiplier factor to detect immediate market trends.
Customizable ATR Length and Factor to adjust sensitivity to market volatility.
Used as a guide to help follow the trend and identify where if price breaks through we can be reversing trend or entering a counter/cautious trend.
Higher Time Frame (HTF) Supertrend:
Integrates Supertrend data from a higher timeframe for a broader market perspective.
Smoothing applied via an EMA to reduce lag and false signals.
**Synergistic Effect:
Trend Alignment: By analyzing both standard and HTF Supertrends, STS identifies when short-term trends align with long-term trends, increasing the reliability of trend signals.
Dynamic Adjustments: Traders can adjust parameters to fine-tune the balance between responsiveness and stability.
2. Customized EMAs with Contextual Color-Coding:
Fast and Slow EMAs:
Customizable periods to match different trading strategies and timeframes.
EMAs are used to identify momentum shifts and potential reversals through crossovers.
Dynamic Color-Coding:
EMA lines change color based on their relationship with each other, the Supertrends, and VWAP.
Visual Interpretation:
Bullish Alignment: Fast EMA above Slow EMA, both above Supertrend and VWAP, signals strong upward momentum.
Bearish Alignment: Fast EMA below Slow EMA, both below Supertrend and VWAP, signals strong downward momentum.
Caution Zones: Misalignment or crossovers indicate potential reversals or consolidation.
**Synergistic Effect:
Momentum Confirmation: EMA crossovers are validated against Supertrend directions, reducing false signals.
Support and Resistance Zones: The area between EMAs acts as dynamic support/resistance, visualized through an optional fill.
3. VWAP Integration for Volume-Weighted Insights:
VWAP Analysis:
Calculates the average price weighted by volume, providing insights into institutional trading levels and market sentiment.
**Synergistic Effect:
Trend Validation: Confirms trend strength by analyzing whether price and EMAs are above or below VWAP.
Counter-Trend Detection: Identifies potential pullbacks or reversals when price interacts with VWAP against the prevailing trend of the standard and higher time frame SuperTrend.
4. Composite Signal Generation:
Color-Coded Market Conditions:
Bullish Signals (Green): Strong upward trends with alignment across standard + HTF Supertrend, EMAs, and price above VWAP.
Bearish Signals (Red): Strong downward trends with inverse alignment.
Caution State (Orange): Potential market reversals or uncertainty when indicators are misaligned. (Example: price above VWAP but under HTF SuperTrend)
Counter-Trend Conditions (Yellow): Signals possible pullbacks or consolidations when price or EMAs cross VWAP. (Example: Price is above VWAP & HTF SuperTrend but the EMAs and Standard SuperTrend are in a down trend)
**Synergistic Effect:
Enhanced Signal Accuracy: By requiring multiple confirmations across different indicators and timeframes, STS filters out noise and increases the probability of trends in the market.
Timely Alerts: Alerts are generated when critical conditions are met, keeping traders informed of significant market movements.
Underlying Concepts and Calculations:
Supertrend Algorithm:
Calculation:
Supertrend is calculated using ATR to set a dynamic trailing stop that follows price movements.
The indicator switches between bullish and bearish modes when price crosses the Supertrend line.
Customization:
ATR Length and Factor can be adjusted to make the Supertrend more or less sensitive to price changes.
In STS: Both standard and HTF Supertrends are used, with the HTF providing longer-term trend context.
Exponential Moving Averages (EMAs):
Calculation:
EMAs apply more weight to recent prices, making them more responsive than Simple Moving Averages (SMAs).
Crossovers between Fast and Slow EMAs signal potential momentum shifts.
Customization:
Periods for Fast and Slow EMAs are user-defined to suit different trading styles.
In STS: EMA behavior is analyzed in conjunction with Supertrend and VWAP to validate signals.
Volume Weighted Average Price (VWAP):
Calculation:
VWAP accumulates total dollars traded (price times volume) divided by total volume over a specific period.
Reflects the average price at which the instrument has traded throughout the day based on both price and volume.
**In STS:
VWAP serves as a dynamic support/resistance level.
Interaction with VWAP can indicate shifts in market sentiment, especially when combined with other indicators.
Justifying the Value of STS:
Holistic Market Analysis:
STS doesn't just merge indicators; it creates a cohesive system where each component validates and enhances the others.
This integrated approach offers a more reliable analysis than using individual indicators in isolation.
Customizable and Adaptive:
Traders have control over key parameters, allowing STS to be tailored to different markets and trading styles.
The ability to adjust sensitivity helps in adapting to varying market conditions.
Enhanced Decision-Making:
By providing clear visual cues and alerts, STS aids in quick interpretation of complex market data.
The indicator helps in identifying high-probability trend opportunities and managing risk effectively with trailing SuperTrend guidance.
Unique Signal Filtering:
The combination of multiple confirmations reduces the likelihood of false trend signals.
The use of higher timeframe data and volume-weighted analysis adds depth to trend assessment.
How to Use STS Effectively:
1. Configuring Settings:
Supertrend Settings:
Adjust ATR Length and Factor to set the desired sensitivity.
Select the Higher Time Frame for the HTF Supertrend to align with your trading horizon.
Set the Smoothing Period for the EMA applied to the HTF Supertrend.
EMA Settings:
Define periods for Fast and Slow EMAs based on your strategy.
Ensure the Fast EMA period is shorter than the Slow EMA for effective crossovers.
Color and Display Settings:
Customize colors for different market conditions to enhance visual clarity.
Choose whether to display the HTF Supertrend, EMA lines, EMA fill, and VWAP.
2. Interpreting Signals:
Bullish Scenario:
Supertrends indicate an uptrend.
Fast EMA crosses above Slow EMA, both trending upwards.
Price and EMAs are above VWAP.
Action: Consider long positions, using the standard Supertrend as a trailing stop.
Bearish Scenario:
Supertrends indicate a downtrend.
Fast EMA crosses below Slow EMA, both trending downwards.
Price and EMAs are below VWAP.
Action: Consider short positions. using the standard Supertrend as a trailing stop
Caution and Counter-Trend Signals:
Misalignment between indicators or color changes to orange/yellow.
Action: Exercise caution, tighten stops, or wait for clearer signals.
4. Setting Up Alerts:
Access the Alerts menu.
Configure alerts for:
Supertrend Direction Changes
EMA Crossovers
Price Crossing VWAP
Set alert actions and ensure they trigger on confirmed data by selecting "Once Per Bar Close."
Example Trading Strategies:
Trend Following:
Use STS to identify strong trends where all indicators are aligned.
Enter positions in the direction of the trend.
Use Supertrend lines as dynamic stop-loss levels.
Pullback Entries:
Wait for price to pull back to the EMA fill area or VWAP in a prevailing trend.
Look for bounce signals off these levels when supported by Supertrend direction.
Counter-Trend Opportunities:
Identify potential reversals when caution or counter-trend signals appear.
Confirm with additional analysis or indicators before taking positions against the main trend.
Disclaimer:
This indicator is intended to aid in technical analysis and should be used as part of a comprehensive trading strategy. It does not guarantee profits and carries the risk of loss. Trading financial instruments involves significant risk; please consult with a qualified financial advisor before making any investment decisions. Past performance is not indicative of future results.
Final Notes:
The Forexation: Super Trend Signals (STS) indicator represents a thoughtfully engineered tool that brings together multiple technical elements to provide a more nuanced understanding of market behavior. By leveraging the strengths of Supertrend, EMAs, and VWAP in unison, STS aims to enhance trading precision and confidence in the trends the market creates but also guide risk management levels for managing a trade and stop loss areas.
We are committed to continuous improvement and value user feedback. Please share your experiences and suggestions to help us refine the indicator further.
Happy Trading!
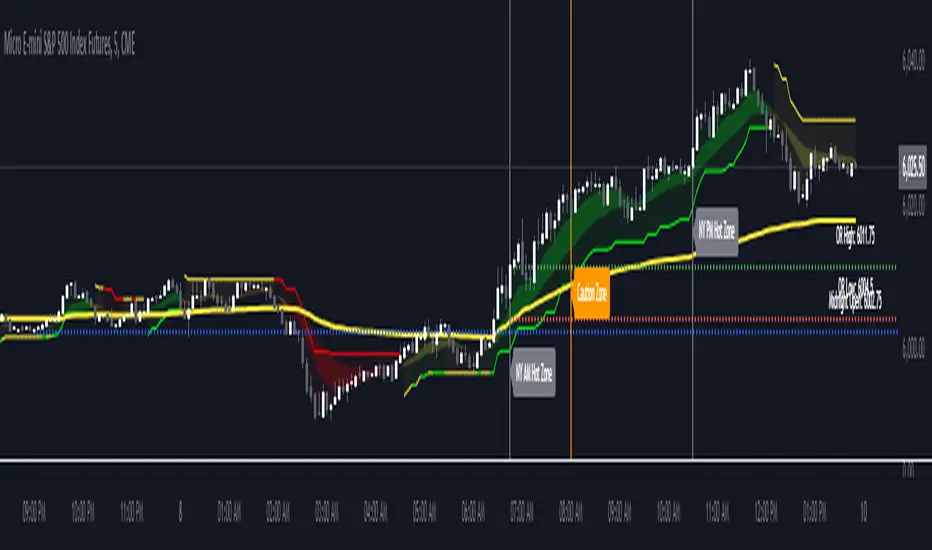
TurboVWAPs 3XAwesome indicator that will plot on your chart up to 3 different VWAPs and optionally up to 3 standard deviations for each one.
Each VWAP can be configured to be a Rolling or Anchored VWAP and to automatically adapt its period depending on the current chart timeframe. For example, you can configure each VWAP to be a rolling 30min VWAP for timeframes below 30M, a session-anchored VWAP between 30M and 1D timeframes, a rolling monthly VWAP for a 1D timeframe and a quarterly VWAP for a weekly timeframe.
You can disable any of the three VWAPs or any of its standard deviations bands.
For session-anchored VWAPs the script will automatically set session times depending on the current futures contract (only for US and EUR futures) if desired. You can disable this feature and manually input session start and end times.
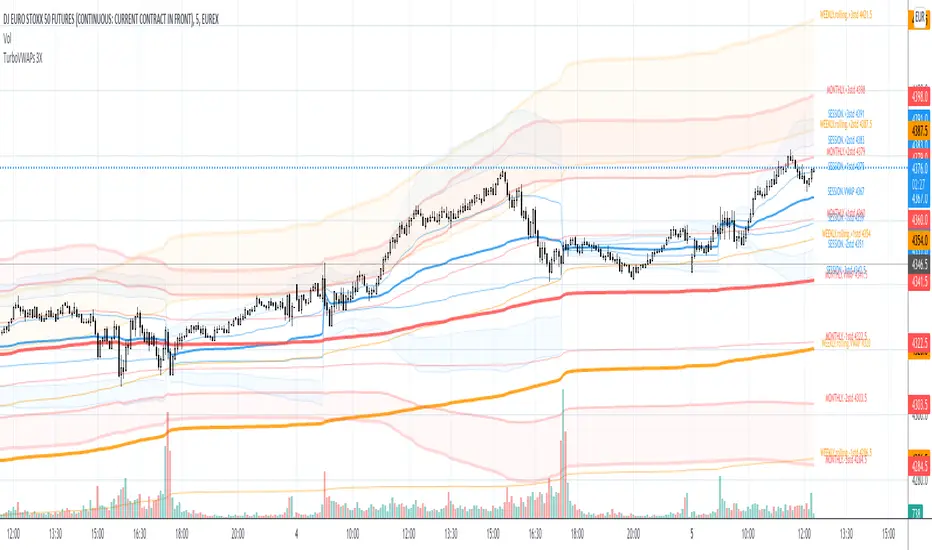
ZenAlgo - RangerThe core of the indicator is the daily range, anchored around the 1-minute timeframe VWAP (volume-weighted average price), with ±2 standard deviations defining the upper and lower bounds. This range dynamically forms throughout the day and then gets “locked” at 23:59 each day to establish historical reference values.
The indicator calculates this locked VWAP and standard deviation per day, which serves two primary purposes:
Drawing today's real-time evolving range , updated each minute.
Plotting previous daily ranges , based on historical locked VWAPs and standard deviations, providing visual reference boxes on the chart.
This design enables the trader to identify mean-reversion zones and persistent directional biases based on volume-weighted price consensus.
Multiple Standard Deviation Layers
Beyond the ±2.0 deviation bounds, optional lines are available at half-step increments (e.g., ±0.5, ±1.5, ..., ±4.5) and full-step levels beyond ±2.0 (±3.0, ±4.0, ±5.0). These provide a customizable grid to visualize price extremes, tail behavior, or potential breakout zones relative to volume-adjusted price equilibrium.
Users can enable only the levels they need, offering flexibility depending on their strategy (e.g., scalping versus swing trading).
Historical Range Retention
The script stores up to 70 previous daily VWAP + standard deviation values (adjustable). For each, it draws a full range box and standard deviation lines in the past. This historical context helps in understanding how current price interacts with prior days’ balance zones.
These boxes are always drawn from 00:00 to 23:59 UTC , ensuring consistent alignment across instruments and avoiding session-based discrepancies.
Monday Range Reference (Drawn on Tuesdays)
On Tuesdays, the indicator plots the previous Monday's VWAP-based range across the rest of the week. This serves as a persistent contextual anchor for traders watching weekly unfolding behavior. The range is defined identically (VWAP ±2σ) and drawn from Monday 00:00 through the following Monday.
This method assumes Monday often sets the tone or structure for the week, and tracking this level through time may highlight support/resistance confluence or range expansion scenarios.
Each Monday range is extended over 7 days and includes dashed lines at the 25%, 50%, and 75% marks within the range. These midrange markers help traders assess microstructure behaviors (e.g., reversion to median, failure to hold midpoint, etc.).
Daily Volume Delta via 4H Candles
The indicator also integrates daily buy/sell volume deltas , derived from 4-hour candles of the regular session (non-Heikin Ashi). The logic categorizes volume as:
Buy volume when candle closes above the previous close.
Sell volume when it closes below.
Even split when the candle closes flat.
These volumes accumulate each day to derive net delta (buy - sell). This delta is recorded for each day and can optionally be displayed. A similar process tracks the delta for each Monday range on an ongoing basis.
This information quantifies the market’s aggressive buying vs. selling , correlating with price positions inside or outside the VWAP ranges. A strong delta in one direction may justify a price sustaining above/below VWAP, or diverging from the previous range.
Interpretation and Best Usage Practices
VWAP±2σ Range : Considered a high-probability area for consolidation or reversal. Mean-reverting strategies can benefit from signals within this area.
VWAP±3.0 and beyond : Extreme deviations may signal exhaustion or breakout potential, but are less frequent.
Previous Range Overlap : Overlap of today’s price with past VWAP zones may indicate support/resistance zones.
Monday Range on Tuesday : Persistent levels where the week may repeatedly pivot. Best used on instruments that exhibit weekly cyclical behavior (e.g., indices, forex).
Delta Behavior : Sharp positive or negative delta combined with price outside VWAP bands may suggest initiative participation and potential trend continuation.
Added Value Over Free Alternatives
While many free VWAP tools exist, this script differs in several specific and factual ways:
Anchored 1-minute VWAP lock at a consistent daily timestamp (23:59 UTC), enabling historical analysis.
Historical storage of previous VWAP ranges , with adjustable memory depth and visual continuity.
Flexible standard deviation plotting , down to 0.5 increments, tailored to the user's strategy needs.
Dedicated Monday range analysis , not common in freely available scripts.
Volume delta tracking per day and per Monday range , offering a directional volume view unavailable in standard VWAP implementations.
Persistent and visual interpretation framework using extended boxes and dashed lines for easier contextual navigation.
Each of these additions increases the script’s utility for methodical traders relying on volume-weighted statistics, without requiring additional configuration or external calculations.
Limitations and Disclaimers
VWAP based on 1-minute resolution : The indicator uses minute-level data to calculate daily VWAP and standard deviation. This offers high fidelity on liquid instruments but may produce noisy or unreliable levels on illiquid assets or during periods of low volume. For example, microcap stocks or thinly traded altcoins might not yield stable VWAP centers.
Inferred buy/sell volume : Volume delta is estimated using price movement from one candle to the next (close-to-close logic), rather than actual trade-level aggressor data (which is not accessible via TradingView). This approximation may misclassify volume in choppy or low-volatility environments, especially in assets where price changes do not correlate well with order flow (e.g., crypto during low-volume weekends).
Non-continuous markets and price gaps : For assets that do not trade continuously (e.g., stocks, futures), the VWAP calculation starts fresh every day at 00:00 UTC, regardless of the instrument’s official session start. As a result:
Pre-market/post-market trades may be included in VWAP when analyzing equities, even though they are often excluded in professional VWAP tools.
Opening gaps in equities and futures may distort early VWAP values due to lack of volume context, especially if the previous day's session was already closed when new data begins accumulating.
Weekend gaps in crypto, although less frequent due to 24/7 trading, can still influence delta accumulation if abrupt moves happen during low liquidity periods.
Daily session alignment : The VWAP anchoring and box drawing uses 00:00 UTC to 23:59 UTC windows. For instruments with different official session timings (e.g., US equities, CME futures), this may cause mismatches between expected session VWAPs and the ones shown in this script.
Conclusion
The ZenAlgo – Ranger script offers a systematic visualization of volume-adjusted price behavior, combining statistical VWAP ranges with volume delta overlays. By integrating daily and weekly reference zones, this tool supports structured decision-making in various market environments, particularly for traders prioritizing mean reversion, range expansion, or trend confirmation.

ZenAlgo - Golden VeinOverview and Motivation
This indicator combines multiple volume-weighted average price (VWAP) calculations from different timeframes and then merges them into a single composite line called “the Vein”. It begins by pulling a user-defined source (for instance, a typical price) and then anchors a VWAP on daily, weekly, monthly, quarterly, semiannual, and yearly intervals. By viewing all these timeframes together, the script captures multi-period trends in a way that stands apart from simpler, single-timeframe VWAP indicators. This comprehensive perspective is designed to offer practical benefits to those who monitor both short- and long-term VWAP behavior within a single tool.
Because it tracks many timeframes simultaneously, it can highlight instances when short-term and long-term VWAPs converge or diverge. Traders who need multi-timeframe validation may find this approach particularly helpful. Other free indicators typically restrict themselves to one or two timeframes, so the built-in multi-timeframe data in this script can save effort for those who rely heavily on VWAP analysis.
Core Inputs and Offsets
At the start, the script takes a single price input (e.g., the average of high, low, and close) and uses it to compute multiple VWAP lines. Users can also choose a distance factor (based on an ATR calculation) to control how far labels are placed from any crossover events. This distance sets how clearly the chart will display labels without overcrowding.
Beyond giving a cleaner visual, having a user-defined distance for labels means the script can adapt to any ticker’s volatility. If one trades assets with large intraday swings, the script leaves enough space for labels to remain readable. This flexibility is something that simpler free VWAP scripts might lack.
Multi-Timeframe VWAP Computations
The script calculates distinct VWAP lines: Daily, Weekly, Monthly, Quarterly (3-Month), Semiannual (6-Month), and Yearly (12-Month). Each line resets whenever it detects a new period has started, ensuring that each timeframe’s VWAP properly anchors to its own session window. This allows the indicator to track how the market perceives fair value (through VWAP) on multiple horizons, all at once.
Simultaneously checking these various intervals can offer added clarity to traders who want to compare immediate market conditions (e.g., daily) to broader contexts (e.g., quarterly or yearly). Tools that only show one or two timeframes may miss the nuances that arise when, say, daily VWAP aligns with monthly VWAP at a turning point.
Crossover Detection and Labeling
Whenever two different VWAP lines intersect, the script generates an internal crossover signal. It then draws small labels (e.g., D↑W or M↓Q) to highlight that a lower timeframe VWAP has moved above or below a higher timeframe VWAP. These labels use color-coding and an ATR-based offset to remain visible.
An additional subtle feature is how daily VWAP crossovers can optionally be displayed only on a specific weekday and hour. That allows users who only want to track daily crossovers under certain conditions (for example, a fixed point in the weekly cycle) to filter out other signals. This adaptability can be worth paying for if one needs advanced filtering—an area where simpler free VWAP cross indicators typically do not offer such granular control.
The “Golden VWAP” (Composite Calculation)
All six VWAP lines (daily, weekly, monthly, quarterly, semiannual, yearly) feed into a central average called “the Vein”. The script takes the midpoint of these six values on each bar, effectively combining short-, medium-, and long-term VWAP data into one. This composite serves as a reference line for overall market direction.
A volatility band (either a standard-deviation-based range or a user-defined percentage) wraps around this composite. The script thereby creates an upper and a lower boundary around the Golden VWAP, called “Resistance” and “Support.” Traders may interpret price moves beyond these levels as higher-probability expansions or contractions, but there is no guarantee of outcome. In choppier markets, breakouts above or below these bands might not lead to follow-through, so interpretation should always be combined with other evidence.
Simplified Market State Logic
By checking how price and the Golden VWAP behave from one bar to the next, the script tags the market state with labels like Bullish, Bearish, Super Bullish, or Super Bearish. These classifications hinge on whether the Golden VWAP is rising or falling, and whether price has crossed above or below the composite band. An optional table in the lower-left corner of the chart displays this label.
While such classification is convenient for scanning changing conditions quickly, it should be interpreted with caution. If the market is sideways or if volume patterns are erratic, the script can produce signals that do not align with real momentum. Treat these states as indications of potential bias rather than automatic buy or sell triggers.
Added Value
By gathering VWAP lines across multiple timeframes, generating alerts on all possible combinations of crossovers, and overlaying a composite VWAP with adjustable volatility bands, this script goes beyond typical single-timeframe VWAP indicators. It aims to let users track short-term shifts (e.g., daily crossing weekly) in the context of longer-term trends (e.g., yearly). This granularity and automation can reduce the need for multiple charts or manual recalculations of different VWAP windows.
Why It Can Be Worth Paying For
The capability to simultaneously anchor VWAP to multiple timeframes, detect crossovers, filter out daily signals by weekday/hour, and visualize a composite “Vein” with adjustable ranges represents a comprehensive feature set that free scripts often do not bundle together. For those who rely on multi-timeframe VWAP analysis, the time saved and clarity gained may justify a paid solution.
Interpreting Values
Crossover labels: Identify points where one timeframe’s VWAP moves above or below another. The direction (up or down) suggests potential momentum shifts.
Golden VWAP line: Treat it as the average “fair value” across all anchored periods. Large price moves above or below this line’s surrounding band might signal increased directional conviction—or false breakouts if volume is deceptive.
Market states: Use the Bullish/Super Bullish/Bearish/Super Bearish labels to gauge how price interacts with the composite’s slope and band.
How to Use It Best
Combine these signals with other risk-management methods.
Monitor multiple crossovers in tandem: for example, daily crossing weekly plus monthly crossing quarterly may offer stronger confluence.
Use the optional daily-label toggle to stay focused on selected higher-confidence signals if you find too many crossovers distracting.
Remember that every alert or label should be evaluated in broader market context and your own trading strategy.
Potential Shortcomings
As with any technical study, VWAP lines and crossovers are not foolproof predictors. The script can be less reliable in low-volume or fast-moving conditions. Large price shocks can cause abrupt changes that do not fit the typical patterns this indicator looks for.
In short, this script’s distinct advantage is showing multiple anchored VWAPs and a composite perspective in one place, offering fine control of alerts and appearance settings. Those who benefit most are chartists who want deeper VWAP insights across various timescales without juggling multiple separate indicators. However, like any technical tool, it should be understood as an aid rather than a guarantee of outcomes.
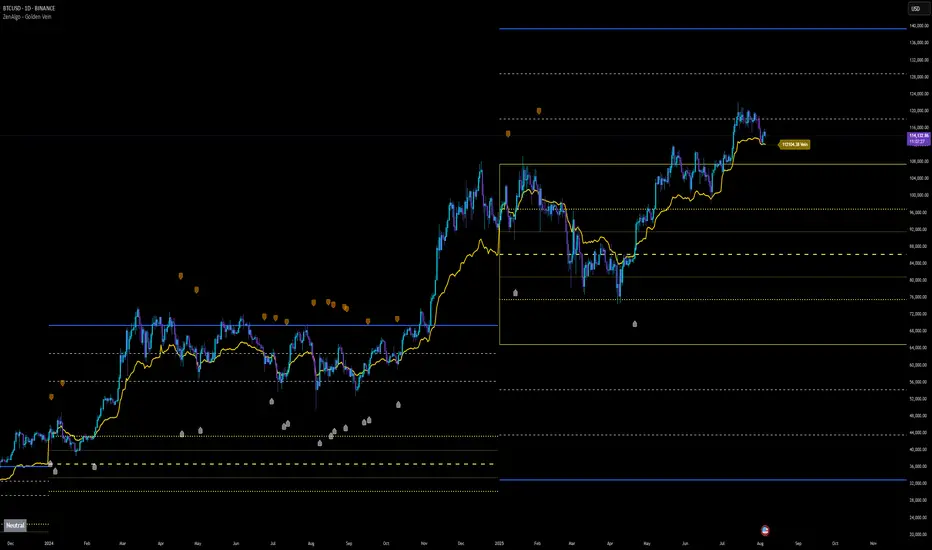
Yearly VWAP with Z-Score V2This script extends the traditional Volume Weighted Average Price (VWAP) by applying it to yearly sessions (with a customizable start month) and combining it with a Z-Score framework to standardize price deviations from VWAP.
Features
Yearly VWAP: Automatically resets at the selected month, making it possible to align VWAP with fiscal or seasonal cycles (e.g., June–May).
Volatility-Weighted Bands: Standard deviation is calculated using volume-weighted price variance, creating adaptive upper and lower bands around VWAP.
Z-Score Calculation: Converts price distance from VWAP into standardized scores, ranging from +2.5 to –2.5. This enables statistical interpretation of whether price is trading at fair value, extended, or oversold relative to VWAP.
Custom Session Control: Input allows users to change the yearly anchor month.
On-Chart Display: VWAP and bands are plotted, with a live Z-Score label shown on the latest bar.
How to Use
Fair Value Reference: VWAP reflects the average price weighted by volume over the yearly session — a natural equilibrium point.
Overbought / Oversold Detection: Extreme Z-Score readings (±2 or beyond) highlight when price is stretched relative to VWAP.
Cycle Analysis: Resetting VWAP by custom months allows studying market behavior over fiscal years, seasons, or custom trading cycles.
Part of a Broader Toolkit: This script is not a standalone trading system. It works best when aggregated with other indicators, confluence factors, or a structured strategy.
Originality
Unlike a standard VWAP, this version:
Uses yearly anchoring with custom start month instead of session/day anchoring.
Adds volume-weighted standard deviation bands for statistical context.
Translates distance into a Z-Score scale for objective overbought/oversold assessment.
Positive Z-Score values indicate zones where price is positioned favorably for accumulation or potential buys, while negative values highlight areas more suitable for distribution or profit-taking — always best used in confluence with other tools rather than as a standalone signal
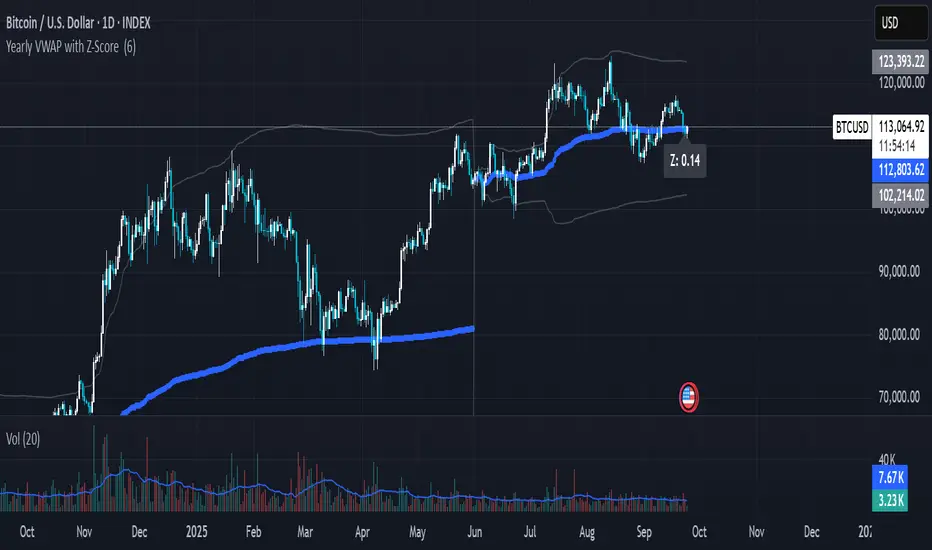
Bias + VWAP Pullback — v4 (PA + BOS/CHOCH)Simple idea: I identify the trend (bias) from the larger timeframe, and only trade pullbacks to the VWAP/EMA during liquidity (London/New York). When the trend is clear, gold moves strongly, and its pullbacks to the balance lines provide clear opportunities.
Timeframe and Sessions (Cairo Time)
Analysis: H1 to determine the trend.
Implementation: 5m (or 1m if professional).
Trading window:
London Opening: 10:00–12:30
New York Opening: 16:30–19:00
(avoid the rest of the day unless there is exceptional traffic).
Direction determination (BIAS)
On H1:
If the price is above the 200 EMA and the daily VWAP is bullish and the price is above it → uptrend (long-only).
If the price is below the 200 EMA and the daily VWAP is bearish and the price is below it → bearish trend (short-only).
Determine your levels: yesterday's high/low (PDH/PDL) + approximate Asia range (03:00–09:30).
Entry Rules (Setup A: Trend Continuation)
Asia range breakout towards Bias during liquidity window.
Wait for a withdrawal to:
Daily VWAP, or
EMA50 on 5m frame (best if both cross).
Confirmation: Confirmation low/high on 5m (HL buy/LH sell) + clear impulse candle (Body is greater than average of last 10 candles).
Entry:
Buy: When the price returns above VWAP/EMA50 with a confirmation candle close.
Sell: The exact opposite.
Stop Loss (SL): Below/above the last confirmation low/high or ATR(14, 5m) x 1.5 (largest).
Objectives:
TP1 = 1R (Close 50% and move the rest Break-even).
TP2 = 2.5R to 3R or at an important HTF level (PDH/PDL/Bid/Demand Zone).
Entry Rules (Setup B: Reversion to VWAP – “Mean Reversion”)
Use with extreme caution, once daily maximum:
Price deviation from VWAP by more than ~1.5 x ATR(14, 5m) with rejection candles appearing near PDH/PDL.
Reverse entry towards the return of VWAP.
SL small behind rejection top/bottom.
Main target: VWAP. (Don't get greedy — this scenario is for extended periods only.)
News Filtering and Risk Management
Avoid trading 15–30 minutes before/after strong US news (CPI, NFP, FOMC).
Maximum daily loss: 1.5–2% of account balance.
Risk per trade: 0.25–0.5% (if you are learning) or 0.5–1% (if you are experienced).
Do not exceed two consecutive losing trades per day.
Don't chase the market after the opportunity has passed — wait for the next pullback.
Smart Deal Management
After TP1: Move stop to entry point + trail the rest with EMA20 on 5m or ATR Trailing = ATR(14)×1.0.
If the price touches a strong daily level (PDH/PDL) and fails to break, consider taking additional profit.
If VWAP starts to flatten and breaks against the trend on H1, stop trading for the day.
Quick Checklist (Before Entry)
H1 trend is clear and consistent with 200EMA + VWAP.
Penetrating the Asia range towards Bias.
Clean pull to VWAP/EMA50 on 5m.
Confirmation candle and real push.
SL is logical (behind swing/ATR×1.5) and R :R ≥ 1:2.
No red news coming soon.
Example of "ready-made" settings
EMA: 20, 50, 200 on 5m, 200 only on H1.
VWAP: Daily (reset daily).
ATR: 14 on 5m.
Levels: PDH/PDL + Asia Band (03:00–09:30 Cairo).
Gold Notes
Gold is fast and sharp at the open; don't get in early — wait for the draw.
Fakeouts are common before news: it is best to call with the trend after the price returns above/below VWAP.
Don't expect 80% consistent wins every day — the advantage comes from discipline, filtering out bad days, and only withdrawing when you're on the right track.
تعتبر شركة الماسة الألمانية أحد المؤسسات العاملة بالمملكة العربية السعودية ولها تاريخ طويل من الخدمات الكثيرة والمتنوعة التى مازالت تقدمها للكثير من العملاء داخل جميع مدن وأحياء المملكة حيث نقدم أفضل ما لدينا من خلال مجموعة الشركات التالية والتي من خلالها ستتلقي كل ما تحتاج إلية في كل المجال المختلفة فنحن نعمل منذ عام 2015 ولنا سابقات اعمال فى مختلف المجالات الحيوية التى نخدم من خلالها عملائنا ونوفر لهم أرخص الأسعار وبأعلى جودة من الممكن توفرها فى المجالات التالية :-
خدمات تنظيف المنازل والفلل والشقق
خدمات عزل الخزانات تنظيف غسيل صيانة اصلاح
خدمات جلي البلاط والرخام والسيراميك
خدمات نقل العفش عمالة فلبينية مدربة
خدمات مكافحة الحشرات بجدة
كل هذة الخدمات وأكثر نوفرها لكل المتعاقدين بأفضل الطرق مع توفير خطط وبرامج متنوعة لأتمام العمل المسنود إلينا بأفضل وأحدث الطرق الحديثة والعصرية سواء فى شركات النظافة بجدة ومكة المكرمة أو شركات نقل العفش بجدة عمالة فلبينية وباقى الخدمات مثل جلي وتلميع الرخام بمكة وجدة ولا ننسي شركة مكافحة حشرات بجدة التى ساعدت آلاف المواطنين على تنظيف منازلهم من الحشرات بأفضل مبيدات حشرية.

Pivot Matrix & Multi-Timeframe Support-Resistance Analytics________________________________________
📘 Study Material for Pivot Matrix & Multi Timeframe Support-Resistance Analytics
(By aiTrendview — Educational Use Only)
________________________________________
🎯 Introduction
The Pivot Matrix & Multi Timeframe Support-Resistance Analytics indicator is designed to help traders visualize pivot points, support/resistance levels, VWAP, and volume flow analytics all in one place. Rather than giving explicit buy/sell calls, the dashboard provides reference insights so a learner may understand how different technical levels interact in real time.
This document explains its functionality step by step with formulas and usage guides.
________________________________________
1️⃣ Pivot System Logic
Pivot points are classic tools for mapping market support and resistance levels.
✦ How Calculated?
Using the Traditional Method:
• Pivot Point (PP):
PP=Highprev+Lowprev+Closeprev3PP = \frac{High_{prev} + Low_{prev} + Close_{prev}}{3}PP=3Highprev+Lowprev+Closeprev
• First Support/Resistance:
R1=2×PP−Lowprev,S1=2×PP−HighprevR1 = 2 \times PP - Low_{prev}, \quad S1 = 2 \times PP - High_{prev}R1=2×PP−Lowprev,S1=2×PP−Highprev
• Second Support/Resistance:
R2=PP+(Highprev−Lowprev),S2=PP−(Highprev−Lowprev)R2 = PP + (High_{prev} - Low_{prev}), \quad S2 = PP - (High_{prev} - Low_{prev})R2=PP+(Highprev−Lowprev),S2=PP−(Highprev−Lowprev)
• Third Levels:
R3=Highprev+2×(PP−Lowprev),S3=Lowprev−2×(Highprev−PP)R3 = High_{prev} + 2 \times (PP - Low_{prev}), \quad S3 = Low_{prev} - 2 \times (High_{prev} - PP)R3=Highprev+2×(PP−Lowprev),S3=Lowprev−2×(Highprev−PP)
• Similarly, R4/R5 and S4/S5 are extrapolated from extended range multipliers.
✦ How Used?
• Price above PP → bullish control bias.
• Price below PP → bearish control bias.
• R1–R5 levels act as resistances; S1–S5 act as supports.
Learners should watch how candles behave when approaching R/S zones to spot breakout vs. rejection conditions.
________________________________________
2️⃣ Multi Timeframe Logic
The indicator allows using daily-based pivot values (via request.security). This ensures alignment with institutional daily levels, not just intraday recalculations.
✦ Teaching Value
Understanding MTF pivots shows how markets respect higher timeframe levels (daily > intraday, weekly > daily). This helps learners grasp nested support-resistance structures.
________________________________________
3️⃣ VWAP (Volume Weighted Average Price)
Formula:
VWAPt=∑(Pricei×Volumei)∑(Volumei),Pricei=High+Low+Close3VWAP_t = \frac{\sum (Price_i \times Volume_i)}{\sum (Volume_i)}, \quad Price_i = \frac{High + Low + Close}{3}VWAPt=∑(Volumei)∑(Pricei×Volumei),Pricei=3High+Low+Close
Usage:
• VWAP is used as an institutional benchmark of fair value.
• Above VWAP = bullish flow.
• Below VWAP = bearish flow.
Learners should check whether price respects VWAP as a magnet or uses it as support/resistance.
________________________________________
4️⃣ Volume Flow Analysis
The script classifies buy volume, sell volume, and neutral volume.
• Buy Volume = if close > open.
• Sell Volume = if close < open.
• Neutral Volume = if close = open.
For daily tracking:
Buy%=DayBuyVolDayTotalVol×100,Sell%=DaySellVolDayTotalVol×100Buy\% = \frac{DayBuyVol}{DayTotalVol} \times 100, \quad Sell\% = \frac{DaySellVol}{DayTotalVol} \times 100Buy%=DayTotalVolDayBuyVol×100,Sell%=DayTotalVolDaySellVol×100
Usage for Learners:
• Dominant Buy% → accumulation/ bullish pressure.
• Dominant Sell% → distribution/ bearish pressure.
• Balanced → sideways liquidity building.
This teaches observation of order flow bias rather than relying only on price.
________________________________________
5️⃣ Dashboard Progress Bars & Colors
The script uses visual progress bars and dynamic colors for clarity. For example:
• VWAP Backgrounds: Green shades when price strongly above VWAP, Red when below.
• Volume Bars: More green blocks mean buying dominance, red means selling pressure.
This visual design turns concepts into easy-to-digest cues, useful for training.
________________________________________
6️⃣ Market Status Summary
Finally, the dashboard synthesizes all data points:
• Price vs Pivot (above or below).
• Price vs VWAP (above or below).
• Volume Pressure (buy side vs sell side).
Status Rule:
• If all three align bullish → Status box turns green.
• If mixed → Neutral grey.
• If bearish dominance → weaker tone.
Why Important?
This teaches learners that market conditions should align in confluence across indicators before confidence arises.
________________________________________
⚠️ Strict Disclaimer (aiTrendview)
The Pivot Matrix & Multi Timeframe Support-Resistance Analytics tool is developed by aiTrendview for strictly educational and research purposes.
❌ It does NOT provide buy/sell recommendations.
❌ It does NOT guarantee profits.
❌ Unauthorized use, copying, or redistribution of this code is prohibited.
⚠️ Trading Risk Warning:
• Trading involves high risk of financial loss.
• You may lose more than your capital.
• Past levels and indicators do not predict future outcomes.
This tool must be viewed as a visual education aid to practice technical analysis skills, not as trading advice.
________________________________________
✅ Now you have a step by step study guide:
• Pivot calculations explained
• VWAP with logic
• Volume breakdown
• Visual analytics
• Status confluence logic
• Disclaimer for compliance
________________________________________
⚠️ Warning:
• Trading financial markets involves substantial risk.
• You can lose more money than you invest.
• Past performance of indicators does not guarantee future results.
• This script must not be copied, resold, or republished without authorization from aiTrendview.
By using this material or the code, you agree to take full responsibility for your trading decisions and acknowledge that this is not financial advice.
________________________________________
⚠️ Disclaimer and Warning (From aiTrendview)
This Dynamic Trading Dashboard is created strictly for educational and research purposes on the TradingView platform. It does not provide financial advice, buy/sell recommendations, or guaranteed returns. Any use of this tool in live trading is completely at the user’s own risk. Markets are inherently risky; losses can exceed initial investment.
The intellectual property of this script and its methodology belongs to aiTrendview. Unauthorized reproduction, modification, or redistribution of this code is strictly prohibited. By using this study material or the script, you acknowledge personal responsibility for any trading outcomes. Always consult professional financial advisors before making investment decisions.

Volume Weighted Average Price Dynamic Slope [sgbpulse]VWAP Dynamic Slope: A Comprehensive Indicator for Trend Identification and Smart Trading
Introducing VWAP Dynamic Slope, an innovative TradingView indicator that harnesses the power of Volume Weighted Average Price (VWAP) and enhances it with immediate visual feedback. The indicator colors the VWAP line based on its slope, allowing you to quickly and easily identify the direction and strength of the current trend for the asset, providing advanced tools for in-depth analysis.
What is VWAP and Why is it so Important?
VWAP (Volume Weighted Average Price) is an indicator that represents the average price at which an asset has traded, weighted by the volume traded at each price level. Unlike a simple moving average, VWAP gives greater weight to trades executed with high volume, making it a reliable measure of the asset's "true" or "fair" price within a given period. Many institutional traders use VWAP as a central reference point for evaluating the effectiveness of entries and exits. An asset trading above its VWAP is considered to have bullish momentum, and below it – bearish momentum.
How it Works: Dynamic VWAP Slope Analysis
VWAP Dynamic Slope analyzes the inclination of the VWAP line and displays it using an intuitive color scheme:
Positive Slope (Uptrend): When the VWAP points upwards, signaling positive momentum, the default color will be green.
Negative Slope (Downtrend): When the VWAP points downwards, signaling negative momentum, the default color will be orange.
Trend Change (CHG): When a change in the VWAP's trend direction occurs, a "CHG" label will be displayed. The label's color will be green if the change is to an uptrend, and orange if the change is to a downtrend.
Identifying Steep Slopes for Increased Momentum:
The indicator's uniqueness lies in its ability to identify "steep" slopes – rapid and particularly strong changes in the VWAP's direction. This indicates exceptionally strong momentum:
Steep Positive Slope: The VWAP color will change to dark green, indicating significant buying pressure.
Steep Negative Slope: The VWAP color will change to dark red, indicating significant selling pressure.
Dynamic Momentum Strength Label: In situations of steep slope (positive or negative), a dynamic label will be displayed with the change value of the VWAP at that point. This label allows you to monitor momentum strength, intensification, or weakening in real-time.
Advanced Analytical Tools for Complete Control
VWAP Dynamic Slope provides you with unprecedented flexibility through a variety of customizable tools:
Multiple VWAP Anchors and Visual Marking:
Common Time Anchors: Choose whether the VWAP resets at the beginning of each Session (daily), Week, Month, Quarter, Year, Decade, or Century.
Advanced Intraday Anchors: Within the Session, you can choose to calculate VWAP specifically for Pre-Market, Regular Hours, and Post-Market hours. This option is particularly crucial for intraday traders.
Important Event Anchors: The indicator allows for VWAP resets at significant milestones such as Earnings, Dividends, and Splits, for analyzing the market's immediate reaction.
Visual Anchor Marking: To enhance clarity and orientation, a Label ⚓ can be displayed at each selected anchor point, helping to immediately identify the start point of the VWAP calculation in the chosen context.
Customizable Bands (Up to Three on Each Side):
Add up to three Bands above and below the VWAP to identify areas of deviation and excursion from the average price. You have two calculation options:
Standard Deviation: Based on volatility and statistical distance from the VWAP.
Percentage: Defines fixed percentage-based bands from the VWAP.
Key Pre-Market Levels (Pre-Market High/Low):
Display the Pre-Market High and Low levels as separate lines on the chart. These lines often serve as important psychological support and resistance zones, allowing you to see how the VWAP behaves near them.
Full Customization and Precise Control:
VWAP Source Selection: Determine which price data type will be used for the VWAP calculation. The default is HLC3 (average of High, Low, and Close), but any other relevant data source available in TradingView can be selected.
Offset: Set an offset for the VWAP line, allowing you to shift it left or right on the time axis by a chosen number of bars.
Customizable Colors: Choose your preferred colors for each slope state, Pre-Market High/Low lines, and Bands.
Setting the "Steepness" Threshold (Per-mille Price Change Per Minute ‱/min with Auto-Adjustment): Determine the sensitivity for identifying a steep slope by setting the required change threshold in VWAP in terms of per-mille price change per minute (‱/min). The indicator performs smart adjustment for any timeframe you select on the chart (e.g., 30 seconds, 1 minute, 5 minutes, 10 minutes, etc.), ensuring that the "steepness" setting maintains consistency and relevance.
Examples for Setting the Steepness Threshold:
Suppose you set the steepness threshold to 0.3‱/min (per-mille price change per minute).
On a 30-second chart: The indicator will check if the VWAP changed by 0.15 ‱/min (half of the per-minute threshold) within a single bar. If so, the slope will be considered steep. Explanation: Since 30 seconds is half a minute, the indicator looks for a change that is half of the threshold set for a full minute.
On a 1-minute chart: The indicator will check if the VWAP changed by 0.3 ‱/min (the full per-minute threshold) within a single bar. If so, the slope will be considered steep. Explanation: Here, the bar represents a full minute, so we check the full threshold.
On a 5-minute chart: The indicator will check if the VWAP changed by 1.5 ‱/min (5 times the per-minute threshold) within a single bar. If so, the slope will be considered steep. Explanation: A 5-minute bar contains 5 minutes, so the cumulative change in VWAP needs to be 5 times greater to be considered "steep" on the same scale.
In summary, this setting allows you to precisely and uniformly control the sensitivity of steep slope detection across all timeframes, providing immense flexibility in analyzing the asset's momentum.
Advantages of Using Per-mille Price Change Per Minute (‱/min)
Using per-mille price change per minute (‱/min) offers several key advantages for your indicator:
Normalized and Objective Measurement: It provides a uniform scale for the VWAP's rate of change, regardless of the asset's price or nominal value. A 0.1 per-mille change per minute always carries the same relative significance.
Comparison Across Different Asset Prices: Using per-mille allows for direct comparison of VWAP movement strength between assets trading at very different prices (e.g., a $100 asset versus a $1 asset), enabling an understanding of true momentum without bias from the nominal price.
Smart Timeframe Agnostic Adjustment: This is a critical capability. The indicator automatically adjusts the per-mille per minute threshold you set to any chart timeframe (30 seconds, 1 minute, 5 minutes, etc.), maintaining consistency in "steepness" detection without manual recalibration.
Precise Momentum Identification: This measurement precisely identifies when the VWAP's rate of change becomes significant, and when momentum strengthens or weakens, contributing to more informed trading decisions.
In short, per-mille change per minute (‱/min) provides accuracy, consistency, and flexibility in identifying VWAP momentum changes, with smart adaptation across all timeframes.
Who is this Indicator For?
VWAP Dynamic Slope is a powerful tool for:
Intraday Traders: For quick identification of intraday trend directions and momentum across any timeframe, with specific consideration for Pre-Market, Regular Hours, or Post-Market VWAP, and incorporating key pre-market levels.
Swing Traders and Long-Term Investors: For analyzing longer-term trends based on periodic and event-driven VWAP anchors.
Beginner Traders: As an excellent visual aid for understanding the relationship between price, volume, and trend direction, and how different anchor points, pre-market levels, and data sources influence price behavior.
Experienced Traders: For integration with existing strategies, gaining additional confirmation for trend strength identification, and highly precise and flexible parameter calibration.
VWAP Dynamic Slope provides a rich, multi-dimensional layer of information about the VWAP, helping you make more informed trading decisions in real-time, within the context of your chosen asset.

Multi VWAP [MW]Introduction
The Multi VWAP tool extends the concept of using the Anchored Volume Weighted Average Price, popularized by its founder, Brian Shannon, founder of AlphaTrends, and creates automatic AVWAPS for multiple anchor points, such as for 2-day, 3-day, 4-day, 5-day, and custom date anchors as well as automagically creating month-to-date and year-to-date anchors. Currently, most standard VWAP tools allow users to place custom anchored VWAPs, but the routine of doing this for every equity being watched can become cumbersome. This tool makes that process multi-times easier. Brian Shannon is also the author of “Maximum Trading Gains With Anchored VWAP: The Perfect Combination of Price, Time, and Volume”. Available at Amazon.
Settings
Daily VWAP : A continuous line of the the daily Volume Weighted Average Price (VWAP)
Weekly VWAP : A continuous line of the weekly VWAP
2-Day AVWAP : The anchored VWAP from 2 trading days ago (holidays and weekends are excluded in this calculation)
3-Day AVWAP : The anchored VWAP from 3 trading days ago
4-Day AVWAP : The anchored VWAP from 4 trading days ago
5-Day AVWAP : The anchored VWAP from 5 trading days ago. The slope of this line and the position of the price relative to this line can be used to determine trend direction.
10-Day AVWAP : The anchored VWAP from 10 trading days ago
Month-to-Date AVWAP : The anchored VWAP from the beginning of the current month
Year-to-Date AVWAP : The anchored VWAP from the beginning of the current year
Custom Date AVWAP : Sets a date to begin an anchored VWAP starting from any time.
Use only the most recent VWAP for Week, Month, and Year: Toggles on and off the continuous weekly, monthly, and yearly VWAPs
Calculations
This indicator does not provide buy or sell signals. It is simply the VWAP calculated starting from an “anchor point”, or start time. It is the calculated by the summation of Price x Volume / Volume for the period starting at the anchor point.
How to Interpret
According to Brian Shannon, VWAP is an objective measure of what the average trader has paid for a particular equity over a given period, and is the value that large institutional investors frequently use as a trade signal. Therefore, by definition, when the price is above an AVWAP, buyers are in control for that period of time. Likewise, if the price is below the AVWAP, sellers are in control for that period of time.
Shannon also distinguishes the importance of an increasing or decreasing 5 day VWAP, which reflects the price sentiment, objectively, for roughly the last trading week, or 5 trading days. Pricing below a decreasing 5-day VWAP is considered very bearish, while pricing above an increasing 5-day VWAP is considered bullish and is recommended before considering long positions.
Additionally, a custom VWAP can be generated to coincide with important events, such as FOMC meetings, CPI reports, earnings reports, etc.
Practically speaking, price action can tend to change direction when a significant VWAP is hit, voiding buy and sell signals. Like moving averages, this indicator can show, in real-time, how a buy or sell signal should be interpreted. A significant AVWAP line is a point of interest, and can serve as strong support or resistance, because large institutions may be using those values for entries or exits. For a great analysis of how to use AVWAP, visit the AlphaTrends channel on Youtube here or you can buy Brian Shannon’s “Anchored VWAP” book on Amazon.
Other Usage Notes and Limitations
It's important for traders to be aware of the limitations of any indicator and to use them as part of a broader, well-rounded trading strategy that includes risk management, fundamental analysis, and other tools that can help with reducing false signals, determining trend direction, and providing additional confirmation for a trade decision. Diversifying strategies and not relying solely on one type of indicator or analysis can help mitigate some of these risks.
Additionally, the indicator may take a little longer to load than usual. On the rare occasion where it fails to load, you may need to remove the indicator and add it back to your chart. Also, if you do encounter this problem, avoid redrawing your chart while the indicator is being added to the screen.
Acknowledgements
This script uses the MarketHolidays library by @Protervus. Also, for debugging, the JavaScript-style Debug Console by @algotraderdev and the TimeFormattingLibrary by @twingall were invaluable. And, of course, without Brian Shannon's books, videos, and interviews, this indicator would would not be possible.

Cumulative Volume Delta with VWAP-based Buy/Sell AlertsDescription:
This script combines Cumulative Volume Delta (CVD) with Volume Weighted Average Price (VWAP) to generate buy and sell signals. It plots both the cumulative volume delta and its moving average on the chart, but the actual buy and sell signals are now based on the crossover and crossunder of the price with the VWAP, a popular tool for tracking price relative to the volume-weighted average over time.
Features:
Cumulative Volume Delta (CVD) Plot:
CVD helps visualize the net buying or selling pressure by accumulating volume when the price is rising and subtracting it when the price is falling. The cumulative volume is plotted on the chart as a blue line.
Moving Average of CVD:
A simple moving average (SMA) of the cumulative volume delta is plotted in orange to smooth out fluctuations and help detect the trend of volume flow.
VWAP Calculation:
VWAP (Volume Weighted Average Price) is a standard benchmark widely used in trading. It gives insight into whether the price is trading above or below the average price at which most of the volume has traded, weighted by volume. The VWAP is plotted as a purple line on the chart.
Buy/Sell Signals Based on VWAP:
Buy Signal: Triggered when the price crosses above the VWAP, indicating potential upward momentum.
Sell Signal: Triggered when the price crosses below the VWAP, signaling potential downward momentum.
These signals are displayed on the chart with clear labels:
Buy Signal: A green upward label appears below the price.
Sell Signal: A red downward label appears above the price.
Alerts for Buy/Sell Conditions:
Alerts are built into the script, so traders can receive notifications when the following conditions are met:
Buy Alert: The price crosses above the VWAP.
Sell Alert: The price crosses below the VWAP.
Use Case:
This script is useful for traders looking to incorporate both volume-based indicators and the VWAP into their trading strategy. The combination of CVD and VWAP provides a more comprehensive view of both price and volume dynamics:
VWAP helps traders understand whether the price is trading above or below its volume-weighted average.
CVD highlights buying or selling pressure through cumulative volume analysis.
Customization:
Anchor Periods: The user can customize the anchor period to suit different timeframes and trading styles.
Custom Alerts: The alert conditions can be easily modified to integrate into any trader’s strategy.
This script can be adapted for both short-term and long-term trading strategies and is especially useful in high-volume markets.
How to Use:
Add the script to your TradingView chart.
Customize the timeframe and anchor period, if needed, to match your preferred trading style.
Watch for Buy/Sell signals based on price crossing the VWAP.
Set up alerts to receive notifications when Buy or Sell signals are triggered.
This script is designed to help traders make informed decisions based on both price action relative to volume and Cumulative Delta volume trends, giving a more comprehensive view of the market dynamics.
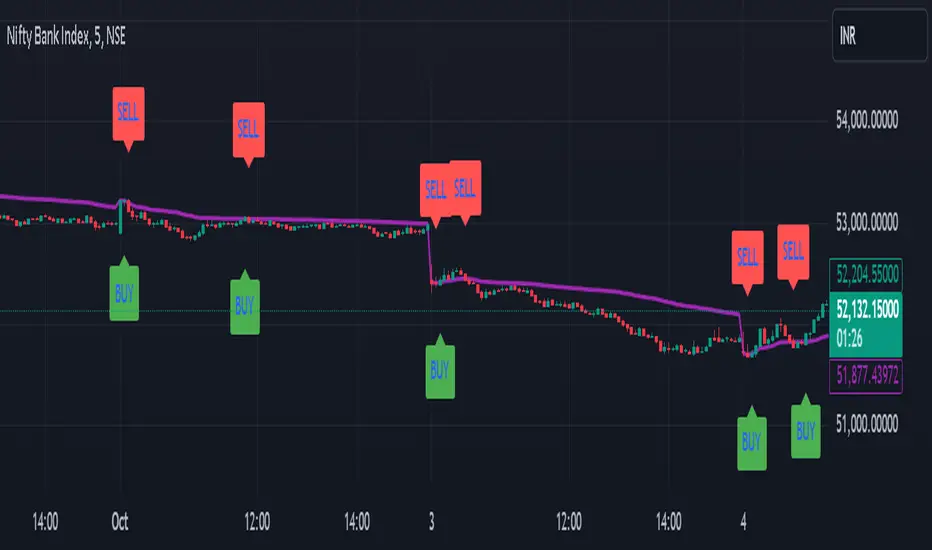
Dynamic Trend Indicator (DTI) - VWAP FilterThe Dynamic Trend Indicator (DTI) with VWAP Filter is a trend-following indicator.
It aims to identify and follow market trends while minimizing false signals in choppy or ranging markets.
The DTI combines a dynamically adjusted Exponential Moving Average (EMA) with a daily Volume Weighted Average Price (VWAP) confirmation filter and a cooldown mechanism to enhance signal reliability. This indicator is particularly useful for traders on intraday timeframes (e.g., 4-hour charts) who want to align their trades with the broader daily trend while avoiding whipsaws.
Key Features:
Dynamic Trend Line:
The core of the DTI is a trend line calculated using a custom EMA that adjusts its period dynamically based on market conditions.
The period of the EMA is determined by a combination of volatility (measured via ATR) and trend strength (measured via price momentum). In strong trends, the period shortens for faster responsiveness; in weak or ranging markets, it lengthens to reduce noise.
An optional smoothing EMA can be applied to the dynamic trend line to further reduce noise, with a user-defined smoothing length.
Daily VWAP Confirmation Filter:
A daily VWAP is calculated to provide a higher-timeframe trend bias. VWAP represents the average price paid for an asset during the day, weighted by volume, and is often used as a benchmark by institutional traders.
Buy signals are only generated when the price is above the daily VWAP (indicating a bullish daily bias), and sell signals are only generated when the price is below the VWAP (indicating a bearish daily bias).
The VWAP resets at the start of each day, ensuring it reflects the current day’s trading activity.
Cooldown Mechanism:
To prevent rapid signal reversals (whipsaws), the indicator includes a cooldown period between signals. After a buy or sell signal is generated, no new signals can be generated for a user-defined number of bars (default: 5 bars).
This helps filter out noise in choppy markets, ensuring signals are spaced out and more likely to align with significant trend changes.
Visual Elements:
Trend Line: Plotted on the chart, colored green when the price is above (uptrend) and red when below (downtrend). A gray color indicates a neutral trend.
Buy/Sell Signals: Displayed as green triangles below the bar for buy signals and red triangles above the bar for sell signals.
Background Coloring: The chart background is shaded green during uptrends and red during downtrends, providing a quick visual cue of the trend direction.
Daily VWAP Line: Optionally plotted as a purple step line, allowing traders to see the VWAP level and its relationship to the price.
Alerts:
The indicator includes built-in alerts for buy and sell signals, triggered when the price crosses the trend line and satisfies the VWAP filter and cooldown conditions.
Alert messages specify whether the signal is a buy or sell and confirm that the VWAP condition was met (e.g., "DTI Buy Signal: Price crossed above trend line and VWAP").
Input Parameters
Base Length (default: 14): The base period for calculating volatility and trend strength, used to adjust the dynamic EMA period.
Volatility Multiplier (default: 1.5): Adjusts the sensitivity of the dynamic period to market volatility (via ATR).
Trend Threshold (default: 0.5): Controls the sensitivity of the dynamic period to trend strength (via price momentum).
Use Smoothing (default: true): Enables/disables smoothing of the trend line with an additional EMA.
Smoothing Length (default: 3): The period for the smoothing EMA, if enabled.
Cooldown Bars (default: 5): The minimum number of bars between consecutive signals, reducing signal frequency in choppy markets.
Show Daily VWAP (default: true): Toggles the display of the daily VWAP line on the chart.
How It Works
Dynamic Trend Line Calculation:
Volatility is measured using the Average True Range (ATR) over the base length, scaled by the volatility multiplier.
Trend strength is calculated as the absolute price momentum (change in price over the base length) divided by the volatility factor.
The dynamic EMA period is adjusted based on the trend strength: stronger trends result in a shorter period (faster response), while weaker trends result in a longer period (more stability). The period is constrained between 5 and 50 to avoid extreme values.
A custom EMA function is used to handle the dynamic period, as Pine Script’s built-in ta.ema() requires a fixed length. The trend line is optionally smoothed with a secondary EMA.
Signal Generation:
A buy signal is generated when the price crosses above the trend line, the price is above the daily VWAP, and the cooldown period has elapsed.
A sell signal is generated when the price crosses below the trend line, the price is below the daily VWAP, and the cooldown period has elapsed.
The cooldown mechanism ensures that signals are not generated too frequently, reducing false signals in ranging markets.
Daily VWAP Calculation:
The VWAP is calculated by accumulating the price-volume product (close * volume) and total volume for the day, resetting at the start of each new day.
The VWAP is then computed as the cumulative price-volume divided by the cumulative volume, providing a volume-weighted average price for the day.
Usage
Timeframe: Best suited for intraday timeframes (e.g., 1-hour, 4-hour) where the daily VWAP provides a higher-timeframe trend bias. It can also be used on daily charts with adjustments to the cooldown period.
Markets: Works well in trending markets (e.g., forex, crypto, stocks) where the dynamic trend line can capture sustained price movements. The VWAP filter helps align signals with the daily trend, making it effective for assets with clear daily biases.
Trading Strategy:
Buy: Enter a long position when a green triangle (buy signal) appears, indicating the price has crossed above the trend line and is above the daily VWAP.
Sell: Enter a short position (or exit a long) when a red triangle (sell signal) appears, indicating the price has crossed below the trend line and is below the daily VWAP.
Use the trend line and VWAP as dynamic support/resistance levels to set stop-losses or take-profit targets.
Backtesting: Use TradingView’s strategy tester to evaluate the indicator’s performance on your chosen market and timeframe, adjusting parameters like cooldown_bars and volatility_mult to optimize for profitability.
Example
On a 4-hour SOLUSDT chart, the DTI with VWAP Filter might show:
An uptrend with the price above the green trend line and above the daily VWAP, generating buy signals as the price continues to rise.
A downtrend where the price falls below the red trend line and the daily VWAP, generating sell signals that align with the bearish daily bias.
During choppy periods, the cooldown mechanism and VWAP filter reduce false signals, ensuring trades are taken only when the price aligns with the daily trend.
Limitations
Lagging Nature: Like all trend-following indicators, the DTI may lag during sharp price reversals, as the dynamic EMA needs time to adjust.
Ranging Markets: While the VWAP filter and cooldown mechanism reduce whipsaws, the indicator may still generate some false signals in strongly ranging markets. Combining it with a trend strength filter (e.g., ADX) can help.
VWAP Dependency: The effectiveness of the VWAP filter depends on the market’s respect for the daily VWAP as a support/resistance level. In markets with low volume or erratic price action, the VWAP may be less reliable.
Potential Improvements
VWAP Buffer: Add a percentage buffer around the VWAP (e.g., require the price to be 1% above/below) to further reduce noise.
Multi-Timeframe VWAP: Incorporate a weekly VWAP for additional trend confirmation on longer timeframes.
Trend Strength Filter: Add an ADX filter to ensure signals are generated only during strong trends (e.g., ADX > 25).

StdDev of VWAP/MAStdDev Indicator (MA, Smoothed VWAP & Rolling VWAP) v5
Overview: The StdDev Indicator is a comprehensive tool designed to provide traders with multi-term deviation analysis by integrating various Moving Averages (MA) and Volume Weighted Average Price (VWAP) methodologies. This indicator combines different MA types and VWAP calculations across multiple timeframes to offer a nuanced view of market volatility and trend strength.
Key Features:
Multiple Moving Average Types:
Simple Moving Average (SMA): Calculates the average price over a specified period, providing a straightforward trend indicator.
Exponential Moving Average (EMA): Gives more weight to recent prices, making it more responsive to new information.
Weighted Moving Average (WMA): Assigns different weights to each price point, emphasizing specific periods.
Smoothed VWAP: Enhances the traditional VWAP by applying additional smoothing techniques (SMA, EMA, WMA) to reduce volatility.
Rolling VWAP: Continuously recalculates VWAP over a rolling window, offering dynamic support and resistance levels.
Multi-Term Deviation Analysis:
Extra Short Term (30 periods)
Short Term (50 periods)
Medium Term (110 periods)
Long Term (125 periods)
Extra-Long Term (190 periods)
Extremely-Long Term (245 periods)
Each term calculates the deviation of the selected price source (default: Low) from its corresponding MA or VWAP, normalized by the standard deviation. This multi-term approach allows traders to assess volatility and trend consistency across different time horizons.
Composite Upper and Lower Bounds:
Aggregates the upper and lower deviations from all terms to form composite boundaries. These bounds serve as dynamic support and resistance levels, helping traders identify potential reversal points or breakout zones.
Timeframe Customization:
Visibility Settings: Customize which deviation terms are visible on specific timeframes (15m, 1h, 4h, 1d, 1w). This flexibility ensures that the indicator aligns with your trading strategy, whether you're a scalper, day trader, or long-term investor.
Bar Coloring (Optional):
Visual Cues: When enabled, bars are color-coded based on the deviation levels, providing immediate visual feedback on market conditions. For example, bars may turn red when short-term deviations exceed the upper bound, indicating potential overbought conditions.
How It Works:
Deviation Calculation:
For each selected MA or VWAP type and term length, the indicator calculates the deviation of the current price source from the MA/VWAP. This deviation is normalized by the standard deviation to account for volatility.
Channel Offset:
Applies a linear regression and standard deviation to the deviation series to establish upper and lower channels. These channels are adjustable via multipliers, allowing traders to set their sensitivity levels.
Composite Boundaries:
Averages the upper and lower channels across all deviation terms to form composite upper and lower bounds. These bounds provide a holistic view of market volatility and trend strength.
Visualization:
Plots individual deviation lines for each term, along with the composite bounds. Optional bar coloring enhances visual interpretation, making it easier to spot significant market movements.
Usage Instructions:
Setup:
Add the StdDev Indicator to your TradingView chart. By default, it uses the Low price as the source, but this can be customized.
Configuration:
Moving Average Type: Select your preferred MA or VWAP type from the dropdown menu.
Term Lengths: Adjust the lengths for each deviation term as per your trading strategy.
StdDev Multipliers: Set the multipliers for the upper and lower bounds to control sensitivity.
Timeframe Visibility: Choose which deviation terms are visible on specific timeframes to tailor the indicator to your trading style.
Bar Coloring: Enable or disable bar coloring based on deviation thresholds for enhanced visual cues.
Interpretation:
Deviations: Monitor the deviation lines to assess overbought or oversold conditions across different terms.
Composite Bounds: Use the upper and lower bounds as dynamic support and resistance levels.
Bar Colors: Quickly identify significant market movements through color-coded bars.
Why Choose StdDev Indicator?
Comprehensive Analysis: By integrating multiple MA and VWAP types across various terms, the indicator offers a multifaceted view of market conditions.
Customization: Highly configurable settings allow traders to adapt the indicator to their specific strategies and timeframes.
Visual Clarity: Clear plotting and optional bar coloring provide intuitive insights, reducing the need for complex analysis.
Conclusion: The StdDev Indicator (MA, Smoothed VWAP & Rolling VWAP) v5 is a versatile tool that combines advanced moving average and VWAP methodologies to deliver a robust deviation analysis framework. Whether you're looking to fine-tune your scalping strategy or gain a deeper understanding of long-term market trends, this indicator equips you with the necessary tools to make informed trading decisions.
Support & Feedback: If you have any questions or need assistance with the indicator, feel free to reach out through the TradingView community or contact the script author directly.
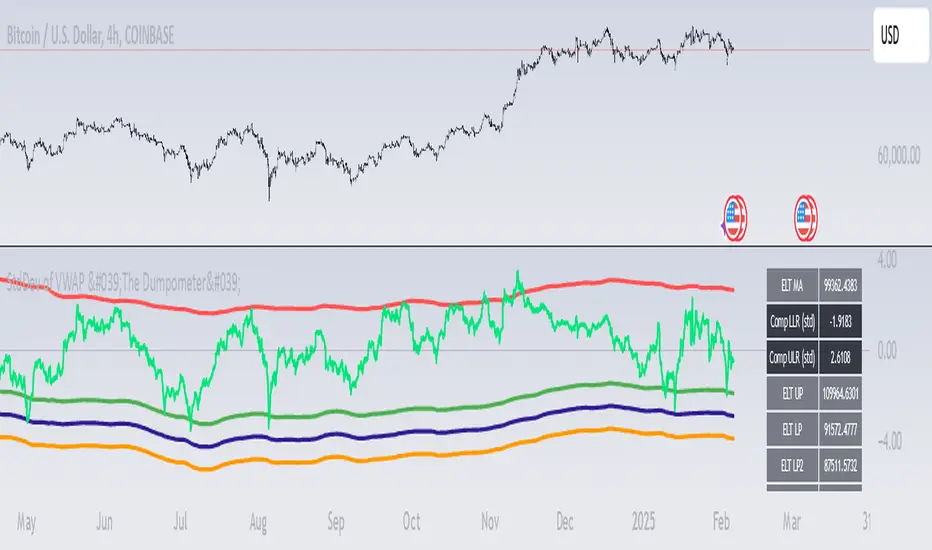
Institutional VWAP Pressure – 5M Execution With 15M HTF BiasHow Smart Money Fades Overextended Intraday Moves
Most intraday traders rely on lagging indicators, chasing breakouts or reacting emotionally to volatility spikes.
Institutional traders do the opposite: they fade inefficiencies, accumulate liquidity, and force price back toward VWAP — the intraday “fair value anchor”.
In this idea, I’ll show you how 5M execution timing combined with 15M VWAP bias creates one of the cleanest mean-reversion models you can trade.
🧩 Why VWAP Matters for Institutional Flow
Large players measure performance and position quality relative to VWAP.
When price stretches too far above or below VWAP:
liquidity becomes thin
market orders become inefficient
continuation becomes unlikely
reversion becomes the path of least resistance
This creates exploitable opportunities — if you know where to look.
⏱ Why the 5M Timeframe Is Ideal for Execution
Most intraday inefficiencies (liquidity grabs, stop runs, exhaustion wicks) occur on 1M–5M candles, not on higher timeframes.
On 5-minute, we see:
microstructure shifts
orderflow exhaustion
failed breakouts
aggressive wicks into VWAP extremes
momentum curls (stochastics turning)
These details are invisible on 15M, meaning the 5M chart is where the actual entries should be taken.
📊 Why 15M Should Be Your HTF Bias Layer
Before fading an extended move, you must know:
Is the session trending strongly?
Is VWAP sloping up or down?
Are we in a high-volume directional environment?
15M gives clarity that 5M alone cannot.
It filters out setups that would fail in trending conditions and ensures that reversion plays align with institutional behavior.
Think of 15M as your macro intraday compass.
🎯 The Institutional VWAP Pressure Setup
We use a combination of three factors:
1️⃣ VWAP Deviation Zones (Overextension)
Price must exceed a tolerance band (e.g., ±0.5%) from VWAP.
This marks inefficiencies where retail is trapped.
2️⃣ Volume Exhaustion (Weak Liquidity)
Continuation requires strong volume.
Reversion happens when volume drops below a threshold (e.g., 70% of average).
Weak volume = weak conviction = high reversion probability.
3️⃣ Momentum Reversal (Stochastics Curl)
Institutions don’t fade blindly — they wait for momentum to turn:
SHORT: Stoch turns down from high levels
LONG: Stoch turns up from depressed levels
This avoids early entries and aligns with microstructure shifts.
🔻 SHORT Conditions (5M Execution)
Price > VWAP + tolerance
Volume < 0.7 × average
Stoch turning down (momentum shift)
15M VWAP not trending strongly upward
This identifies weak, extended rallies likely to mean-revert.
🔹 LONG Conditions (5M Execution)
Price < VWAP − tolerance
Volume exhaustion (weak selling)
Stoch curling upward
15M VWAP not trending sharply downward
This captures panic-driven selling that institutions often buy.
🧠 Why This Works Consistently
Because the model isn’t based on patterns or random indicators — it’s based on how real liquidity is managed:
VWAP = institutional fair value
Extreme deviations = retail emotion
Low volume = lack of continuation
Stochastic curl = momentum turning
15M slope = session structure
You’re essentially trading the natural tendency of price to return to efficiency.
