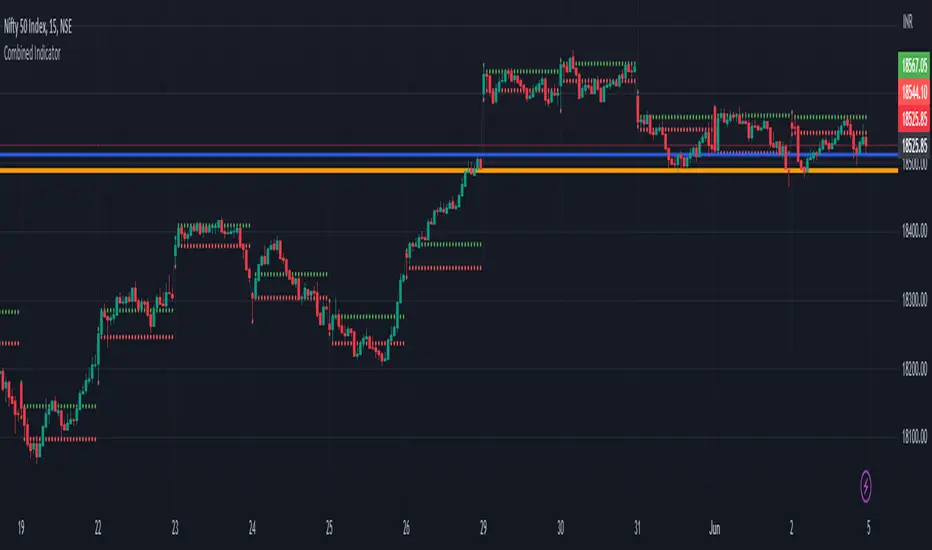
Previous Day Close and Average VWAP value, Current Day 30 min HLThe code provided is a TradingView Pine Script that creates a combined indicator consisting of two separate components:
Indicator 1: Plot Lines with VWAP
This component plots lines on the chart using two different colors and widths.
It uses a custom function f_newLine to create a new line object with a specified color and width.
It uses another custom function f_moveLine to move a line to a specific location on the chart.
The line_close line is moved to a specific date and closing price.
The line_vwap line represents the VWAP (Volume Weighted Average Price) and is plotted using the line.new function.
The VWAP calculation is performed using the typical price (average of high, low, and close) and volume.
The VWAP is plotted on the chart using the plot function.
The previous day's VWAP is also plotted and connected to the current day's VWAP with a line.
Indicator 2: 30 Min high and low breakout
This component identifies a specific time range ("0915-0945") within each trading day.
It uses the ta.valuewhen function to find the highest and lowest prices during that time range.
The highest price is stored in the high_thirtymin variable, and the lowest price is stored in the low_thirtymin variable.
These prices are plotted on the chart as circles, with green representing the high and red representing the low.
The indicator combines these two components to provide visual information about the VWAP and the high/low breakout within a specific time range. The code also includes some additional logic to handle barstate and ensure correct calculations and plotting.
Search in scripts for "VWAP"
Wick Hunter VWAP & RSIWick Hunter VWAP & RSI Script to be used to produce quality reversal entries based on VWAP with added RSI Filtering.
Wick Connect 2.0 was designed specifically to work with Wick Hunter, the lightning fast cryptocurrency trading robot that can trade for you 24/7.
Simply input your UUID and start trading automatically with Wick Hunter!
The indicator first starts with VWAP entries, with user selectable user selectable inputs to plot percentages above and below current VWAP line.
Percentage Above VWAP = Short Entry
Percentage Below VWAP = Long Entry.
Alerts will fire as soon as price crosses the VWAP Line if using "Once per bar", and may disappear after.
Alerts shown on the chart are confirmed via candle close, and as such, "Once per bar close" should be used if the user wants to only trade confirmed signals.
RSI Filtering has been added with separate RSI Values for both long and shorts which can used to filter entries.
RSI Long Min: Minimum RSI value to fire alerts.
RSI Long Max: Maximum RSI value to fire alerts.
RSI Short Min: Minimum RSI value to fire alerts.
RSI Short Max: Maximum RSI value to fire alerts.
Happy Trading.

SPY VWAPSPY VWAP adds the VWAP indicator for SPY on your current chart, and shows the current SPY VWAP level converted to ES / MES value. It uses the last close price of SPY and ES / MES to calculate the level.
By adding the regular VWAP indicator to your MES / ES chart, you will clearly see the difference between the VWAP of SPY and the futures chart. This is helpful when trading as price may respect both VWAP levels.
This indicator should only be used on ES and MES futures chart. It will behave weirdly if used on different tickers and it is not supported in the current version.

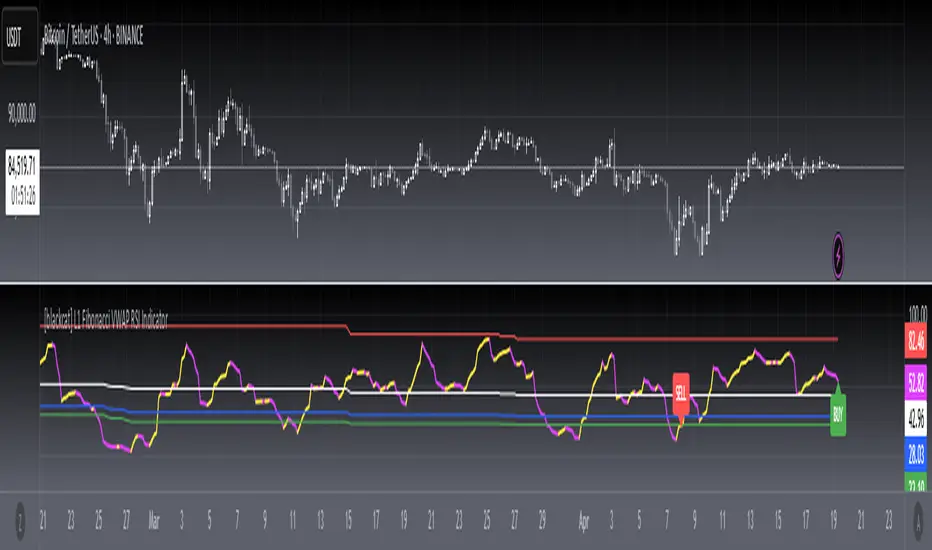
[blackcat] L1 Fibonacci VWAP RSI IndicatorLevel: 1
Background
Ingo Bucher proposed "Fibonacci RSI" in March,2003. It describes the advantages of considering Fibonacci retracement levels for use with the classic RSI indicator. Bucher reviews six charts, each displaying Fibonacci retracement levels for the RSI associated with each chart. The pine code given here will allow you to automatically recreate these charts for any security available in Tradingview. BTW, i enhanced it by changing RSI into VWAP RSI with hl2.
Function
For this Fib VWAP RSI indicator, it also applicable for original Bucher's fib concept. Bucher calculated his retracement levels by picking the RSI high and low for a given time window. In his examples, these were generally six months to a year's worth of data. Once the high and low were picked, he calculated retracement levels based on the well-known Fibonacci numbers (23.6%, 38.2%, 50%, 61.8%). This script here does the same thing. I use a "LookbackLength" (default: 400 bars), which represents a sliding data window that is used to determine the VWAP RSI high and low. The second input value controls the VWAP RSI period (default: 14 bars). The next three inputs select the retracement levels.
A total of eight different lines need to be drawn: the RSI itself, the 50% line, two retracements above the 50% point, two retracements below, and the zero and 100% lines. Pine script will create four plotlines per indicator, so I advise inserting the Fibonacci RSI twice. The first time it is inserted, leave the PlotRSI input with its default value, true. True tells pine script to plot the VWAP RSI itself. The second copy should have the input "Plot RSI" set to false. This will put the 50% line on your chart.
Inputs
LookbackLength --> Look Back Length.
RSILength --> RSI Length.
Fib1 and Fib2 --> Fibonacci lengths.
Key Signal
RawVWAPRSI --> Raw VWAP RSI output signal
Remarks
This is a Level 1 free and open source indicator.
Feedbacks are appreciated.
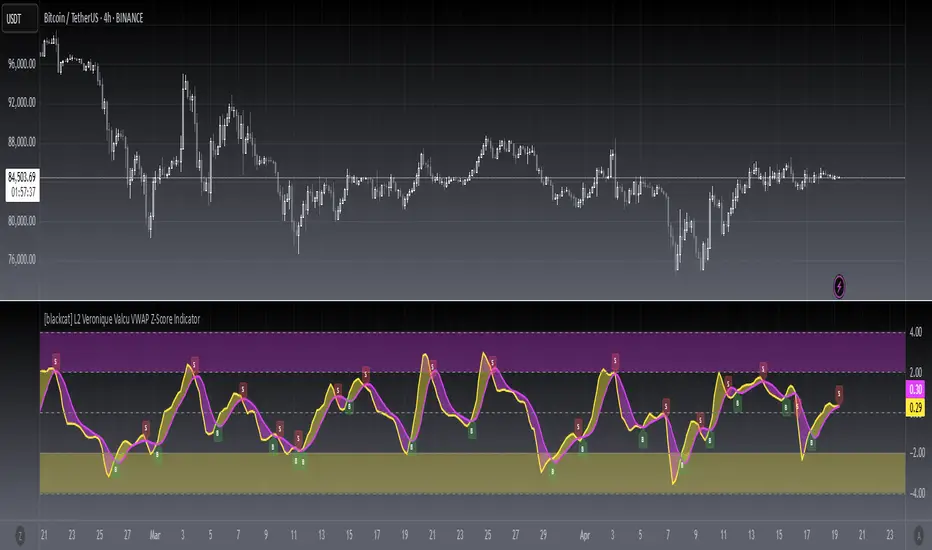
[blackcat] L2 Veronique Valcu VWAP Z-Score IndicatorLevel: 2
Background
Veronique Valcu's article "Z-Score Indicator" in Feb,2003 provided a description and commentary on a new method of displaying directional change normalized in terms of standard deviation. This indicator is realized in pine script here by using the following function code, adding vwap function, called vwap ZScore.
Function
This indicator has three input, "AvgLen", "Smooth1" and "Smooth2." Price is fixed in selected vwap price. AvgLen describes the length of the sample considered in the standard deviation calculation. Once created and verified, the function can be easily called in any indicator or strategy.
Inputs
AvgLen --> Length input for vwap Zscore.
Smooth1 and Smooth2 --> Smoothing length.
Key Signal
Curve1 --> vwap ZScore output fast signal
Curve2 --> vwap ZScore output slow signal
Remarks
This is a Level 2 free and open source indicator.
Feedbacks are appreciated.
[blackcat] L3 VWAP BMP IndicatorLevel: 3
Background
This indicator is my attempt to combine VWAP and BMP indicators.
Function
The goal is to provide a more timely entry point. I mixed up Igor Livshin's balance of market power (BMP) indicator together with vwap, can be considerably simplified for efficient implementation. If you do the math, you'll find that the raw BMP is actually equivalent to (Close-Open) / (High-Low) which can provide instant market judgement. I also filter try to filter out noise by averaging and fast-slow line to capture the shrot term and mid term status. So, it contains two input parameters to be adjusted to find proper values to adapt to different time frame and trading pairs.
Divergence and alerts are availble as well.
Inputs
FastLength --> VWAP BMP fast line length
SlowLength --> VWAP BMP slow line length
Key Signal
BMPF --> VWAP BMP fast line in yellow color
BMPS --> VWAP BMP slow line in fuchsia color
Remarks
This is a Level 3 free but closed source indicator.
Feedbacks are appreciated.

TurboVWAPoscilOscillator based on VWAP and its standard deviations. It will display VWAP as a zero line and then an indicator line showing where price is in relation to VWAP expressed as Standard Deviation units.
This indicator is based on my awesome indicator TurboVWAP, so it shares most of its features:
- you can select whether you want a rolling or an anchored VWAP as basis.
- the VWAP will auto-set itself depending on the chart timeframe, so that it will be calculated based on the period you really want, not number of bars or similar.
- you can set the indicator to auto-set session start and end times for the session-anchored VWAP depending on the futures contract selected, so you don't need to mess with times.

WOLFGATEWOLFGATE is a clean, session-aware market structure and regime framework designed to help traders contextualize price action using widely accepted institutional references. The indicator focuses on structure, momentum alignment, and mean interaction, without generating trade signals or predictions.
This script is built for clarity and decision support. It provides a consistent way to evaluate market conditions across different environments while remaining flexible to individual trading styles.
What This Indicator Displays
Momentum & Structure Averages
9 EMA — Short-term momentum driver
21 EMA — Structural control and trend confirmation
200 SMA — Primary regime boundary
400 SMA (optional) — Deep regime / macro bias reference
These averages are intended to help assess directional alignment, trend strength, and structural consistency.
Session VWAP (Institutional Mean)
Session-based VWAP with a clean daily reset
Default session: 09:30–16:00 ET
Uses HLC3 as the VWAP source for balanced price input
Rendered in a high-contrast institutional blue for visibility
VWAP can be used to evaluate mean interaction, acceptance, or rejection during the active session.
How to Use WOLFGATE
This framework is designed for context, not signals.
Traders may use WOLFGATE to:
Identify bullish or bearish market regimes
Evaluate momentum alignment across multiple time horizons
Observe price behavior relative to VWAP
Maintain directional bias during trending conditions
Avoid low-quality conditions when structure is misaligned
The indicator does not generate buy or sell signals and does not include alerts or automated execution logic.
Important Notes
Volume must be added separately using TradingView’s built-in Volume indicator
(Volume cannot be embedded directly into this script due to platform limitations.)
This script is intended for educational and analytical purposes only
No financial advice is provided
Users are responsible for their own risk management and trade decisions

SwiftEdge APEEXSwiftEdge Apeex – Volume-Weighted VWAP + Live POC + True Footprint-Precise Big Trades
This indicator combines three powerful and complementary tools used by professional traders:
1. Volume-Weighted EWMA VWAP with Dynamic Deviation Bands
A smooth, volume-weighted VWAP using an exponentially weighted moving average of variance. The deviation bands (1σ, 2σ, 3σ) dynamically expand and contract with actual market volatility — giving far more realistic support/resistance levels than fixed-percentage bands.
2. Session-Based Live Point of Control (POC)
The classic intraday POC (highest traded volume price) calculated from session start (default 09:00). Resets cleanly at your chosen session time.
3. True 1-Second Footprint-Precise Big Trade Bubbles
Unlike traditional volume spike indicators that only show "where the candle closed", this version uses real 1-second data to calculate the exact delta-weighted price where aggressive buying or selling actually occurred inside the bar.
- All levels from 1.2× to 8× average volume are shown
- Bubble size scales with significance (1.2× = tiny → 8× = huge)
- White outline on 5× and 8× for instant visual impact
- Yellow background highlights bars with significant volume
Why this combination works so well:
- VWAP + deviations give you the macro institutional reference levels
- POC shows where the market actually accepted the most volume
- The footprint-precise bubbles show you exactly where the smart money entered or absorbed — often many ticks away from the candle close
Best used on 1m to 1h timeframes on liquid futures (ES, NQ, CL) or crypto (BTC, ETH).
No lookahead. No repainting. Pure price + volume truth.

Ichimoku + VWAP + OBV + ATR Full System (NQ Daytrade)This script provides optimized scalping signals for BTC, designed mainly for the 15-minute timeframe.
Long/short entries are generated using VWAP band position and trend confirmation logic.
OBV momentum is used as a secondary filter to validate breakout or reversal conditions.
Exit signals are displayed when volatility compression or mean-reversion conditions occur.
Simple visual markers (triangles and circles) are included for easy decision-making.
롱/숏 삼각형 시그널
동그라미 청산 시그널
VWAP 밴드 기반 방향성
OBV 보조지표
이름 (Name)
BTC Scalping Signal – VWAP + OBV
짧은 설명 (Short Description)
VWAP 밴드와 OBV를 기반으로 방향성, 진입·청산 시그널을 제공하는 스캘핑 지표입니다.
긴 설명 (Long Description)
이 지표는 BTC 단기 스캘핑을 위해 설계된 것으로, 특히 15분봉 환경에 최적화되어 있습니다.
VWAP 밴드의 위치와 추세 판별 로직을 기반으로 롱·숏 진입 신호를 제공합니다.
OBV 모멘텀을 보조 필터로 사용하여 돌파 및 되돌림 가능성을 판단합니다.
시장 변동성이 축소되거나 평균회귀 신호가 감지될 때 청산 시그널을 표시합니다.
삼각형(진입), 원형(청산) 등 직관적 시각 요소를 통해 빠른 의사결정을 지원합니다.

EMA750 & VWAP Cross IndicatorA trend-following indicator that identifies high-probability entry signals based on EMA750 and VWAP crossovers.
How it works:
Monitors price position relative to EMA750 (trend filter)
Generates LONG signals when price crosses above VWAP while above EMA750
Generates SHORT signals when price crosses below VWAP while below EMA750
Highlights the FIRST signal after each EMA cross (yellow markers)
Automatically calculates targets based on recent swing highs/lows
Stop loss set at EMA750 level
Features:
✓ Visual target and stop loss levels
✓ Customizable alerts for first and all signals
✓ Real-time status dashboard
✓ Swing point detection for target calculation
✓ Signal tracking until opposite VWAP cross
Best for: Swing trading and trend-following strategies on higher timeframes.

Silver 30m HUD — Trend / Flow / PB / VWAP / TurboSilver 30m HUD is a streamlined Pine Script v5 indicator optimized exclusively for 30-minute silver futures (SIL) charts on TradingView. It displays a compact 2-column middle-right table analyzing trend, flow, momentum, pullback, VWAP, turbo, and final signals with safety stars and risk warnings. Enforces 30m timeframe usage via label alert on other periods.
Key Engines
Trend Fusion
Combines 30m (close vs SMA60) with 2H higher timeframe for UP/DOWN/FLAT consensus; MIXED on divergence. Serves as primary directional filter.
Flow Detection
Identifies volume surges (>2.2x 20-period SMA) as BULL/BEAR SURGE, else defaults to candle direction (UP/DOWN). Captures aggressive buying/selling pressure.
Momentum Composite
QQE/RSI/MFI blend: both >55 = UP, both <45 = DOWN, otherwise EXHAUST. Flags overextended moves.
Pullback Safety
Rates position vs SMA20/50: above both = OK, above 20 but below 50 = Weak, below both = Danger. Prevents chasing extended trends.
VWAP & Turbo
Price vs session VWAP (UP/DOWN); turbo flags >1% candle moves as UP/DOWN acceleration or EXHAUST.
Signals & Risk
Final Signal Logic
BUY requires UP trend + OK PB + UP VWAP + no DOWN mom; SELL needs DOWN trend + non-OK PB + DOWN VWAP; EXHAUST mom = CHOP; else WAIT.
Safety Ratings
BUY stars: 5🟩 (perfect confluence), 3🟩 (basic BUY); SELL: 4🟥 (full signal), 3🟥 (exhaustion).
Risk Alert
Triggers ⚠️ on BUY signals with 2H DOWN trend and <0.20 from resistance (distR), warning multi-timeframe conflict + overhead supply. Displays S/R levels and distances in mintick format.
HUD Layout
12-row table prioritizes scannability: metrics left (gray), statuses right (color-coded green/red/gray), bottom shows Dist to R/S, levels, and RISK. Ideal for quick 30m SIL scalping decisions balancing confluence and safety.

Momentum Permission + VWAP + RelVol (Clean)//@version=5
indicator("Momentum Permission + VWAP + RelVol (Clean)", overlay=true)
// ──────────────────────────────────────────────
// Inputs
// ──────────────────────────────────────────────
smaLength = input.int(50, "SMA Length")
relVolThresh = input.float(1.3, "Relative Volume Threshold")
// ──────────────────────────────────────────────
// Core Calculations
// ──────────────────────────────────────────────
sma50 = ta.sma(close, smaLength)
vwap = ta.vwap(close)
relVol = volume / ta.sma(volume, 10)
crossUp = ta.crossover(close, sma50)
// Trend conditions
aboveSMA = close > sma50
aboveVWAP = close > vwap
relStrong = relVol > relVolThresh
// ──────────────────────────────────────────────
// One-Time Daily Trend Permission Logic
// ──────────────────────────────────────────────
var bool permission = false
// Reset permission at start of each session
if ta.change(time("D"))
permission := false
trendStart = crossUp and aboveVWAP and relStrong and not permission
if trendStart
permission := true
// ──────────────────────────────────────────────
// Entry Trigger Logic (Breakout Continuation)
// ──────────────────────────────────────────────
entryTrigger = (
permission and
aboveSMA and
aboveVWAP and
relStrong and
close > high // breakout of prior candle high
)
// ──────────────────────────────────────────────
// Plots
// ──────────────────────────────────────────────
// Trend filters
plot(sma50, title="SMA50", color=color.orange, linewidth=2)
plot(vwap, title="VWAP", color=color.new(color.blue, 0), linewidth=2)
// Permission (one-time trend start)
plotshape(
trendStart,
title="Trend Permission",
style=shape.triangleup,
location=location.belowbar,
color=color.new(color.green, 0),
size=size.large,
text="PERMIT"
)
// Entry trigger (continuation entry)
plotshape(
entryTrigger,
title="Entry Trigger",
style=shape.triangleup,
location=location.abovebar,
color=color.new(color.aqua, 0),
size=size.normal,
text="ENTRY"
)

3rd Candle Coach – VWAP/ORB Tool3rd Candle Coach, VWAP and ORB Logic Script
This script helps you spot clean setups by checking your key conditions at the same time. It shows a simple pass or fail for each piece and prints a signal only when everything agrees.
What this script checks:
1. **3 Candle Breakouts from VWAP, Volume Weighted Average Price, or ORB, Opening Range Breakout**
* Needs two full candles above or below VWAP or ORB
* Third candle must follow in the same direction
* Marks the setup once all three confirm
2. **Trend Using EMAs, Exponential Moving Averages (9 and 21)**
* Shows if the fast EMA is above or below the slow EMA
* Can confirm if the EMAs support the trade direction
3. **Momentum Using RSI, Relative Strength Index, and MACD, Moving Average Convergence Divergence**
* RSI must clear your level for longs or shorts
* MACD must agree with the direction
4. **Volume Check, Simple and Relative Volume Comparison**
* Compares current volume to a volume moving average
* Can check relative volume for strength
5. **Higher Timeframe Trend Using HTF EMA, Higher Timeframe Exponential Moving Average**
* Shows larger trend direction for bias
6. **Session Timing Filter, Session Based Signal Control**
* Lets signals fire only inside your chosen session window
7. **ATR Extension Check, Average True Range Distance from VWAP or ORB**
* Measures how far price has stretched from VWAP or ORB using ATR units
* Blocks signals when the move is too extended
8. **Long and Short Signal Markers, Directional Trade Alerts**
* Prints a long marker when all enabled conditions pass
* Prints a short marker when all enabled conditions pass
9. **Condition Breakdown Panel, Real Time Pass or Fail Table**
* Shows pass or fail for trend, RSI, MACD, volume, relative volume, higher timeframe bias, session, and extension
10. **Explanation Labels, Signal Reasoning Summary**
* When a signal fires, a label shows which conditions triggered it
---
This script gives you a clean checklist and one clear signal only when everything lines up. It helps you see the setup form step by step and keeps your chart easy to read.
---
note:
I built this to help you spot when indicators actually agree. It is mainly a training script. Alerts on the one minute fire a lot, so turn them off or use a five minute chart. You can turn almost everything off to keep it as simple or strict as you want.

QuantumFlowTrader V1QuantumFlowTrader V1 — Adaptive Institutional Flow Framework
Overview
QuantumFlowTrader V1 is a precision-built visual tool that fuses institutional structure, dynamic volatility, and balance zones into one unified system.
It is designed to help traders align with the market’s internal flow without relying on lagging indicators or fixed settings.
Core Components
1. Adaptive EMA Clouds — Structural Flow
Layered exponential moving averages adapt to current conditions, clearly showing when market structure is aligned or in transition. Cloud color and intensity adjust automatically to reflect real-time directional bias.
2. Dynamic VWAP + Deviation Zones
Includes a self-adjusting VWAP with optional deviation bands (VWAP Deviation Zones) that reflect institutional fair-value areas — places where price often reacts, pauses, or mean-reverts.
The VWAP line shifts color based on price positioning.
3. Quantum ATR Engine — Multi-Layer Volatility Sync
A proprietary multi-ATR engine detects when volatility signals align in one direction across multiple sensitivities.
Arrows appear only on full directional agreement, signaling high-conviction flow moments.
4. Session Visualization + Arrow Filtering
Background shading highlights key trading sessions (Asia, London, USA).
You can optionally disable arrow signals during specific sessions for a cleaner view.
Features & Alerts
- Toggle EMA Clouds, VWAP, Deviation Zones, and ATR Arrows independently.
- Customize all colors, transparencies, and visual styles.
- Built-in alerts for bullish and bearish arrow signals.
Compatibility
Works on all assets: Forex, Crypto, Stocks, Indices, Futures.
Fully adaptive across all timeframes — intraday to swing.
No optimization needed — smart parameters adjust automatically.
Strategy Alignment Tip
QuantumFlowTrader V1 adapts to any trading strategy and acts as a directional compass for market flow.
It becomes especially powerful when combining multiple timeframes — for example, using the 1H and 15M charts to define trend alignment, and then executing entries on lower timeframes in the direction of that flow.
Note: Entry setups are defined by each trader’s individual system.
This indicator does not provide entry points — it highlights multi-timeframe alignment and directional bias.
To request access, contact via TradingView profile.

Hybrid -WinCAlgo/// 🇬🇧
Hybrid - WinCAlgo is a weighted composite oscillator designed to provide a more robust and reliable signal than the standard Relative Strength Index (RSI). It integrates four different momentum and volume metrics—RSI, Money Flow Index (MFI), Scaled CCI, and VWAP-RSI—into a single 0-100 oscillator.
This powerful tool aims to filter market noise and enhance the detection of trend reversals by confirming momentum with trading volume and volume-weighted average price action.
⚪ What is this Indicator?
The Hybrid Oscillator combines:
* RSI (40% Weight): Measures fundamental price momentum.
* VWAP-RSI (40% Weight): Measures the momentum of the Volume Weighted Average Price (VWAP), providing strong volume confirmation for trend strength.
* MFI (10% Weight): Measures money flow volume, confirming momentum with liquidity.
* Scaled CCI (10% Weight): Tracks market extremes and potential trend shifts, scaled to fit the 0-100 range.
⚪ Key Features
* Composite Strength: Blends four different market factors for a multi-dimensional view of momentum.
* Volume Integration: High weights on VWAP-RSI and MFI ensure that momentum signals are backed by trading volume.
* Advanced Divergence: The robust formula significantly enhances the detection of Bullish and Bearish Divergences, often providing an earlier signal than traditional oscillators.
* Customizable: Adjustable Lookback Length (N) and Individual Component Weights allow users to fine-tune the oscillator for specific assets or timeframes.
* Visual Clarity: Uses 40/60 bands for earlier Overbought/Oversold indications, with a gradient-styled background for intuitive visual interpretation.
⚪ Usage
Use Hybrid – WinCAlgo as your primary momentum confirmation tool:
* Divergence Signals: Trust the indicator when it fails to confirm new price highs/lows; this signals imminent trend exhaustion and reversal.
* Accumulation/Distribution: Look for the oscillator to rise/fall while the price is ranging at a bottom/top; this confirms hidden buying or selling (accumulation).
* Overbought/Oversold: Use the 60 band as the trigger for potential selling/shorting signals, and the 40 band for potential buying/longing signals.
* Noise Filter: Combine with a higher timeframe chart (e.g., 4H or Daily) to filter out gürültü (noise) and focus only on significant momentum shifts.
---
