Seasonality Monte Carlo Forecaster [BackQuant]Seasonality Monte Carlo Forecaster
Plain-English overview
This tool projects a cone of plausible future prices by combining two ideas that traders already use intuitively: seasonality and uncertainty. It watches how your market typically behaves around this calendar date, turns that seasonal tendency into a small daily “drift,” then runs many randomized price paths forward to estimate where price could land tomorrow, next week, or a month from now. The result is a probability cone with a clear expected path, plus optional overlays that show how past years tended to move from this point on the calendar. It is a planning tool, not a crystal ball: the goal is to quantify ranges and odds so you can size, place stops, set targets, and time entries with more realism.
What Monte Carlo is and why quants rely on it
• Definition . Monte Carlo simulation is a way to answer “what might happen next?” when there is randomness in the system. Instead of producing a single forecast, it generates thousands of alternate futures by repeatedly sampling random shocks and adding them to a model of how prices evolve.
• Why it is used . Markets are noisy. A single point forecast hides risk. Monte Carlo gives a distribution of outcomes so you can reason in probabilities: the median path, the 68% band, the 95% band, tail risks, and the chance of hitting a specific level within a horizon.
• Core strengths in quant finance .
– Path-dependent questions : “What is the probability we touch a stop before a target?” “What is the expected drawdown on the way to my objective?”
– Pricing and risk : Useful for path-dependent options, Value-at-Risk (VaR), expected shortfall (CVaR), stress paths, and scenario analysis when closed-form formulas are unrealistic.
– Planning under uncertainty : Portfolio construction and rebalancing rules can be tested against a cloud of plausible futures rather than a single guess.
• Why it fits trading workflows . It turns gut feel like “seasonality is supportive here” into quantitative ranges: “median path suggests +X% with a 68% band of ±Y%; stop at Z has only ~16% odds of being tagged in N days.”
How this indicator builds its probability cone
1) Seasonal pattern discovery
The script builds two day-of-year maps as new data arrives:
• A return map where each calendar day stores an exponentially smoothed average of that day’s log return (yesterday→today). The smoothing (90% old, 10% new) behaves like an EWMA, letting older seasons matter while adapting to new information.
• A volatility map that tracks the typical absolute return for the same calendar day.
It calculates the day-of-year carefully (with leap-year adjustment) and indexes into a 365-slot seasonal array so “March 18” is compared with past March 18ths. This becomes the seasonal bias that gently nudges simulations up or down on each forecast day.
2) Choice of randomness engine
You can pick how the future shocks are generated:
• Daily mode uses a Gaussian draw with the seasonal bias as the mean and a volatility that comes from realized returns, scaled down to avoid over-fitting. It relies on the Box–Muller transform internally to turn two uniform random numbers into one normal shock.
• Weekly mode uses bootstrap sampling from the seasonal return history (resampling actual historical daily drifts and then blending in a fraction of the seasonal bias). Bootstrapping is robust when the empirical distribution has asymmetry or fatter tails than a normal distribution.
Both modes seed their random draws deterministically per path and day, which makes plots reproducible bar-to-bar and avoids flickering bands.
3) Volatility scaling to current conditions
Markets do not always live in average volatility. The engine computes a simple volatility factor from ATR(20)/price and scales the simulated shocks up or down within sensible bounds (clamped between 0.5× and 2.0×). When the current regime is quiet, the cone narrows; when ranges expand, the cone widens. This prevents the classic mistake of projecting calm markets into a storm or vice versa.
4) Many futures, summarized by percentiles
The model generates a matrix of price paths (capped at 100 runs for performance inside TradingView), each path stepping forward for your selected horizon. For each forecast day it sorts the simulated prices and pulls key percentiles:
• 5th and 95th → approximate 95% band (outer cone).
• 16th and 84th → approximate 68% band (inner cone).
• 50th → the median or “expected path.”
These are drawn as polylines so you can immediately see central tendency and dispersion.
5) A historical overlay (optional)
Turn on the overlay to sketch a dotted path of what a purely seasonal projection would look like for the next ~30 days using only the return map, no randomness. This is not a forecast; it is a visual reminder of the seasonal drift you are biasing toward.
Inputs you control and how to think about them
Monte Carlo Simulation
• Price Series for Calculation . The source series, typically close.
• Enable Probability Forecasts . Master switch for simulation and drawing.
• Simulation Iterations . Requested number of paths to run. Internally capped at 100 to protect performance, which is generally enough to estimate the percentiles for a trading chart. If you need ultra-smooth bands, shorten the horizon.
• Forecast Days Ahead . The length of the cone. Longer horizons dilute seasonal signal and widen uncertainty.
• Probability Bands . Draw all bands, just 95%, just 68%, or a custom level (display logic remains 68/95 internally; the custom number is for labeling and color choice).
• Pattern Resolution . Daily leans on day-of-year effects like “turn-of-month” or holiday patterns. Weekly biases toward day-of-week tendencies and bootstraps from history.
• Volatility Scaling . On by default so the cone respects today’s range context.
Plotting & UI
• Probability Cone . Plots the outer and inner percentile envelopes.
• Expected Path . Plots the median line through the cone.
• Historical Overlay . Dotted seasonal-only projection for context.
• Band Transparency/Colors . Customize primary (outer) and secondary (inner) band colors and the mean path color. Use higher transparency for cleaner charts.
What appears on your chart
• A cone starting at the most recent bar, fanning outward. The outer lines are the ~95% band; the inner lines are the ~68% band.
• A median path (default blue) running through the center of the cone.
• An info panel on the final historical bar that summarizes simulation count, forecast days, number of seasonal patterns learned, the current day-of-year, expected percentage return to the median, and the approximate 95% half-range in percent.
• Optional historical seasonal path drawn as dotted segments for the next 30 bars.
How to use it in trading
1) Position sizing and stop logic
The cone translates “volatility plus seasonality” into distances.
• Put stops outside the inner band if you want only ~16% odds of a stop-out due to noise before your thesis can play.
• Size positions so that a test of the inner band is survivable and a test of the outer band is rare but acceptable.
• If your target sits inside the 68% band at your horizon, the payoff is likely modest; outside the 68% but inside the 95% can justify “one-good-push” trades; beyond the 95% band is a low-probability flyer—consider scaling plans or optionality.
2) Entry timing with seasonal bias
When the median path slopes up from this calendar date and the cone is relatively narrow, a pullback toward the lower inner band can be a high-quality entry with a tight invalidation. If the median slopes down, fade rallies toward the upper band or step aside if it clashes with your system.
3) Target selection
Project your time horizon to N bars ahead, then pick targets around the median or the opposite inner band depending on your style. You can also anchor dynamic take-profits to the moving median as new bars arrive.
4) Scenario planning & “what-ifs”
Before events, glance at the cone: if the 95% band already spans a huge range, trade smaller, expect whips, and avoid placing stops at obvious band edges. If the cone is unusually tight, consider breakout tactics and be ready to add if volatility expands beyond the inner band with follow-through.
5) Options and vol tactics
• When the cone is tight : Prefer long gamma structures (debit spreads) only if you expect a regime shift; otherwise premium selling may dominate.
• When the cone is wide : Debit structures benefit from range; credit spreads need wider wings or smaller size. Align with your separate IV metrics.
Reading the probability cone like a pro
• Cone slope = seasonal drift. Upward slope means the calendar has historically favored positive drift from this date, downward slope the opposite.
• Cone width = regime volatility. A widening fan tells you that uncertainty grows fast; a narrow cone says the market typically stays contained.
• Mean vs. price gap . If spot trades well above the median path and the upper band, mean-reversion risk is high. If spot presses the lower inner band in an up-sloping cone, you are in the “buy fear” zone.
• Touches and pierces . Touching the inner band is common noise; piercing it with momentum signals potential regime change; the outer band should be rare and often brings snap-backs unless there is a structural catalyst.
Methodological notes (what the code actually does)
• Log returns are used for additivity and better statistical behavior: sim_ret is applied via exp(sim_ret) to evolve price.
• Seasonal arrays are updated online with EWMA (90/10) so the model keeps learning as each bar arrives.
• Leap years are handled; indexing still normalizes into a 365-slot map so the seasonal pattern remains stable.
• Gaussian engine (Daily mode) centers shocks on the seasonal bias with a conservative standard deviation.
• Bootstrap engine (Weekly mode) resamples from observed seasonal returns and adds a fraction of the bias, which captures skew and fat tails better.
• Volatility adjustment multiplies each daily shock by a factor derived from ATR(20)/price, clamped between 0.5 and 2.0 to avoid extreme cones.
• Performance guardrails : simulations are capped at 100 paths; the probability cone uses polylines (no heavy fills) and only draws on the last confirmed bar to keep charts responsive.
• Prerequisite data : at least ~30 seasonal entries are required before the model will draw a cone; otherwise it waits for more history.
Strengths and limitations
• Strengths :
– Probabilistic thinking replaces single-point guessing.
– Seasonality adds a small but meaningful directional bias that many markets exhibit.
– Volatility scaling adapts to the current regime so the cone stays realistic.
• Limitations :
– Seasonality can break around structural changes, policy shifts, or one-off events.
– The number of paths is performance-limited; percentile estimates are good for trading, not for academic precision.
– The model assumes tomorrow’s randomness resembles recent randomness; if regime shifts violently, the cone will lag until the EWMA adapts.
– Holidays and missing sessions can thin the seasonal sample for some assets; be cautious with very short histories.
Tuning guide
• Horizon : 10–20 bars for tactical trades; 30+ for swing planning when you care more about broad ranges than precise targets.
• Iterations : The default 100 is enough for stable 5/16/50/84/95 percentiles. If you crave smoother lines, shorten the horizon or run on higher timeframes.
• Daily vs. Weekly : Daily for equities and crypto where month-end and turn-of-month effects matter; Weekly for futures and FX where day-of-week behavior is strong.
• Volatility scaling : Keep it on. Turn off only when you intentionally want a “pure seasonality” cone unaffected by current turbulence.
Workflow examples
• Swing continuation : Cone slopes up, price pulls into the lower inner band, your system fires. Enter near the band, stop just outside the outer line for the next 3–5 bars, target near the median or the opposite inner band.
• Fade extremes : Cone is flat or down, price gaps to the upper outer band on news, then stalls. Favor mean-reversion toward the median, size small if volatility scaling is elevated.
• Event play : Before CPI or earnings on a proxy index, check cone width. If the inner band is already wide, cut size or prefer options structures that benefit from range.
Good habits
• Pair the cone with your entry engine (breakout, pullback, order flow). Let Monte Carlo do range math; let your system do signal quality.
• Do not anchor blindly to the median; recalc after each bar. When the cone’s slope flips or width jumps, the plan should adapt.
• Validate seasonality for your symbol and timeframe; not every market has strong calendar effects.
Summary
The Seasonality Monte Carlo Forecaster wraps institutional risk planning into a single overlay: a data-driven seasonal drift, realistic volatility scaling, and a probabilistic cone that answers “where could we be, with what odds?” within your trading horizon. Use it to place stops where randomness is less likely to take you out, to set targets aligned with realistic travel, and to size positions with confidence born from distributions rather than hunches. It will not predict the future, but it will keep your decisions anchored to probabilities—the language markets actually speak.
Search in scripts for "Volatility"

ATR Squeeze BackgroundThis simple but powerful indicator shades the background of your chart whenever volatility contracts, based on a custom comparison of fast and slow ATR (Average True Range) periods.
By visualizing low-volatility zones, you can:
* Identify moments of compression that may precede explosive price moves
* Stay out of choppy, low-momentum periods
* Adapt this as a component in a broader volatility or breakout strategy
🔧 How It Works
* A Fast ATR (default: 7 periods) and a Slow ATR (default: 40 periods) are calculated
* When the Fast ATR is lower than the Slow ATR, the background is shaded in blue
* This shading signals a contraction in volatility — a condition often seen before breakouts or strong directional moves
⚡️ Why This Matters
Many experienced traders pay close attention to volatility cycles. This background indicator helps visualize those cycles at a glance. It's minimal, non-intrusive, and easy to combine with your existing tools.
🙏 Credits
This script borrows core logic from the excellent “Relative Volume at Time” script by TradingView. Credit is given with appreciation.
⚠️ Disclaimer
This script is for educational purposes only.
It does not constitute financial advice, and past performance is not indicative of future results. Always do your own research and test strategies before making trading decisions.

Circuit Breaker Table (NSE Style)🛡️ NSE Circuit Breaker Table – With Volatility-Based Band Support
This script displays a real-time circuit breaker table for any stock, showing the Upper and Lower circuit limits in a clean 2x2 grid. It’s especially useful for Indian traders monitoring NSE-listed stocks.
✅ Key Features:
📊 Upper & Lower Limits based on the previous day’s close
⚡ Optional ATR-based dynamic volatility band calculation
🎨 Customizable font sizes (Small / Medium / Large)
✅ Table neatly positioned on the top-right corner of your chart
🟢 Upper circuit shown in green, 🔴 lower circuit in red
Works on all NSE stocks and adapts automatically to charted symbols
⚙️ Customization Options:
Use static percentage bands (e.g., 10%)
Or enable ATR mode to reflect dynamic circuit potential based on recent volatility
This tool helps you stay aware of where a stock might get halted — useful for momentum traders, circuit breakout traders, and anyone monitoring volatility limits during intraday sessions.

Quantile DEMA Trend | QuantEdgeB🚀 Introducing Quantile DEMA Trend (QDT) by QuantEdgeB
🛠️ Overview
Quantile DEMA Trend (QDT) is an advanced trend-following and momentum detection indicator designed to capture price trends with superior accuracy. Combining DEMA (Double Exponential Moving Average) with SuperTrend and Quantile Filtering, QDT identifies strong trends while maintaining the ability to adapt to various market conditions.
Unlike traditional trend indicators, QDT uses percentile filtering to adjust for volatility and provides dynamic thresholds, ensuring consistent signal performance across different assets and timeframes.
✨ Key Features
🔹 Trend Following with Adaptive Sensitivity
The DEMA component ensures quicker responses to price changes while reducing lag, offering a real-time reflection of market momentum.
🔹 Volatility-Adjusted Filtering
The SuperTrend logic incorporates quantile percentile filters and ATR (Average True Range) multipliers, allowing QDT to adapt to fluctuating market volatility.
🔹 Clear Signal Generation
QDT generates clear Long and Short signals using percentile thresholds, effectively identifying trend changes and market reversals.
🔹 Customizable Visual & Signal Settings
With multiple color modes and customizable settings, you can easily align the QDT indicator with your trading strategy, whether you're focused on trend-following or volatility adjustments.
📊 How It Works
1️⃣ DEMA Calculation
DEMA is used to reduce lag compared to traditional moving averages. It is calculated by applying a Double Exponential Moving Average to price data. This smoother trend-following mechanism ensures responsiveness to market movements without introducing excessive noise.
2️⃣ SuperTrend with Percentile Filtering
The SuperTrend component adapts the trend-following signal by incorporating quantile percentile filters. It identifies dynamic support and resistance levels based on historical price data:
• Upper Band: Calculated using the 75th percentile + ATR (adjusted with multiplier)
• Lower Band: Calculated using the 25th percentile - ATR (adjusted with multiplier)
These dynamic bands adjust to market conditions, filtering out noise while identifying the true direction.
3️⃣ Signal Generation
• Long Signal: Triggered when price crosses below the SuperTrend Lower Band
• Short Signal: Triggered when price crosses above the SuperTrend Upper Band
The indicator provides signals with corresponding trend direction based on these crossovers.
👁 Visual & Custom Features
• 🎨 Multiple Color Modes: Choose from "Strategy", "Solar", "Warm", "Cool", "Classic", and "Magic" color palettes to match your charting style.
• 🏷️ Long/Short Signal Labels: Optional labels for visual cueing when a long or short trend is triggered.
• 📉 Bar Color Customization: Bar colors dynamically adjust based on trend direction to visually distinguish the market bias.
👥 Who Should Use QDT?
✅ Trend Followers: Use QDT as a dynamic tool to confirm trends and capture profits in trending markets.
✅ Swing Traders: Use QDT to time entries based on confirmed breakouts or breakdowns.
✅ Volatility Traders: Identify market exhaustion or expansion points, especially during volatile periods.
✅ Systematic & Quant Traders: Integrate QDT into algorithmic strategies to enhance market detection with adaptive filtering.
⚙️ Customization & Default Settings
- DEMA Length(30): Controls the lookback period for DEMA calculation
- Percentile Length(10): Sets the lookback period for percentile filtering
- ATR Length(14): Defines the length for calculating ATR (used in SuperTrend)
- ATR Multiplier(1.2 ): Multiplier for ATR in SuperTrend calculation
- SuperTrend Length(30):Defines the length for SuperTrend calculations
📌 How to Use QDT in Trading
1️⃣ Trend-Following Strategy
✔ Enter Long positions when QDT signals a bullish breakout (price crosses below the SuperTrend lower band).
✔ Enter Short positions when QDT signals a bearish breakdown (price crosses above the SuperTrend upper band).
✔ Hold positions as long as QDT continues to provide the same direction.
2️⃣ Reversal Strategy
✔ Take profits when price reaches extreme levels (upper or lower percentile zones) that may indicate trend exhaustion or reversion.
3️⃣ Volatility-Driven Entries
✔ Use the percentile filtering to enter positions based on mean-reversion logic or breakout setups in volatile markets.
🧠 Why It Works
QDT combines the DEMA’s quick response to price changes with SuperTrend's volatility-adjusted thresholds, ensuring a responsive and adaptive indicator. The use of percentile filters and ATR multipliers helps adjust to varying market conditions, making QDT suitable for both trending and range-bound environments.
🔹 Conclusion
The Quantile DEMA Trend (QDT) by QuantEdgeB is a powerful, adaptive trend-following and momentum detection system. By integrating DEMA, SuperTrend, and quantile percentile filtering, it provides accurate and timely signals while adjusting to market volatility. Whether you are a trend follower or volatility trader, QDT offers a robust solution to identify high-probability entry and exit points.
🔹 Key Takeaways:
1️⃣ Trend Confirmation – Uses DEMA and SuperTrend for dynamic trend detection
2️⃣ Volatility Filtering – Adjusts to varying market conditions using percentile logic
3️⃣ Clear Signal Generation – Easy-to-read signals and visual cues for strategy implementation
📌 Disclaimer: Past performance is not indicative of future results. No trading strategy can guarantee success in financial markets.
📌 Strategic Advice: Always backtest, optimize, and align parameters with your trading objectives and risk tolerance before live trading.
Volatility-Driven CandleThis indicator identifies and highlights "volatility-driven candles" on a price chart, based on their body size relative to market volatility. It calculates the Average True Range (ATR) over a 14-period window to measure volatility. A candle is considered "volatility-driven" if its body (the difference between the close and open prices) exceeds a user-defined threshold, which is specified as a multiple of the ATR.
The script distinguishes between bullish and bearish volatility-driven candles:
Bullish volatility-driven candles (where the close is greater than the open) are marked with a blue label.
Bearish volatility-driven candles (where the close is less than the open) are marked with an orange label.
Additionally, the background color of the chart is shaded:
Blue for bullish volatility-driven candles.
Orange for bearish volatility-driven candles.
This script helps traders easily spot significant price movements relative to volatility, highlighting potential reversal points based on candle body size.

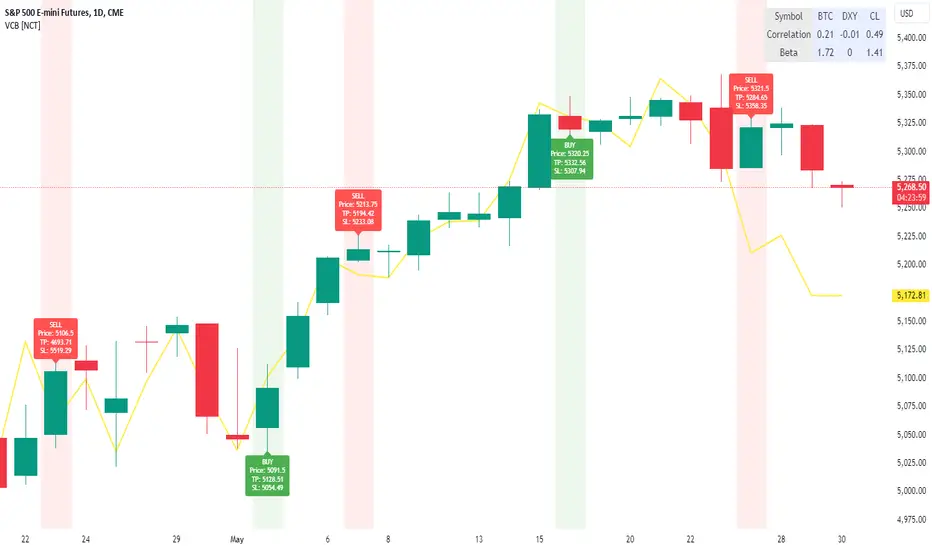
VolCorrBeta [NariCapitalTrading]Indicator Overview: VolCorrBeta
The VolCorrBeta indicator is designed to analyze and interpret intermarket relationships. This indicator combines volatility, correlation, and beta calculations to provide a comprehensive view of how certain assets (BTC, DXY, CL) influence the ES futures contract (I tailored this indicator to the ES contract, but it will work for any symbol).
Functionality
Input Symbols
BTCUSD : Bitcoin to USD
DXY : US Dollar Index
CL1! : Crude Oil Futures
ES1! : S&P 500 Futures
These symbols can be customized according to user preferences. The main focus of the indicator is to analyze how the price movements of these assets correlate with and lead the price movements of the ES futures contract.
Parameters for Calculation
Correlation Length : Number of periods for calculating the correlation.
Standard Deviation Length : Number of periods for calculating the standard deviation.
Lookback Period for Beta : Number of periods for calculating beta.
Volatility Filter Length : Length of the volatility filter.
Volatility Threshold : Threshold for adjusting the lookback period based on volatility.
Key Calculations
Returns Calculation : Computes the daily returns for each input symbol.
Correlation Calculation : Computes the correlation between each input symbol's returns and the ES futures contract returns over the specified correlation length.
Standard Deviation Calculation : Computes the standard deviation for each input symbol's returns and the ES futures contract returns.
Beta Calculation : Computes the beta for each input symbol relative to the ES futures contract.
Weighted Returns Calculation : Computes the weighted returns based on the calculated betas.
Lead-Lag Indicator : Calculates a lead-lag indicator by averaging the weighted returns.
Volatility Filter : Smooths the lead-lag indicator using a simple moving average.
Price Target Estimation : Estimates the ES price target based on the lead-lag indicator (the yellow line on the chart).
Dynamic Stop Loss (SL) and Take Profit (TP) Levels : Calculates dynamic SL and TP levels using volatility bands.
Signal Generation
The indicator generates buy and sell signals based on the filtered lead-lag indicator and confirms them using higher timeframe analysis. Signals are debounced to reduce frequency, ensuring that only significant signals are considered.
Visualization
Background Coloring : The background color changes based on the buy and sell signals for easy visualization (user can toggle this on/off).
Signal Labels : Labels with arrows are plotted on the chart, showing the signal type (buy/sell), the entry price, TP, and SL levels.
Estimated ES Price Target : The estimated price target for ES futures is plotted on the chart.
Correlation and Beta Dashboard : A table displayed in the top right corner shows the current correlation and beta values for relative to the ES futures contract.
Customization
Traders can customize the following parameters to tailor the indicator to their specific needs:
Input Symbols : Change the symbols for BTC, DXY, CL, and ES.
Correlation Length : Adjust the number of periods used for calculating correlation.
Standard Deviation Length : Adjust the number of periods used for calculating standard deviation.
Lookback Period for Beta : Change the lookback period for calculating beta.
Volatility Filter Length : Modify the length of the volatility filter.
Volatility Threshold : Set a threshold for adjusting the lookback period based on volatility.
Plotting Options : Customize the colors and line widths of the plotted elements.
Volatility Adjusted Weighted DEMA [BackQuant]Volatility Adjusted Weighted DEMA
The Volatility Adjusted Weighted Double Exponential Moving Average (VAWDEMA) by BackQuant is a sophisticated technical analysis tool designed for traders seeking to integrate volatility into their moving average calculations. This innovative indicator adjusts the weighting of the Double Exponential Moving Average (DEMA) according to recent volatility levels, offering a more dynamic and responsive measure of market trends.
Primarily, the single Moving average is very noisy, but can be used in the context of strategy development, where as the crossover, is best used in the context of defining a trading zone/ macro uptrend on higher timeframes.
Why Volatility Adjustment is Beneficial
Volatility is a fundamental aspect of financial markets, reflecting the intensity of price changes. A volatility adjustment in moving averages is beneficial because it allows the indicator to adapt more quickly during periods of high volatility, providing signals that are more aligned with the current market conditions. This makes the VAWDEMA a versatile tool for identifying trend strength and potential reversal points in more volatile markets.
Understanding DEMA and Its Advantages
DEMA is an indicator that aims to reduce the lag associated with traditional moving averages by applying a double smoothing process. The primary benefit of DEMA is its sensitivity and quicker response to price changes, making it an excellent tool for trend following and momentum trading. Incorporating DEMA into your analysis can help capture trends earlier than with simple moving averages.
The Power of Combining Volatility Adjustment with DEMA
By adjusting the weight of the DEMA based on volatility, the VAWDEMA becomes a powerful hybrid indicator. This combination leverages the quick responsiveness of DEMA while dynamically adjusting its sensitivity based on current market volatility. This results in a moving average that is both swift and adaptive, capable of providing more relevant signals for entering and exiting trades.
Core Logic Behind VAWDEMA
The core logic of the VAWDEMA involves calculating the DEMA for a specified period and then adjusting its weighting based on a volatility measure, such as the average true range (ATR) or standard deviation of price changes. This results in a weighted DEMA that reflects both the direction and the volatility of the market, offering insights into potential trend continuations or reversals.
Utilizing the Crossover in a Trading System
The VAWDEMA crossover occurs when two VAWDEMAs of different lengths cross, signaling potential bullish or bearish market conditions. In a trading system, a crossover can be used as a trigger for entry or exit points:
Bullish Signal: When a shorter-period VAWDEMA crosses above a longer-period VAWDEMA, it may indicate an uptrend, suggesting a potential entry point for a long position.
Bearish Signal: Conversely, when a shorter-period VAWDEMA crosses below a longer-period VAWDEMA, it might signal a downtrend, indicating a possible exit point or a short entry.
Incorporating VAWDEMA crossovers into a trading strategy can enhance decision-making by providing timely and adaptive signals that account for both trend direction and market volatility. Traders should combine these signals with other forms of analysis and risk management techniques to develop a well-rounded trading strategy.
Alert Conditions For Trading
alertcondition(vwdema>vwdema , title="VWDEMA Long", message="VWDEMA Long - {{ticker}} - {{interval}}")
alertcondition(vwdema

Volatility Exponential Moving AverageVEMA is a custom indicator that enhances the traditional moving average by incorporating market volatility. Unlike standard moving averages that rely solely on price, VEMA integrates both the Simple Moving Average (SMA) and the Exponential Moving Average (EMA) of the closing price, alongside a measure of market volatility.
The unique aspect of VEMA is its approach. It calculates the standard deviation of the closing price and also computes the simple moving average of this volatility. This dual approach to understanding market fluctuations allows for a more nuanced understanding of market dynamics.
Key to VEMA's functionality is the dynamic weighting factor, which adjusts the influence of SMA and EMA based on current market volatility. This factor increases the weight of the EMA, which is more responsive to recent price changes, during periods of high volatility. Conversely, during periods of lower volatility, the SMA, which offers a smoother view of price trends, becomes more prominent.
The resultant is a hybrid moving average that responds adaptively to changes in market volatility. This adaptability makes VEMA particularly useful in dynamic markets, potentially offering more insightful trend analysis and reversal signals compared to traditional moving averages.

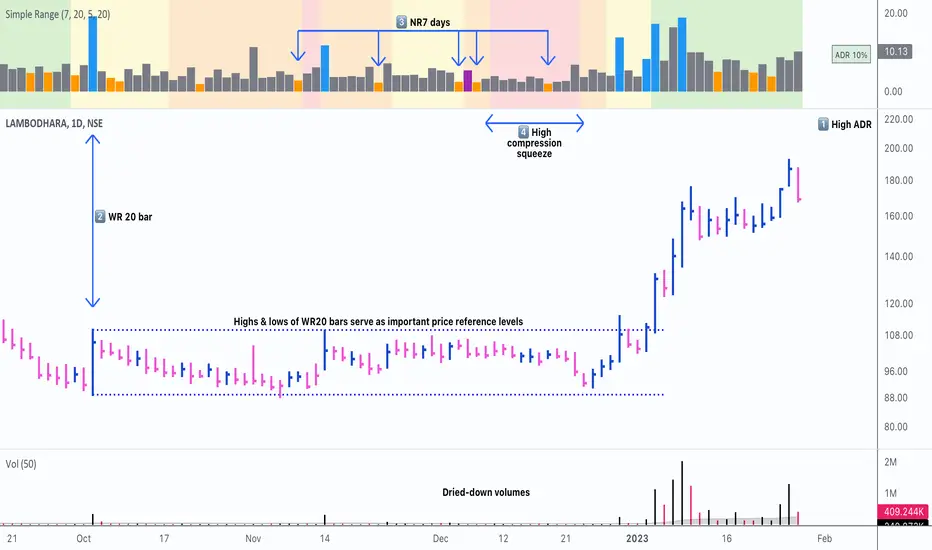
Simple RangeThe daily price range is a good proxy to judge an instrument’s volatility. I have combined multiple concepts in this indicator to display information regarding the daily price range & its volatility.
A trading period's range is simply the difference between its high and the low. This script shows the daily high-to-low range of the price as a column chart. It has 3 main components:
1. Narrow-range days (NR7) & Wide-range Days (WR20) - as plot columns
Original concept from Thomas Bulkowski
Modified from "NR4 & NR7 Indicator" script by theapextrader7
Modified from "WR - BC Identifier" script by wrpteam2020
Narrow range days mark price contractions that often precede price expansions. This script uses NR7 (narrow range 7) as a narrow-range day. This value can be changed by the user if, instead of an NR7, he or she wishes to use NR4 or NR21, or any other interval of his or her choice. NR7 is an indecisive trading day in which the range is narrower than any of the previous six days (a total of 7 days). This is a popular concept given by Thomas Bulkowski. A breakout is said to occur when price closes above the top or below the bottom of the NR7. Upside breakout of an NR 7 candle with high volumes indicates bullishness.
Similarly, highs & lows of wide-range bars (on big volumes) are also significant reference levels for price. Wide-range candle are identified by size of the body candle (open - close). The script compares the size of previous 20 candles to identify WR20 candles. This value can also be changed by the user.
The script shows NR7 & WR20 as orange & blue bars, respectively.
The user can also turn on the option to identify a big high-to-low range candle greater than a pre-defined threshold (default is 5%). These show up as green or red bars.
2. TTM Squeeze - as background
Original concept from John Carter's book "Mastering the Trade"
Based on "Squeeze Momentum Indicator" script by LazyBear
John Carter’s TTM Squeeze indicator looks at the relationship between Bollinger Bands and Keltner's Channels to help identify period of volatility contractions. Bollinger Bands being completely enclosed within the Keltner Channels is indicative of a very low volatility. This is a state of volatility contraction known as squeeze. Using different ATR lengths (1.0, 1.5 and 2.0) for Keltner Channels, we can differentiate between levels of squeeze (High, Mid & Low compression, respectively). Greater the compression, higher the potential for explosive moves.
In the script, the High, Mid & Low compression squeezes are depicted via the background color being red, orange, or yellow, respectively.
3. Average Daily Range - as table
Original idea by alpine_trader
Modified from "ADR% - Average Daily Range % by MikeC" script by TheScrutiniser
Average Day Range (ADR) tells how much the price moves between the high and low on a given day. This is the day Range, which is then averaged to create ADR. The script uses an average of the last 20 days to calculate the ADR. Unlike ATR (Average True Range), this excludes Gaps.
The script displays the ADR as a % value in a table.
If you want to find stocks that move a lot on an average on most days, then look for stocks that have ADR% of 5% or more.
If you prefer lower volatility stocks, focus on stocks with lower ADR% values, such as 2% or less.
How it comes together
For a bullish "momentum burst", or a velocity trade:
Select stocks with Average Day Range % (ADR) greater than 5
Identify significant reference price levels via highs & lows of WR20 bars (on big volumes)
Wait for a decent mid-to-high compression squeeze
Look for clusters of NR7 candles in the consolidation
Any breakout from this consolidation should be accompanied by more than average (preferably pocket pivot) volumes
ADR(20)% - Qullamagi (corner value) v6This indicator displays the 20-bar Average Daily Range (ADR) either as a percentage of price or in raw dollar terms, shown in a clean corner box on the chart.
Switch between % ADR and $ ADR with a single checkbox.
Place the output box in any chart corner.
Useful for volatility assessment, stop-loss sizing, and stock selection.
Inspired by the trading approach of Kristjan Qullamägi (Qullamaggie), who uses ADR(20) both to filter high-momentum stocks and to size risk (stops should generally be ≤ 1×ADR).

Frahm Factor Position Size CalculatorThe Frahm Factor Position Size Calculator is a powerful evolution of the original Frahm Factor script, leveraging its volatility analysis to dynamically adjust trading risk. This Pine Script for TradingView uses the Frahm Factor’s volatility score (1-10) to set risk percentages (1.75% to 5%) for both Margin-Based and Equity-Based position sizing. A compact table on the main chart displays Risk per Trade, Frahm Factor, and Average Candle Size, making it an essential tool for traders aligning risk with market conditions.
Calculates a volatility score (1-10) using true range percentile rank over a customizable look-back window (default 24 hours).
Dynamically sets risk percentage based on volatility:
Low volatility (score ≤ 3): 5% risk for bolder trades.
High volatility (score ≥ 8): 1.75% risk for caution.
Medium volatility (score 4-7): Smoothly interpolated (e.g., 4 → 4.3%, 5 → 3.6%).
Adjustable sensitivity via Frahm Scale Multiplier (default 9) for tailored volatility response.
Position Sizing:
Margin-Based: Risk as a percentage of total margin (e.g., $175 for 1.75% of $10,000 at high volatility).
Equity-Based: Risk as a percentage of (equity - minimum balance) (e.g., $175 for 1.75% of ($15,000 - $5,000)).
Compact 1-3 row table shows:
Risk per Trade with Frahm score (e.g., “$175.00 (Frahm: 8)”).
Frahm Factor (e.g., “Frahm Factor: 8”).
Average Candle Size (e.g., “Avg Candle: 50 t”).
Toggles to show/hide Frahm Factor and Average Candle Size rows, with no empty backgrounds.
Four sizes: XL (18x7, large text), L (13x6, normal), M (9x5, small, default), S (8x4, tiny).
Repositionable (9 positions, default: top-right).
Customizable cell color, text color, and transparency.
Set Frahm Factor:
Frahm Window (hrs): Pick how far back to measure volatility (e.g., 24 hours). Shorter for fast markets, longer for chill ones.
Frahm Scale Multiplier: Set sensitivity (1-10, default 9). Higher makes the score jumpier; lower smooths it out.
Set Margin-Based:
Total Margin: Enter your account balance (e.g., $10,000). Risk auto-adjusts via Frahm Factor.
Set Equity-Based:
Total Equity: Enter your total account balance (e.g., $15,000).
Minimum Balance: Set to the lowest your account can go before liquidation (e.g., $5,000). Risk is based on the difference, auto-adjusted by Frahm Factor.
Customize Display:
Calculation Method: Pick Margin-Based or Equity-Based.
Table Position: Choose where the table sits (e.g., top_right).
Table Size: Select XL, L, M, or S (default M, small text).
Table Cell Color: Set background color (default blue).
Table Text Color: Set text color (default white).
Table Cell Transparency: Adjust transparency (0 = solid, 100 = invisible, default 80).
Show Frahm Factor & Show Avg Candle Size: Check to show these rows, uncheck to hide (default on).

OA - Sigma BandsDescription:
The OA - Sigma Bands indicator is a fully adaptive, volatility-sensitive dynamic band system designed to detect price expansion and potential breakouts. Unlike traditional fixed-width Bollinger Bands, OA - Sigma Bands adjust their boundaries based on a combination of standard deviation (σ) and Average Daily Range (ADR), making them more responsive to real market behavior and shifts in volatility.
Key Concepts & Logic
This tool constructs three distinct band regions:
Sigma Bands (±σ):
Calculated using the standard deviation of the closing price over a user-defined lookback period. This acts as the core volatility filter to identify statistically significant price deviations.
ADR Zones (±ADR):
These zones provide an additional layer based on the percentage average of daily price ranges over the last 20 bars. They help visualize intraday or short-term expected volatility.
Dynamic Adjustment Logic:
When price breaks outside the upper/lower sigma or ADR boundaries for a defined number of bars (user input), the system recalibrates. This ensures that the bands evolve with volatility and don’t remain outdated in trending markets.
Inputs & Customization
Sigma Multiplier: Set how wide the sigma bands should be (default: 1.5).
Lookback Period: Controls how many bars are used to calculate the standard deviation (default: 200).
Break Confirmation Bars: Determines how many candles must close beyond a boundary to trigger band recalibration.
ADR Period: Internally fixed at 20 bars for stable short-term volatility measurement.
Full Color Customization: Customize the band colors and fill transparency to suit your chart style.
Benefits & Use Cases
Breakout Trading: Detect when price exits statistically significant ranges, confirming trend expansion.
Mean Reversion: Use the outer bands as potential reversion zones in sideways or low-volatility markets.
Volatility Awareness: Visually identify when price is compressed or expanding.
Dynamic Structure: The auto-updating nature makes it more reliable than static historical zones.
Overlay-Ready: Designed to sit directly on price charts with minimal clutter.
Disclaimer
This script is intended for educational and informational purposes only. It does not constitute investment advice, financial guidance, or a recommendation to buy or sell any security. Always perform your own research and apply proper risk management before making trading decisions.
If you enjoy this script or find it useful, feel free to give it or leave a comment!

Harmony in Havoc - The Entropy of VoVix Harmony in Havoc – The Entropy of VoVix
There are moments in the market when chaos and order are not opposites, but partners in a dance.
Harmony in Havoc is not just an indicator—it’s a window into that dance.
Most tools try to tame the market by smoothing it, boxing it in, or chasing after what’s already happened. This script does the opposite: it listens for the music beneath the noise, the rare moments when volatility and unpredictability align, and the market’s next movement is about to begin.
What is Harmony in Havoc?
VoVix Spike:
The pulse of volatility-of-volatility. Not just how much the market is moving, but how violently its own heartbeat is changing.
Entropy:
A real-time measure of surprise. When entropy is high, the market is not just moving—it’s breaking its own patterns, rewriting its own rules.
Progression Bar & Status:
The yellow bar is your visual gauge of tension. As it fills, the market is winding up.
Wait: The world is calm.
Get ready!: The storm is building.
Take Action!!: The probability of a regime eruption is at its peak.
Yellow Background:
When the background glows, the market is at its most unstable—this is not a buy or sell signal, but a quant alert.
How does it work?
Every tick, Harmony in Havoc measures the distance between the market’s current volatility and its own unpredictability. When the VoVix spike approaches or exceeds the entropy threshold, the system knows:
“This is the moment when the improbable becomes possible.”
Why is this different?
It doesn’t tell you what to do.
It doesn’t chase price.
It doesn’t care about trends, bands, or the past.
Instead, it gives you a quantitative sense of anticipation—a way to see when the market is most likely to break from its own history, and when the edge is at its sharpest.
How to use it:
Watch for the yellow background and “Take Action!!” status.
Use it as a regime filter, a volatility dashboard, or a warning system for your own strategies.
Tune the inputs for your asset and timeframe—make it your own.
Inputs—explained for you:
VoVix Fast/Slow ATR & Stdev:
Control how sensitive the system is to volatility shocks. Lower = more signals, higher = only the rarest events.
Entropy Window & Bins:
Control how “surprised” the entropy engine is by current volatility. Shorter window = more responsive, more bins = finer detail.
Show/Hide Controls:
Toggle the VoVix spike, entropy line, and their glows to customize your visual experience.
Bottom line:
This is not a buy or sell script.
This is a quant regime detector for those who want to feel the market’s tension—to sense when harmony and havoc are about to collide.
Disclaimer:
Trading is risky. This script is for research and informational purposes only, not financial advice. Backtest, paper trade, and know your risk before going live. Past performance is not a guarantee of future results.
*I've only tested this on 1 and 5 min frames.
Use with discipline. Trade your edge.
— Dskyz, for DAFE Trading Systems
3 days ago
Release Notes
* Now mobile friendly. I've added a toggle to switch the dashboard on/off, and added a mobile information line that shows the same information on the dashboard. This is to allow the script to stay visually in balance and this also has a toggle.
* Background color added that coresponds with Buy or Sell areas.

ConeCastConeCast is a forward-looking projection indicator that visualizes a future price range (or "cone") based on recent trend momentum and adaptive volatility. Unlike lagging bands or reactive channels, this tool plots a predictive zone 3–50 bars ahead, allowing traders to anticipate potential price behavior rather than merely react to it.
How It Works
The core of ConeCast is a dynamic trend-slope engine derived from a Linear Regression line fitted over a user-defined lookback window. The slope of this trend is projected forward, and the cone’s width adapts based on real-time market volatility. In calm markets, the cone is narrow and focused. In volatile regimes, it expands proportionally, using an ATR-based % of price to scale.
Key Features
📈 Predictive Cone Zone: Visualizes a forward range using trend slope × volatility width.
🔄 Auto-Adaptive Volatility Scaling: Expands or contracts based on market quiet/chaotic states.
📊 Regime Detection: Identifies Bull, Bear, or Neutral states using a tunable slope threshold.
🧭 Multi-Timeframe Compatible: Slope and volatility can be calculated from higher timeframes.
🔔 Smart Alerts: Detects price entering the cone, and signals trend regime changes in real time.
🖼️ Clean Visual Output: Optionally includes outer cones, trend-trail marker, and dashboard label.
How to Use It
Use on 15m–4H charts for best forward visibility.
Look for price entering the cone as a potential trend continuation setup.
Monitor regime changes and volatility expansion to filter choppy market zones.
Tune the slope sensitivity and ATR multiplier to match your symbol's behavior.
Use outer cones to anticipate aggressive swings and wick traps.
What Makes It Unique
ConeCast doesn’t follow price — it predicts a possible future price envelope using trend + volatility math, without relying on lagging indicators or repainting logic. It's a hybrid of regression-based forecasting and dynamic risk zoning, designed for swing traders, scalpers, and algo developers alike.
Limitations
ConeCast projects based on current trend and volatility — it does not "know" future price. Like all projection tools, accuracy depends on trend persistence and market conditions. Use this in combination with confirmation signals and risk management.

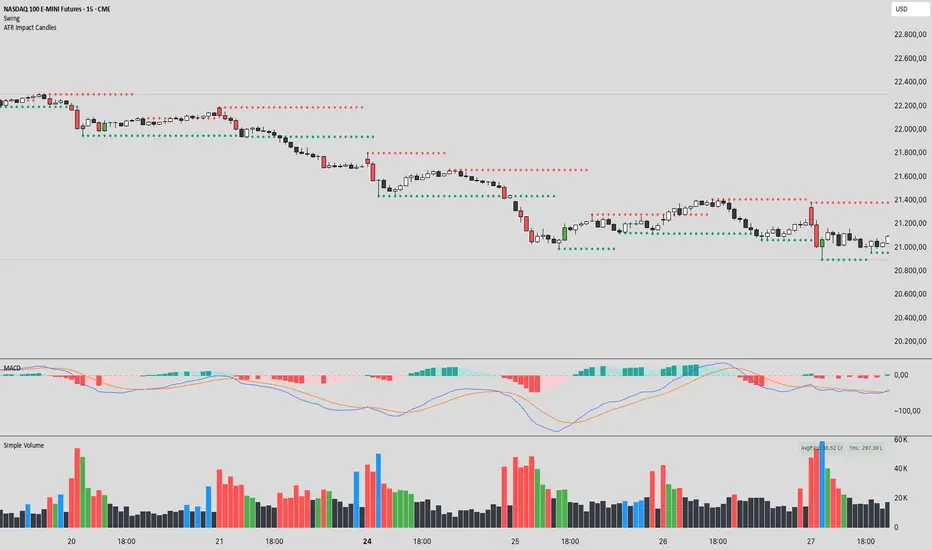
ATR Impact CandlesATR Impact Candles: Simplify Your Trading with Pure Price Action
You don’t need dozens of cluttered indicators to catch what really matters. With ATR Impact Candles, you get a powerful, single-tool solution that cuts through the noise by focusing on what truly drives the market: price action and volatility. This indicator highlights only those candlesticks that pack a punch—showing you when the market’s range is exceptionally strong relative to its recent behavior. Whether you’re a scalper or a swing trader, ATR Impact Candles empowers you to time your entries and exits with confidence, letting you trade based on real market momentum.
⸻
Indicator Overview
The indicator is designed for TradingView and is implemented in Pine Script (version 5). Its primary purpose is to highlight specific candles that meet a defined volatility condition based on the Average True Range (ATR). Instead of modifying every candle’s appearance, the indicator only changes the color of those “signal” candles that exceed a user-defined multiple of the ATR. The rest of the candles remain in their traditional black and white appearance—preserving the classic candlestick chart look.
⸻
Key Features
1. ATR-Based Signal Identification:
• ATR Calculation:
The indicator calculates the ATR using a configurable lookback period (default is 14 periods). The ATR is a common volatility measure that reflects the average range of price movement.
• Threshold Condition:
A candle is flagged as a signal if its range (high minus low) meets or exceeds a specified multiple (the “ATR Factor”) of the ATR. By default, this factor is set to 2, meaning any candle whose range is at least twice the ATR is considered significant.
2. Dynamic Candle Coloring:
• Signal Candles:
• When a candle meets the ATR threshold condition:
• Up Candles: are colored green.
• Down Candles: are colored red.
• Non-Signal Candles:
• Candles that do not meet the threshold condition retain their classic appearance:
• Up candles are white.
• Down candles are black.
3. User Configurability:
• ATR Period:
Traders can adjust the ATR period to tailor the volatility measure to different markets or timeframes.
• ATR Factor:
The multiple of the ATR that defines a signal candle is also configurable, giving flexibility to experiment with different thresholds for what constitutes “significant” price movement.
• Overlay Display:
The indicator runs in overlay mode on the chart, meaning it directly affects the appearance of the candlestick bars without interfering with other chart elements.
4. Additional Visual Aid:
• Threshold Line Plot:
The script optionally plots a line representing the ATR multiplied by the chosen factor. This line serves as a visual benchmark on the chart, allowing traders to see at what level the ATR threshold lies relative to the price action.
⸻
How It Works
1. ATR Calculation:
The indicator first calculates the Average True Range (ATR) for the defined period. This value is updated for each new candle.
2. Range Comparison:
For each candle, the indicator calculates the range (high - low) and compares it to the threshold, which is the ATR multiplied by the user-defined factor.
3. Conditional Coloring:
• If the Candle’s Range ≥ (ATR * Factor):
• The candle is marked as a “signal candle.”
• Its color is set to green if it is an up candle (close is greater than or equal to open) or red if it is a down candle.
• Otherwise:
• The candle retains its classic look, with up candles in white and down candles in black.
4. Chart Display:
By applying these rules to every candle, the indicator visually emphasizes those moments when the market shows unusually large price movements relative to its recent average volatility. This helps traders quickly spot potential breakouts or reversals.
⸻
Practical Applications
• Volatility Breakouts:
Identify candles that may signal the start of a breakout or strong reversal.
• Risk Management:
Adjust stop-loss levels or position sizes when unusually volatile candles are detected.
• Signal Confirmation:
Combine with other technical indicators or chart patterns to reinforce entry or exit decisions.
⸻
ATR Impact Candles is your essential, no-nonsense tool for filtering out market noise and focusing solely on significant price action. Simplify your trading decisions and harness the power of volatility with one clear, effective indicator.
Volatility and Tick Size DataThis indicator, titled "Tick Information & Standard Deviation Table," provides detailed insights into market microstructure, including tick size, point value, and standard deviation values calculated based on the True Range. It helps visualize essential trading parameters that influence transaction costs, risk management, and portfolio performance, including volatility measures that can guide investment strategies.
Why These Data Points Are Important for Portfolio Management
Tick Size and Point Value:
Tick size refers to the smallest possible price movement in a given asset. It defines the granularity of the price changes, affecting how precise the market price can be at any moment. Point value reflects the monetary value of a single price movement (one tick). These two data points are essential for understanding transaction costs and for evaluating how much capital is at risk per price movement. Smaller tick sizes may lead to more efficient pricing in high-frequency trading strategies (Hasbrouck, 2009).
Reference: Hasbrouck, J. (2009). Empirical Market Microstructure. Foundations and Trends® in Finance, 3(4), 169-272.
Standard Deviations and Volatility:
Standard deviation measures the variability or volatility of an asset's price over a set period. This data point is critical for portfolio management, as it helps to quantify risk and predict potential price movements. True Range and its standard deviations provide a more comprehensive measure of market volatility than just price fluctuations, as they include gaps and extreme price changes. Investors use volatility data to assess the potential risk and adjust portfolio allocations accordingly (Ang, 2006).
Reference: Ang, A. (2006). Asset Management: A Systematic Approach to Factor Investing. Oxford University Press.
Risk Management:
The ability to quantify risk through metrics like the 1st, 2nd, and 3rd standard deviations of the true range is essential for implementing risk controls within a portfolio. By incorporating volatility data, portfolio managers can adjust their strategies for different market conditions, potentially reducing exposure to high-risk environments. These volatility measures help in setting stop-loss levels, optimizing position sizes, and managing the portfolio’s overall risk-return profile (Black & Scholes, 1973).
Reference: Black, F., & Scholes, M. (1973). The Pricing of Options and Corporate Liabilities. Journal of Political Economy, 81(3), 637-654.
Portfolio Diversification and Hedging:
Understanding asset volatility and transaction costs is critical when constructing a diversified portfolio. By using the standard deviations from this indicator, investors can better identify assets that may provide diversification benefits, potentially reducing the overall portfolio risk. Moreover, the point values and tick sizes help assess the cost-effectiveness of various assets, enabling portfolio managers to implement more efficient hedging strategies (Markowitz, 1952).
Reference: Markowitz, H. (1952). Portfolio Selection. The Journal of Finance, 7(1), 77-91.
Conclusion
The Tick Information & Standard Deviation Table provides critical market data that informs the risk management, diversification, and pricing strategies used in portfolio management. By incorporating tick size, point value, and volatility metrics, investors can make more informed decisions, better manage risk, and optimize the returns on their portfolios. The data serves as an essential tool for aligning asset selection and portfolio allocations with the investor's risk tolerance and market conditions.
VIX-Heatmap [CrossTrade]The "VIX-Heatmap" is a sophisticated and informative indicator designed for traders who want to integrate volatility analysis into their trading strategy, especially focusing on the market's fear gauge, the VIX (Volatility Index). This tool is not just about plotting numbers; it's about visualizing market sentiment in a more intuitive and impactful way.
Key Features and Customization Options:
1. Primary Functionality:
At its core, the VIX-Heatmap tracks the daily closing price of the VIX. It provides a clear, line-based visualization, with the line color set to black for stark contrast and easy visibility.
2. Segmented Volatility Levels:
The indicator allows users to set multiple VIX levels: Danger Zone (super low VIX level), and Levels 1 through 5. These levels are represented as horizontal lines on the chart, offering a structured view of different volatility thresholds.
3. Customizable Thresholds:
Traders can input their preferred values for each level, tailoring the indicator to fit their perception of market risk and volatility. This customization makes the tool versatile for different trading styles and market conditions.
4. Heatmap Visualization:
The chart's background color changes based on the VIX level, creating a "heatmap" effect. This visual representation allows traders to quickly gauge the current market sentiment. The color intensity varies from white (for extremely low VIX values) through various shades of red, increasing in intensity with higher VIX levels. This gradient provides an immediate visual cue of rising or falling market anxiety.
5. Interactive Display:
The indicator includes an interactive table display at the bottom center of the chart that shows the current VIX level in large, bold text, ensuring that it catches the trader's eye.
6. Optional Background Coloring:
Users have the option to enable or disable the heatmap feature. When enabled, the chart's background reflects the VIX level with the corresponding color, enhancing the visual impact of the data.
Applications and Benefits:
The VIX-Heatmap is ideal for traders who base their decisions not only on price movements but also on market sentiment and volatility. Its color-coded heatmap approach simplifies the interpretation of the VIX data, making it accessible even to those who may not be deeply familiar with volatility indices. By offering a quick visual summary of current market fear levels, it aids in making informed decisions, especially in times of market uncertainty.
In summary, the VIX-Heatmap transforms the traditional VIX data into an interactive, visually engaging, and easy-to-interpret format.

Custom ATR Trailing StopThis Script creates a custom ATR (Average True Range) trailing stop. It allows traders to set up automated stop-loss levels based on the ATR, which adjusts dynamically to market volatility. The script is designed to support both long and short trades, offering flexibility and precision in trade management.
When loading the indicator to your chart, simply click to set the trade begining time, confirm various settings and you are set.
Check tooltips for more details in the input settigns menu.
User Inputs
Trade Setup: Allows users to set the trade direction (Long or Short), the signal source for entries, and the specific bar time for the trade setup.
ATR Settings: Configurable ATR lookback period, ATR smoothing period, initial ATR multiplier for setting the stop-loss, breakeven ATR multiplier, and a manual breakeven level.
ATR Calculations
Computes the ATR and its moving average.
Determines initial and breakeven stop levels based on the ATR.
Signal Validation
Validates long or short trade signals based on the specified bar time and trade direction.
Triggers alerts when a valid trade signal is detected.
Trailing Stop Logic
For long trades, adjusts the stop-loss level dynamically based on the ATR.
For short trades, performs similar adjustments in the opposite direction.
Updates the trailing stop level to ensure it follows the price, moving closer as the price moves favorably.
Resets the trade state when the stop-loss is hit, triggering an alert.
Plotting
Plots the trailing stop levels on the chart.
Uses green for stop levels indicating profit and red for stop levels indicating a loss.

0_dteUSAGE
This script guages the probability of an underlying moving a certain amount on expiration day, to aid the popular "0 dte" strategy. The script counts how many next-day moves exceeded a given magnitude in the past, under similar conditions. The inputs are:
mark_mode:
- "open": measures the magnitude as "open to close"--a true 0 dte.
- "previous close": for lazy people who don't want to wake up early. measures magnitude from the previous day's close.
move_mode:
- "percent": measures moves that exceed a given percentage.
- "absolute": measures moves that exceed a point value.
move-dir: measure only up moves, down moves, or both.
vol_model: the model for realized volatility. (may add more later).
min_vol: only measure moves when realized vol is above this value.
max_vol: only measure moves when realized vol is below this value.
precision: number of digits printed in the output table.
EXAMPLE:
- mark_mode: "previous close"
- move_mode: "percent"
- move_dir: "up"
- move_mag: 0.07
- vol_model: hv30
- min_vol: 0.2
- max_vol: 0.5
These settings will count the number of trading days that closed 7% higher than the previous day's close, when the previous day's realized volatility (annualized) was between 20% and 50%. The outputs are:
- current vol: green plot. Today's realized vol. Shown for convenience.
- max and min vol: red plots. Also shown for convenience.
- count: the number of days that exceeded the chosen magnitude, when the previous day's realized volatility was within the chosen bounds.
- total: the total number of days where realized volatility was within the chosen bounds
- probability: count / total. the percentage of days that exceeded the move when volatility was within the bounds.
- move: plotted as a purple line. purple "X" labels are plotted above
- bars where the move exceeded the magnitude threshold and volatility was in-bounds. a "hit".
CONCLUSION
This script is based on the idea that realized volatility has some bearing on future volatility. By seeing what happened in the past when volatility was close to its current value, we may be able to assess the probability that our short put will be in the money, tomorrow, and our account devastated.
NOTE: Unlike many of my other scripts, all percentages--both inputs and outputs--are given in fractional form. E.g., 0.01 means 1%.

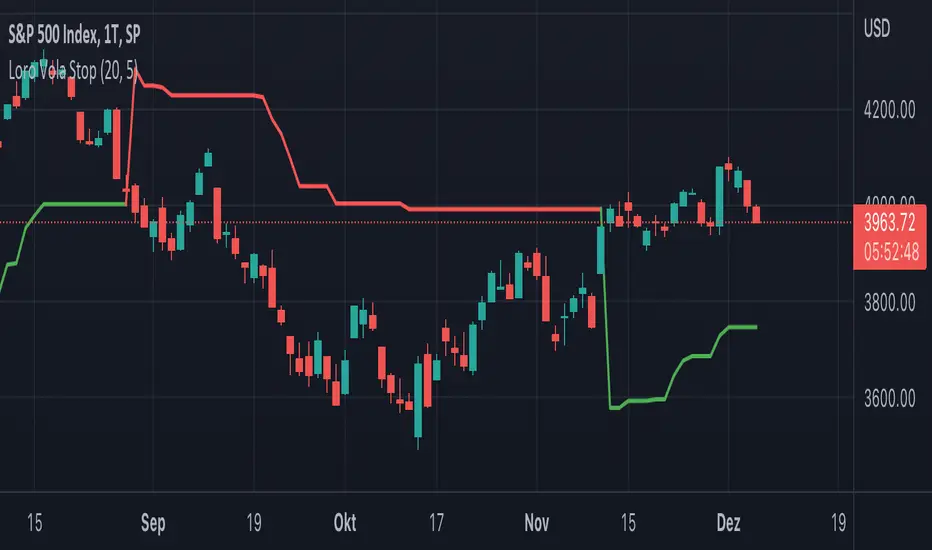
Loro Vola StopThis indicator is a variation of a chandelier volatility stop using an average true range. The indicator draws a green support line in an uptrend and a red resistance line in a downtrend. The signals normally should be used as exit triggers.
Lancelot vstop intraday trending strategyDear all,
Free strategy again.
I found using 3 volatility stop with different settings could be very helpful when trading an intraday trending market.
With the ATR setting or 5, 10, 15, we can weed out many false break.
Vstop setting is OHLC4.
On the other hand, this strategy also utilize Renko as part of the strategy, so you could say this strategy is mainly an intraday break out trend following strategy.
Works well on BTCUSD XBTUSD, as well as other major liquid alt Pairs.
And lastly,
Save Hong Kong, the revolution of our times.

CloudRest ATR based cloudThis is an indicator I have been working on for the past 2 years, developed specifically for cryptocurrency.
It is primarily a trend following indicator with great success and it performs the best in 4hrs to the weekly chart.
There are two components of this indicator.
The baseline from Ichimoku cloud and volatility stop .
baseline period = 26
volatility stop = 1.5ATR, 3
You can view this as the main component of a trend following system but you will need other confirmation indicators to confirm your entry.
Feel free to modify the script for your own system.
Feel free to follow me on twitter @Lancelot_Auger
I will be posting more content in the future, stay tuned.
And lastly,
Free hong kong, the revolution of our time!

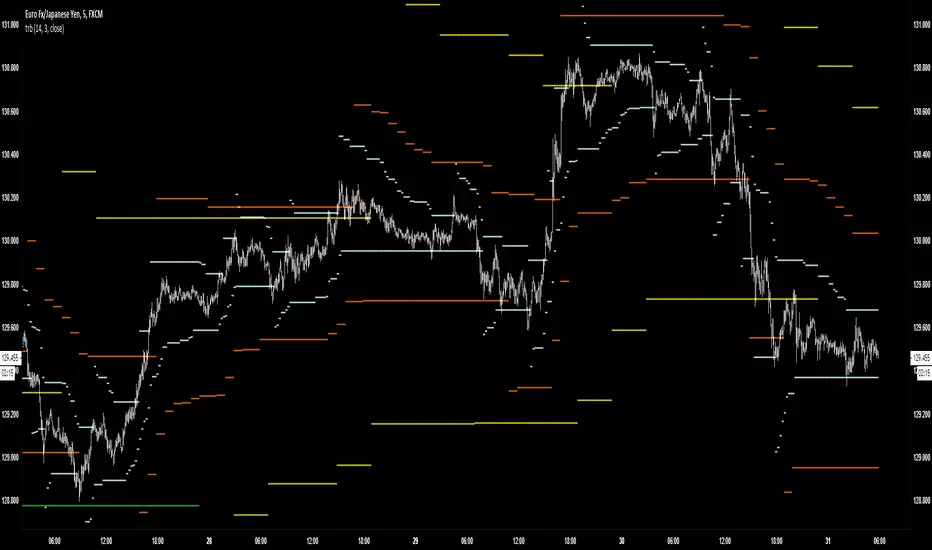
TRBTrue Range Bands; the 'Supertrend', also known as a volatility stop, using a 14 period length and 3x multiplier.