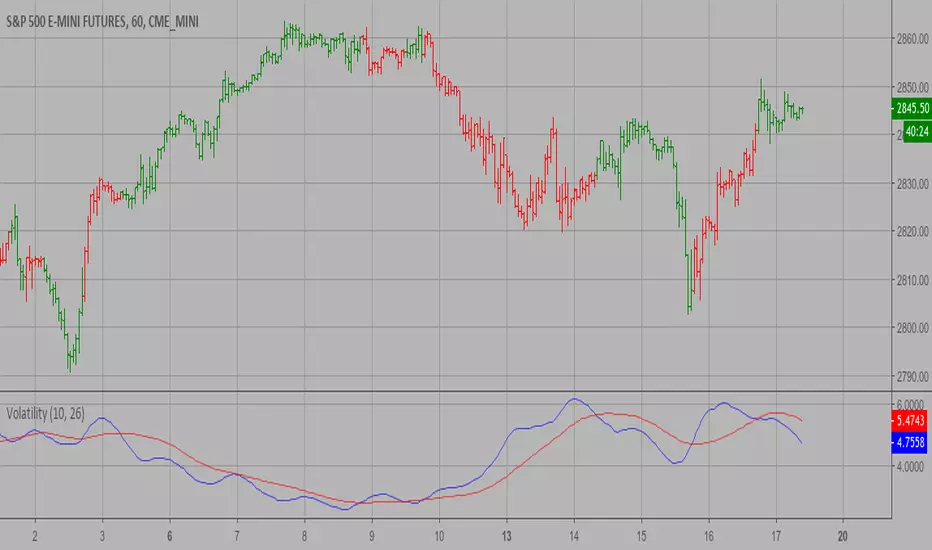
Volatility IndicatorThe Volatility Index measures the market volatility by plotting a smoothed average of the True Range.
Based on HPotter's idea (),
it returns an average of the TrueRange over a specific number of bars.
Here the result is passed through the Fisher's transform and normalized to 0/1-range.
This indicator may be used to identify stretches in the price movements, suitable for entry.
Search in scripts for "Volatility"

Volatility Across CoinsCompare the recent volatility of 8 cryptocurrencies, based on percentage change per candle.
Useful for volatility strategies to find the highest volatility coins over recent periods or to get an at-a-glance view of volatility correlations.
Options to change the resolution and find average % change per candle over user defined length.
Key:
BTC = Yellow/Gold
ETH = Purple
LTC = Gray
NEO = Green
IOTA = Light Blue
XMR = Orange
BCH = Red
Dash = Blue

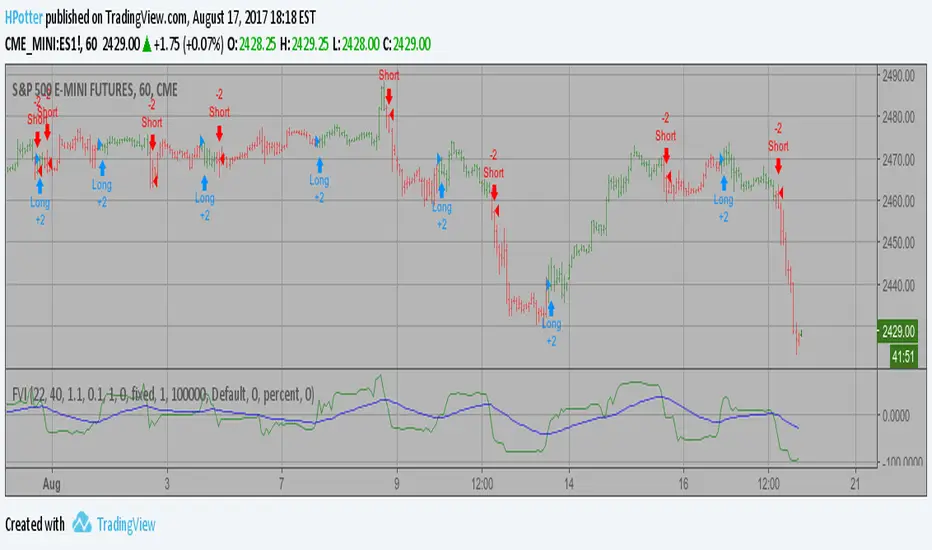
Volatility SystemDespite its crude name, the volatility system strategy, described by Richard Bookstaber in 1984, follows the simple premise that once there is a big volatile movement, the market tends to follow it. Thus, it uses the ATR to measure the volatility, and issues orders when the current change of the closing price exceeds the threshold, calculated by the ATR times a configurable constant.
It yields good results for some very specific charts, as you can see. However, I doubt it would work in the current market conditions, since it has no stop loss and no take profit , and the current noise levels obliterate this strategy, especially in small time frames. Maybe their integration to the strategy would yield better results, so feel free to add your own modifications.

Volatility MeasureThis indicator is super simple, it gives you the average amount of volatility (IN PERCENT) in any given asset over any given timeframe over the last 100 periods. Adjustable. This is useful for gauging volatility, risk, reward, opportunity set, and more. It can help you set stop losses, tell how much risk you are actually taking based on historical measures, and how much of what you do is based on skill or luck. Enjoy!
Pholesolus

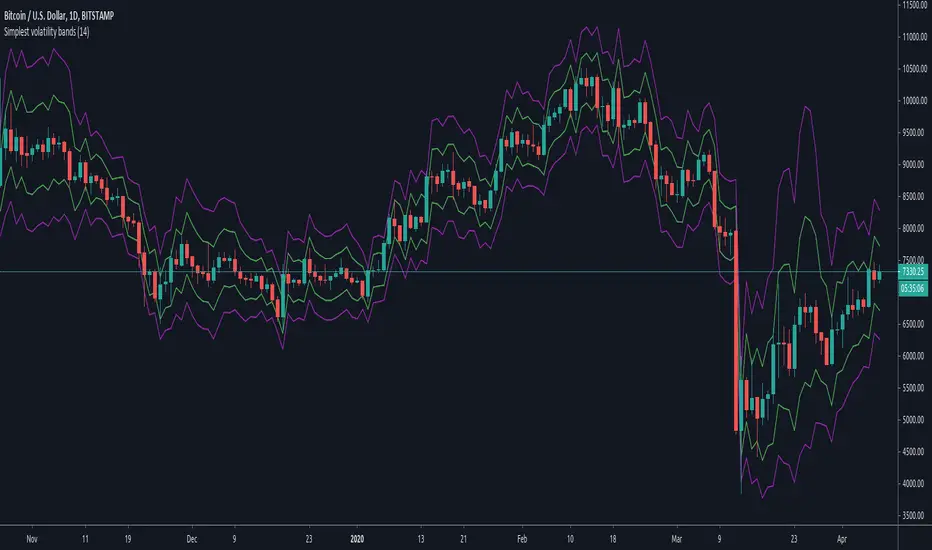
Simplest volatility bandsVolatility bands based on average candle percentage spread. Tested on BTCUSD charts only.
Based on the 68-95-99.7 rule, it seems that the spread, for daily and 4-H candles, follows a normal distribution: that means, around 85% of candles have a %-spread within sma(low/high, some_len) and sma(high/low, some_len) , and around 95% of candles within the pow2 of that range.
If you take the mean between the boundaries of the first %-spreads band, and calculate the 1.5 standard deviation of past some_len candles (I'm speaking from memory, it has been a while since I did them), the 1.5 standard deviation bands match similarly the %-spread bands, and around 85% of the candles are within these %-spread bands.
If you then take the pow2 of the bands, it will be similar to the 2 * std of the original bands, with around 95% of data within the pow2 bands.
You can take ema or other similar means with similar results, and the same for different lengths, but it seems that sma with a len of 14 is the more stable ones for both daily and 4-H, and taken other average calculations doesn't cause too many differences respect to the sma. I haven't tested too much for lower or higher timeframes.
With those %-spread bands, I multiple and divide those spreads to the open value of a new candle to get the two bands.
So, in short, you know that 85% of candles are within the closer bands, and around 95% of candles, around the bigger one. Once a new candle is born, the bands won't move (the bands are calculated from the previous candle, so the current candle's price movement doesn't move the band).
Going out the bands implies a sudden increase in volality, which usually causes rejection. They happen mostly at breakouts and ends of heavy trends. If a candle closes above the bigger band, you have probably got a breakout (a rejection rarely happens if the candle have already closed), although a breakout can happen without closing above the bands if volatility was already high.
If a trend is already stablished and is healthy, you won't probably see candles going out the bands, not even with a wick. When the trend is parabolic, and goes above the candle, the trend has probably ended, although the trend can be exhausted without going out the bands as well.
Heavy but not yet exhausted trends (specially recently started heavy downtrends), usually reach the bottom of the bigger bands during 4 o 5 contiguous candles (check visually looking at bitcoin history though, I'm speaking from memory).
So, the possibilities are multiple and you cannot use the bands to form a strategy, as usual. It can be comfortable enough psycologically for going to sleep, by moving your stop-loss to a point out of the bands in the opposite direction of your trade, and adjusting your position size accordingly; or just to check momentum looking at how close are the candle limits to the bands.
But, as usual, you are responsible of what you do with your money :)
Volatility Backtest The Volatility function measures the market volatility by plotting a
smoothed average of the True Range. It returns an average of the TrueRange
over a specific number of bars, giving higher weight to the TrueRange of
the most recent bar.
You can change long to short in the Input Settings
WARNING:
- For purpose educate only
- This script to change bars colors.

Volatility Strategy The Volatility function measures the market volatility by plotting a
smoothed average of the True Range. It returns an average of the TrueRange
over a specific number of bars, giving higher weight to the TrueRange of
the most recent bar.
WARNING:
- This script to change bars colors.
Volatility Shield ProConcept: Volatility Shield Pro is a multi-dimensional execution engine designed to filter high-probability entries by triangulating Trend, Institutional Volume, and Statistical Exhaustion.
Why this is original: Unlike standard indicators that look at price in a vacuum, this uses a Volume-Weighted ATR (VWATR) to distinguish between retail noise and institutional "Strikes." It integrates an ADR (Average Daily Range) Fuel gauge to prevent entries into exhausted moves, solving the common problem of buying the "top" of a trend.
Components & Logic:
Institutional Strike Engine: Uses VWATR normalized against a 50-period SMA to find momentum backed by volume.
ADR Fuel Gauge: Calculated by comparing current price travel to the 10-day ADR. A "State" of EXHAUSTED is triggered at 120% to warn of mean reversion.
HTF Anchor: A built-in Higher Time Frame EMA filter (default 4H) to ensure local trades align with the macro tide.
Live EDGE Tracker: A real-time backtesting module that calculates the win rate of the "Strike" signals on the current chart history using a 1.5:1 Reward-to-Risk ratio.
This combined tool addresses the three main reasons most trading systems fail by integrating higher-timeframe bias, daily range exhaustion, and volume confirmation into one framework:
Fighting the Tide (HTF Ribbon): Keeps traders aligned with the dominant higher-timeframe trend to avoid counter-trend entries.
Running Out of Gas (ADR Fuel): Measures a symbol’s average daily range to prevent chasing moves that have already reached their statistical limit.
Ghost Volume (RVOL/VWATR): Filters out low-quality, retail-driven activity by requiring institutional-level volume spikes before taking trades.
In essence, it combines trend alignment, range exhaustion detection, and real-volume filtering to eliminate the most common account-killing mistakes.
The "Triple-Threat" Trade Setup
This is the highest-probability setup the tool can produce. When these three things align, the "Edge" is at its peak:
The Anchor: HTF Ribbon is Bright Green.
The Local: Atlas Trend Bias is BULLISH and State is STRIKE.
The Value: ADR Fuel is Low (40-60%), meaning the stock has massive room to move before hitting daily resistance.

Volatility Calculator for Daily Top and Bottom RangeWith the usage of ATR, applied on the close of the daily candle, I am calculated the volatility channels for the TOP and BOTTOM
Based on this logic, we can estimate, with a huge confidence factor, where the prices are going to be compressed for the trading day.
Having said that, lets take a look at the data gathered among the most important financial markets:
SPX
TOP CROSSES : 2116
BOT CROSSES : 1954
Total Daily Candles : 18908
Occurance ratio = 0.215
NDX
TOP CROSSES : 1212
BOT CROSSES : 1183
Total Daily Candles : 9386
Occurance ratio = 0.255
DIA
TOP CROSSES : 759
BOT CROSSES : 769
Total Daily Candles : 6109
Occurance ratio = 0.25
DXY
TOP CROSSES : 1597
BOT CROSSES : 1598
Total Daily Candles : 13156
Occurance ratio = 0.243
DAX
TOP CROSSES : 1878
BOT CROSSES : 1848
Total Daily Candles : 13155
Occurance ratio = 0.283
BTC USD
TOP CROSSES : 416
BOT CROSSES : 417
Total Daily Candles : 4290
Occurance ratio = 0.194
ETH USD
TOP CROSSES : 247
BOT CROSSES : 268
Total Daily Candles : 2452
Occurance ratio = 0.21
EUR USD
TOP CROSSES : 820
BOT CROSSES : 805
Total Daily Candles : 7489
Occurance ratio = 0.217
GOLD
TOP CROSSES : 1722
BOT CROSSES : 1569
Total Daily Candles : 13747
Occurance ratio = 0.239
USOIL
TOP CROSSES : 1077
BOT CROSSES : 1089
Total Daily Candles : 10231
Occurance ratio = 0.212
US 10Y
TOP CROSSES : 1302
BOT CROSSES : 1365
Total Daily Candles : 9075
Occurance ratio = 0.294
Based on this, we can assume with a very high confidence ( 70-80%) that the market is going to stay, within the range created from the BOT and TOP ATR points.

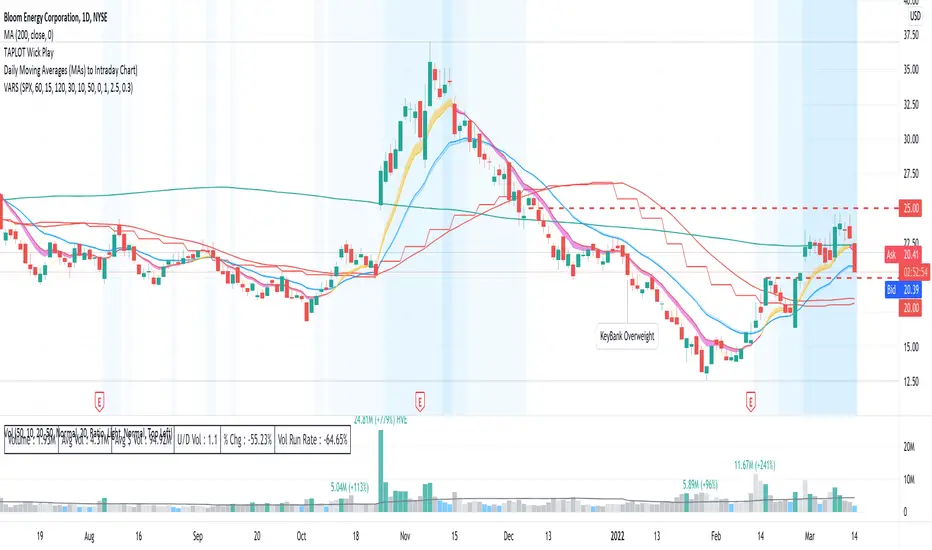
Volatility Adapted Relative StrengthVARS uses a stock's ALPHA in comparison to the SPX to determine whether there is RS on an volatility adjusted basis.
Volatility Breakout StrategyThis is a strategy used by Larry R. Williams called Volatility Breakout.
By identifying a strong uptrend that exceeds 'a certain level' on a daily basis as a breakout signal, enter long position, take advantage of long at the the next day's open.
'a certain level (Entry Price)' is calculated by { close + 'k' * high -low }, and applied logarithmic calculation.
Stop loss level is calculated by half of the previous day's Low and Entry Price.
Strategy exit always at UTC+0.
And expressed day session with the background color.
Thanks and hope this helps you.
(kor)
이건 Larry R. Williams가 사용하는 변동성 돌파 전략입니다.
특정 수준을 넘는 강한 상승세를 돌파 신호로 파악하여 매수하고, 장시간이 종료될때에 빠르게 수익을 실현하는 전략입니다.
"특정 레벨(진입가)"은 close + 'k' * high -low 로 계산되며 로그 계산을 적용했습니다.
손절 레벨은 전일 저가 및 진입 가격의 절반으로 계산됩니다.
전략은 항상 UTC+0에서 종료합니다. ( 한국 기준 오전 9시 )
그리고 배경색으로 일일세션을 표현했습니다.
트뷰에 오픈소스의 래리윌리엄스 변동성전략이 없는것 같아 간단하게나마 만들어 보았습니다. 도움이 되었으면 좋겟워요..

Volatility Quality Histogram (NicoadW)This indicator is based on the Volatility Quality Index ( VQI ) by Thomas Stridsman.
It shows the slope of the VQI in form of a histogram.
The VQI is calculated in the following Steps:
1. Applying a WeightedMovingAverage with the onto the low, open, high, close and prior close
2. Calculating the true range and the range from the results of step 1 and setting them into relation
3. Calculating a weighted lumpsum of the results from step 2 (This is the value of the widely known VQI )
4. The change from the current value of step 3 compared to the last value is the VQI-Slope
5. The VQI-Slope is filtered by only recogning changes greater as the User-Input
6. If the Slope is rising, its considered a long trend and if its falling its considered a short trend
User Inputs
Valuation Period: Length of the WMAs
Filter in Pips: minimum change of the VQI-Slope to result in a Trend-Change
Visuals
Inrease the size of the Signal: Highligts the Trend-Changes
Color Chart Bars: Colors the bars of the main chart depending on the trend given by the VQI

Volatility OscillatorThis tool displays relative volatility and directional trend. Excellent way to pickup diversions and reversals. Length can be lowered to 11 or 13 in settings to show price range.
Can be used to identify patterns such as parallel channels and likely direction of price action as pictured below.

Volatility Support & Resistance [LM]Hello guys,
I would like to introduce you volatility support and resistance horizontals. It draws line horizontal on high and low vhighly volatile candles. You can select lines on this timeframe and/or another one. It's done in the same spirit like my other indicators for horizontals
The colors are dynamic depending whether price is below or above the line:
for the current timeframe green is used for support and blue for resistance
for the other timeframe by default 4h orange is used for support and violet for resistance
There are various sections in setting:
general settings - here you can select ATR length, multiplier and show labels
show and hide section of the current timeframe
other timeframe
show and hide other timeframe horizontals
Any suggestions are welcome

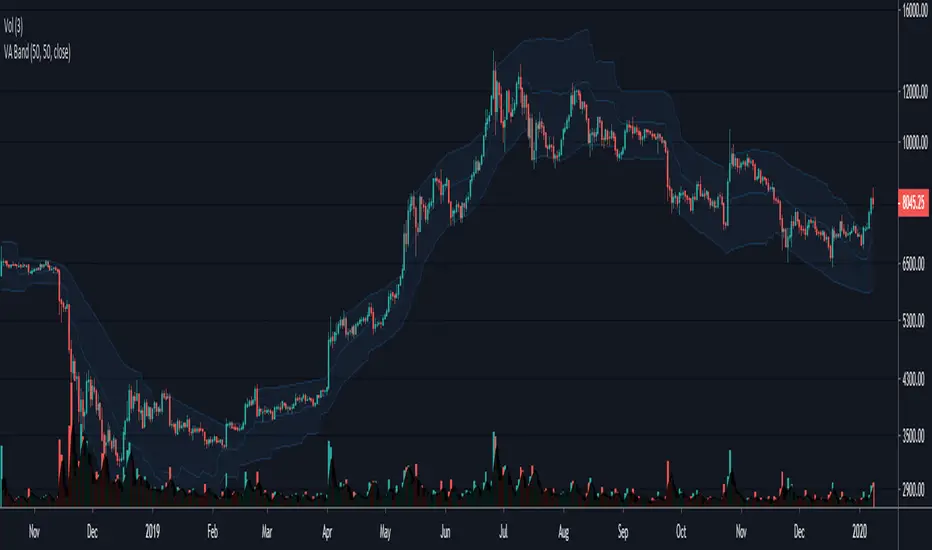
Volatility Adjusted Bands - JD This indicator gives a likely trading range based on the volatility of the past x amount of bars, measured against a certain moving average.
The indicator can be used as an alternative for BBands.
It gives approx. the same "trend-side" lines (upper line in uptrend, lower line in down trend) as the Bollinger Bands, but the opposite line follows closer on price,
Instead of "flying out" to the other direction like in BBands.
As a comparison, the BBands for the same length (50 period) are added on the chart.
JD.
#NotTradingAdvice #DYOR
I build these indicators for myself and provide them open source, to use for free to use and improve upon,
as I believe the best way to learn is toghether.

Volatility Direction DetectorThis script helps trader identify volatility direction in order to classify each market move. It also provides good entry points.
Volatility RatioVolatility Ratio indicator script. This indicator was originally developed by Jack Schwager.

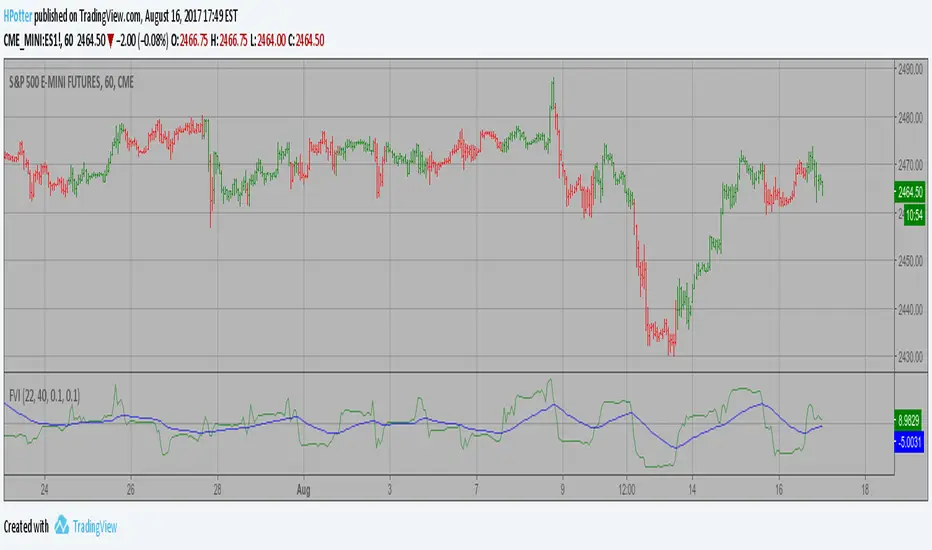
Volatility Finite Volume Elements Backtest This version has an important enhancement to the previous one that`s
especially useful with intraday minute charts.
Due to the volatility had not been taken into account to avoid the extra
complication in the formula, the previous formula has some drawbacks:
The main drawback is that the constant cutoff coefficient will overestimate
price changes in minute charts and underestimate corresponding changes in
weekly or monthly charts.
And now the indicator uses adaptive cutoff coefficient which will adjust to
all time frames automatically.
You can change long to short in the Input Settings
Please, use it only for learning or paper trading. Do not for real trading.
Volatility Finite Volume Elements Strategy This version has an important enhancement to the previous one that`s
especially useful with intraday minute charts.
Due to the volatility had not been taken into account to avoid the extra
complication in the formula, the previous formula has some drawbacks:
The main drawback is that the constant cutoff coefficient will overestimate
price changes in minute charts and underestimate corresponding changes in
weekly or monthly charts.
And now the indicator uses adaptive cutoff coefficient which will adjust to
all time frames automatically.
WARNING:
This script to change bars colors.
VolatilityIndicatorsLibrary "VolatilityIndicators"
This is a library of Volatility Indicators .
It aims to facilitate the grouping of this category of indicators, and also offer the customized supply of
the parameters and sources, not being restricted to just the closing price.
@Thanks and credits:
1. Dynamic Zones: Leo Zamansky, Ph.D., and David Stendahl
2. Deviation: Karl Pearson (code by TradingView)
3. Variance: Ronald Fisher (code by TradingView)
4. Z-score: Veronique Valcu (code by HPotter)
5. Standard deviation: Ronald Fisher (code by TradingView)
6. ATR (Average True Range): J. Welles Wilder (code by TradingView)
7. ATRP (Average True Range Percent): millerrh
8. Historical Volatility: HPotter
9. Min-Max Scale Normalization: gorx1
10. Mean Normalization: gorx1
11. Standardization: gorx1
12. Scaling to unit length: gorx1
13. LS Volatility Index: Alexandre Wolwacz (Stormer), Fabrício Lorenz, Fábio Figueiredo (Vlad) (code by me)
14. Bollinger Bands: John Bollinger (code by TradingView)
15. Bollinger Bands %: John Bollinger (code by TradingView)
16. Bollinger Bands Width: John Bollinger (code by TradingView)
dev(source, length, anotherSource)
Deviation. Measure the difference between a source in relation to another source
Parameters:
source (float)
length (simple int) : (int) Sequential period to calculate the deviation
anotherSource (float) : (float) Source to compare
Returns: (float) Bollinger Bands Width
variance(src, mean, length, biased, degreesOfFreedom)
Variance. A statistical measurement of the spread between numbers in a data set. More specifically,
variance measures how far each number in the set is from the mean (average), and thus from every other number in the set.
Variance is often depicted by this symbol: σ2. It is used by both analysts and traders to determine volatility and market security.
Parameters:
src (float) : (float) Source to calculate variance
mean (float) : (float) Mean (Moving average)
length (simple int) : (int) The sequential period to calcule the variance (number of values in data set)
biased (simple bool) : (bool) Defines the type of standard deviation. If true, uses biased sample variance (n),
degreesOfFreedom (simple int) : (int) Degrees of freedom. The number of values in the final calculation of a statistic that are free to vary.
Default value is n-1, where n here is length. Only applies when biased parameter is defined as true.
Returns: (float) Standard deviation
stDev(src, length, mean, biased, degreesOfFreedom)
Measure the Standard deviation from a source in relation to it's moving average.
In this implementation, you pass the average as a parameter, allowing a more personalized calculation.
Parameters:
src (float) : (float) Source to calculate standard deviation
length (simple int) : (int) The sequential period to calcule the standard deviation
mean (float) : (float) Moving average.
biased (simple bool) : (bool) Defines the type of standard deviation. If true, uses biased sample variance (n),
else uses unbiased sample variance (n-1 or another value, as long as it is in the range between 1 and n-1), where n=length.
degreesOfFreedom (simple int) : (int) Degrees of freedom. The number of values in the final calculation of a statistic that are free to vary.
Default value is n-1, where n here is length.
Returns: (float) Standard deviation
zscore(src, mean, length, biased, degreesOfFreedom)
Z-Score. A z-score is a statistical measurement that indicates how many standard deviations a data point is from
the mean of a data set. It is also known as a standard score. The formula for calculating a z-score is (x - μ) / σ,
where x is the individual data point, μ is the mean of the data set, and σ is the standard deviation of the data set.
Z-scores are useful in identifying outliers or extreme values in a data set. A positive z-score indicates that the
data point is above the mean, while a negative z-score indicates that the data point is below the mean. A z-score of
0 indicates that the data point is equal to the mean.
Z-scores are often used in hypothesis testing and determining confidence intervals. They can also be used to compare
data sets with different units or scales, as the z-score standardizes the data. Overall, z-scores provide a way to
measure the relative position of a data point in a data
Parameters:
src (float) : (float) Source to calculate z-score
mean (float) : (float) Moving average.
length (simple int) : (int) The sequential period to calcule the standard deviation
biased (simple bool) : (bool) Defines the type of standard deviation. If true, uses biased sample variance (n),
else uses unbiased sample variance (n-1 or another value, as long as it is in the range between 1 and n-1), where n=length.
degreesOfFreedom (simple int) : (int) Degrees of freedom. The number of values in the final calculation of a statistic that are free to vary.
Default value is n-1, where n here is length.
Returns: (float) Z-score
atr(source, length)
ATR: Average True Range. Customized version with source parameter.
Parameters:
source (float) : (float) Source
length (simple int) : (int) Length (number of bars back)
Returns: (float) ATR
atrp(length, sourceP)
ATRP (Average True Range Percent)
Parameters:
length (simple int) : (int) Length (number of bars back) for ATR
sourceP (float) : (float) Source for calculating percentage relativity
Returns: (float) ATRP
atrp(source, length, sourceP)
ATRP (Average True Range Percent). Customized version with source parameter.
Parameters:
source (float) : (float) Source for ATR
length (simple int) : (int) Length (number of bars back) for ATR
sourceP (float) : (float) Source for calculating percentage relativity
Returns: (float) ATRP
historicalVolatility(lengthATR, lengthHist)
Historical Volatility
Parameters:
lengthATR (simple int) : (int) Length (number of bars back) for ATR
lengthHist (simple int) : (int) Length (number of bars back) for Historical Volatility
Returns: (float) Historical Volatility
historicalVolatility(source, lengthATR, lengthHist)
Historical Volatility
Parameters:
source (float) : (float) Source for ATR
lengthATR (simple int) : (int) Length (number of bars back) for ATR
lengthHist (simple int) : (int) Length (number of bars back) for Historical Volatility
Returns: (float) Historical Volatility
minMaxNormalization(src, numbars)
Min-Max Scale Normalization. Maximum and minimum values are taken from the sequential range of
numbars bars back, where numbars is a number defined by the user.
Parameters:
src (float) : (float) Source to normalize
numbars (simple int) : (int) Numbers of sequential bars back to seek for lowest and hightest values.
Returns: (float) Normalized value
minMaxNormalization(src, numbars, minimumLimit, maximumLimit)
Min-Max Scale Normalization. Maximum and minimum values are taken from the sequential range of
numbars bars back, where numbars is a number defined by the user.
In this implementation, the user explicitly provides the desired minimum (min) and maximum (max) values for the scale,
rather than using the minimum and maximum values from the data.
Parameters:
src (float) : (float) Source to normalize
numbars (simple int) : (int) Numbers of sequential bars back to seek for lowest and hightest values.
minimumLimit (simple float) : (float) Minimum value to scale
maximumLimit (simple float) : (float) Maximum value to scale
Returns: (float) Normalized value
meanNormalization(src, numbars, mean)
Mean Normalization
Parameters:
src (float) : (float) Source to normalize
numbars (simple int) : (int) Numbers of sequential bars back to seek for lowest and hightest values.
mean (float) : (float) Mean of source
Returns: (float) Normalized value
standardization(src, mean, stDev)
Standardization (Z-score Normalization). How "outside the mean" values relate to the standard deviation (ratio between first and second)
Parameters:
src (float) : (float) Source to normalize
mean (float) : (float) Mean of source
stDev (float) : (float) Standard Deviation
Returns: (float) Normalized value
scalingToUnitLength(src, numbars)
Scaling to unit length
Parameters:
src (float) : (float) Source to normalize
numbars (simple int) : (int) Numbers of sequential bars back to seek for lowest and hightest values.
Returns: (float) Normalized value
lsVolatilityIndex(movingAverage, sourceHvol, lengthATR, lengthHist, lenNormal, lowerLimit, upperLimit)
LS Volatility Index. Measures the volatility of price in relation to an average.
Parameters:
movingAverage (float) : (float) A moving average
sourceHvol (float) : (float) Source for calculating the historical volatility
lengthATR (simple int) : (float) Length for calculating the ATR (Average True Range)
lengthHist (simple int) : (float) Length for calculating the historical volatility
lenNormal (simple int) : (float) Length for normalization
lowerLimit (simple int)
upperLimit (simple int)
Returns: (float) LS Volatility Index
lsVolatilityIndex(sourcePrice, movingAverage, sourceHvol, lengthATR, lengthHist, lenNormal, lowerLimit, upperLimit)
LS Volatility Index. Measures the volatility of price in relation to an average.
Parameters:
sourcePrice (float) : (float) Source for measure the distance
movingAverage (float) : (float) A moving average
sourceHvol (float) : (float) Source for calculating the historical volatility
lengthATR (simple int) : (float) Length for calculating the ATR (Average True Range)
lengthHist (simple int) : (float) Length for calculating the historical volatility
lenNormal (simple int)
lowerLimit (simple int)
upperLimit (simple int)
Returns: (float) LS Volatility Index
bollingerBands(src, length, mult, basis)
Bollinger Bands. A Bollinger Band is a technical analysis tool defined by a set of lines plotted
two standard deviations (positively and negatively) away from a simple moving average (SMA) of the security's price,
but can be adjusted to user preferences. In this version you can pass a customized basis (moving average), not only SMA.
Parameters:
src (float) : (float) Source to calculate standard deviation used in Bollinger Bands
length (simple int) : (int) The time period to be used in calculating the standard deviation
mult (simple float) : (float) Multiplier used in standard deviation. Basically, the upper/lower bands are standard deviation multiplied by this.
basis (float) : (float) Basis of Bollinger Bands (a moving average)
Returns: (float) A tuple of Bollinger Bands, where index 1=basis; 2=basis+dev; 3=basis-dev; and dev=multiplier*stdev
bollingerBands(src, length, aMult, basis)
Bollinger Bands. A Bollinger Band is a technical analysis tool defined by a set of lines plotted
two standard deviations (positively and negatively) away from a simple moving average (SMA) of the security's price,
but can be adjusted to user preferences. In this version you can pass a customized basis (moving average), not only SMA.
Also, various multipliers can be passed, thus getting more bands (instead of just 2).
Parameters:
src (float) : (float) Source to calculate standard deviation used in Bollinger Bands
length (simple int) : (int) The time period to be used in calculating the standard deviation
aMult (float ) : (float ) An array of multiplies used in standard deviation. Basically, the upper/lower bands are standard deviation multiplied by this.
This array of multipliers permit the use of various bands, not only 2.
basis (float) : (float) Basis of Bollinger Bands (a moving average)
Returns: (float ) An array of Bollinger Bands, where:
index 1=basis; 2=basis+dev1; 3=basis-dev1; 4=basis+dev2, 5=basis-dev2, 6=basis+dev2, 7=basis-dev2, Nup=basis+devN, Nlow=basis-devN
and dev1, dev2, devN are ```multiplier N * stdev```
bollingerBandsB(src, length, mult, basis)
Bollinger Bands %B - or Percent Bandwidth (%B).
Quantify or display where price (or another source) is in relation to the bands.
%B can be useful in identifying trends and trading signals.
Calculation:
%B = (Current Price - Lower Band) / (Upper Band - Lower Band)
Parameters:
src (float) : (float) Source to calculate standard deviation used in Bollinger Bands
length (simple int) : (int) The time period to be used in calculating the standard deviation
mult (simple float) : (float) Multiplier used in standard deviation
basis (float) : (float) Basis of Bollinger Bands (a moving average)
Returns: (float) Bollinger Bands %B
bollingerBandsB(src, length, aMult, basis)
Bollinger Bands %B - or Percent Bandwidth (%B).
Quantify or display where price (or another source) is in relation to the bands.
%B can be useful in identifying trends and trading signals.
Calculation
%B = (Current Price - Lower Band) / (Upper Band - Lower Band)
Parameters:
src (float) : (float) Source to calculate standard deviation used in Bollinger Bands
length (simple int) : (int) The time period to be used in calculating the standard deviation
aMult (float ) : (float ) Array of multiplier used in standard deviation. Basically, the upper/lower bands are standard deviation multiplied by this.
This array of multipliers permit the use of various bands, not only 2.
basis (float) : (float) Basis of Bollinger Bands (a moving average)
Returns: (float ) An array of Bollinger Bands %B. The number of results in this array is equal the numbers of multipliers passed via parameter.
bollingerBandsW(src, length, mult, basis)
Bollinger Bands Width. Serve as a way to quantitatively measure the width between the Upper and Lower Bands
Calculation:
Bollinger Bands Width = (Upper Band - Lower Band) / Middle Band
Parameters:
src (float) : (float) Source to calculate standard deviation used in Bollinger Bands
length (simple int) : (int) Sequential period to calculate the standard deviation
mult (simple float) : (float) Multiplier used in standard deviation
basis (float) : (float) Basis of Bollinger Bands (a moving average)
Returns: (float) Bollinger Bands Width
bollingerBandsW(src, length, aMult, basis)
Bollinger Bands Width. Serve as a way to quantitatively measure the width between the Upper and Lower Bands
Calculation
Bollinger Bands Width = (Upper Band - Lower Band) / Middle Band
Parameters:
src (float) : (float) Source to calculate standard deviation used in Bollinger Bands
length (simple int) : (int) Sequential period to calculate the standard deviation
aMult (float ) : (float ) Array of multiplier used in standard deviation. Basically, the upper/lower bands are standard deviation multiplied by this.
This array of multipliers permit the use of various bands, not only 2.
basis (float) : (float) Basis of Bollinger Bands (a moving average)
Returns: (float ) An array of Bollinger Bands Width. The number of results in this array is equal the numbers of multipliers passed via parameter.
dinamicZone(source, sampleLength, pcntAbove, pcntBelow)
Get Dynamic Zones
Parameters:
source (float) : (float) Source
sampleLength (simple int) : (int) Sample Length
pcntAbove (simple float) : (float) Calculates the top of the dynamic zone, considering that the maximum values are above x% of the sample
pcntBelow (simple float) : (float) Calculates the bottom of the dynamic zone, considering that the minimum values are below x% of the sample
Returns: A tuple with 3 series of values: (1) Upper Line of Dynamic Zone;
(2) Lower Line of Dynamic Zone; (3) Center of Dynamic Zone (x = 50%)
Examples:

Shannon Entropy Volatility AnalyzerThis algorithm aims to measure market uncertainty or volatility using a Shannon entropy-based approach. 🔄📊
Entropy is a measure of disorder or unpredictability, and here we use it to evaluate the structure of price returns within a defined range of periods (window length). 🧩⏳ Thus, the goal is to detect changes to identify conditions of high or low volatility. 🔍⚡
What we seek with Shannon's formula in this algorithm is to measure market uncertainty or volatility through dynamic entropy. This measure helps us understand how unpredictable price behavior is over a given period, which is key to making informed decisions. 📈🧠
Through this formula, we calculate the level of disorder or dispersion in price returns based on their probability of occurrence, enabling us to identify moments of high or low volatility. 💡💥
Shannon Entropy Calculation 📏
• Uses probabilities to measure uncertainty in returns. 🎲
• Entropy is normalized on a scale of 0 to 100, where:
o High Entropy: Unpredictable movements (high uncertainty). ⚠️💥
•
o Low Entropy: Structured movements (low uncertainty). 📉🔒
•
• With probabilities, we measure the level of dispersion or unpredictability of returns using Shannon's entropy formula. 📊🔍
________________________________________
Indicator Usefulness 🛠️
• Identify High Volatility: When the market is unpredictable, the indicator signals "High Uncertainty." ⚡🔮
• Detect Market Stability: When the market is more predictable and structured, the indicator highlights "Low Uncertainty." 🔒🧘♂️
• Neutral Zones: Helps monitor markets without extreme conditions, enabling safer entry or exit opportunities. ⚖️🚶♂️
________________________________________
Uncertainty Zones 🌀
1. High Uncertainty: When entropy exceeds the upper threshold. 🚨🔺
2. Low Uncertainty: When entropy is below the lower threshold. 🔻💡
3. Neutral: When entropy lies between both thresholds. ⚖️🔄
________________________________________
What We Aim to Achieve with the Formula in Practice 🎯
1. Detection of Volatile Moments: Shannon’s formula helps us identify when the market is unpredictable. This is a good moment to take additional precautions, such as reducing position size or avoiding trading during high volatility phases. ⚠️📉
2. Trading Opportunities in Stable Markets: With low entropy, we can identify when the market is more predictable, favoring trend or momentum strategies with a higher chance of success. 🚀📈
3. Optimization of Risk Management: By measuring market volatility in real-time, we can adjust entry and exit strategies, tailoring risk based on the level of uncertainty detected. 🔄⚖️
________________________________________
We hope this makes it easy to interpret and use. If you have any questions or comments, please feel free to reach out to us! 📬😊

Logarithmic VolatilityIntroducing the Logarithmic Volatility Indicator , an innovative trading indicator designed especially for trading in low volatility markets. This powerful indicator is aimed at traders of all levels, from beginners to experts, and is based on fundamental concepts of mathematics and statistics applied to the financial market. Its main objective is to provide you with a better understanding of price movements and help you make more accurate investment decisions, especially in low volatility environments.
The purpose of this indicator is to find a volatility estimator that depends on the difference between High and Low, taking into account that this measure is directly proportional to volatility. A first result was obtained by Parkinson (1980) which was later improved by Garman and Klass (1980), who improved the estimator by obtaining one of minimum variance. It is the simplified version (and recommended by them) of the Garman and Klass estimator that is used to calculate the daily volatility of the asset.
The Logarithmic Volatility Indicator is a unique smoothing indicator that uses logarithms and volatility calculation of the opening, high, low and closing prices. It combines these elements to obtain an accurate representation of market volatility in situations where volatility is low.
Features
This indicator has several outstanding features designed to enhance your trading analysis in low volatility environments:
• Intraday Volatility Calculation: This innovative feature allows you to view market volatility levels in real time, providing a clear view of market fluctuations even when volatility is low.
• EMA (Exponential Moving Average) Multi Length: The indicator incorporates three different EMA lengths (Fast, Medium and Slow). This gives you a deeper and more detailed analysis of market volatility, allowing you to detect subtle changes in volatility and make more accurate predictions.
• Visual color change: The indicator uses a color change between green and red to facilitate quick interpretation of the market. Green indicates a decrease in volatility, while red indicates an increase in volatility. This feature helps you quickly identify changes in market dynamics even in periods of low volatility.
• Histogram display: In addition to the colors, the indicator can also be displayed as a histogram. This intuitive representation allows you to visually observe changes in volatility over time and detect emerging patterns or trends in markets with low volatility.
Settings
The Logarithmic Volatility Indicator allows you to customize various settings to suit your specific trading needs:
• Slow EMA length: you can select the length of the slow exponential moving average according to your preferences and trading strategies.
• Fast EMA length: Similarly, you can choose the length of the fast exponential moving average to suit your trading style.
• Average EMA length: In addition to the two EMA lengths above, this indicator offers a third EMA length for even more detailed analysis. This additional feature is especially useful when trading in markets with low volatility, as it allows you to capture subtle changes in market dynamics.
Trading
The Logarithmic Volatility Indicator is designed not only to provide you with essential information about market volatility, but also to give you clear indications on when to trade. Here's how you can use the indicator's colors to guide your trading decisions:
- Long Trading: When the fast EMA has a smaller value than the slow EMA, the indicator will change to green. This is a signal to enter a long trade. That is, you can consider buying at this point, as an increase in price is anticipated due to decreasing volatility. With volatility declining, there is a greater likelihood that the price will continue in the current direction rather than fluctuate erratically.
- b]Short Trading: On the other hand, when the fast EMA has a higher value than the slow EMA, the indicator will turn red. This is a signal to enter a short trade. In other words, you may consider selling at this point, as a decline in price is anticipated due to rising volatility. With volatility on the rise, there is a greater risk of steeper price fluctuations.
It is important to remember that, as with any indicator, the Logarithmic Volatility Indicator does not guarantee 100% success. You should always use this indicator in combination with other analytical tools and good risk management. This tool provides you with an overview of market volatility and can help you identify trading opportunities in low volatility markets, but the final decision on when and how to trade should always be based on your own analysis and judgment.
In conclusion, the Logarithmic Volatility Indicator is an essential trading tool that every trader should have in their arsenal, especially when facing low volatility markets. With its accurate volatility calculation and easy-to-understand visualization, it will help you improve your trading decisions and maximize your profits even in situations where price movements are less pronounced. Try it today and take advantage of its efficiency in low volatility environments!
---------------------------------------------------------------------------------------------------
Presentamos el Indicador de Volatilidad Logarítmica , un innovador indicador de trading diseñado especialmente para operar en mercados con baja volatilidad. Este poderoso indicador está dirigido a traders de todos los niveles, desde principiantes hasta expertos, y se basa en conceptos fundamentales de matemáticas y estadísticas aplicadas al mercado financiero. Su objetivo principal es proporcionarte una mejor comprensión de los movimientos de precios y ayudarte a tomar decisiones de inversión más precisas, especialmente en entornos de baja volatilidad.
Con este indicador se pretende encontrar un estimador de la volatilidad que dependa de la diferencia entre el High y el Low, teniendo en cuenta que esta medida es directamente proporcional a la volatilidad. Un primer resultado fue obtenido por Parkinson (1980) que posteriormente fue mejorado por Garman y Klass (1980), que mejoraron el estimador obteniendo uno de varianza mínima. Es la versión simplificada (y recomendada por ellos mismos) del estimador de Garman y Klass la que se utiliza para calcular la volatilidad diaria del activo.
El Indicador de Volatilidad Logarítmica es un indicador de suavizado único que utiliza logaritmos y el cálculo de la volatilidad de los precios de apertura, máximo, mínimo y cierre. Combina estos elementos para obtener una representación precisa de la volatilidad del mercado en situaciones donde la volatilidad es baja.
Características
Este indicador cuenta con varias características sobresalientes diseñadas para mejorar tu análisis de trading en entornos de baja volatilidad:
• Cálculo de la volatilidad intradía: Esta función innovadora te permite ver los niveles de volatilidad del mercado en tiempo real, lo que brinda una visión clara de las fluctuaciones del mercado incluso cuando la volatilidad es baja.
• EMA (Exponential Moving Average) Multi Longitud: El indicador incorpora tres longitudes diferentes de EMA (Rápida, Media y Lenta). Esto te proporciona un análisis más profundo y detallado de la volatilidad del mercado, permitiéndote detectar cambios sutiles en la volatilidad y realizar predicciones más precisas.
• Cambio de color visual: El indicador utiliza un cambio de color entre verde y rojo para facilitar la interpretación rápida del mercado. El verde indica una disminución de la volatilidad, mientras que el rojo indica un aumento de la volatilidad. Esta característica te ayuda a identificar rápidamente cambios en la dinámica del mercado incluso en períodos de baja volatilidad.
• Visualización Histograma: Además de los colores, el indicador también se puede visualizar como un histograma. Esta representación intuitiva te permite observar de manera visual los cambios en la volatilidad a lo largo del tiempo y detectar patrones o tendencias emergentes en mercados con baja volatilidad.
Ajustes
El Indicador de Volatilidad Logarítmica te permite personalizar varios ajustes para adaptarlos a tus necesidades de trading específicas:
• Longitud de EMA lenta: Puedes seleccionar la longitud de la media móvil exponencial lenta según tus preferencias y estrategias de trading.
• Longitud de EMA rápida: De manera similar, puedes elegir la longitud de la media móvil exponencial rápida para ajustarla a tu estilo de trading.
• Longitud de EMA media: Además de las dos longitudes de EMA anteriores, este indicador ofrece una tercera longitud de EMA para un análisis aún más detallado. Esta característica adicional es especialmente útil cuando operas en mercados con baja volatilidad, ya que te permite capturar cambios sutiles en la dinámica del mercado.
Operativa
El Indicador de Volatilidad Logarítmica está diseñado no solo para brindarte información esencial sobre la volatilidad del mercado, sino también para ofrecerte indicaciones claras sobre cuándo operar. Aquí te explicamos cómo puedes utilizar los colores del indicador para guiar tus decisiones de trading:
• Operativa en Largo: Cuando la EMA rápida tiene un valor más pequeño que la EMA lenta, el indicador cambiará a color verde. Esta es una señal para entrar en una operación en largo. Es decir, puedes considerar comprar en este punto, ya que se anticipa un aumento en el precio debido a la disminución de la volatilidad. Con la volatilidad en descenso, existe una mayor probabilidad de que el precio continúe en la dirección actual en lugar de fluctuar erráticamente.
• Operativa en Corto: Por otro lado, cuando la EMA rápida tiene un valor mayor que la EMA lenta, el indicador se tornará rojo. Esta es una señal para entrar en una operación en corto. En otras palabras, puedes considerar vender en este punto, ya que se anticipa una disminución en el precio debido al aumento de la volatilidad. Con la volatilidad en ascenso, existe un mayor riesgo de fluctuaciones de precio más pronunciadas.
Es importante recordar que, como con cualquier indicador, el Indicador de Volatilidad Logarítmica no garantiza un éxito del 100%. Siempre debes usar este indicador en combinación con otras herramientas de análisis y una buena gestión de riesgos. Esta herramienta te proporciona una visión general de la volatilidad del mercado y puede ayudarte a identificar oportunidades de trading en mercados con baja volatilidad, pero la decisión final de cuándo y cómo operar siempre deberá basarse en tu propio análisis y juicio.
En conclusión, el Indicador de Volatilidad Logarítmica es una herramienta de trading esencial que todo trader debe tener en su arsenal, especialmente cuando se enfrenta a mercados con baja volatilidad. Con su cálculo preciso de la volatilidad y su visualización fácil de entender, te ayudará a mejorar tus decisiones de trading y a maximizar tus ganancias incluso en situaciones donde los movimientos de precios son menos pronunciados. ¡Pruébalo hoy mismo y aprovecha su eficiencia en entornos de baja volatilidad!
