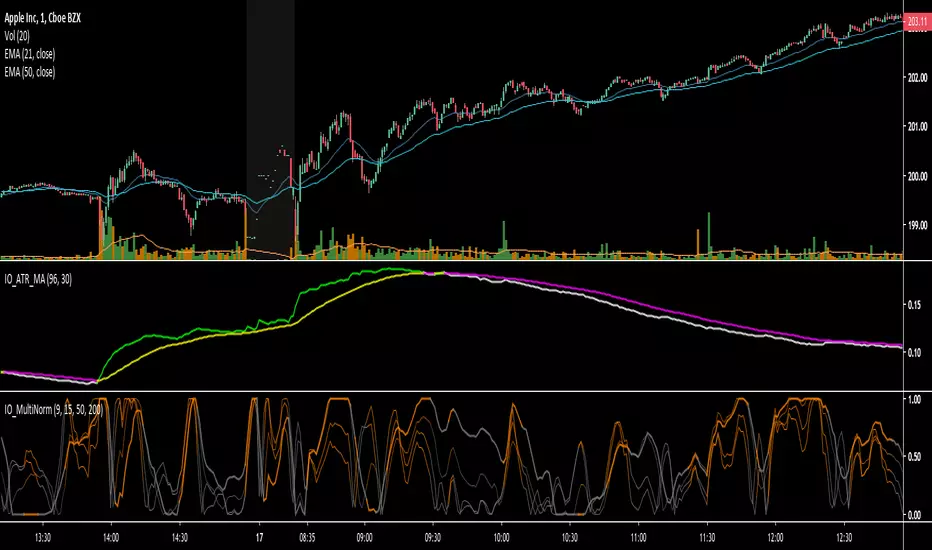
IO_ATR_MAThis is an ATR+MA indicator.. the general idea is:
- when ATR is higher than MA, volatility is high
- when ATR is lower than MA, volatility is low
Search in scripts for "Volatility"
IO_Volatility Quality Zero LineThis is the Volatility Quality Zero Line Indicator. This indicator measures volatility strength.

Kirshenbaum BandsThis indicator was originally developed by Paul Kirshenbaum, a mathematician with a Ph.D. in economics from New York University.
It uses the standard error of linear regression lines of the closing price to determine band width. This has the effect of measuring volatility around the current trend, rather than measuring volatility for changes in trend.
Good luck!

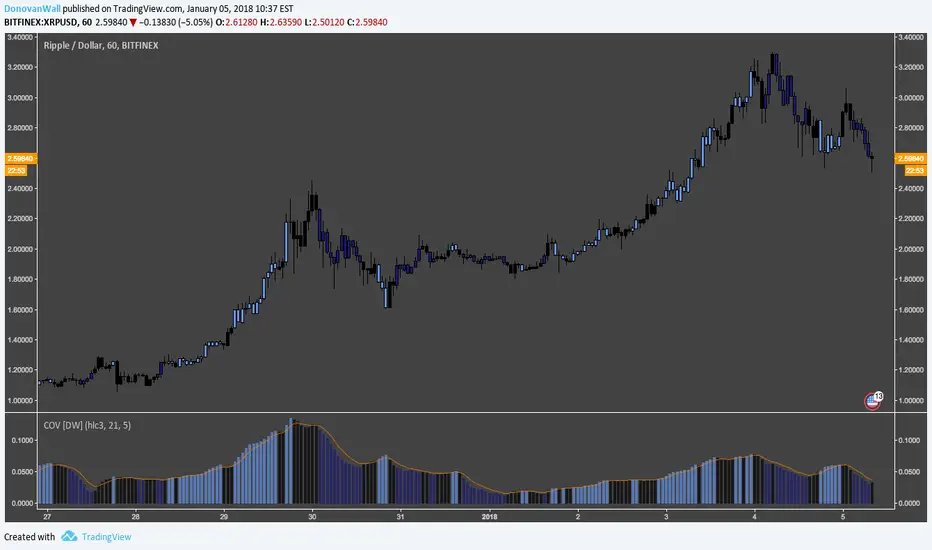
Coefficient of Variation [DW]This is a simple gauge of volatility using the Coefficient of Variation.
COV is calculated by dividing standard deviation of price by the expected (average) price.
Custom color scheme indicates increases and decreases in volatility, which is indicated when the COV forms new half period highs and lows.
Mean-Reversion Strategy (RSI + ATR) v1
Entry: Wait for RSI(10) to cross 35 (bullish) or 65 (bearish)
Stop-loss: 2.5 times current ATR away from entry
Take-profit: 4 times current ATR away from entry
Risk: 2% of account per trade
Skip trades if price moved >5% recently or volume is below average
Risk/Reward: You risk $1 to make $1.60 (1:1.6 ratio)
That's the complete strategy. Simple, rules-based, volatility-adjusted for crypto.

Mismatch Strategy | Madrimov tradeTitle
Mismatch Strategy by Madrimov trade – Gold vs DXY Impulse and Compression
Description
Concept
This indicator is based on a cross-market mismatch principle between Gold (XAUUSD) and the US Dollar Index (DXY).
It looks for situations where DXY expands aggressively while Gold temporarily fails to respond, creating a build-up of directional pressure that is often released once Gold breaks its short-term range.
Methodology (High-Level Overview)
The script evaluates three conditions on the same chart timeframe:
DXY Impulse Detection
A directional impulse on DXY is detected when the candle’s range exceeds a multiple of its ATR, indicating unusually strong participation rather than normal fluctuation.
Gold Compression Filter
At the same time, Gold must remain compressed, defined as a candle range significantly smaller than its own ATR.
This represents under-reaction or absorption despite external pressure.
Delayed Breakout Confirmation
Trades are triggered only after the mismatch occurs and Gold subsequently breaks its recent high or low over a configurable lookback period.
This delay avoids chasing impulses and focuses on release after compression.
Why This Is Different
Unlike traditional trend or correlation indicators, this script does not trade direction directly.
Instead, it evaluates effort versus response across two related markets, filtering out low-quality momentum and false breakouts.
The strategy focuses on:
Cross-asset pressure imbalance
Volatility-normalized conditions
Sequential confirmation rather than instant signals
How to Use
Designed primarily for XAUUSD charts
Works best on intraday timeframes (5m–15m)
Signals are strongest when aligned with higher-timeframe bias
Buy and sell signals are plotted directly on candles
Optional RR visualization can be enabled for reference
Limitations
Not predictive; signals are generated after candle close
Performance degrades during extremely low-liquidity or news-driven spikes
Intended as a decision-support tool, not a standalone trading system

[codapro] Confirmed Supertrend Flags
Confirmed Supertrend Flags — Delayed Flip Confirmation
Description:
This script enhances the classic Supertrend by adding a confirmation delay after trend flips, helping traders filter noise and avoid premature entries in volatile environments.
Key Features:
ATR-based Supertrend stop level calculation
Confirmation logic: buy/sell flags appear only after N full bars confirm the new direction
Optional Supertrend stop line for visual tracking
Fully adjustable flag size, color, label, and placement
This is ideal for swing traders, trend followers, or anyone building a system that prefers confirmation over early guessing.
How It Works:
A trend flip is detected when price closes beyond the Supertrend stop level.
The indicator waits for a set number of bars to close in the new direction.
After confirmation, a visual flag is plotted: buy below bar, short above bar.
How to Extend with Risk Management:
While this script focuses on trend confirmation visualization, you can enhance your decision-making by combining it with risk rules:
Stop Loss: Set SL just beyond the last Supertrend level before confirmation
ATR-Based Sizing: Use the same ATR value to dynamically size your position based on volatility
Fixed % Rule: Risk a fixed % of capital per confirmed flip (e.g., 1–2%)
Time-Based Exit: Exit trades that don’t follow through within N bars post confirmation
Stack with Strategy: Use this confirmation logic to trigger entries in a separate strategy script where strategy.entry() and strategy.exit() can be defined with precise risk parameters
Want a full example of how to integrate that? Let me know and I’ll turn this into a plug-and-play strategy version.
Disclaimer:
This tool was developed as part of the codapro AI engine — a modular signal and automation layer for trading systems.
It is for educational and informational purposes only and is not financial advice. Always backtest and verify before live deployment.

Session Anchored OIWAP [Arjo]The Session Anchored OIWAP (Open Interest Weighted Average Price) indicator shows you a weighted average price that uses Open Interest (OI) changes during different trading sessions . It divides the day into four clear sessions: Opening Hour , Morning Session , Mid-Day Session , and Closing Session .
For each session , it calculates a weighted average price using both market price and open interest data from futures . This line updates as the session progresses and resets when a new session starts .
You can also see optional deviation bands that you visually compare to how far the market price is moving away from the session’s weighted average. This indicator also helps you watch how Open Interest changes connect with price movements during specific market hours.
Concepts
This tool works on a few simple ideas:
Session anchoring
Each session starts fresh. The indicator resets and begins a new calculation when a new time block begins. This allows users to visually study each session independently.
Open-interest weighting
Instead of treating all price moves equally, price changes linked to higher open-interest activity have more influence on the OIWAP. This gives a weighted reflection of where the market has been trading during the session.
Averaging and smoothing
The OIWAP line blends many price data points into one smooth curve, making it easier to follow than raw price movement.
Volatility display with bands
The upper and lower bands are placed at ±0.5 standard deviation from the OIWAP line. These bands simply help you see when price stretches further away than usual from the session average.
Features
Four Independent Session Calculations: Shows separate OIWAP lines for Opening Hour (default: 09:15-10:15), Morning (10:15-11:30), Mid-Day (11:30-14:00), and Closing (14:00-15:30) sessions
Open Interest Weighting: Uses absolute OI change as the weight instead of traditional volume
Customizable Session Times: You can change the time ranges for each session to match your market or what you need
Optional Deviation Bands: You can turn ±0.5 standard deviation bands on or off around each OIWAP line
Color-Coded Sessions: Each session has its own color so you can tell them apart easily
Selective Display: You can turn individual sessions and bands on or off
Data Availability Check: Shows you a notification when Open Interest data isn't available for your symbol
Adjustable Position Timeframe: You can calculate OI changes on different timeframes (Chart, Daily, 15min, 30min, 60min, 120min)
How to use
Add this indicator to a chart of any symbol that has Open Interest data ( from futures or derivatives contracts). Once you add it, you'll see colored lines showing the OIWAP for each session you enable, along with optional deviation bands.
Adjusting Settings:
Turn individual sessions on or off using the checkboxes in the " Sessions " section
Change session colors to match your chart or what looks good to you
Turn deviation bands on or off using the " Show Bands " option in the Display settings
Change session time ranges in the " Session Times " section to match your market hours or what you want to analyze
Change the Position Timeframe if you want to see OI changes calculated on a different time period
Visual Interpretation:
Each OIWAP line shows you the OI-weighted average price for that session
The deviation bands show you how much prices spread out, weighted by OI changes
You can watch how price interacts with these levels to see where significant OI activity happened
Different sessions may show different OIWAP levels, showing you how the OI-price relationship changes throughout the trading day
Note:
This indicator needs Open Interest data to work. If OI data isn't available for your symbol, you'll see a message in the center of your chart. This indicator works only with derivatives markets like futures and options in the Indian Market where OI data is publicly available.
Conclusion
The Session Anchored OIWAP indicator is designed to support structured market observation by combining price, open interest, and session anchoring into a clear visual format. It helps users study market behavior during different parts of the day without generating trading instructions or outcomes.
Disclaimer
This indicator is for educational and visual-analysis purposes only. It does not provide trading signals , financial advice, or guaranteed outcomes . You should perform your own research and consult a licensed financial professional when needed. All trading decisions are solely the responsibility of the user.
Happy Trading

MoBo Bands - Momentum Breakout IndicatorDESCRIPTION
MoBo Bands (Momentum Breakout Bands) is a volatility-based breakout detection indicator that helps traders identify potential momentum shifts in the market. The indicator uses dynamic bands calculated from standard deviation to signal when price breaks above or below established ranges, indicating potential bullish or bearish momentum changes.
═════════════════════════════════════════════════════════════
KEY FEATURES
═════════════════════════════════════════════════════════════
- Dynamic upper and lower bands based on standard deviation
- Color-coded bands that change based on breakout direction (green for bullish, red for bearish)
- Visual breakout arrows marking entry points above/below bands
- Optional colored fill zones between bands showing current momentum state
- Customizable displacement for band projection
- Built-in alert system for breakout and breakdown signals
═════════════════════════════════════════════════════════════
HOW IT WORKS
═════════════════════════════════════════════════════════════
The indicator calculates a middle line using a Simple Moving Average (SMA) with upper and lower bands positioned using standard deviation multipliers. When price closes above the upper band, a bullish breakout (green) is signaled. When price closes below the lower band, a bearish breakdown (red) is signaled. The bands and fill zones remain colored until the opposite signal occurs, providing clear visual confirmation of the current momentum state.
═════════════════════════════════════════════════════════════
CUSTOMIZABLE INPUTS
═════════════════════════════════════════════════════════════
CALCULATION PARAMETERS:
- Price Source - Select which price data to use (default: close)
- Length - Period for SMA and standard deviation calculation (default: 10)
- Num Dev Up - Standard deviation multiplier for upper band (default: 0.8)
- Num Dev Down - Standard deviation multiplier for lower band (default: -0.8)
- Displace - Shift bands forward for projection analysis (default: 0)
DISPLAY OPTIONS:
- Colored Mobo - Enable/disable color-coded bands
- Colored Fill - Enable/disable fill zones between bands
- Break Arrows - Show/hide breakout and breakdown arrows
ALERT OPTIONS:
- Show Alerts - Enable/disable alert conditions
═════════════════════════════════════════════════════════════
USAGE GUIDE
═════════════════════════════════════════════════════════════
Watch for price to close outside the bands as potential breakout signals:
BULLISH BREAKOUT: Green arrow appears below the lower band when price closes above the upper band, indicating upward momentum shift.
BEARISH BREAKDOWN: Red arrow appears above the upper band when price closes below the lower band, indicating downward momentum shift.
The bands also serve as dynamic support and resistance levels. When bands are green, momentum is bullish. When bands are red, momentum is bearish.
═════════════════════════════════════════════════════════════
BEST PRACTICES
═════════════════════════════════════════════════════════════
- This indicator works well on liquid futures contracts (MNQ, MES, MYM, MGC, MCL) and major
currency pairs across multiple timeframes
- Lower deviation values (0.5-1.0) produce more frequent signals suitable for scalping
- Higher deviation values (1.5-2.5) filter for stronger breakouts ideal for swing trading
- Combine with volume indicators for additional confirmation
- Use with momentum oscillators to validate breakout strength
- Best results in trending market conditions
- Consider the overall market context and trend direction
════════════════════════════════════════════════════════════
ALERT CONFIGURATION
═════════════════════════════════════════════════════════════
Configure custom alerts for automated notifications:
- "MoBo BreakOUT" - Triggers on bullish breakout signals
- "MoBo BreakDOWN" - Triggers on bearish breakdown signals
Set alerts to "Once Per Bar Close" for confirmed signals and avoid false triggers during bar development.
═════════════════════════════════════════════════════════════
IDEAL FOR
═════════════════════════════════════════════════════════════
- Day traders and scalpers on futures markets
- Swing traders looking for momentum shifts
- Breakout trading strategies
- Trend following systems
- Works on stocks, forex, crypto, and commodities
- Effective across multiple timeframes (1min to daily)
═════════════════════════════════════════════════════════════
Perfect for traders seeking clear visual breakout signals with minimal lag. The color-coded system and arrow markers make it easy to identify momentum changes at a glance.
© 2024 NPR21 | Mozilla Public License 2.0
Open-source script
NPR21
Disclaimer
The information and publications are not meant to be, and do not constitute, financial, investment, trading, or other types of advice or recommendations supplied or endorsed by

Open Interest Weighted Average Price [Arjo]Open Interest Weighted Average Price , or OIWAP , is a simple visual indicator that shows the average price of an asset based on changes in open interest .
Instead of using trading volume like VWAP, this indicator gives more weight to prices where new futures contracts are being added or removed . This helps highlight the price levels where traders are actively building or closing positions.
The indicator shows:
A main line that represents the average price weighted by open interest changes.
Upper and lower bands (standard deviation bands) that show how far the price moves away from this average.
OIWAP is mainly useful for NSE futures markets , where open interest data is available. It helps traders visually understand where most market participation and positioning are taking place relative to price .
Concepts:
Applies statistical concepts, including weighted averaging and standard deviation, to open interest data
Uses the absolute change in open interest as a weighting factor for each price point
Creates a dynamic average that reflects where significant open interest activity has occurred during a given period
Standard deviation bands are computed from this weighted average to show the statistical spread of prices around the OIWAP line
Resets calculations based on user-selected time periods (daily, weekly, monthly, or session-based)
Allows for fresh analysis at regular intervals
Similar concept to volume-weighted average price (VWAP) indicators, but uses open interest changes as the weighting component
Features:
Weighted Average: Calculates a central line based on contract activity.
Flexible Anchors: Allows users to choose the reset period for the calculation.
Volatility Bands: Displays outer and mid-bands to visualize price stretches.
Data Check: Built-in alerts notify you if Open Interest data is missing for a symbol.
Visual Zones: Color-coded areas help identify price location at a glance.
How To Use
When you add the indicator to your chart, you will see:
A main OIWAP line — the open-interest-weighted price level
Mid-bands around the line (±0.5 standard deviations)
Outer bands farther away (±2.0 standard deviations)
Shaded background zones between these lines
You can:
Change the reset period to see how the average behaves over different time ranges
Adjust the timeframe for open-interest data
Turn mid-bands on or off
Adjust colors and styles to improve readability
Conclusion
The OIWAP indicator serves as an educational tool for visualizing the relationship between price movements and open interest activity in futures markets
Presents a weighted average price line along with statistical deviation bands
Offers a structured framework for chart analysis
Customizable settings allow users to adapt the display to their analytical preferences
Maintains focus on visual interpretation rather than directional predictions
Functions as a supplementary charting overlay that may complement other forms of technical and fundamental analysis
Disclaimer
This indicator is for educational and visual-analysis purposes only. It does not provide trading signals, financial advice, or guaranteed outcomes . You should perform your own research and consult a licensed financial professional when needed. All trading decisions are solely the responsibility of the user.

Swing Traders Panel: Beta RVOL ATR Market Sector FnG ImtiazHA compact decision-support panel for swing traders combining volatility, relative volume, market & sector regime, and a 3-zone Fear/Greed filter to improve trade context and risk management.

Average Candle SizeI created this indicator because I couldn't find a simple tool that calculates just the average candle size without additional complexity. Built for traders who want a straightforward volatility measure they can fully understand. How it works:
1. Calculate high-low for each candle
2. Sum all results
3. Divide by the total number of candles
Simple math to get the average candle size of the period specified in Length.

able MACD Overview
Purpose: The indicator combines the traditional MACD (Moving Average Convergence Divergence) with a short-term “forecast” (projection) of MACD/histogram values to give early warning of momentum changes.
Typical outputs:
MACD line (fastEMA − slowEMA)
Signal line (EMA of MACD)
Histogram (MACD − signal)
Forecasted MACD or histogram projected N bars ahead
Optional buy/sell markers and alert conditions
Add the indicator to TradingView (Installation)
Open TradingView and the chart you want to apply the indicator to.
Click “Pine Editor” at the bottom of the chart.
Copy the contents of able_macd_forecast.pine into the Pine Editor window.
Click “Add to chart” (or Save then Add to chart). If it’s a study, it will appear on the chart below price.
If you plan to re-use the script, click Save and give it a meaningful name.
Inputs / Parameters (typical) Note: exact input names may differ in your script. Replace the names below with the script’s input labels when you inspect it.
Source: price source for calculations (close, hl2, etc.).
Fast Length: length for the fast EMA (commonly 12).
Slow Length: length for the slow EMA (commonly 26).
Signal Length: length for the MACD signal EMA (commonly 9).
Forecast Length / Horizon: how many bars ahead the script projects the MACD/histogram (e.g., 1–5).
Forecast Method / Smoothing: choice of projection method (linear regression, EMA extrapolation, simple slope * N, etc.) if available.
Histogram Thresholds: numeric thresholds to emphasize significant momentum (optional).
Show Forecast: toggle on/off the forecast plot.
Alerts On/Off toggles: enable or disable alert conditions baked into the indicator.
Visual / Style settings: colors, plot thickness, histogram style (columns/areas), show labels, show buy/sell arrows.
How the indicator is typically calculated (summary)
MACD line = EMA(source, fast) − EMA(source, slow)
Signal line = EMA(MACD line, signal length)
Histogram = MACD − Signal
Forecast = method-specific short-term projection of MACD or histogram (for example: extend the last slope forward, apply linear regression to MACD values and extrapolate N bars, or apply an additional smoothing and extend that value) Note: For exact math, I need to inspect the script; this is the typical approach.
How to read the indicator (signals & interpretation)
Bullish signal:
MACD line crossing above the signal line (MACD cross up).
Histogram turns positive (cross above zero).
Forecast shows MACD/histogram moving higher in the next N bars (if forecast is positive or trending up).
Bearish signal:
MACD line crossing below the signal line (MACD cross down).
Histogram turns negative (cross below zero).
Forecast shows MACD/histogram moving lower ahead.
Confirmations:
Use price action (higher highs/lows for bullish, lower highs/lows for bearish).
Volume or other momentum/confluence indicators (RSI, ADX).
Divergences:
Bullish divergence: price makes lower low while MACD histogram makes higher low.
Bearish divergence: price makes higher high while MACD histogram makes lower high.
Forecast behavior:
If the forecast leads the MACD cross (forecast crosses before the current MACD does), it’s an early warning.
Use caution: forecasts are prone to false signals; always confirm.
Common trading setups using this indicator
Conservative:
Wait for MACD to cross signal + histogram above zero + forecast already trending same direction.
Use stop below recent swing low (for long) or above recent swing high (for short).
Aggressive (early entry):
Enter when forecast turns positive while MACD still below signal (anticipating cross).
Use tighter stops and smaller position sizes.
Exit rules:
Opposite MACD cross, histogram flipping sign, or a target based on risk-reward.
Use trailing stop based on ATR or structure.
Example settings for different timeframes (starting points)
Scalping / 5–15 min:
Fast 8, Slow 21, Signal 5, Forecast 1–2
Intraday / 1H:
Fast 12, Slow 26, Signal 9, Forecast 2–3
Swing / 4H–Daily:
Fast 12, Slow 26, Signal 9, Forecast 3–5 Adjust based on the asset volatility and backtests.
Adding alerts (TradingView)
Click the “Alerts” button (clock icon) or press Alt + A.
In the Condition dropdown, select the indicator name (able_macd_forecast) and choose a plotted series or built-in alert condition (if the script uses alertcondition).
Common alert types:
MACD crosses Signal (Crossing)
Histogram crosses 0 (Crossing)
Forecast crosses 0 or Forecast trend change (if provided)
Message templates:
“{{ticker}}: MACD crossed above signal on {{interval}}”
“{{ticker}} Forecast positive: MACD forecast shows upward momentum”
Customize the message for your trade automation or notifications.
Configure frequency (Only once, Once per bar, or Once per bar close) — for signals like crossovers, “Once per bar close” is usually safer to avoid repainting issues. Note: If the script includes alertcondition() calls with explicit IDs/messages, use those directly — they are the most reliable for automation.
Backtesting / Strategy conversion
If this script is a study (indicator), you can:
Convert it to a strategy by adding strategy.* order calls (strategy.entry, strategy.close) using the entry/exit logic you prefer, or
Use TradingView’s “Bar Replay” to manually test signals across different markets/timeframes.
If you want, I can help convert or write a strategy wrapper that uses the indicator’s signals to place backtest trades (I’ll need the code).
Practical tips & best practices
Use higher timeframe confirmation for lower-timeframe entries (e.g., check daily MACD momentum before trading 15m signals).
Beware of choppy markets; MACD / forecast may produce whipsaws. Combine with trend filters (moving average direction, ADX).
If you rely on forecasted values, prefer alerts “on bar close” when possible to reduce false alerts from intra-bar noise.
Tune parameters for the specific asset (FX, crypto, stocks have different behavior).
Record each signal and outcome for a sample period (20–100 trades) to evaluate performance.
Troubleshooting
Indicator won’t add: verify Pine version in script header (//@version=4 or //@version=5). TradingView may reject scripts with unsupported version syntax.
Plots missing: check script inputs (Some scripts hide plots if toggles are off).
Alerts firing too often: change alert frequency to “Once per bar close” or adjust threshold values.
Forecast seems to repaint: some forecast methods can repaint (use “bar_index” or store values only on closed bars, or use non-repainting forecast methods). Ask me to inspect the script for repainting logic.
What I can do next (recommended)
If you paste the content of able_macd_forecast.pine here, I will:
Produce a precise, line-by-line usage guide mapping to the exact input names and default values.
Show the exact plotted series names and how to reference them for alerts.
Point out any repainting risks and suggest fixes.
Provide example alert messages that match the script’s alertcondition IDs (if any).
Optionally convert it into a strategy for backtesting, or add non-repainting forecast logic if needed.

Hindenburg OmenThe Hindenburg Omen highlights periods of internal market stress — when both new 52-week highs and new lows expand while the NYSE remains in an uptrend.
This condition often precedes major corrections or volatility spikes by revealing divergence beneath the surface of an advancing market.
The indicator triggers when four classic breadth rules align: elevated highs and lows, a positive trend, a negative McClellan Oscillator, and a highs-to-lows ratio under 2:1.
Use it on broad indices (NYSE, S&P 500) as an early-warning context tool, NOT a standalone sell signal.

SMC ORB vs Pre-Market SPY/IWMStacks institutional confluences such as Smart Money Concepts, Inner Circle Trading, volatility, and structure.
Plots Premarket high/low and 15 minute Opening range
Plots the first sweep of Premarket high/low and any subsequent orb breaks

SMC ORB vs PM ALPHADesigned to stack institutional confluences such as Smart Money Concepts, Inner Circle Trading, volatility, and market structure.
Plots pre-market high/low and 15 Opening Range.
Plots first sweep of Pre-market high/low as well as orb break/holds.
TP of Previous high/low & SL optional
