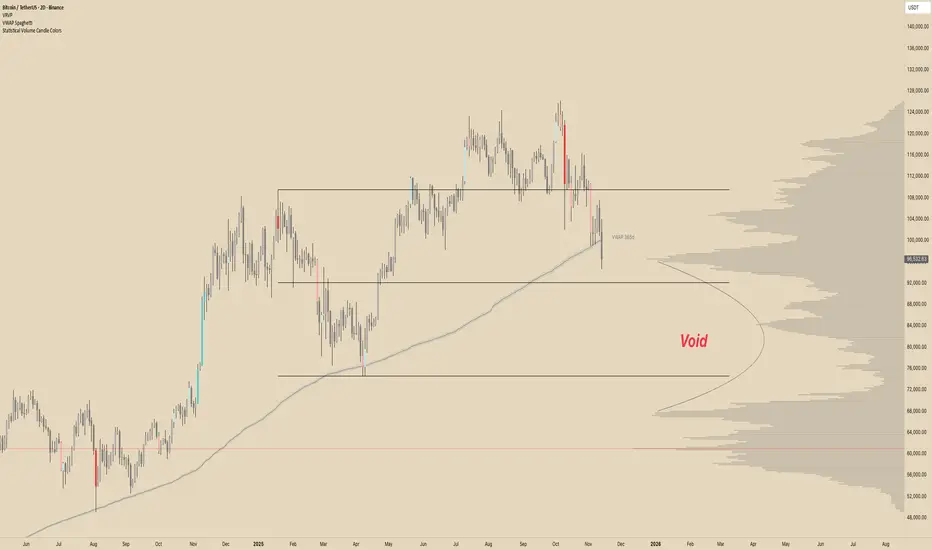
Statistical Volume With Candle ColorsStatistical Volume Candle Colors
Statistical Volume Candle Colors is a simple, powerful tool that visually highlights candles based on how unusual their volume is compared to recent history. Instead of using fixed thresholds, it uses standard deviation statistics to identify when volume is normal, elevated, or extremely high — and colors candles accordingly.
This makes it easy to spot high-interest moments in the market where buyers or sellers stepped in aggressively.
⸻
How It Works
The script looks back over a user-defined period (default 20 candles) and calculates:
• Average volume (SMA)
• Standard deviation of volume
• Two dynamic thresholds:
• 1st standard deviation level
• 2nd standard deviation level
These levels scale automatically with market conditions, so the indicator adapts whether volume is high or low overall.
⸻
Color Logic
Each candle gets a color based on two factors:
1. Price direction
• Bullish → close ≥ open
• Bearish → close < open
2. How extreme the candle’s volume is
The script evaluates volume vs statistical thresholds:
Normal Volume
• Bullish normal → gray
• Bearish normal → dark gray
Above 1st Standard Deviation
• Bullish → light teal
• Bearish → light red
Above 2nd Standard Deviation (very high volume)
• Bullish → bright teal
• Bearish → bright red
These colors clearly separate routine candles from statistically significant ones.
⸻
Why This Is Useful
• Identify high-participation moments — where institutions or large players may be active
• Spot exhaustion or absorption — extreme volume at highs/lows
• Confirm breakouts — price moves backed by strong volume deviations
• Filter noise — see only candles that matter statistically
⸻
Customization
You can adjust:
• Lookback period (how far back to measure volume stats)
• Std dev multipliers (how strict the thresholds are)
• All colors (normal, high-volume, extreme-volume, bullish/bearish)
• Transparency level
This makes the indicator flexible for any trading style or timeframe.
⸻
In short:
Statistical Volume Candle Colors transforms standard candles into a volume-based heatmap, highlighting exactly when the market shows real interest — and when it doesn’t. It’s a simple drop-in replacement for standard candles that adds powerful context with zero extra chart clutter.
Search in scripts for "Volume"
[Saga Trading] Volume Pro Volume Pro is an advanced volume indicator designed to detect spikes in institutional activity by analyzing volume variations relative to their moving average.
It helps identify Climax Volume zones—moments when large accumulation or distribution orders occur—in order to anticipate potential trend reversals or continuations.
This indicator is optimized for crypto, indices, forex, and futures markets, and fits seamlessly into a multi-timeframe, order-flow, and institutional behavior analysis.
✅ Built-in alerts!
For optimized settings, feel free to contact me!
5 minutes ago
Release Notes
Volume Pro is an advanced volume indicator designed to detect spikes in institutional activity by analyzing volume variations relative to their moving average.
It helps identify Climax Volume zones—moments when large accumulation or distribution orders occur—in order to anticipate potential trend reversals or continuations.
This indicator is optimized for crypto, indices, forex, and futures markets, and fits seamlessly into a multi-timeframe, order-flow, and institutional behavior analysis.
✅ Built-in alerts!
For optimized settings, feel free to contact me!

JOEJOE VOLUME UNIVERSAL 03112025A universal volume screener that identifies when institutions are aggressively buying a stock by comparing current activity to recent averages, then recommends position sizing based on signal strength.
JOEJOE SHARK INDICATOR - Summary
🎯 Purpose
A volume-based screener that detects institutional buying activity and high-conviction trading opportunities across all global markets (Malaysia, US, Crypto).
📊 What It Does
Identifies 4 Types of Signals:
🟣 Purple Bar (A+ / High Conviction) - Best signal: Both institutional buying AND buy value surge detected
🟡 Yellow Bar (Buy Value Surge) - Strong money inflow detected
🔵 Blue Bar (Institutional Buying) - Large volume with strong buyer control
🟢🔴 Green/Red Bars - Normal volume (no special signal)
🔍 Key Innovation
Universal Design:
Works on ANY market without code changes
Uses relative comparisons (2.5x average) instead of fixed thresholds
Automatically adapts to each stock's normal behavior
Malaysian stocks, US stocks, Bitcoin - all use same logic
📈 Signal Detection Logic
Purple Bar Requirements (ALL must be met):
Volume exceeds 2x the 20-day average (institutional size)
Buy value exceeds 2.5x the 20-day average (money surge)
Price closes in top 30% of candle range (buyer strength)
Price above 50-period EMA (uptrend filter)
Short-term volume MA above long-term (sustained interest)
Candle body is at least 30% of range (decisive move)
Bullish candle (green)
⚙️ Customizable Settings
Signal Configuration:
Buy Value Surge Multiplier (default: 2.5x)
Volume Multiplier (default: 2.0x)
Buyer Strength Threshold (default: 0.7)
Lookback period (default: 20 bars)
Filters (All Toggle-able):
Trend filter with customizable MA length
Sustained interest filter (volume momentum)
Decisiveness filter (candle body size)
Option to require/not require bullish candles
Visual Customization:
All colors adjustable
Toggle markers and dashboard on/off
Volume MA display options
📊 Smart Position Sizing Feature
Calculates Signal Strength (0-100):
Combines Volume Ratio score + Buy Value Ratio score
Higher ratios = higher strength
Position Size Recommendations:
80-100 → 🔥 FULL SIZE (maximum confidence)
60-79 → 75% position (high confidence)
40-59 → 50% position (moderate confidence)
0-39 → 25% position or skip (low confidence)
Purpose: Not all A+ signals are equal - size your position based on actual signal quality
📱 Enhanced Dashboard Display
When High Conviction Signal Active:
Signal status (Active/Inactive)
Signal strength score with emoji indicator
Volume ratio (e.g., 3.2x)
Buy value ratio (e.g., 4.1x)
R/R ratio placeholder (future enhancement)
Position size recommendation with color coding
Visual Indicators:
Blue triangle "A+" marker at chart top
Color-coded position size backgrounds
Professional bordered table
All text in bright blue for visibility
🔔 Alert System
3 Alert Types:
High Conviction Signal (purple bar)
Buy Value Surge (yellow bar)
Institutional Buying (blue bar)
Alert Messages Include:
Ticker symbol
Current price
Signal type with emoji
💡 Screening Workflow
Multi-Chart Setup:
Open 4x4 or 6x3 chart grid
Load watchlist of stocks
Apply indicator to all charts
Scan top-right corners for active signals
Look for blue "A+" triangles at chart tops
Check signal strength scores
Focus on stocks with 80+ scores
🎓 Best Practices
Recommended Settings by Market:
Bursa Malaysia:
Buy Value Multiplier: 2.0-2.5
Volume Multiplier: 2.0
Timeframe: Daily
US Stocks (NYSE/NASDAQ):
Buy Value Multiplier: 2.5-3.5
Volume Multiplier: 2.5
Timeframe: Daily or 4H
Bitcoin/Crypto:
Buy Value Multiplier: 3.5-5.0
Volume Multiplier: 2.5-3.5
Timeframe: Daily or 4H
⚡ Key Advantages
Objective - Based on volume and price data, not subjective patterns
Universal - One indicator for all markets
Adaptive - Compares each stock to its own history
Risk-Aware - Built-in position sizing logic
Screener-Ready - Visual tools for scanning multiple charts
Filter-Heavy - Multiple filters reduce false signals
Customizable - Every parameter adjustable through settings
🚫 What It Doesn't Do
No price targets or stop losses
No prediction of how high price will go
No guarantee of profitability
Doesn't tell you when to exit
Doesn't account for fundamentals or news
R/R ratio currently a placeholder
🎯 Ideal Use Cases
✅ Swing trading - Catching institutional accumulation phases
✅ Stock screening - Finding high-conviction setups in watchlists
✅ Position sizing - Scaling in based on signal quality
✅ Multi-market trading - One tool for Malaysia, US, crypto
✅ End-of-day analysis - Daily timeframe scanning
❌ NOT ideal for:
Scalping (too much noise on low timeframes)
Short selling (designed for long signals)
Range-bound markets (requires uptrend)

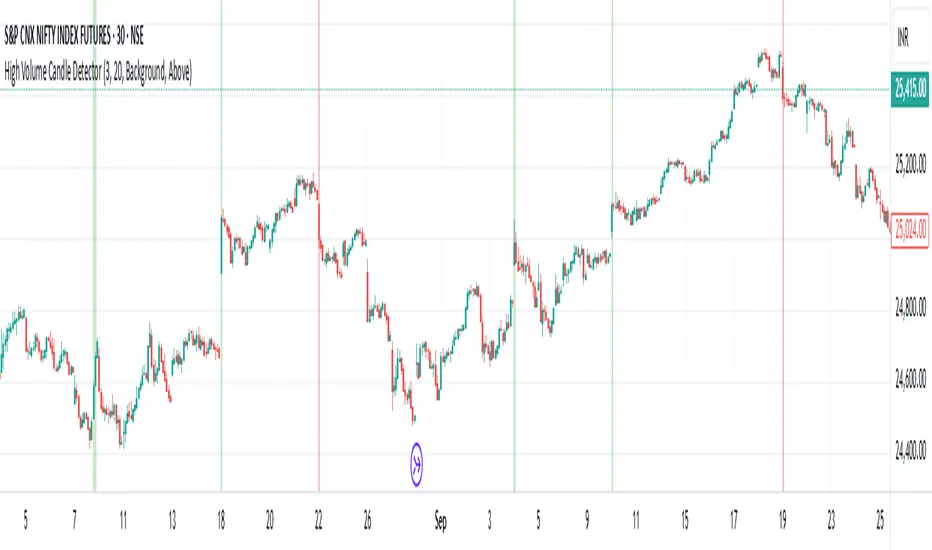
High Volume Candle Detector by Ravi Shinde📊 High Volume Candle Detector
🎯 Overview
Identify exceptional volume spikes that signal institutional activity, breakouts, and reversals. Detects candles with volume exceeding a customizable threshold (default: 3x average volume over 20 periods).
✨ Key Features
🔧 Customizable Settings
Volume Multiplier (default: 3.0x) - Define your threshold
Average Period (default: 20) - Adapt to any timeframe
Bullish/Bearish Detection - Automatic color coding (green/red)
🎨 Visual Styles
Background - Subtle colored highlighting
Border - Yellow box outline
Shape - Triangle markers with "HV" text
All - Combined display
🔔 Smart Alerts
Bullish High Volume 🟢
Bearish High Volume 🔴
Any High Volume ⚠️
📈 Derivatives Trading Method
High-volume candle highs and lows mark key breakout levels. Break above = Go Long. Break below = Go Short. Trail your stop-loss with a moving average of your choice for optimal risk management. Optimal performance on 15-minute or higher timeframes. Lower timeframes may generate excessive noise.
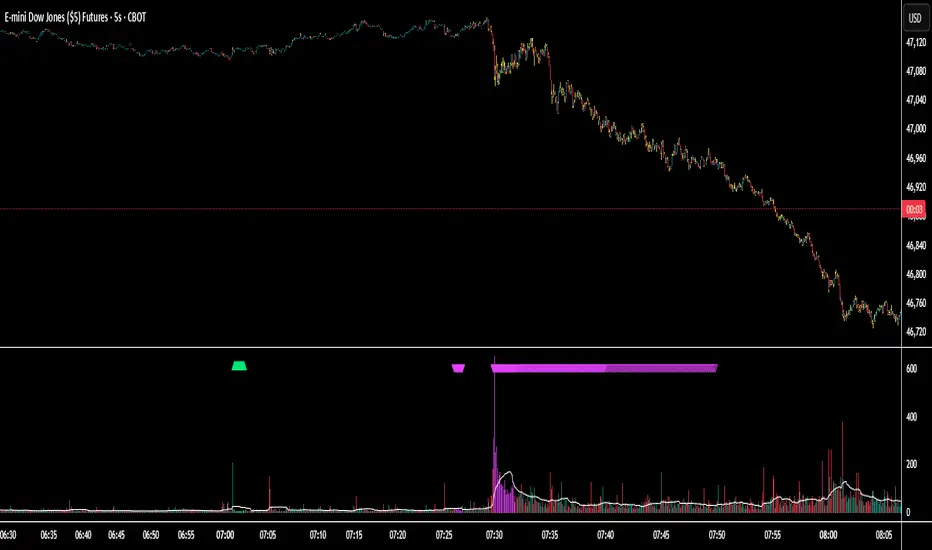
Session Volume Spike Detector (MTF Arrows)Overview
The Session Volume Spike Detector is a precision multi-timeframe (MTF) tool that identifies sudden surges in buy or sell volume during key market windows. It highlights high-impact institutional participation by comparing current volume against its historical baseline and short-term highs, then plots directional markers on your chart.
This version adds MTF awareness, showing spikes from 1-minute, 5-minute, and 10-minute frames on a single chart. It’s ideal for traders monitoring microstructure shifts across multiple time compressions while staying on a fast chart (like 1-second or 1-minute).
Key Features
Dual Session Windows (DST-aware)
Automatically tracks Morning (05:30–08:30 MT) and Midday (11:00–13:30 MT) activity, adjusted for daylight savings.
Directional Spike Detection
Flags Buy spikes (green triangles) and Sell spikes (magenta triangles) using dynamic volume gates, Z-Score normalization, and recent-bar jump filters.
Multi-Timeframe Projection
Displays higher-timeframe (1m / 5m / 10m) spikes directly on your active chart for continuous visual context — even on sub-minute intervals.
Adaptive Volume Logic
Each spike is validated against:
Volume ≥ SMA × multiplier
Volume ≥ recent-high × jump factor
Optional Z-Score threshold for statistical significance
Session-Only Filtering
Ensures spikes are only plotted within specified trading sessions — ideal for futures or intraday equity traders.
Configurable Alerts
Built-in alert conditions for:
Any timeframe (MTF aggregate)
Individual 1m, 5m, or 10m windows
Alerts trigger only when a new qualifying spike appears at the close of its bar.
Use Cases
Detect algorithmic or institutional activity bursts inside your trading window.
Track confluence of volume surges across multiple timeframes.
Combine with FVGs, bank levels, or range breakouts to identify probable continuation or reversal zones.
Build custom automation or alert workflows around statistically unusual participation spikes.
Recommended Settings
Use on 1-minute chart for full MTF display.
Adjust the SMA length (default 20) and Z-Score threshold (default 3.0) to suit market volatility.
For scalping or high-frequency environments, disable the 10m layer to reduce visual clutter.
Credits
Developed by Jason Hyde
© 2025 — All rights reserved.
Designed for clarity, precision, and MTF-synchronized institutional volume detection.
Buy/Sell Volume Bubbles on Candles🎯 New Big Order Filter Features:
Volume Filter Settings (New Group):
Enable Big Order Filter (Default: ON)
Toggle to show only significant volume
When OFF, shows all bubbles
Volume Threshold (Default: 1.5x)
Overall volume must exceed average by this multiple
1.5 = 150% of average (only big volume candles)
Range: 0.5x to 5.0x
Min Buy Volume Threshold (Default: 1.2x)
Buy volume must exceed average buy volume
1.2 = 120% of normal buying
Filters out small buy orders
Min Sell Volume Threshold (Default: 1.2x)
Sell volume must exceed average sell volume
1.2 = 120% of normal selling
Filters out small sell ordersPractical Examples:
Conservative (Show fewer, bigger orders):
Volume Threshold: 2.0x (only double-average volume)
Buy/Sell Threshold: 1.5x (only strong buying/selling)
Result: Very clean chart, institutional-sized orders only
Moderate (Default - Good balance):
Volume Threshold: 1.5x
Buy/Sell Threshold: 1.2x
Result: Shows significant orders, filters noise
Aggressive (Show more activity):
Volume Threshold: 1.0x
Buy/Sell Threshold: 0.8x
Result: More bubbles, captures medium orders
Use Cases:
🐋 Whale Watching (Set 2.5x+):
Only massive institutional orders
Spot market makers and big players
📊 Swing Trading (Set 1.5x):
Significant volume clusters
Key support/resistance confirmation
⚡ Active Trading (Set 1.2x):
More frequent signals
Better order flow visibility
Chart Clarity:
✅ No more bubble clutter
✅ Focus on significant orders
✅ Easy to spot institutional activity
✅ Independent buy/sell filtering

Smart Money — Volume Panel + OBV Smart Money — Volume Panel + Scaled OBV
This indicator combines classic volume analysis with a scaled On-Balance Volume (OBV) line, helping spot smart money activity:
Volume bars – color changes dynamically:
🟢 green = high volume & OBV rising
🔴 red = high volume & OBV falling
🟠 orange = high volume but OBV neutral
⚪ gray = low volume
Yellow line – volume moving average (MA)
Purple line – high-volume threshold (MA × multiplier)
OBV line (green/red) – scaled OBV plotted in the same range as volume for easier comparison.

Realistic Trader Volume, Consolidation, Zones v.2Realistic Trader Volume, Consolidation, Zones v.2
This volume-focused indicator gives you a clean, high-resolution view of market momentum and consolidation, without relying on a traditional volume panel.
A more intuitive volume tool that highlights relative volume conditions directly on candles
Surge bars color-coded based on context:
→ Green = Bullish Volume
→ Red = Bearish Volume
→ Gray = Continuation / Decline
Consolidation zones shown with white candles, identifying both currently forming and historical bases
Yellow arrows indicate consolidation breaks with volume surges, suggesting key shifts in momentum
Can help confirm when the market is likely to accelerate during a session
Useful for spotting early signs of reversals: Green after selloffs = potential buyers stepping in; Red after rallies = potential sellers stepping in
Zones can be manually drawn around a yellow arrow and its preceding white candle for more visual clarity
The bigger the green or red surge bar following a yellow arrow, the more powerful the zone
Works across all timeframes
Best used in combination with:
Realistic Trader Prior Days Levels & Zones
Realistic Trader Intraday Dynamic Zones & Levels
Realistic Trader Early Price Breaks & Confirmation (15min Only)
Realistic Trader Directional Bias
Pro Tip:
Yellow arrows mark key moments when consolidation ends and volume spikes begin. The taller the breakout candle that follows the yellow arrow, the stronger and more reliable the resulting zone is likely to be.
Enhanced Split Buy Sell VolumeCore Components and What They Show
1. Buy Volume (Green Columns Above Zero):
Represents estimated buying pressure: The portion of total volume attributed to buyers, calculated as volume * (close - low) / (high - low).
How to Read: Taller green bars indicate stronger buying interest in that candle. If the close is near the high, most volume is assigned to buys (green bar dominates).
Highlight (Lime Color): If buy volume exceeds the average volume by the threshold (default 1.5x), it turns lime. This signals a potential "buy climax" or surge in demand—watch for breakouts or reversals.
2. Sell Volume (Red Columns Below Zero):
Represents estimated selling pressure: The remainder of volume, calculated as volume * (high - close) / (high - low).
How to Read: Taller red bars (extending further below zero) show stronger selling. If the close is near the low, sell volume dominates.
Highlight (Fuchsia Color): Turns fuchsia for high sell volume, indicating a "sell climax" or heavy supply—could signal breakdowns or exhaustion.
3. Zero Line (Dotted Gray Horizontal Line):
Acts as a neutral divider: Green above = net buying; red below = net selling.
How to Read: Compare the "mirror image" of green and red heights. If green is consistently taller than red (e.g., over multiple candles), it suggests building bullish momentum.
4. Net Volume MA (Blue Line):
A moving average (default 14 periods) of net volume (buy volume minus sell volume).
How to Read:
Above zero and rising: Bullish volume trend—buyers are gaining control.
Below zero and falling: Bearish volume trend—sellers dominate.
Crosses zero: Potential shift in momentum (e.g., from bearish to bullish if crossing up).
Divergences: If price makes new highs but the MA flattens or drops, it could signal weakening momentum (bearish divergence).

Cumulative Volume Delta📊 Indicator Name:
Cumulative Volume Delta (CVD) + Candle Divergence (Color DIfference)
📌 Purpose:
This indicator visualizes volume delta over a user-defined time anchor and highlights divergence between volume-based momentum and price movement. It's especially useful for identifying potential reversals, fakeouts, or hidden buying/selling pressure.
🔍 How It Works:
1. Volume Delta Calculation (CVD Candles):
The script uses ta.requestVolumeDelta() to approximate volume delta data over a chosen anchor period (e.g., 1D).
Volume delta = Buy Volume – Sell Volume
Each candle on the CVD chart represents changes in cumulative volume delta, with OHLC-style values:
openVolume: cumulative delta at the start of the bar
lastVolume: cumulative delta at the end of the bar
maxVolume, minVolume: intra-bar high and low
2. Visual Representation (CVD Candles):
Green/Teal candle: Delta is increasing (buying pressure dominates)
Red candle: Delta is decreasing (selling pressure dominates)
3. Divergence Detection:
The script compares the direction of the price candle with the direction of the CVD candle:
Price Up + CVD Down → Possible hidden selling (bearish divergence)
Price Down + CVD Up → Possible hidden buying (bullish divergence)
4. Color Highlighting:
Orange candle on the CVD chart signals divergence between price and volume delta.
This color override helps you quickly spot potential discrepancies between price movement and underlying volume pressure.
5. Alerting:
An alertcondition is added so you can receive a notification whenever a divergence occurs.
⚙️ User Inputs:
Anchor period (e.g., 1D): Timeframe over which the CVD is anchored.
Use custom timeframe: Allows you to override and define the internal lower timeframe used for volume estimation (e.g., 1-min).
📈 How to Use It:
✅ Bullish Divergence (Price down, CVD up)
This may indicate:
Buyers absorbing selling pressure.
A potential reversal to the upside.
Hidden accumulation.
🚫 Bearish Divergence (Price up, CVD down)
This may indicate:
Sellers stepping in despite upward price.
A potential reversal to the downside.
Hidden distribution.
🧠 Trading Insights:
CVD is often used by order flow traders or those analyzing market depth and volume imbalances.
This version lets you visually align price action with underlying volume, improving decision-making.
The divergence signal can be combined with other technical tools like support/resistance, candlestick patterns, or trendlines for confirmation.

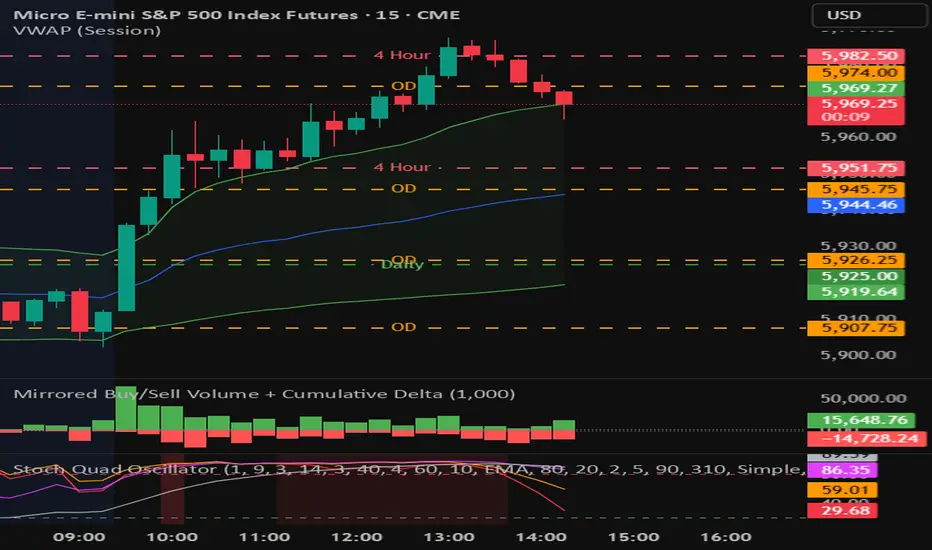
Mirrored Buy/Sell Volume + Cumulative DeltaUser Guide: Mirrored Buy/Sell Volume (Histogram)
🔍 What It Does
Displays green bars above zero for estimated buy volume
Displays red bars below zero for estimated sell volume
Adds a blue line showing Cumulative Delta (buy − sell over time)
Optional threshold lines help spot when net momentum builds up
📊 How Volume is Estimated
Same estimation method as the table version:
Buy Volume is proportion of volume estimated using (close - low) / (high - low)
Sell Volume is remainder of the total volume
Cumulative Delta = running total of (Buy − Sell) volume
This gives you:
A real-time sense of which side is gradually gaining control
More context than looking at candles or volume bars alone
✅ Best For
Visual trade decision support: who’s winning the tug-of-war?
Spotting trend initiation or momentum shifts
Combining with oscillator/trend tools for confirmation
⚠️ Limitations
Still an approximation — not based on actual trade aggressor data
Cannot separate passive vs. aggressive orders
Cumulative Delta does not reset unless specifically coded to do so
May mislead if the bar has long wicks or closes near midpoint
Bull vs Bear Volume on Price ChartThis script overlays estimated bullish and bearish volume directly on the price chart, making it easy to spot buying vs. selling pressure without switching to a separate volume pane.
🔍 Features:
📈 Bullish volume markers appear as green triangles below the candle.
📉 Bearish volume markers appear as red triangles above the candle.
🔄 Optional smoothing to reduce noise using simple moving average (SMA).
⚠️ Volume spike highlights: Bullish spikes turn lime green, bearish spikes turn bright red.
🔢 Toggle labels to see estimated volume values above/below each candle.
🔄 Works on all timeframes, from intraday to weekly/monthly charts.
📐 Methodology:
Bullish and bearish volume are estimated using the candle's range:
More bullish volume when the close is near the high.
More bearish volume when the close is near the low.
This is a visual proxy, not true order flow data.

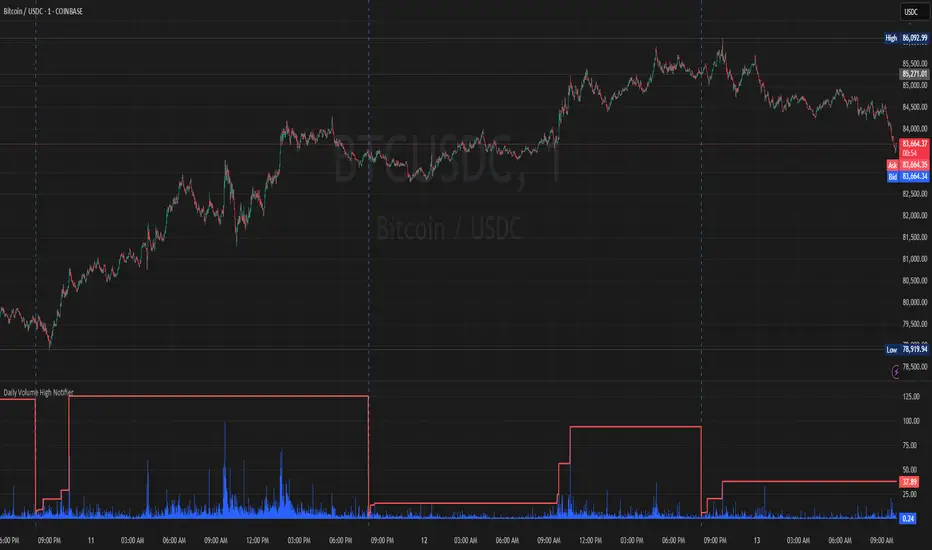
Daily Volume High Notifier📜 Script Description – Daily Volume High Notifier
This indicator monitors trade volume and sends an alert whenever a new daily high in volume is reached. The high volume is reset at the beginning of each trading day, allowing traders to stay informed of significant intraday volume spikes.
🛠️ Features:
Tracks the highest trade volume for the current day.
Resets the volume high tracker at the start of each new day.
Sends a real-time notification (alert()) whenever a new volume high is detected.
Useful for identifying unusual activity, potential breakouts, or institutional participation.
📊 Visual Elements:
Blue histogram for standard volume.
Red line showing the current day’s highest volume so far.
🔔 How to Use:
Add the script to any chart.
Enable alerts using the built-in alert() function.
Receive notifications every time volume hits a new high for the day.
🔔 Setting up Alerts in TradingView:
After adding this indicator to your chart:
Click the Alarm Clock (Alerts) icon.
Set condition: Daily Volume High Notifier → alert() function call .
Choose your alert type (app notification, email, popup, etc.).
Name it something like "Volume High Alert" and hit Create.
This tool is ideal for day traders, scalpers, and volume-based strategy traders who want to be instantly notified of spikes in market activity.
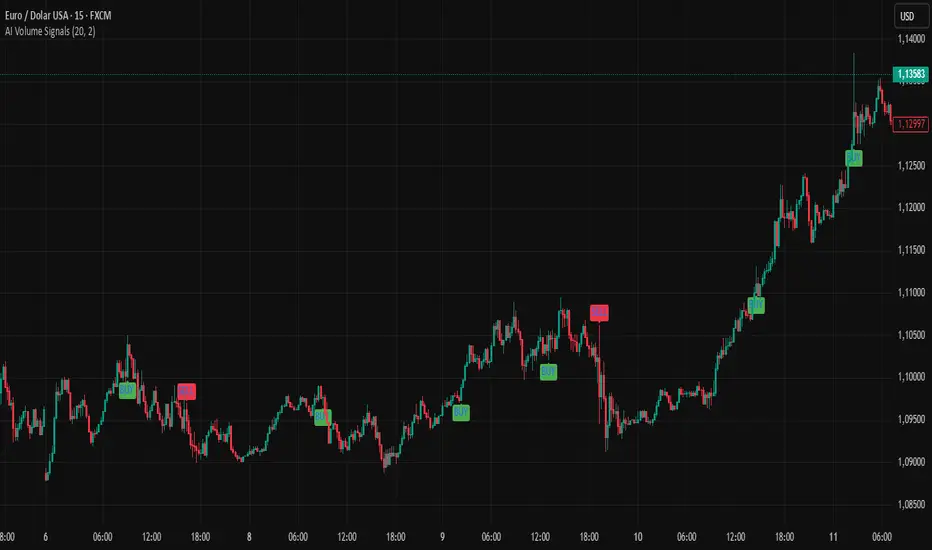
AI Volume SignalsAI Volume Signals
The AI Volume Signals indicator detects significant volume spikes and combines them with trend direction and candle color to generate buy and sell signals. This script utilizes an Exponential Moving Average (EMA) of volume to detect abnormal volume spikes, which could indicate strong market activity. It also filters signals based on the trend direction determined by a 50-period EMA of the price.
Key Features:
Volume Spike Detection: The indicator detects when the current volume exceeds the EMA of volume by a user-defined multiplier, signaling an unusual increase in market activity.
Trend Direction Filter: The 50-period EMA of the price is used to determine the market trend. Buy signals are generated when the price is above the EMA (uptrend), and sell signals occur when the price is below the EMA (downtrend).
Candle Color Filter: The indicator only generates a buy signal when the current candle is bullish (green), and a sell signal when the current candle is bearish (red).
Optional Volume EMA Line: A customizable option allows users to toggle the visibility of the Volume EMA line on the chart. By default, the line is hidden, but can be enabled in the settings.
Signals:
Buy Signal: Generated when a volume spike occurs, the trend is upward, and the current candle is bullish.
Sell Signal: Generated when a volume spike occurs, the trend is downward, and the current candle is bearish.
Alerts:
Buy Alert: Alerts the user when a buy signal is triggered.
Sell Alert: Alerts the user when a sell signal is triggered.
Visualization:
Buy Signal: A green label appears below the bar when the buy conditions are met.
Sell Signal: A red label appears above the bar when the sell conditions are met.
Volume EMA: A line representing the EMA of the volume is plotted on the chart for reference. The visibility of this line can be toggled in the settings.
This indicator can help traders identify potential entry points based on increased volume activity while considering trend direction and candlestick patterns.
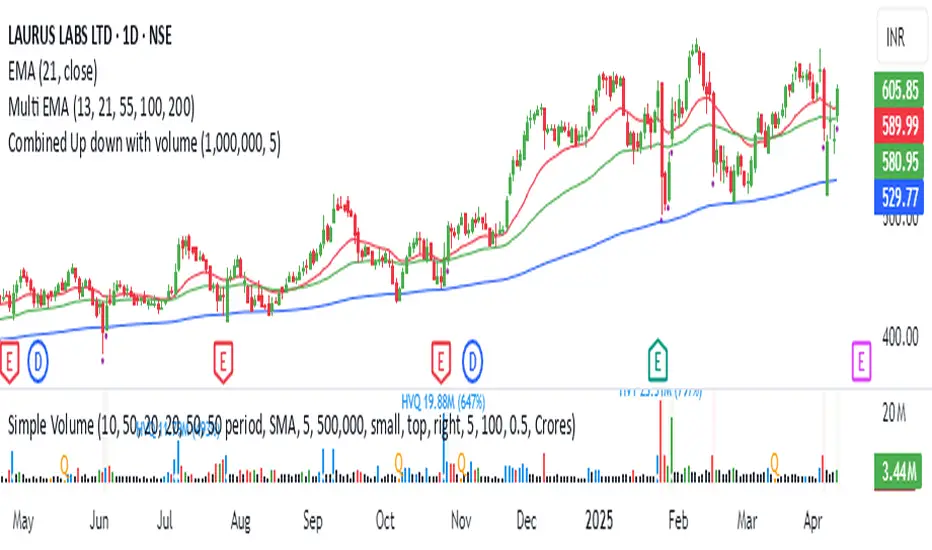
Combined Up down with volumeIndicator Description: "Combined Up/Down with Volume"
This Pine Script indicator combines price momentum and volume spikes to identify potential trend reversals or breakouts. It checks two key conditions:
Price Movement – A minimum percentage change (% check) in closing price.
Volume Spike – Trading volume exceeding a user-defined threshold (Volume above).
How It Works
1. Price Momentum Check
Calculates the 1-period Rate of Change (ROC) of the closing price.
Triggers when the absolute ROC ≥ % check (e.g., 5%).
2. Volume Spike Check
Compares current volume against a threshold (e.g., 1,000,000).
Triggers when volume exceeds this level.
3. Signal Plotting
If use = true:
Plots a purple circle below the bar when both conditions are met.
If use = false:
Plots a circle below the bar for price momentum alone.
Plots a circle (default position) for high volume alone.
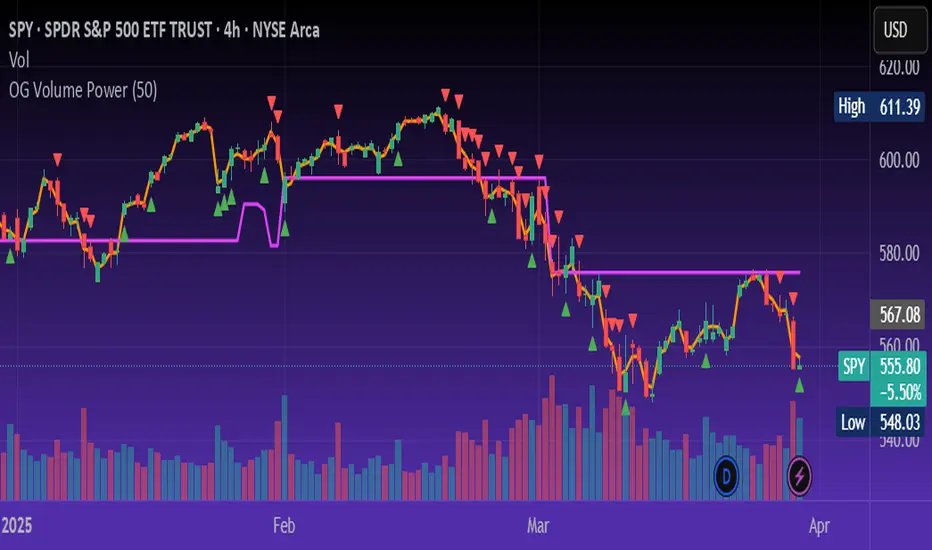
OG Volume PowerDescription:
The OG Volume Power is an elite-level volume analysis suite built for identifying momentum surges, trend continuation, and buyer/seller imbalances at critical price levels. It combines real-time VWAP tracking, a dynamic Point of Control (POC), and volume delta clusters to give traders a complete picture of price and volume interaction.
🔍 Key Features:
Real-Time VWAP:
Tracks volume-weighted average price to identify mean reversion and intraday fair value zones. Ideal for institutional-level entries and exits.
Dynamic POC (Point of Control):
Automatically finds the price level with the highest volume over the last N candles (default 50), helping traders pinpoint where market participants are most committed.
Buyer/Seller Volume Delta Clusters:
Highlights imbalances between buying and selling pressure using bullish and bearish volume deltas that exceed the 20-bar volume average — excellent for momentum detection and early trend recognition.
⚙️ How It Works:
Green triangle: Buyer surge (bullish delta + above average volume)
Red triangle: Seller surge (bearish delta + above average volume)
Magenta line: Dynamic POC (highest volume price over recent candles)
Orange line: VWAP (acts as a magnetic force for price)
📈 Best For:
Intraday scalping or swing trading on SPY, QQQ, BTC, or Forex
Volume flow confirmation before breakout entries
Filtering false breakouts with delta strength signals
🧠 Pro Tip:
Use OG Volume Power alongside your trend indicators (like OG EMA Stack or OG Supertrend) to confirm that volume is backing the move. Look for surges near VWAP or POC zones for sniper-level entries.
Moving Volume DensityMoving Volume Density (MVD) is a custom TradingView indicator written in Pine Script™ (version 6) that blends volume analysis with price range data to offer a unique perspective on market dynamics. By measuring the total volume over a specified period and relating it to the price range during the same interval, this indicator provides valuable insights into the concentration of trading activity relative to price movement.
Key Features:
User-Defined Period: The indicator uses an input period (default 20 bars) to calculate both the total volume and the price range. This flexibility allows you to tailor the analysis to your preferred timeframe.
Volume Calculation: It computes the sum of the volume over the defined period, capturing the cumulative trading activity.
Price Range Determination: The indicator identifies the highest high and the lowest low within the period, calculating the price range (difference between the two). This range serves as the denominator in the density calculation.
Volume Density Computation: Volume Density is derived by dividing the total volume by the price range. This metric reveals how concentrated the volume is within the observed price movement. To prevent division errors, the calculation returns 'NA' when the price range is zero.
Visual Representation: The resulting Volume Density is plotted as a line on a separate sub-window, making it easy to compare with other indicators or overlay your analysis.
「Moving Volume Density (MVD) インジケーター」は、Pine Script™(バージョン6)で作成されたカスタムインジケーターです。出来高の分析と、指定期間内の高値・安値による価格レンジの情報を組み合わせることで、市場のダイナミクスに対する独自の視点を提供します。指定された期間内の合計出来高とその期間内の価格レンジの比率から、価格変動に対する出来高の集中度を示す指標となります。
主な特徴:
ユーザー定義の期間: インジケーターは、入力された期間(デフォルトは20本のバー)を基に、合計出来高と価格レンジ(最高値と最安値の差)の両方を計算します。これにより、ご自身の分析に合わせた柔軟な設定が可能です。
出来高の計算: 指定期間内の全出来高を合計することで、累積的な取引活動を把握します。
価格レンジの算出: 期間内の最高値と最安値を取得し、その差を価格レンジとして算出。このレンジは、出来高密度の計算における分母として使用されます。
出来高密度の計算: 合計出来高を価格レンジで割ることで、出来高がどれだけ価格変動内に集中しているかを示す「出来高密度」を求めます。なお、価格レンジがゼロの場合はゼロ除算を避けるため「NA」を返す設計となっています。
視覚的な表現: 計算結果はサブウィンドウにラインとしてプロットされ、他のインジケーターとの併用や比較が容易に行えます。

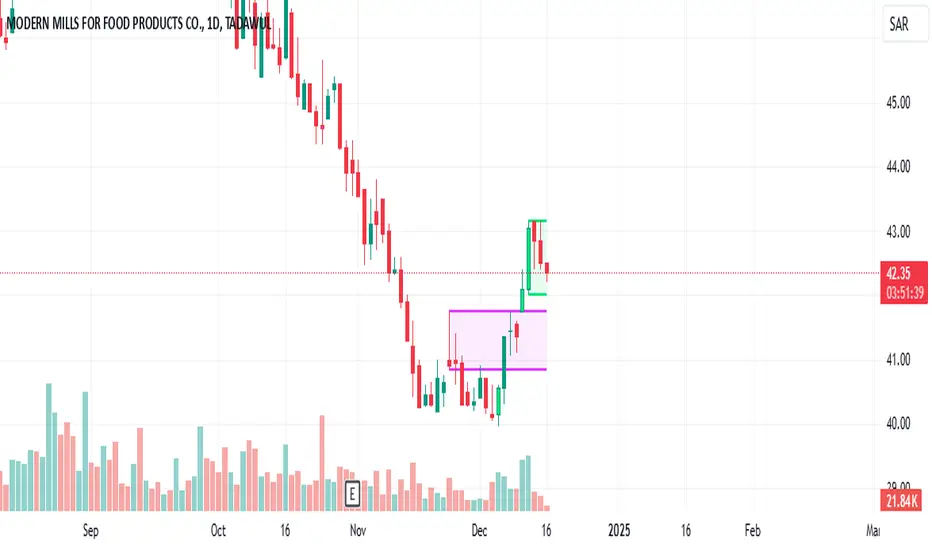
High Volume BarsThis indicator highlights the highest volume bullish and bearish bars within a specified lookback period. It provides a visual representation of significant volume activity, which can be useful for identifying potential trend reversals or continuations.
Key Features:
Customizable lookback period to find highest volume bars
Lime-colored bars for bullish (up) volume
Fuchsia-colored bars for bearish (down) volume
Filled areas between high and low of highest volume bars
Easy-to-read visual cues for volume analysis
The indicator scans the specified number of previous bars to identify the highest volume bullish and bearish bars. It then colors these bars and draws filled areas to make them stand out on the chart. This can help traders quickly spot areas of significant buying or selling pressure.
Use this indicator to:
Identify potential support and resistance levels
Spot volume-based trend reversals
Confirm breakouts or breakdowns
Enhance your volume analysis in conjunction with price action
Adjust the lookback period to fine-tune the indicator's sensitivity to recent volume activity. A longer lookback period will identify more significant volume events, while a shorter period will be more responsive to recent changes.
Note: This indicator is best used in combination with other technical analysis tools and should not be relied upon solely for making trading decisions.
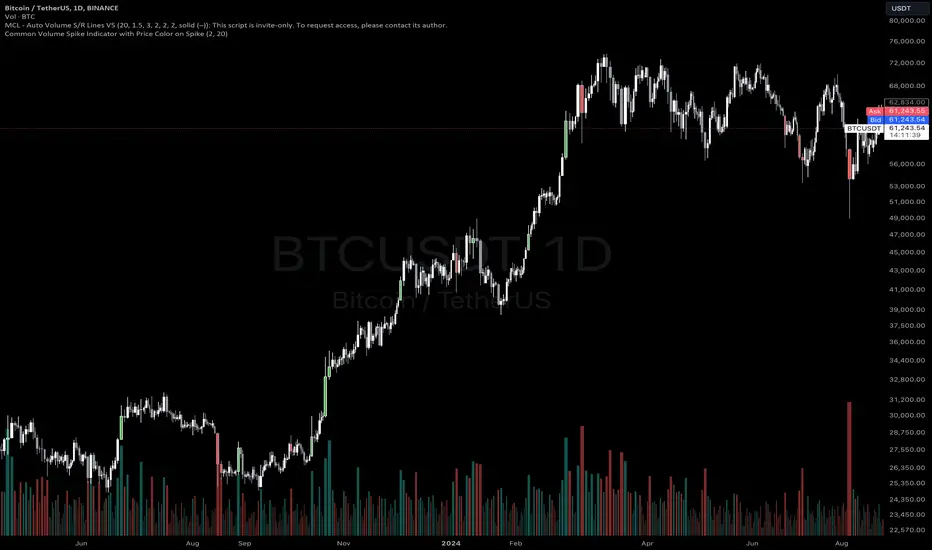
Common Volume Spike Indicator with Price Color on SpikeIndicator Name: Common Volume Spike Indicator with Price Color on Spike
Description:
The “Common Volume Spike Indicator with Price Color on Spike” is designed to detect significant volume spikes and highlight them on the chart. It not only identifies moments when the trading volume exceeds a certain threshold but also colors the price bars based on price movement during these spikes.
Key Features:
• Volume Spike Detection: Detects volume spikes when the current volume exceeds a specified multiple of the average volume over a user-defined lookback period.
• Dynamic Volume Break: Highlights bars where the volume exceeds a threshold, dynamically calculated as a multiple of the average volume (default is 10x the average volume).
• Price Color on Volume Spike: When a volume spike occurs, bars are colored green if the price closes higher than the previous bar, and red if the price closes lower. This feature helps traders easily identify significant price movements during high-volume periods.
• Customizable Parameters:
• Threshold Multiplier: Adjust the sensitivity of volume spike detection.
• Lookback Period: Define the period over which the average volume is calculated.
• Volume Break Multiplier: Set a multiplier for the average volume to identify extreme volume breaks.
This indicator is suitable for traders who want to quickly spot critical market events driven by significant increases in volume. It helps to visualize both the volume activity and the corresponding price movement, providing an additional layer of market insight.
How to Use:
1. Green Bars: When the volume spike condition is met and the price closes higher than the previous bar, the bar is colored green.
2. Red Bars: When the volume spike condition is met and the price closes lower than the previous bar, the bar is colored red.
3. Blue Bars: Indicates a significant volume break, where the current volume exceeds a specified multiple of the average volume (default: 10x).
Ideal for intraday and swing traders who rely on volume and price action for market entries and exits. This indicator works well across different asset classes, including stocks, forex, and cryptocurrencies.
You can adjust the input parameters to fit your specific trading strategy and timeframe.
Disclaimer: This indicator is a tool to help with market analysis and should not be considered financial advice. Always perform your own due diligence before making any trading decisions.
This description outlines the key functionality and how the indicator can benefit traders on TradingView.
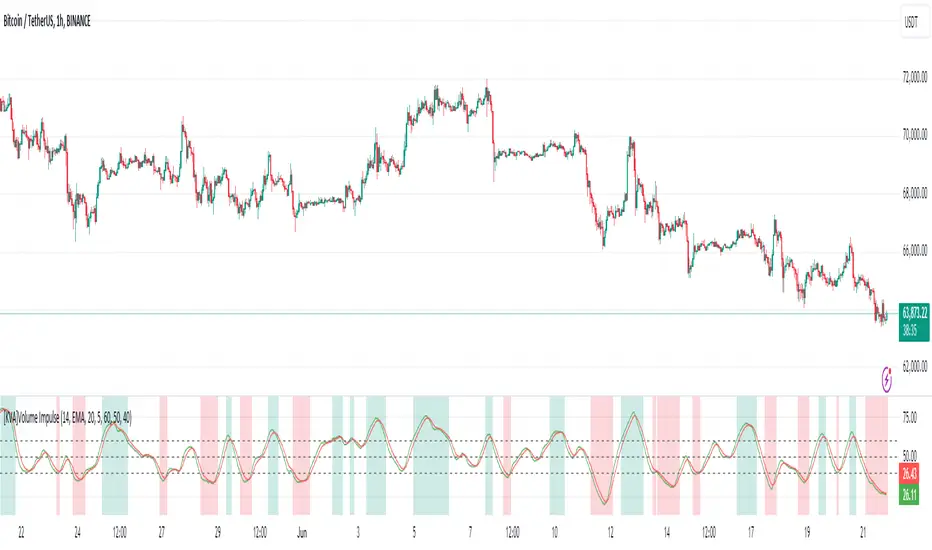
[KVA]Volume ImpulseThe Volume Impulse indicator is designed to provide insights into market momentum by analyzing volume dynamics. It helps traders identify periods of strong buying and selling pressure, which can be crucial for making informed trading decisions.
What does the indicator do?
The Volume Impulse indicator calculates positive and negative volume percentages based on the price range within each bar. It allows traders to visualize the distribution of volume and detect potential shifts in market sentiment.
How does it work?
The indicator uses a customizable lookback period to analyze volume data, smoothing the results with user-defined moving averages. By comparing the positive and negative volume percentages, the indicator highlights overbought and oversold conditions, aiding in trend detection and potential reversal points.
How to use it?
Identify Momentum: Use the positive and negative volume percentages to gauge market momentum within the specified lookback period.
Detect Overbought/Oversold Conditions: Look for the indicator crossing above the overbought level or below the oversold level to identify potential reversal points.
Smooth Trends: Adjust the moving average type and lengths to smooth out the volume data and identify trends more clearly.
Key Features
Volume Analysis: Calculates the positive and negative volume based on the price range within each bar.
Lookback Period: Allows you to define a lookback period over which the indicator calculations are performed, providing flexibility in analyzing different timeframes.
Customizable Moving Averages: Choose from various types of moving averages (EMA, SMA, WMA, Hull) to smooth the volume data.
Overbought/Oversold Levels: Visual markers for overbought, middle, and oversold conditions to help identify potential reversal points.
Color-Coded Areas: Highlights overbought and oversold regions with customizable colors for easy visual interpretation.
Plotting Options: Displays the positive volume and its smoothed version using the selected moving average type and length.
Inputs:
Lookback Period: Define the period over which the volume analysis is performed.
Moving Average Type: Select the type of moving average (EMA, SMA, WMA, Hull) to be applied.
Moving Average Length: Set the length for the primary moving average.
Smooth Length: Define the length for the smoothed moving average.
Overbought Level: Set the threshold for overbought conditions.
Middle Level: Set the threshold for middle conditions.
Oversold Level: Set the threshold for oversold conditions.
Color Settings: Customize the colors for overbought and oversold areas and their respective fill colors.
Significant VolumeSignificant Volume Indicator for Scalpers
This indicator, designed for scalpers, identifies candles with significant volume pressure, aiding in pinpointing optimal entry points for short or long positions. Unlike traditional trend analysis tools, this indicator focuses specifically on volume dynamics to assist traders in identifying ideal trade setups for quick, short-term trades.
**Key Features:**
1. **Volume Analysis:** Utilizes volume data to highlight candles with significant buying or selling pressure.
2. **Moving Average:** Calculates a simple moving average of volume to provide a reference for determining the significance of current volume levels.
3. **Volume Pressure:** Evaluates volume pressure based on the difference between buy and sell pressures over a specified lookback period.
4. **Customizable Parameters:** Allows users to adjust parameters such as SMA period and lookback period to fine-tune the indicator to their trading preferences and strategies.
**Ideal Usage:**
- **Scalping Strategy:** Tailored for traders employing scalping strategies who seek to capitalize on short-term price movements.
- **Entry Point Identification:** Helps traders identify candles with notable volume activity, indicating potential entry points for short or long positions.
- **Volume Confirmation:** Provides additional confirmation for trade setups by highlighting candles with significant volume pressure.
**Disclaimer:** This indicator is designed specifically for scalping purposes and may not be suitable for other trading styles or purposes.

Pressure Volume by MolnarThe Pressure Volume script is a technical indicator that is used to identify buying and selling pressure in a market based on changes in volume. The indicator calculates the average volume over a specified lookback period and then calculates the percentage change in volume for each bar. If the percentage change in volume exceeds a user-defined threshold, then the indicator signals the presence of buying or selling pressure.
To use the script, you simply need to add it to a chart in TradingView. The script allows you to adjust two input parameters: the lookback period and the threshold percentage. The lookback period is the number of bars to use when calculating the average volume, and the threshold percentage is the amount by which the current bar's volume must exceed the average volume in order to trigger a buying or selling pressure signal.
When the script detects buying pressure, it displays a green triangle above the bar, and when it detects selling pressure, it displays a red triangle below the bar. You can adjust the size of the triangles using the "size" input parameter.
It's important to note that the Pressure Volume script is just one tool among many that traders use to analyze the market. It should be used in conjunction with other indicators and analysis techniques to make informed trading decisions.
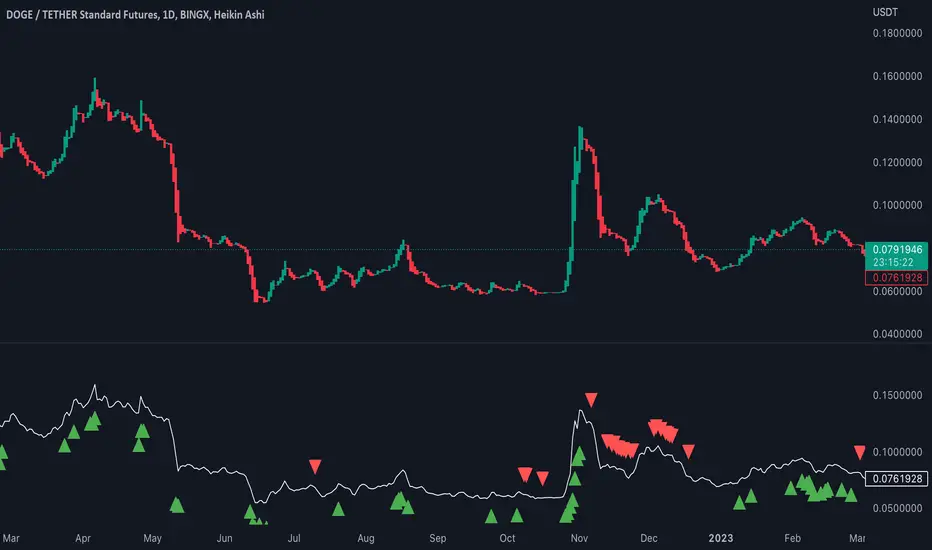
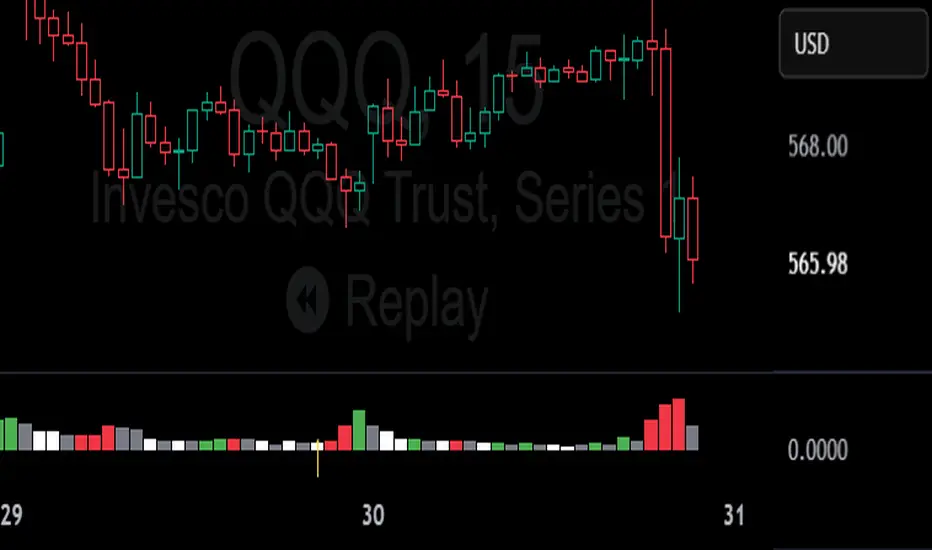
Modified TradingView's Up/Down Volume [vnhilton]
When plotting columns, histograms, etc. You'll notice that the indicator does not stick to the bottom of the pane. To fix this, you need another indicator (we'll call this 'placeholder') in the same pane as this indicator. Pin the placeholder indicator to the left scale, & pin the main indicator to the left scale. Then, pin the placeholder indicator to scale A, & finally the main indictor to the right scale.
Note: On the daily timeframes & higher, the up/down volume isn't accurate. Therefore, I've added a feature where you can toggle on the main indicator to disappear & only show ordinary total volume similar to the TradingView volume indicator.
The original code belongs to TradingView. This is a modified indicator that displays the down volume above the up volume similar to the volume profile. Also includes a moving average using the total volume, & a feature to display ordinary volume to solve the up/down inaccuracies on the daily timeframe & higher.
