Cumulative Volume Delta Divergence Periodic EMACumulative Volume Delta Divergence Periodic EMA
extended indicator
Search in scripts for "Volume"
Volume Delta Volume Signals by Claudio [hapharmonic]// This Pine Script™ code is subject to the terms of the Mozilla Public License 2.0 at mozilla.org
// © hapharmonic
//@version=6
FV = format.volume
FP = format.percent
indicator('Volume Delta Volume Signals by Claudio ', format = FV, max_bars_back = 4999, max_labels_count = 500)
//------------------------------------------
// Settings |
//------------------------------------------
bool usecandle = input.bool(true, title = 'Volume on Candles',display=display.none)
color C_Up = input.color(#12cef8, title = 'Volume Buy', inline = ' ', group = 'Style')
color C_Down = input.color(#fe3f00, title = 'Volume Sell', inline = ' ', group = 'Style')
// ✅ Nueva entrada para colores de señales
color buySignalColor = input.color(color.new(color.green, 0), "Buy Signal Color", group = "Signals")
color sellSignalColor = input.color(color.new(color.red, 0), "Sell Signal Color", group = "Signals")
string P_ = input.string(position.top_right,"Position",options = ,
group = "Style",display=display.none)
string sL = input.string(size.small , 'Size Label', options = , group = 'Style',display=display.none)
string sT = input.string(size.normal, 'Size Table', options = , group = 'Style',display=display.none)
bool Label = input.bool(false, inline = 'l')
History = input.bool(true, inline = 'l')
// Inputs for EMA lengths and volume confirmation
bool MAV = input.bool(true, title = 'EMA', group = 'EMA')
string volumeOption = input.string('Use Volume Confirmation', title = 'Volume Option', options = , group = 'EMA',display=display.none)
bool useVolumeConfirmation = volumeOption == 'none' ? false : true
int emaFastLength = input(12, title = 'Fast EMA Length', group = 'EMA',display=display.none)
int emaSlowLength = input(26, title = 'Slow EMA Length', group = 'EMA',display=display.none)
int volumeConfirmationLength = input(6, title = 'Volume Confirmation Length', group = 'EMA',display=display.none)
string alert_freq = input.string(alert.freq_once_per_bar_close, title="Alert Frequency",
options= ,group = "EMA",
tooltip="If you choose once_per_bar, you will receive immediate notifications (but this may cause interference or indicator repainting).
\n However, if you choose once_per_bar_close, it will wait for the candle to confirm the signal before notifying.",display=display.none)
//------------------------------------------
// UDT_identifier |
//------------------------------------------
type OHLCV
float O = open
float H = high
float L = low
float C = close
float V = volume
type VolumeData
float buyVol
float sellVol
float pcBuy
float pcSell
bool isBuyGreater
float higherVol
float lowerVol
color higherCol
color lowerCol
//------------------------------------------
// Calculate volumes and percentages |
//------------------------------------------
calcVolumes(OHLCV ohlcv) =>
var VolumeData data = VolumeData.new()
data.buyVol := ohlcv.V * (ohlcv.C - ohlcv.L) / (ohlcv.H - ohlcv.L)
data.sellVol := ohlcv.V - data.buyVol
data.pcBuy := data.buyVol / ohlcv.V * 100
data.pcSell := 100 - data.pcBuy
data.isBuyGreater := data.buyVol > data.sellVol
data.higherVol := data.isBuyGreater ? data.buyVol : data.sellVol
data.lowerVol := data.isBuyGreater ? data.sellVol : data.buyVol
data.higherCol := data.isBuyGreater ? C_Up : C_Down
data.lowerCol := data.isBuyGreater ? C_Down : C_Up
data
//------------------------------------------
// Get volume data |
//------------------------------------------
ohlcv = OHLCV.new()
volData = calcVolumes(ohlcv)
// Plot volumes and create labels
plot(ohlcv.V, color=color.new(volData.higherCol, 90), style=plot.style_columns, title='Total',display = display.all - display.status_line)
plot(ohlcv.V, color=volData.higherCol, style=plot.style_stepline_diamond, title='Total2', linewidth = 2,display = display.pane)
plot(volData.higherVol, color=volData.higherCol, style=plot.style_columns, title='Higher Volume', display = display.all - display.status_line)
plot(volData.lowerVol , color=volData.lowerCol , style=plot.style_columns, title='Lower Volume',display = display.all - display.status_line)
S(D,F)=>str.tostring(D,F)
volStr = S(math.sign(ta.change(ohlcv.C)) * ohlcv.V, FV)
buyVolStr = S(volData.buyVol , FV )
sellVolStr = S(volData.sellVol , FV )
// ✅ MODIFICACIÓN: Porcentaje sin decimales
buyPercentStr = str.tostring(math.round(volData.pcBuy)) + " %"
sellPercentStr = str.tostring(math.round(volData.pcSell)) + " %"
totalbuyPercentC_ = volData.buyVol / (volData.buyVol + volData.sellVol) * 100
sup = not na(ohlcv.V)
if sup
TC = text.align_center
CW = color.white
var table tb = table.new(P_, 6, 6, bgcolor = na, frame_width = 2, frame_color = chart.fg_color, border_width = 1, border_color = CW)
tb.cell(0, 0, text = 'Volume Candles', text_color = #FFBF00, bgcolor = #0E2841, text_halign = TC, text_valign = TC, text_size = sT)
tb.merge_cells(0, 0, 5, 0)
tb.cell(0, 1, text = 'Current Volume', text_color = CW, bgcolor = #0B3040, text_halign = TC, text_valign = TC, text_size = sT)
tb.merge_cells(0, 1, 1, 1)
tb.cell(0, 2, text = 'Buy', text_color = #000000, bgcolor = #92D050, text_halign = TC, text_valign = TC, text_size = sT)
tb.cell(1, 2, text = 'Sell', text_color = #000000, bgcolor = #FF0000, text_halign = TC, text_valign = TC, text_size = sT)
tb.cell(0, 3, text = buyVolStr, text_color = CW, bgcolor = #074F69, text_halign = TC, text_valign = TC, text_size = sT)
tb.cell(1, 3, text = sellVolStr, text_color = CW, bgcolor = #074F69, text_halign = TC, text_valign = TC, text_size = sT)
tb.cell(0, 5, text = 'Net: ' + volStr, text_color = CW, bgcolor = #074F69, text_halign = TC, text_valign = TC, text_size = sT)
tb.merge_cells(0, 5, 1, 5)
tb.cell(0, 4, text = buyPercentStr, text_color = CW, bgcolor = #074F69, text_halign = TC, text_valign = TC, text_size = sT)
tb.cell(1, 4, text = sellPercentStr, text_color = CW, bgcolor = #074F69, text_halign = TC, text_valign = TC, text_size = sT)
cellCount = 20
filledCells = 0
for r = 5 to 1 by 1
for c = 2 to 5 by 1
if filledCells < cellCount * (totalbuyPercentC_ / 100)
tb.cell(c, r, text = '', bgcolor = C_Up)
else
tb.cell(c, r, text = '', bgcolor = C_Down)
filledCells := filledCells + 1
filledCells
if Label
sp = ' '
l = label.new(bar_index, ohlcv.V,
text=str.format('Net: {0}\nBuy: {1} ({2})\nSell: {3} ({4})\n{5}/\\\n {5}l\n {5}l',
volStr, buyVolStr, buyPercentStr, sellVolStr, sellPercentStr, sp),
style=label.style_none, textcolor=volData.higherCol, size=sL, textalign=text.align_left)
if not History
(l ).delete()
//------------------------------------------
// Draw volume levels on the candlesticks |
//------------------------------------------
float base = na,float value = na
bool uc = usecandle and sup
if volData.isBuyGreater
base := math.min(ohlcv.O, ohlcv.C)
value := base + math.abs(ohlcv.O - ohlcv.C) * (volData.pcBuy / 100)
else
base := math.max(ohlcv.O, ohlcv.C)
value := base - math.abs(ohlcv.O - ohlcv.C) * (volData.pcSell / 100)
barcolor(sup ? color.new(na, na) : ohlcv.C < ohlcv.O ? color.red : color.green,display = usecandle? display.all:display.none)
UseC = uc ? volData.higherCol:color.new(na, na)
plotcandle(uc?base:na, uc?base:na, uc?value:na, uc?value:na,
title='Body', color=UseC, bordercolor=na, wickcolor=UseC,
display = usecandle ? display.all - display.status_line : display.none, force_overlay=true,editable=false)
plotcandle(uc?ohlcv.O:na, uc?ohlcv.H:na, uc?ohlcv.L:na, uc?ohlcv.C:na,
title='Fill', color=color.new(UseC,80), bordercolor=UseC, wickcolor=UseC,
display = usecandle ? display.all - display.status_line : display.none, force_overlay=true,editable=false)
//------------------------------------------------------------
// Plot the EMA and filter out the noise with volume control. |
//------------------------------------------------------------
float emaFast = ta.ema(ohlcv.C, emaFastLength)
float emaSlow = ta.ema(ohlcv.C, emaSlowLength)
bool signal = emaFast > emaSlow
color c_signal = signal ? C_Up : C_Down
float volumeMA = ta.sma(ohlcv.V, volumeConfirmationLength)
bool crossover = ta.crossover(emaFast, emaSlow)
bool crossunder = ta.crossunder(emaFast, emaSlow)
isVolumeConfirmed(source, length, ma) =>
math.sum(source > ma ? source : 0, length) >= math.sum(source < ma ? source : 0, length)
bool ISV = isVolumeConfirmed(ohlcv.V, volumeConfirmationLength, volumeMA)
bool crossoverConfirmed = crossover and (not useVolumeConfirmation or ISV)
bool crossunderConfirmed = crossunder and (not useVolumeConfirmation or ISV)
PF = MAV ? emaFast : na
PS = MAV ? emaSlow : na
p1 = plot(PF, color = c_signal, editable = false, force_overlay = true, display = display.pane)
plot(PF, color = color.new(c_signal, 80), linewidth = 10, editable = false, force_overlay = true, display = display.pane)
plot(PF, color = color.new(c_signal, 90), linewidth = 20, editable = false, force_overlay = true, display = display.pane)
plot(PF, color = color.new(c_signal, 95), linewidth = 30, editable = false, force_overlay = true, display = display.pane)
plot(PF, color = color.new(c_signal, 98), linewidth = 45, editable = false, force_overlay = true, display = display.pane)
p2 = plot(PS, color = c_signal, editable = false, force_overlay = true, display = display.pane)
plot(PS, color = color.new(c_signal, 80), linewidth = 10, editable = false, force_overlay = true, display = display.pane)
plot(PS, color = color.new(c_signal, 90), linewidth = 20, editable = false, force_overlay = true, display = display.pane)
plot(PS, color = color.new(c_signal, 95), linewidth = 30, editable = false, force_overlay = true, display = display.pane)
plot(PS, color = color.new(c_signal, 98), linewidth = 45, editable = false, force_overlay = true, display = display.pane)
fill(p1, p2, top_value=crossover ? emaFast : emaSlow,
bottom_value =crossover ? emaSlow : emaFast,
top_color =color.new(c_signal, 80),
bottom_color =color.new(c_signal, 95)
)
// ✅ Usar colores configurables para señales
plotshape(crossoverConfirmed and MAV, style=shape.triangleup , location=location.belowbar, color=buySignalColor , size=size.small, force_overlay=true,display =display.pane)
plotshape(crossunderConfirmed and MAV, style=shape.triangledown, location=location.abovebar, color=sellSignalColor, size=size.small, force_overlay=true,display =display.pane)
string msg = '---------\n'+"Buy volume ="+buyVolStr+"\nBuy Percent = "+buyPercentStr+"\nSell volume = "+sellVolStr+"\nSell Percent = "+sellPercentStr+"\nNet = "+volStr+'\n---------'
if crossoverConfirmed
alert("Price (" + str.tostring(close) + ") Crossed over MA\n" + msg, alert_freq)
if crossunderConfirmed
alert("Price (" + str.tostring(close) + ") Crossed under MA\n" + msg, alert_freq)

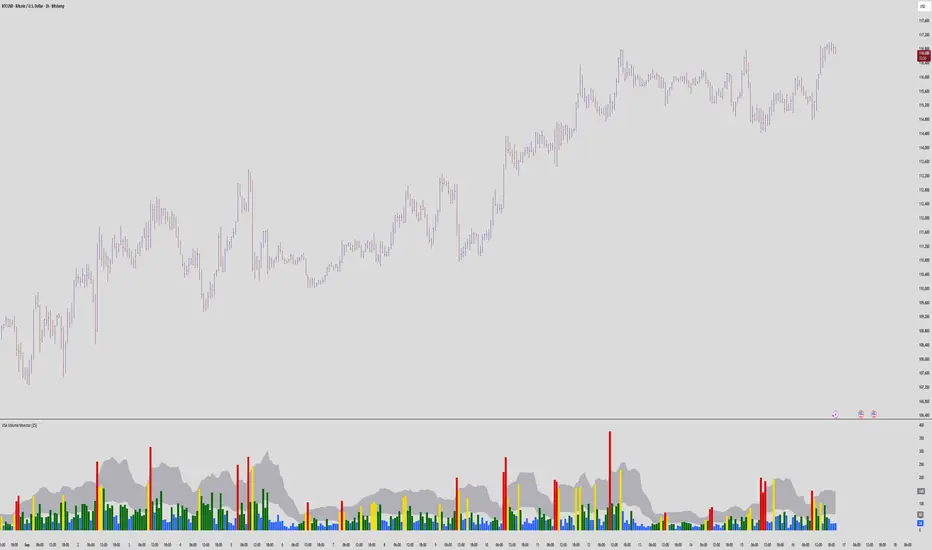
VSA Volume MonitorDescription
This script provides a clear and adaptable visual representation of volume activity, helping traders understand how current participation compares to recent norms.
It calculates a moving average of volume over a user-defined smoothing window and uses that baseline to classify each bar’s volume into several intensity levels.
Bars are color-coded to reflect these levels:
• Blue for below-average activity
• Green for moderate activity
• Yellow for above-average surges
• Red for exceptionally high or climactic volume
In addition to color-coded bars, the script plots two reference bands that represent the typical (baseline) and elevated (climactic) volume zones.
These bands form a shaded cloud that helps visually separate normal market participation from periods of unusual crowd activity or volatility.
The purpose of this indicator is purely visual and informational — it does not generate buy or sell signals, and it does not predict future price movement.
Instead, it gives traders an at-a-glance view of how market interest is shifting, so they can combine that context with their own analysis or strategy.
This tool is lightweight, easy to read, and designed for use alongside other forms of technical analysis, making it suitable for traders who want to build their own framework for understanding volume behavior.
Prev Day Volume ProfileWhat the script does
Calculates yesterday’s Volume Profile from the bars on your chart (not tick data) and derives:
POC (Point of Control)
VAL (Value Area Low)
VAH (Value Area High)
Draws three horizontal lines for today:
POC in orange
VAL and VAH in purple
Adds labels on the right edge that show the level name and the exact price (e.g., POC 1.2345).
Why it’s bar-based (not tick-based)
Pine Script can’t fetch external tick/aggTrades data. The script approximates a volume profile by distributing each bar’s volume across the price bins that the bar’s high–low range covers. For “yesterday”, this produces a stable, TV-native approximation that’s usually sufficient for intraday trading.
Key inputs
Value Area %: Defaults to 0.70 (70%)—the typical value area range.
TZ Offset vs Exchange (hours): Shifts the day boundary to match your desired session (e.g., Europe/Berlin: +1 winter / +2 summer). This ensures “yesterday” means 00:00–24:00 in your target timezone.
Row Size: Manual? / Manual Row Size: If enabled, you can set the price bin size yourself. Otherwise, the script chooses a TV-like step from syminfo.mintick.
Colors & Line width: POC orange; VAL/VAH purple; configurable width.

High Volume Candles - RVolInspired by Key bars from Option Stalker Pro.
This one is meant to be used on charts where the interval is >=1D.
Highlights candles where RVol is > 1.2.
Helps to not accidentally miss that a candle move happened on high volume (or that it did not happen on high volume...), like potential reversals or resistance/support breaks.
Make sure to move this indicator above the ticker in the Object Tree, so that it is drawn on top of the ticker's candles.
More infos: www.reddit.com

Volume Profile Grid [Alpha Extract]A sophisticated volume distribution analysis system that transforms market activity into institutional-grade visual profiles, revealing hidden support/resistance zones and market participant behavior. Utilizing advanced price level segmentation, bullish/bearish volume separation, and dynamic range analysis, the Volume Profile Grid delivers comprehensive market structure insights with Point of Control (POC) identification, Value Area boundaries, and volume delta analysis. The system features intelligent visualization modes, real-time sentiment analysis, and flexible range selection to provide traders with clear, actionable volume-based market context.
🔶 Dynamic Range Analysis Engine
Implements dual-mode range selection with visible chart analysis and fixed period lookback, automatically adjusting to current market view or analyzing specified historical periods. The system intelligently calculates optimal bar counts while maintaining performance through configurable maximum limits, ensuring responsive profile generation across all timeframes with institutional-grade precision.
// Dynamic period calculation with intelligent caching
get_analysis_period() =>
if i_use_visible_range
chart_start_time = chart.left_visible_bar_time
current_time = last_bar_time
time_span = current_time - chart_start_time
tf_seconds = timeframe.in_seconds()
estimated_bars = time_span / (tf_seconds * 1000)
range_bars = math.floor(estimated_bars)
final_bars = math.min(range_bars, i_max_visible_bars)
math.max(final_bars, 50) // Minimum threshold
else
math.max(i_periods, 50)
🔶 Advanced Bull/Bear Volume Separation
Employs sophisticated candle classification algorithms to separate bullish and bearish volume at each price level, with weighted distribution based on bar intersection ratios. The system analyzes open/close relationships to determine volume direction, applying proportional allocation for doji patterns and ensuring accurate representation of buying versus selling pressure across the entire price spectrum.
🔶 Multi-Mode Volume Visualization
Features three distinct display modes for bull/bear volume representation: Split mode creates mirrored profiles from a central axis, Side by Side mode displays sequential bull/bear segments, and Stacked mode separates volumes vertically. Each mode offers unique insights into market participant behavior with customizable width, thickness, and color parameters for optimal visual clarity.
// Bull/Bear volume calculation with weighted distribution
for bar_offset = 0 to actual_periods - 1
bar_high = high
bar_low = low
bar_volume = volume
// Calculate intersection weight
weight = math.min(bar_high, next_level) - math.max(bar_low, current_level)
weight := weight / (bar_high - bar_low)
weighted_volume = bar_volume * weight
// Classify volume direction
if bar_close > bar_open
level_bull_volume += weighted_volume
else if bar_close < bar_open
level_bear_volume += weighted_volume
else // Doji handling
level_bull_volume += weighted_volume * 0.5
level_bear_volume += weighted_volume * 0.5
🔶 Point of Control & Value Area Detection
Implements institutional-standard POC identification by locating the price level with maximum volume accumulation, providing critical support/resistance zones. The Value Area calculation uses sophisticated sorting algorithms to identify the price range containing 70% of trading volume, revealing the market's accepted value zone where institutional participants concentrate their activity.
🔶 Volume Delta Analysis System
Incorporates real-time volume delta calculation with configurable dominance thresholds to identify significant bull/bear imbalances. The system visually highlights price levels where buying or selling pressure exceeds threshold percentages, providing immediate insight into directional volume flow and potential reversal zones through color-coded delta indicators.
// Value Area calculation using 70% volume accumulation
total_volume_sum = array.sum(total_volumes)
target_volume = total_volume_sum * 0.70
// Sort volumes to find highest activity zones
for i = 0 to array.size(sorted_volumes) - 2
for j = i + 1 to array.size(sorted_volumes) - 1
if array.get(sorted_volumes, j) > array.get(sorted_volumes, i)
// Swap and track indices for value area boundaries
// Accumulate until 70% threshold reached
for i = 0 to array.size(sorted_indices) - 1
accumulated_volume += vol
array.push(va_levels, array.get(volume_levels, idx))
if accumulated_volume >= target_volume
break
❓How It Works
🔶 Weighted Volume Distribution
Implements proportional volume allocation based on the percentage of each bar that intersects with price levels. When a bar spans multiple levels, volume is distributed proportionally based on the intersection ratio, ensuring precise representation of trading activity across the entire price spectrum without double-counting or volume loss.
🔶 Real-Time Profile Generation
Profiles regenerate on each bar close when in visible range mode, automatically adapting to chart zoom and scroll actions. The system maintains optimal performance through intelligent caching mechanisms and selective line updates, ensuring smooth operation even with maximum resolution settings and extended analysis periods.
🔶 Market Sentiment Analysis
Features comprehensive volume analysis table displaying total volume metrics, bullish/bearish percentages, and overall market sentiment classification. The system calculates volume dominance ratios in real-time, providing immediate insight into whether buyers or sellers control the current price structure with percentage-based sentiment thresholds.
🔶 Visual Profile Mapping
Provides multi-layered visual feedback through colored volume bars, POC line highlighting, Value Area boundaries, and optional delta indicators. The system supports profile mirroring for alternative perspectives, line extension for future reference, and customizable label positioning with detailed price information at critical levels.
Why Choose Volume Profile Grid
The Volume Profile Grid represents the evolution of volume analysis tools, combining traditional volume profile concepts with modern visualization techniques and intelligent analysis algorithms. By integrating dynamic range selection, sophisticated bull/bear separation, and multi-mode visualization with POC/Value Area detection, it provides traders with institutional-quality market structure analysis that adapts to any trading style. The comprehensive delta analysis and sentiment monitoring system eliminates guesswork while the flexible visualization options ensure optimal clarity across all market conditions, making it an essential tool for traders seeking to understand true market dynamics through volume-based price discovery.

Piman2077: Previous Day Volume Profile levelsPrevious Day Volume Profile Indicator
Description:
Previous Day Volume Profile Indicator plots the previous trading session’s Volume Profile key levels directly on your chart, providing clear reference points for intraday trading. This indicator calculates the Value Area High (VAH), Value Area Low (VAL), and Point of Control (POC) from the prior session and projects them across the current trading day, helping traders identify potential support, resistance, and high-volume zones.
Features:
Calculates previous day VAH, VAL, and POC based on a user-defined session (default 09:30–16:00).
Uses Volume Profile bins for precise distribution calculation.
Fully customizable line colors for VAH, VAL, and POC.
Lines extend across the current session for easy intraday reference.
Works on any timeframe, optimized for 1-minute charts for precision.
Optional toggles to show/hide VAH, VAL, and POC individually.
Inputs:
Session Time: Define the trading session for which the volume profile is calculated.
Profile Bins: Number of price intervals used to divide the session range.
Value Area %: Percentage of volume to include in the value area (default 68%).
Show POC / VAH & VAL: Toggle visibility of each level.
Line Colors: Customize VAH, VAL, and POC colors.
Use Cases:
Identify previous session support and resistance levels for intraday trading.
Gauge areas of high liquidity and potential market reaction zones.
Combine with other indicators or price action strategies for improved entries and exits.
Recommended Timeframe:
Works on all timeframes; best used on 1-minute or 5-minute charts for precise intraday analysis.

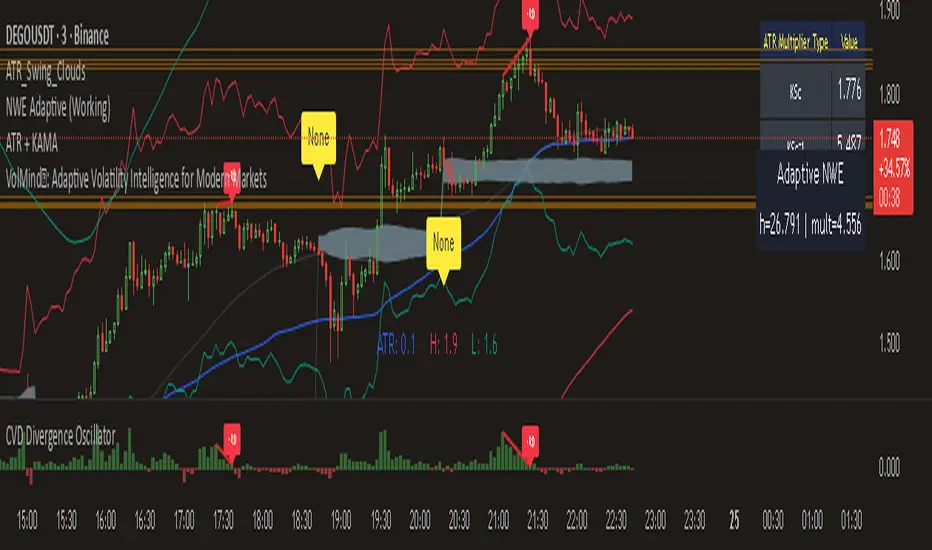
Cumulative Volume Delta with EMA PlotCumulative Delta Volume is a key tool for analyzing the relationship between trading volume and price movement, often referred to as Volume Price Action.
In this indicator, an Exponential Moving Average (EMA) is applied to smooth out short-term noise and reduce volatility, making trends easier to identify. Traders can watch for EMA crossovers as confirmation signals for potential trend reversals, as well as buying or selling opportunities.
VSA-Stopping VolumeVSA Stopping Volume Indicator
Stopping Volume occurs when candles show decreasing body sizes (narrow spreads) while volume steadily increases.
Example chart:
As you see:
3 consecutive candles in same direction (all green OR all red)
Body sizes (spreads) decreasing progressively: Candle 1 > Candle 2 > Candle 3
Volume increasing progressively: Volume 1 < Volume 2 < Volume 3
This pattern indicates price absorption - increased buying/selling pressure but declining price movement, often signaling exhaustion and potential reversal.
Indicator Features
This indicator detects Stopping Volume candlestick clusters with two signal types:
🔹 BUY/SELL Signals: Generated when pattern occurs at support/resistance zones
🔹 Directional Alerts (▲-green, ▼-red): Generated when pattern occurs outside key levels
Trading Guidelines:
⚠️ Auto-drawn S/R zones are reference only - manual level plotting recommended for accuracy
📊 Best for scalping: M5, M10, M15 timeframes
🛡️ Stop Loss: Place beyond the S/R zone you're trading
🎯 Take Profit: Based on your risk management
Key Concept: Volume expansion + price contraction = potential reversal, especially at SnR levels.
Perfect for scalpers looking to catch reversals at critical zones!

ds-Volume with Flags & Alerts v1.2ds-Volume with Flags & Alerts: User & Training Guide
1. Summary of Features
This indicator is a powerful, all-in-one tool designed to give you a deep and customizable view of market volume. By analyzing volume in multiple ways, it helps you spot unusual activity, confirm trends, and identify potential reversals.
How It Helps a Trader:
Spotting Institutional Activity: The core purpose of the Volume Flags (using either the Multiplier or Standard Deviation method) is to highlight bars with exceptionally high volume. These spikes often signal the entry or exit of large institutional players. A high-volume up-bar can confirm bullish conviction, while a high-volume down-bar can signal significant selling pressure.
Identifying Climactic Events: The HVE (Highest Volume Ever) and HV1 (Highest Volume - 1 Year) labels automatically pinpoint the most significant volume events on the chart. A "blow-off top" at the end of a long uptrend or a "capitulation" event at a market bottom is almost always accompanied by an HVE or HV1 bar. These are critical moments to watch for potential trend reversals.
Gauging Buying vs. Selling Pressure: The Up/Down Volume Ratio gives you a more nuanced view than volume alone. A ratio consistently above 1.2 suggests that buyers are more aggressive, while a ratio below 0.8 suggests sellers are in control. Watching this ratio can help you confirm the strength of a trend or spot divergences where price is rising but the ratio is falling (a potential warning sign).
Visual Confirmation & Customization: With options to color both the volume bars and the main price bars, you can get instant visual confirmation of these events without having to look away from the price action. The ability to toggle features on and off keeps your chart clean and focused on what matters most to you.
Actionable Alerts: The comprehensive alert system ensures you don't miss a key event. You can be notified of everything from a new all-time high volume bar to a subtle shift in the Up/Down Volume Ratio, allowing you to react to market changes in real-time.
2. User-Changeable Options
This indicator is highly customizable. Here is a breakdown of every setting available in the "Inputs" tab.
General Settings
MA Length: The lookback period for the simple moving average (the gray area plot) of the volume.
Volume Flags
Color Price Bars with Flags: If checked, the main price bars on your chart will be colored when a high or low volume flag condition is met.
Color Volume Bars with Flags: If checked, the volume bars in the indicator pane will be colored for flag conditions.
Flag Calculation Method: This is a crucial setting.
Multiplier (Default): Identifies high volume based on a simple multiple of the average volume (e.g., volume is 1.4x its average). It's simple and intuitive.
Standard Deviation: Identifies high volume based on how statistically unusual it is compared to its recent behavior. This method is more adaptive to changing market volatility.
Daily/Weekly Lookback (Multiplier): Sets the lookback period for calculating the average volume when using the "Multiplier" method.
Daily/Weekly High-Vol Multiplier: Sets the multiplier for a high volume event (e.g., 1.4).
STDEV Length (Daily/Weekly): Sets the lookback period for calculating the average and standard deviation when using the "Standard Deviation" method.
STDEV Threshold (Daily/Weekly): Sets the number of standard deviations above the average required to trigger a high volume flag (e.g., 2.0).
Daily/Weekly Low-Vol Multiplier: Sets the threshold for a low volume event (e.g., 0.5 means volume is less than 50% of its average). This is always based on the multiplier method.
Ratios & Stats
Up/Down Ratio Daily/Weekly Lookback: Sets the lookback period for calculating the sum of up volume and down volume for the ratio.
Ratio Calculation Method:
Close vs. Open: Defines an "up volume" bar as one where the close is higher than the open.
Close vs. Previous Close (Default): Defines an "up volume" bar as one where the close is higher than the previous bar's close. This is a common standard.
Up Ratio Arrow Threshold: If the U/D Ratio exceeds this value, a green "up" arrow will appear.
Show Up Ratio Arrow: Toggles the visibility of the green "up" arrow.
Down Ratio Arrow Threshold: If the U/D Ratio falls below this value, a red "down" arrow will appear.
Show Down Ratio Arrow: Toggles the visibility of the red "down" arrow.

Volume Point of Control with Fib Based Profile🍀Description:
This indicator is a comprehensive volume profile analysis tool designed to identify key price levels based on trading activity within user-defined timeframes. It plots the Point of Control (POC), Value Area High (VAH), and Value Area Low (VAL), along with dynamically calculated Fibonacci levels derived from the developing period's range. It offers extensive customization for both historical and developing levels.
🍀Core Features:
Volume Profiling (POC, VAH, VAL):
Calculates and plots the POC (price level with the highest volume), VAH, and VAL for a selected timeframe (e.g., Daily, Weekly).
The Value Area percentage is configurable. 70% is common on normal volume profiles, but this script allows you to configure multiple % levels via the fib levels. I recommend using 2 versions of this indicator on a chart, one has Value Area at 1 (100% - high and low of lookback) and the second is a specified VA area (i.e. 70%) like in the chart snapshot above. See examples at the bottom.
Historical Levels:
Plots POC, VAH, and VAL from previous completed periods.
Optionally displays only "Unbroken" levels – historical levels that price has not yet revisited, which can act as stronger magnets or resistance/support.
The user can manage the number of historical lines displayed to prevent chart clutter.
Developing Levels:
Shows the POC, VAH, and VAL as they form in real-time during the current, incomplete period. This provides insight into intraday/intra-period value migration.
Dynamic Fibonacci Levels:
Calculates and plots Fibonacci retracement/extension levels based dynamically on the range between the developing POC and the developing VAH/VAL.
Offers 8 configurable % levels above and below POC that can be toggled on/off.
Visual Customization:
Extensive options for colors, line styles, and widths for all plotted levels.
Optional gradient fill for the Value Area that visualizes current price distance from POC - option to invert the colors as well.
Labels for developing levels and Fibonacci levels for easy identification.
🍀Characteristics:
Volume-Driven: Levels are derived from actual trading volume, reflecting areas of high participation and price agreement/disagreement.
Timeframe Specific: The results are entirely dependent on the chosen profile timeframe.
Dynamic & Static Elements: Developing levels and Fibs update live, while historical levels remain fixed once their period closes.
Lagging (Historical) & Potentially Leading: Historical levels are based on the past, but are often respected by future price action. Developing levels show current dynamics.
🍀How to Use It:
Identifying Support & Resistance: Historical and developing POCs, VAHs, and VALs are often key areas where price may react. Unbroken levels are particularly noteworthy.
Market Context & Sentiment: Trading above the POC suggests bullish strength/acceptance of higher prices, while trading below suggests bearishness/acceptance of lower prices.
Entry/Exit Zones: Interactions with these levels (rejections, breakouts, tests) can provide potential entry or exit signals, especially when confirming with other analysis methods.
Dynamic Targets: The Fibonacci levels calculated from the developing POC-VA range offer potential intraday/intra-period price targets or areas of interest.
Understanding Value Migration: Observing the movement of the developing POC/VAH/VAL throughout the period reveals where value is currently being established.
🍀Potential Drawbacks:
Input Sensitivity: The choice of timeframe, Value Area percentage, and volume resolution heavily influences the generated levels. Experimentation is needed for optimal settings per instrument/market. (I've found that Range Charts can provide very accurate volume levels on TV since the time element is removed. This helps to refine the accuracy of price levels with high volume.)
Volume Data Dependency: Requires accurate volume data. May be less reliable on instruments with sparse or questionable volume reporting.
Chart Clutter: Enabling all features simultaneously can make the chart busy. Utilize the line management inputs and toggle features as needed.
Not a Standalone Strategy: This indicator provides context and key levels. It should be used alongside other technical analysis tools and price action reading for robust decision-making.
Developing Level Fluctuation: Developing POC/VA/Fib levels can shift considerably, especially early in a new period, before settling down as more volume accumulates and time passes.
🍀Recommendations/Examples:
I recommend have this indicator on your chart twice, one has the VA set at 1 (100%) and has the fib levels plotted. The second has the VA set to 0.7 (70%) to highlight the defined VA.
Here is an example with 3 on a chart. VA of 100%, VA of 80%, and VA of 20%

Volume pressure by GSK-VIZAG-AP-INDIA🔍 Volume Pressure by GSK-VIZAG-AP-INDIA
🧠 Overview
“Volume Pressure” is a multi-timeframe, real-time table-based volume analysis tool designed to give traders a clear and immediate view of buying and selling pressure across custom-selected timeframes. By breaking down buy volume, sell volume, total volume, and their percentages, this indicator helps traders identify demand/supply imbalances and volume momentum in the market.
🎯 Purpose / Trading Use Case
This indicator is ideal for intraday and short-term traders who want to:
Spot aggressive buying or selling activity
Track volume dynamics across multiple timeframes *1 min time frame will give best results*
Use volume pressure as a confirming tool alongside price action or trend-based systems
It helps determine when large buying/selling activity is occurring and whether such behavior is consistent across timeframes—a strong signal of institutional interest or volume-driven trend shifts.
🧩 Key Features & Logic
Real-Time Table Display: A clean, dynamic table showing:
Buy Volume
Sell Volume
Total Volume
Buy % of total volume
Sell % of total volume
Multi-Time frame Analysis: Supports 8 user-selectable custom time frames from 1 to 240 minutes, giving flexibility to analyze volume pressure at various granularities.
Color-Coded Volume Bias:
Green for dominant Buy pressure
Red for dominant Sell pressure
Yellow for Neutral
Intensity-based blinking for extreme values (over 70%)
Dynamic Data Calculation:
Uses volume * (close > open) logic to estimate buy vs sell volumes bar-by-bar, then aggregates by timeframe.
⚙️ User Inputs & Settings
Timeframe Selectors (TF1 to TF8): Choose any 8 timeframes you want to monitor volume pressure across.
Text & Color Settings:
Customize text colors for Buy, Sell, Total volumes
Choose Buy/Sell bias colors
Enable/disable blinking for visual emphasis on extremes
Table Appearance:
Set header color, metric background, and text size
Table positioning: top-right, bottom-right, etc.
Blinking Highlight Toggle: Enable this to visually highlight when Buy/Sell % exceeds 70%—a sign of strong pressure.
📊 Visual Elements Explained
The table has 6 rows and 10 columns:
Row 0: Headers for Today and TF1 to TF8
Rows 1–3: Absolute values (Buy Vol, Sell Vol, Total Vol)
Rows 4–5: Relative percentages (Buy %, Sell %), with dynamic background color
First column shows the metric names (e.g., “Buy Vol”)
Cells blink using alternate background colors if volume pressure crosses thresholds
💡 How to Use It Effectively
Use Buy/Sell % rows to confirm potential breakout trades or identify volume exhaustion zones
Look for multi-timeframe confluence: If 5 or more TFs show >70% Buy pressure, buyers are in control
Combine with price action (e.g., breakouts, reversals) to increase conviction
Suitable for equities, indices, futures, crypto, especially on lower timeframes (1m to 15m)
🏆 What Makes It Unique
Table-based MTF Volume Pressure Display: Most indicators only show volume as bars or histograms; this script summarizes and color-codes volume bias across timeframes in a tabular format.
Customization-friendly: Full control over colors, themes, and timeframes
Blinking Alerts: Rare visual feature to capture user attention during extreme pressure
Designed with performance and readability in mind—even for fast-paced scalping environments.
🚨 Alerts / Extras
While this script doesn’t include TradingView alert functions directly, the visual blinking serves as a strong real-time alert mechanism.
Future versions may include built-in alert conditions for buy/sell bias thresholds.
🔬 Technical Concepts Used
Volume Dissection using close > open logic (to estimate buyer vs seller pressure)
Simple aggregation of volume over custom timeframes
Table plotting using Pine Script table.new, table.cell
Dynamic color logic for bias identification
Custom blinking logic using na(bar_index % 2 == 0 ? colorA : colorB)
⚠️ Disclaimer
This indicator is a tool for analysis, not financial advice. Always backtest and validate strategies before using any indicator for live trading. Past performance is not indicative of future results. Use at your own risk and apply proper risk management.
✍️ Author & Signature
Indicator Name: Volume Pressure
Author: GSK-VIZAG-AP-INDIA
TradingView Username: prowelltraders

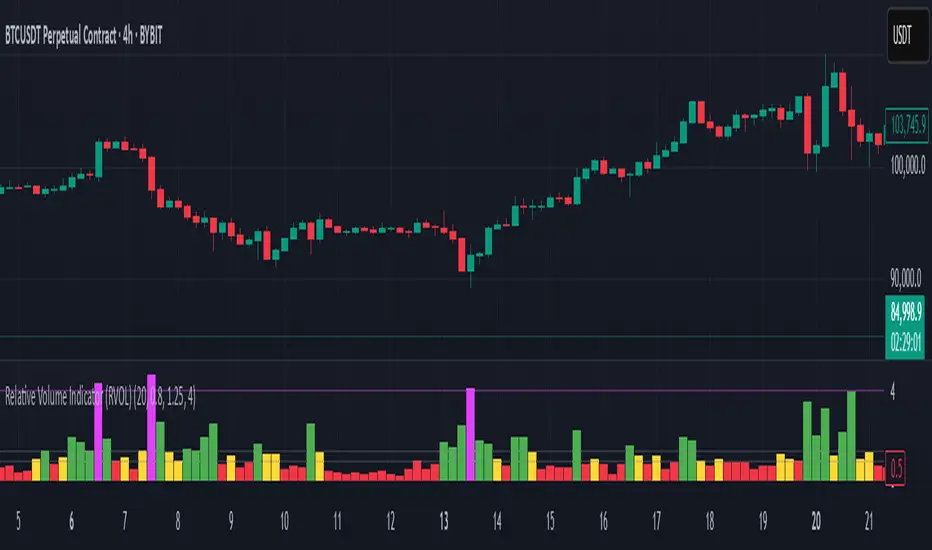
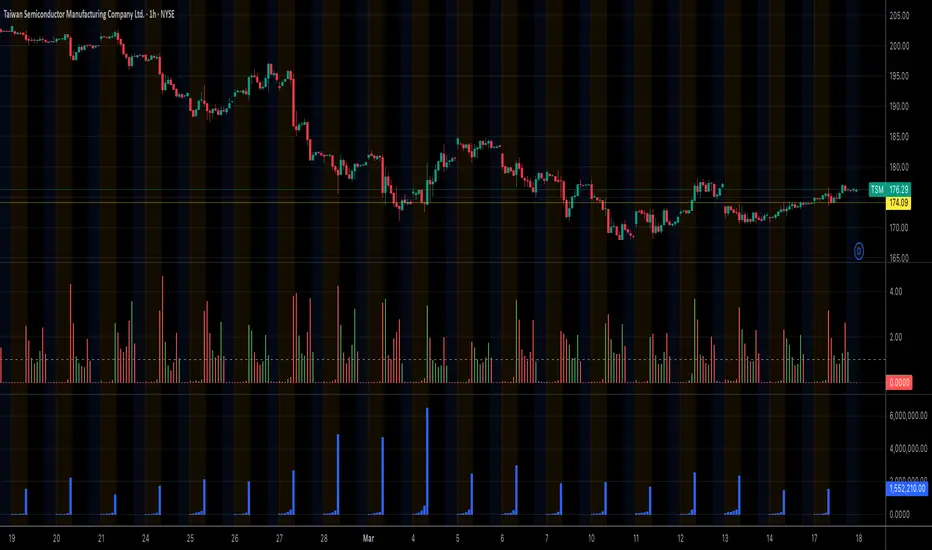
Relative Volume Indicator (RVOL)Relative Volume Indicator (RVOL)
The Relative Volume Indicator (RVOL) helps traders identify unusual volume activity by comparing the current volume to the average historical volume. This makes it easier to spot potential breakouts, reversals, or significant market events that are accompanied by volume confirmation.
What This Indicator Shows
This indicator displays volume as a multiple of average volume, where:
- 1.0x means 100% of average volume
- 2.0x means 200% of average volume (twice the average)
- 0.5x means 50% of average volume (half the average)
Color Coding
The volume bars are color-coded based on configurable thresholds:
- Red: Below average volume (< Average Volume Threshold)
- Yellow: Average volume (between Average Volume and Above Average thresholds)
- Green: Above average volume (between Above Average and Extreme thresholds)
- Magenta: Extreme volume (> Extreme Volume Threshold)
Horizontal Reference Lines
Three dotted horizontal reference lines help you visualize the thresholds:
- Lower gray line: Average Volume Threshold (default: 0.8x)
- Upper gray line: Above Average Threshold (default: 1.25x)
- Magenta line: Extreme Volume Threshold (default: 4.0x)
How To Use This Indicator
1. Volume Confirmation: Use green bars to confirm breakouts or trend changes - stronger moves often come with above-average volume.
2. Low Volume Warning: Red bars during price movements may indicate weak conviction and potential reversals.
3. Extreme Volume Events: Magenta bars (extreme volume) often signal major market events or potential exhaustion points that could lead to reversals.
4. Volume Divergence: Look for divergences between price and volume - for example, if price makes new highs but volume is decreasing (more yellow/red bars), the move may be losing strength.
Settings Configuration
- Average Volume Lookback Period: Number of bars used to calculate the average volume (default: 20)
- Average Volume Threshold: Volume below this level is considered below average (default: 0.8x)
- Above Average Threshold: Volume above this level is considered above average (default: 1.25x)
- Extreme Volume Threshold: Volume above this level is considered extreme (default: 4.0x)
- Colors: Customize colors for each volume category
Important Note: Adjust threshold values only through the indicator settings (not in the Style tab). Changing values in the Style tab will not adjust the coloring of the volume bars.
Adjust these settings based on the specific asset being analyzed and your trading timeframe. More volatile assets may require higher thresholds, while less volatile ones might need lower thresholds.
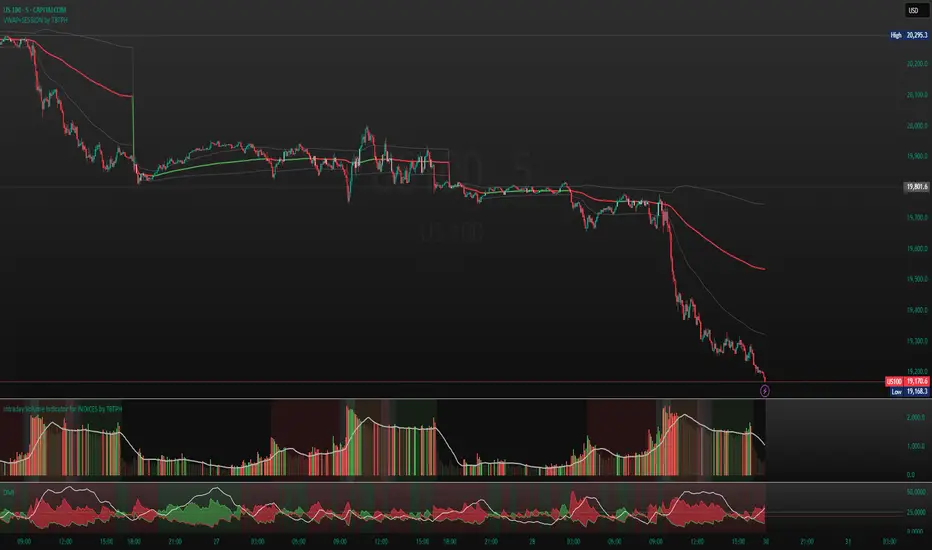
Intraday Volume Indicator for INDICES by TBTPH Pine Script code for an intraday volume indicator with session and lunch break highlights looks great! Here’s a summary of what each part of the script does:
Indicator Settings:
The indicator is set to show on a separate pane (overlay=false).
The SMA Length is adjustable with an input box (default of 20).
Volume and SMA Calculation:
You calculate the Simple Moving Average (SMA) of the volume over the selected length.
The volume color is determined based on whether the close price is higher or lower than the previous close and if the volume is above or below the SMA.
Volume Plot:
Volume is plotted as a histogram with different colors to indicate if the volume is higher or lower than the SMA.
You plot the SMA of the volume with an orange line for easier comparison.
Background Color:
You set a light gray background color to give a subtle contrast.
NYSE and LSE trading sessions are highlighted with green and blue, respectively.
Lunch break periods are highlighted with a white background for both exchanges.
Here are a couple of improvements or suggestions you might consider:
Session Time Overlap Handling:
If the script is applied to a chart where both NYSE and LSE data is visible, they may overlap depending on the time zone of your chart. Ensure the session times align with the active market's timezone, especially if you are using a chart with a different timezone setting.
Color Customization:
The color scheme for bullish/bearish volume could be enhanced further. For example, you could introduce more transparency for low-volume periods to make the histogram appear more subtle during less active trading times.
Handling Different Time Zones:
If your chart is not in the "America/New_York" or "GMT" time zone, be mindful of the session times. The timestamp function depends on the chart’s time zone, so ensuring you're adjusting for different markets is key.
Premarket VolumeTimeframe: Use on intraday charts (e.g., 1-minute, 5-minute) with extended hours enabled.
Behavior: The plot will appear at 4:00 AM, grow as volume accumulates, and disappear at 9:30 AM each day.
Lemon/Lime Volume Lookback IndicatorThe indicator focuses on analyzing volume patterns.
It calculates a relative volume metric by comparing the current volume to a short-term simple moving average of volume.
The code identifies volume spikes when the relative volume exceeds a user-defined threshold.
These volume spikes are visually represented on the chart as small circles:
Yellow circles appear above bars for bearish volume spikes (when price closed lower)
Green circles appear below bars for bullish volume spikes (when price closed higher)
Users can adjust settings such as the lookback period for volume comparison and the percentage increase that defines a volume spike. This would adjust the readings based on incoming volume. Adjust as needed during different market conditions.
This tool essentially helps traders identify and visualize significant increases in trading volume compared to recent average volume, which could potentially signal important price movements or trend changes.

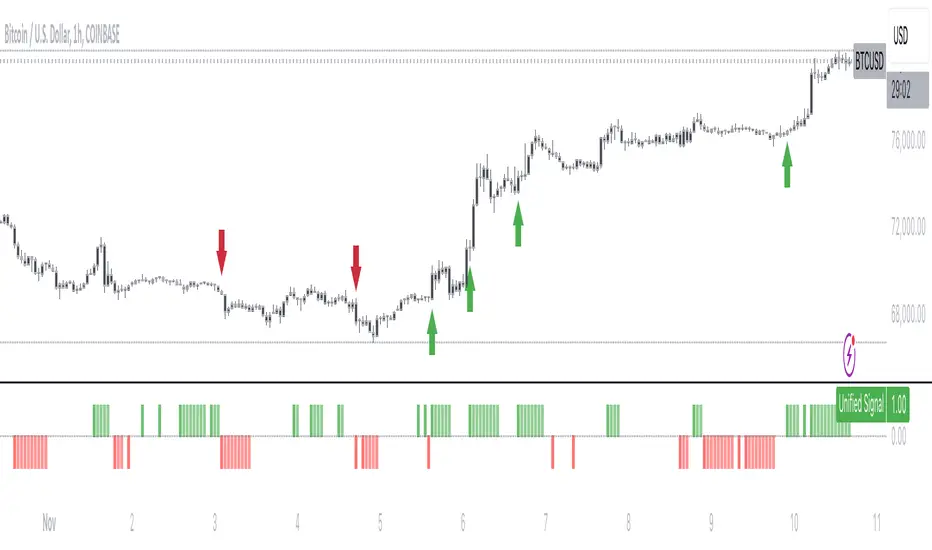
Volume Block Order AnalyzerCore Concept
The Volume Block Order Analyzer is a sophisticated Pine Script strategy designed to detect and analyze institutional money flow through large block trades. It identifies unusually high volume candles and evaluates their directional bias to provide clear visual signals of potential market movements.
How It Works: The Mathematical Model
1. Volume Anomaly Detection
The strategy first identifies "block trades" using a statistical approach:
```
avgVolume = ta.sma(volume, lookbackPeriod)
isHighVolume = volume > avgVolume * volumeThreshold
```
This means a candle must have volume exceeding the recent average by a user-defined multiplier (default 2.0x) to be considered a significant block trade.
2. Directional Impact Calculation
For each block trade identified, its price action determines direction:
- Bullish candle (close > open): Positive impact
- Bearish candle (close < open): Negative impact
The magnitude of impact is proportional to the volume size:
```
volumeWeight = volume / avgVolume // How many times larger than average
blockImpact = (isBullish ? 1.0 : -1.0) * (volumeWeight / 10)
```
This creates a normalized impact score typically ranging from -1.0 to 1.0, scaled by dividing by 10 to prevent excessive values.
3. Cumulative Impact with Time Decay
The key innovation is the cumulative impact calculation with decay:
```
cumulativeImpact := cumulativeImpact * impactDecay + blockImpact
```
This mathematical model has important properties:
- Recent block trades have stronger influence than older ones
- Impact gradually "fades" at rate determined by decay factor (default 0.95)
- Sustained directional pressure accumulates over time
- Opposing pressure gradually counteracts previous momentum
Trading Logic
Signal Generation
The strategy generates trading signals based on momentum shifts in institutional order flow:
1. Long Entry Signal: When cumulative impact crosses from negative to positive
```
if ta.crossover(cumulativeImpact, 0)
strategy.entry("Long", strategy.long)
```
*Logic: Institutional buying pressure has overcome selling pressure, indicating potential upward movement*
2. Short Entry Signal: When cumulative impact crosses from positive to negative
```
if ta.crossunder(cumulativeImpact, 0)
strategy.entry("Short", strategy.short)
```
*Logic: Institutional selling pressure has overcome buying pressure, indicating potential downward movement*
3. Exit Logic: Positions are closed when the cumulative impact moves against the position
```
if cumulativeImpact < 0
strategy.close("Long")
```
*Logic: The original signal is no longer valid as institutional flow has reversed*
Visual Interpretation System
The strategy employs multiple visualization techniques:
1. Color Gradient Bar System:
- Deep green: Strong buying pressure (impact > 0.5)
- Light green: Moderate buying pressure (0.1 < impact ≤ 0.5)
- Yellow-green: Mild buying pressure (0 < impact ≤ 0.1)
- Yellow: Neutral (impact = 0)
- Yellow-orange: Mild selling pressure (-0.1 < impact ≤ 0)
- Orange: Moderate selling pressure (-0.5 < impact ≤ -0.1)
- Red: Strong selling pressure (impact ≤ -0.5)
2. Dynamic Impact Line:
- Plots the cumulative impact as a line
- Line color shifts with impact value
- Line movement shows momentum and trend strength
3. Block Trade Labels:
- Marks significant block trades directly on the chart
- Shows direction and volume amount
- Helps identify key moments of institutional activity
4. Information Dashboard:
- Current impact value and signal direction
- Average volume benchmark
- Count of significant block trades
- Min/Max impact range
Benefits and Use Cases
This strategy provides several advantages:
1. Institutional Flow Detection: Identifies where large players are positioning themselves
2. Early Trend Identification: Often detects institutional accumulation/distribution before major price movements
3. Market Context Enhancement: Provides deeper insight than simple price action alone
4. Objective Decision Framework: Quantifies what might otherwise be subjective observations
5. Adaptive to Market Conditions: Works across different timeframes and instruments by using relative volume rather than absolute thresholds
Customization Options
The strategy allows users to fine-tune its behavior:
- Volume Threshold: How unusual a volume spike must be to qualify
- Lookback Period: How far back to measure average volume
- Impact Decay Factor: How quickly older trades lose influence
- Visual Settings: Labels and line width customization
This sophisticated yet intuitive strategy provides traders with a window into institutional activity, helping identify potential trend changes before they become obvious in price action alone.

Enhanced Volume Profile█ OVERVIEW
The Enhanced Volume Profile (EVP) is an indicator designed to plot a volume profile on the chart based on either the visible chart range or a fixed lookback period. The script helps analyze the distribution of volume at different price levels over time, providing insights into areas of high trading activity and potential support/resistance zones.
█ KEY FEATURES
1. Visible Chart Range vs. Fixed Lookback Depth
Visible Chart Range
- Default analysis mode
- Calculates profile based on visible portion of the chart
- Dynamically updates with chart view changes
Fixed Lookback Depth
- Optional alternative to visible range
- Uses specified number of bars (10-3000)
- Provides consistent analysis depth
- Independent of chart view
2. Custom Resolution
Auto-Resolution Mode
Automatically selects timeframes based on chart's current timeframe:
≤ 1 minute: Uses 1-minute resolution
≤ 5 minutes: Uses 1-minute resolution
≤ 15 minutes: Uses 5-minute resolution
≤ 1 hour: Uses 5-minute resolution
≤ 4 hours: Uses 15-minute resolution
≤ 12 hours: Uses 15-minute resolution
≤ 1 day: Uses 1-hour resolution
≤ 3 days: Uses 2-hours resolution
≤ 1 week: Uses 4-hours resolution
Custom Resolution Override
Optional override of auto-resolution system
Provides control over data granularity
Must be lower than or equal to chart's timeframe
Falls back to auto-resolution if validation fails
3. Volume Profile Resolution
Adjustable number of points (10-400)
Controls profile granularity
Higher resolution provides more detail
Balance between precision and performance
4. Point of Control (PoC)
Identifies price level with highest traded volume
Optional display with customizable appearance
Adjustable line thickness (1-30)
Configurable color
5. Value Area (VA)
Shows price range of majority trading volume
Adjustable coverage (5-95%), default is 68%
Customizable boundary lines
Configurable lines color and thickness (1-20)
█ INPUT PARAMETERS
Lookback Settings
Use Visible Chart Range
- Default: true
- Calculates profile based on visible bars
- Ideal for focused analysis
Fixed Lookback Bars
- Range: 10-3000
- Default: 200
- Used when visible range is disabled
Resolution Settings
Enable Custom Resolution
- Default: false
- Overrides auto-resolution
Custom Resolution
- Default: 1-minute
- Changes automatically when "Enable Custom Resolution" is disabled
Volume Profile Appearance
Profile Resolution
- Range: 10-400
- Default: 200
- Controls detail level
Profile Width Scale
- Range: 1-50
- Default: 15
- Adjusts profile width
Right Offset
- Range: 0-500
- Default: 20
- Controls spacing from price bars
Profile Fill Color
- Default: #5D606B (70% transparency)
Point of Control Settings
Show Point of Control
- Default: true
- Toggles PoC visibility
PoC Line Thickness
- Range: 1-30
- Default: 1
PoC Line Color
- Default: Red
Value Area Settings
Show Value Area
- Default: true
- Toggles VA lines
Value Area Coverage
- Range: 5-95%
- Default: 68%
Value Area Line Color
- Default: Blue
Value Area Line Thickness
- Range: 1-20
- Default: 1
█ TECHNICAL IMPLEMENTATION DETAILS
Exceeding Bars Management
The script dynamically adjusts the number of bars used in the volume profile calculation based on the selected timeframe and the maximum allowed bars (max_bars_back).
If the total number of bars exceeds the predefined threshold (6000 bars), the script reduces the lookback period (lookback_bars) by trimming some of the historical data, ensuring the chart does not become overloaded with data.
The adjustment is made based on the ratio of bars per candle (bars_per_candle), ensuring that the volume profile remains computationally efficient while maintaining its relevance.
█ EXAMPLE USE CASES
1. Visible Range Mode
For analyzing a recent trend and focusing on only the visible part of the chart, enabling the "Use Visible Chart Range" option calculates the profile based on the current view, without considering historical data outside the visible area.
2. Fixed Lookback Depth
For analyzing a specific period in the past (e.g., the last 200 bars), disabling the visible range and setting a fixed lookback depth of 200 bars ensures the profile always considers the last 200 bars, regardless of the visible range.
3. Custom Resolution
If there’s a need for greater control over the timeframe used for volume profile calculations (e.g., using a 5-minute resolution on a 15-minute chart), enabling custom resolution and setting the desired timeframe provides this control.
HAPPY TRADING ✌️

Volume Comparison with Buyer/Seller PressureTHIS indicator is well-structured and provides a comprehensive way to analyze volume alongside buyer and seller pressure. This indicator helps traders analyze volume dynamics in the stock or cryptocurrency market while simultaneously assessing buyer and seller pressure. Its use case revolves around identifying strong buying or selling activity, neutral conditions, and volume trends over different time periods. Below is a breakdown of how to use this indicator:
This Pine Script indicator helps traders analyze volume dynamics in the stock or cryptocurrency market while simultaneously assessing buyer and seller pressure. Its use case revolves around identifying strong buying or selling activity, neutral conditions, and volume trends over different time periods. Below is a breakdown of how to use this indicator:
Key Features and Use Case
Volume-Based Insights:
Displays daily volume and compares it to the 3-day, 5-day, 10-day, and 20-day moving averages of volume. Helps traders identify days with unusual volume spikes relative to historical averages, signaling potential reversals or breakouts.
Buyer and Seller Pressure:
Measures buyer pressure: how much the closing price dominates the trading range of the day.
Measures seller pressure: how much the opening price dominates the trading range of the day.
Highlights areas where buying or selling pressure is particularly strong (≥ 0.75).
Background Signals:
Green Background: Strong buyer pressure (indicative of potential upward momentum).
Red Background: Strong seller pressure (indicative of potential downward momentum).
Gray Background: Neutral market conditions (neither buying nor selling dominance).
Alerts:
Alerts traders when:
Strong buying signals are detected.
Strong selling signals are detected.
The market is neutral, with neither buyers nor sellers in control.
Decision-Making Aid:
Combines volume analysis with price action (buyer/seller pressure) to help traders identify:
Potential breakout opportunities.
Reversal points.
Neutral zones where a trader might avoid trading due to indecision in the market.
How to Use It in Trading:------->
Add the Indicator:
Apply this Indicator to your Trading View chart to start visualizing the buyer/seller pressure and volume averages.
Interpret Volume Trends:
Look for days when daily volume significantly exceeds the 3-day, 5-day, 10-day, or 20-day average.
These could indicate:
A breakout when aligned with strong buyer pressure.
A sell-off when aligned with strong seller pressure.
React to Background Colors:
* Green Background (Strong Buyer Pressure):
Suggests buyers are dominating the market, and upward momentum is likely.
Use this signal to consider buying opportunities, especially if volume is above average.
* Red Background (Strong Seller Pressure):
Indicates sellers are in control, and prices might fall.
Use this signal to consider selling or shorting opportunities.
* Gray Background (Neutral Market):
Reflects indecision; avoid entering trades during these periods unless other signals support a strategy.
Volume Confirmation:
Combine volume analysis with buyer/seller pressure to confirm trends.
Example: A high daily volume with strong buyer pressure signals a high-probability uptrend.
Set Alerts:
Enable alerts to receive real-time notifications when the market generates strong buy/sell signals or enters a neutral zone.
Who Can Benefit:
* Day Traders: Quickly assess intraday market dynamics and volume trends.
* Swing Traders: Identify breakout opportunities or reversal points based on strong buyer/seller pressure.
* Volume Analysts: Compare historical volume averages to current conditions for deeper insights.
Limitations:
Does not guarantee success—should be combined with other technical indicators or strategies.
In low-volume markets, signals may produce false positives or unreliable results.
Assumes traders have basic knowledge of price action and volume analysis.
By integrating this indicator into your strategy, you gain a powerful tool to analyze buyer/seller dominance alongside volume trends, improving your market timing and trade execution.
The Buyer and Seller Pressure components in this indicator provide crucial insights into the market's sentiment and momentum by analyzing the price action relative to the trading volume. Here's how they are used:
1. Buyer Pressure:
Formula:
Buyer Pressure = (Close − Open) / (High − Low )
Interpretation:
* A high buyer pressure (≥ 0.75) indicates strong bullish sentiment, where the price closes much higher than it opened, and the range (high-low) is sufficiently wide.
* It identifies periods of aggressive buying, often signaling potential bullish trends or confirming upward momentum.
2. Seller Pressure:
Formula:
Seller Pressure = (Close − Open ) / (High -Low )
Interpretation:
*A high seller pressure (≥ 0.75) suggests strong bearish sentiment, where the price closes much lower than it opened, within a wide range.
*It helps identify periods of aggressive selling, signaling potential bearish trends or downward momentum.
Purpose in the Indicator:
1. Market Sentiment Analysis:
* Buyer Pressure and Seller Pressure allow traders to gauge market sentiment—whether buyers or sellers dominate a particular time frame.
* This helps in identifying trend reversals or confirmations.
2. Decision-Making Framework:
* The indicator uses thresholds (default 0.75) to classify the market into:
* Strong Buy Signal: When buyer pressure is dominant.
* Strong Sell Signal: When seller pressure is dominant.
* Neutral Signal: When neither buyer nor seller pressure dominates.
*This classification provides a straightforward decision-making tool for traders.
Risk Management:
*By identifying periods of strong buying or selling, traders can avoid entering trades in highly volatile or one-sided markets, which helps reduce risk.
Volume Confirmation:
*Integrating volume data with buyer/seller pressure helps confirm trends. For example:
*High buyer pressure accompanied by higher-than-average volume strengthens the bullish signal.
*Similarly, high seller pressure with higher-than-average volume confirms bearish signals.
Trade Timing:
*The indicator highlights conditions of potential entry (strong buy) or exit (strong sell), allowing traders to time their trades better based on real-time market activity.
Use Case:
*Example:
*Suppose the indicator shows Buyer Pressure = 0.85 with daily volume above the 3-day average. This combination suggests strong bullish activity with momentum, signaling a buy opportunity.
*Conversely, if Seller Pressure = 0.80 with volume above the 5-day average, it signals strong bearish momentum, ideal for selling or shorting.
This indicator combines buyer/seller pressure with volume dynamics, making it valuable for short-term and intraday traders looking for precise market entries and exits.
The background color in this indicator plays an important visual role in helping traders quickly identify the market sentiment based on buyer and seller pressure. It provides a dynamic, color-coded background that changes depending on the strength of the market's buying or selling activity.
Here's how it works:
Background Color Logic:
1. Green Background (Strong Buy Signal):
*Condition: The background turns green when buyer pressure is greater than or equal to 0.75 (strong buying pressure).
*Interpretation: A green background indicates that there is significant bullish sentiment in the market, with strong buying activity. Traders can interpret this as an environment conducive to buying or holding long positions.
*Visual Effect: This helps to quickly spot bullish market conditions, reinforcing potential entry signals for buyers.
2.Red Background (Strong Sell Signal):
*Condition: The background turns red when seller pressure is greater than or equal to 0.75 (strong selling pressure).
*Interpretation: A red background indicates that the market is dominated by selling, showing strong bearish sentiment. Traders can consider this as a signal to sell or short the asset.
*Visual Effect: The red background highlights moments when the market is heavily selling, prompting traders to either exit long positions or take short positions.
Gray Background (Neutral/Indecision Zone):
Condition: The background turns gray when neither buyer nor seller pressure exceeds 0.75. This means the market is neutral, with no dominant bullish or bearish sentiment.
Interpretation: A gray background suggests market indecision or balance between buyers and sellers. It can indicate periods of consolidation or sideways movement where no strong trend is forming.
Visual Effect: The gray background helps traders avoid entering trades when the market lacks a clear direction or when the sentiment is neutral, reducing risk during indecisive times.
Practical Use:
Instant Visual Confirmation:
*Traders can use the background color as an instant confirmation of the market’s sentiment. For instance, if the background turns green, traders might feel more confident in making a long (buy) trade.
*If the background turns red, it serves as a strong visual cue to short or exit a long position.
Helps with Trade Timing:
*The background color can be used in conjunction with other indicators and volume data to time entries and exits more effectively. For example:
*A green background with strong volume indicates a strong trend that could justify a buy.
*A red background with a significant volume surge signals strong selling pressure, which could prompt a sell.
Simplifies Market Analysis:
*For traders who prefer visual cues over complex analysis, the background color simplifies market conditions. Instead of focusing on individual numbers or values, the color-coded background gives them a quick, intuitive view of the market sentiment.
Summary:
* Green background = Strong buying pressure (bullish sentiment)
* Red background = Strong selling pressure (bearish sentiment)
* Gray background = Neutral market (indecision or balance between buyers and sellers)
This background color functionality helps traders stay aware of the prevailing market sentiment at a glance, providing an intuitive way to guide trading decisions.

5x Volume indicator - Day Trading5x Volume Screener - Day Trading
Version: 6.0
Description:
This indicator is designed to identify significant volume spikes in crypto and stock markets,
specifically targeting instances where volume exceeds 5x the average of a 10-period Simple Moving Average (SMA) as the baseline.
Perfect for day traders and momentum traders looking for high-volume breakout opportunities.
Key Features:
Tracks real-time volume compared to 5-period moving average
Visual alerts through green histogram bars for 5x volume spikes
Dynamic volume ratio display showing exact multiple of average volume
Clear threshold line for quick reference
Optional labels showing precise volume ratios
Benefits:
Instantly spot unusual volume activity
Identify potential breakout opportunities
Validate price movements with volume confirmation
Perfect for day trading and scalping
Works across multiple timeframes
Best Used For:
Day trading setups
Breakout trading
Volume confirmation
Momentum trading
Market reversal identification
Created by: CigarSavant
Last Updated: December 2024

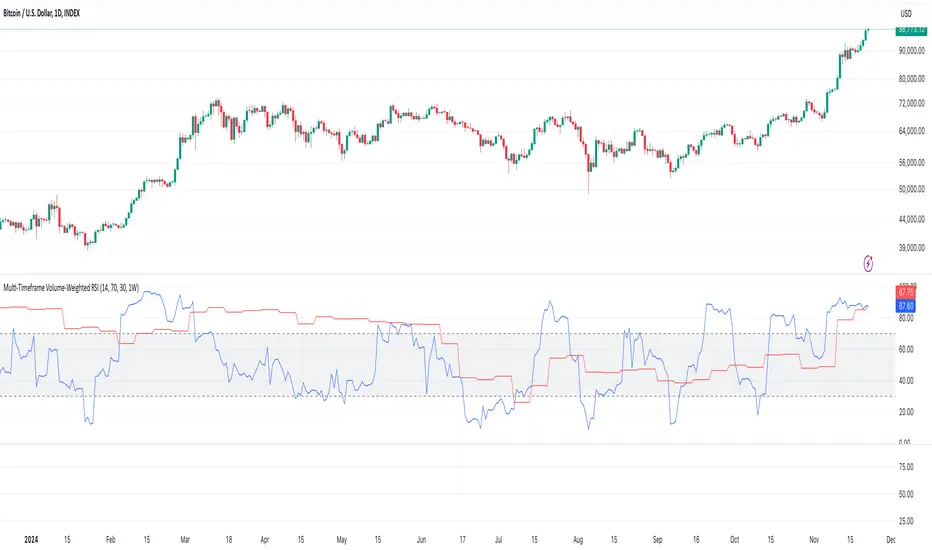
Multi-Timeframe Volume-Weighted RSIA multiple timeframe volume-weighted RSI.
Blue Line = Current Time Frame
Orange Line = Select your desired Time Frame
e.g. Blue = Daily, Orange = Weekly
1. Incorporates Market Commitment
Value: By factoring in volume, the volume-weighted RSI captures the intensity of trading activity behind price movements.
Why it’s useful:
Regular RSI measures price momentum but does not differentiate between moves with high or low trading activity.
A volume-weighted RSI assigns greater importance to price changes occurring on high volume, reflecting stronger market conviction.
2. Improved Signal Reliability
Value: Signals generated by a volume-weighted RSI (e.g., overbought or oversold conditions) may be more reliable because they account for the level of trader participation.
Why it’s useful:
Low-volume price movements often result in false signals or "noise."
A volume-weighted RSI helps filter out such noise, reducing the likelihood of false breakouts or fake reversals.
3. Better Divergence Detection
Value: Divergences between price action and the RSI (bullish or bearish divergences) are more meaningful when confirmed by volume.
Why it’s useful:
Regular RSI might show divergence in price momentum, but this divergence might lack substance if the underlying volume is weak.
A volume-weighted RSI ensures that divergence signals align with periods of significant market participation.
4. Enhanced Trend Analysis
Value: Trends supported by strong volume are given more weight, helping traders better identify and follow trends.
Why it’s useful:
Regular RSI might show overbought or oversold signals prematurely during strong trends.
Volume-weighted RSI considers whether trends are backed by significant market activity, helping avoid early exits.
5. More Meaningful Overbought/Oversold Levels
Value: Levels like 70 (overbought) and 30 (oversold) are more credible when supported by volume.
Why it’s useful:
In a regular RSI, overbought or oversold levels might occur on light trading, leading to false reversals.
A volume-weighted RSI ensures these levels are triggered by substantial market participation, increasing their reliability.
Practical Applications:
Trend Confirmation: Use the volume-weighted RSI to confirm whether momentum in a trend is supported by strong participation.
Divergence Spotting: Identify divergences with more confidence by prioritizing those with volume support.
Filtering False Breakouts: Avoid entering trades during weak volume phases by focusing on volume-weighted RSI signals.
Limitations:
Market Type Dependency: Its usefulness may diminish in low-volume assets or markets where volume data is unavailable (e.g., forex).
Volume Flow ConfluenceVolume Flow Confluence (CMF-KVO Integration)
Core Function:
The Volume Flow Confluence Indicator combines two volume-analysis methods: Chaikin Money Flow (CMF) and the Klinger Volume Oscillator (KVO). It displays a histogram only when both indicators align in their respective signals.
Signal States:
• Green Bars: CMF is positive (> 0) and KVO is above its signal line
• Red Bars: CMF is negative (< 0) and KVO is below its signal line
• No Bars: When indicators disagree
Technical Components:
Chaikin Money Flow (CMF):
Measures the relationship between volume and price location within the trading range:
• Calculates money flow volume using close position relative to high/low range
• Aggregates and normalizes over specified period
• Default period: 20
Klinger Volume Oscillator (KVO):
Evaluates volume in relation to price movement:
• Tracks trend changes using HLC3
• Applies volume force calculation
• Uses two EMAs (34/55) with a signal line (13)
Practical Applications:
1. Signal Identification
- New colored bars after blank periods show new agreement between indicators
- Color intensity differentiates new signals from continuations
- Blank spaces indicate lack of agreement
2. Trend Analysis
- Consecutive colored bars show continued indicator agreement
- Transitions between colors or to blank spaces show changing conditions
- Can be used alongside other technical analysis tools
3. Risk Considerations
- Signals are not predictive of future price movement
- Should be used as one of multiple analysis tools
- Effectiveness may vary across different markets and timeframes
Technical Specifications:
Core Algorithm
CMF = Σ(((C - L) - (H - C))/(H - L) × V)n / Σ(V)n
KVO = EMA(VF, 34) - EMA(VF, 55)
Where VF = V × |2(dm/cm) - 1| × sign(Δhlc3)
Signal Line = EMA(KVO, 13)
Signal Logic
Long: CMF > 0 AND KVO > Signal
Short: CMF < 0 AND KVO < Signal
Neutral: All other conditions
Parameters
CMF Length = 20
KVO Fast = 34
KVO Slow = 55
KVO Signal = 13
Volume = Regular/Actual Volume
Data Requirements
Price Data: OHLC
Volume Data: Required
Minimum History: 55 bars
Recommended Timeframe: ≥ 1H
Credits:
• Marc Chaikin - Original CMF development
• Stephen Klinger - Original KVO development
• Alex Orekhov (everget) - CMF script implementation
• nj_guy72 - KVO script implementation
Volume-Adjusted Schaff Trend Cycle (VASTC)Volume-Adjusted Schaff Trend Cycle (VASTC)
The VASTC is a fairly fast-moving oscillator designed to identify trends early and signal when trends may be nearing their end. While it can be used for both trend-following and mean-reversion strategies , it shines in trend-following setups. It’s particularly useful for catching the start of a trend and giving early warnings that a trend might end soon, making it a valuable addition to a multi-indicator system.
How It Works:
The VASTC adapts the traditional Schaff Trend Cycle by adjusting the MACD component with volume data. This volume-adjusted MACD is run through two stochastic processes , applying exponential smoothing to enhance responsiveness. Volume sensitivity allows the VASTC to adapt dynamically to periods of high or low trading activity, providing more reliable trend signals.
Recommended Use:
Use VASTC in confluence with other indicators to confirm trend entries and exits. It’s best for identifying early trend setups rather than sustaining prolonged trend trades. When used alongside other indicators, especially those with a longer-term outlook or momentum based trend indicators, you’ll gain a clearer signal for potential exits or entries. Always backtest the VASTC on your chosen assets to determine the most effective input parameters, as the defaults may not suit all markets or assets. Different assets behave differently, and adjustments in parameters can improve its ability to analyze the assets you're looking at.
Parameters:
Length : Sets the primary smoothing length.
Fast/Slow Length : Adjust the speed of the volume-adjusted MACD component.
Factor : Controls the final smoothing applied to the STC.
Overbought/Oversold Levels : Defines overbought/oversold levels.
Experiment with these settings to customize the VASTC to your trading strategy and asset.
Disclaimer : This indicator is a tool to complement your trading analysis and should not be used in isolation. Always backtest and use other confluence signals for best results. The assets I looked at when making this indicator are almost certainly different than what you're looking at.
