[DisDev] Tactical Analysis Part III: Oscillators🟩 Introducing the Oscillators Indicator by Disruptive Developers, a revolutionary tool designed to enhance your trading strategy. This indicator is the third part of our Tactical Analysis suite, combining two oscillator indicators to provide you with a comprehensive view of market conditions.
⚡ OVERVIEW ⚡
Key Features 🔑
Combines TDI Pro - Traders Dynamic Indicator by Dean Malone and WTO - Wave Trend Oscillator
Includes MFI - Money Flow Index and MACD - Moving Average Convergence Divergence
Incorporates VWAP - Volume Weighted Average Price
Benefits 💸
Enhances trading strategy by providing comprehensive market insights
Helps determine overbought or oversold conditions in ranging markets
Assists in identifying important entry and exit points
⚙️ CONFIGURATION & SETTINGS ⚙️
Inputs 🔧
Green / Red = The RSI Price-Line (Current Price Sentiment)
Dark Red = The Signal Line (Crossover for Entry & Exit)
Yellow = Market Base Line (Overall Sentiment)
Blue = Volatility Bands (Increasing/Decreasing Volatility)
Alerts 🔔
TDI Cross Short/Long Alerts
TDI MBL Cross Short/Long Alerts
TDI Hook Short/Long Alerts
💡 USAGE & STRATEGY 💡
Trading Strategies 📈
Look for regular and hidden divergences
Identify entries and exits based on crosses with Price-Line
Align trades with market sentiment
Timeframes and Symbols ⌚
Suitable for all timeframes and symbols
Optimized for Forex trading but applicable to all markets
🤖 DETAILS & METHODOLOGY 🤖
Algorithm and Calculation 🛡️
Based on the TDI indicator created by Dean Malone
Incorporates RSI, Signal Line, Market Base Line, and Volatility Bands
Signals for regular and hidden divergences
📚 ADDITIONAL RESOURCES 📚
Tutorials and Guides 📖
Detailed user manual available on our website
Video tutorials for setup and usage
Discord community forum for user discussions and tips
Visit our website for additional information, videos and pdf’s, link can be found below.
Chart Examples 📊
Trader’s Dynamic Index (TDI): Overbought/Oversold Signals
WaveTrend/Moneyflow/VWAP (WMV) Overbought/Oversold Signals
Tactical Analysis Indicator Suite. Parts I, II, and III.
🚀 CONCLUSION 🚀
In conclusion, the Tactical Analysis Part III: Oscillators indicator by Disruptive Developers is a powerful tool that combines multiple oscillators to provide a comprehensive view of market conditions. It is designed to enhance your trading strategy and help you make more informed trading decisions.
Access Parts I and II here:
Tactical Analysis Part I: High-Volume Recovery
Tactical Analysis Part II: Levels
⚠️ DISCLAIMER ⚠️
This indicator is provided as a tool for traders and should not be used as the sole basis for making trading decisions. Always conduct your own research and consider your risk tolerance before entering any trades.
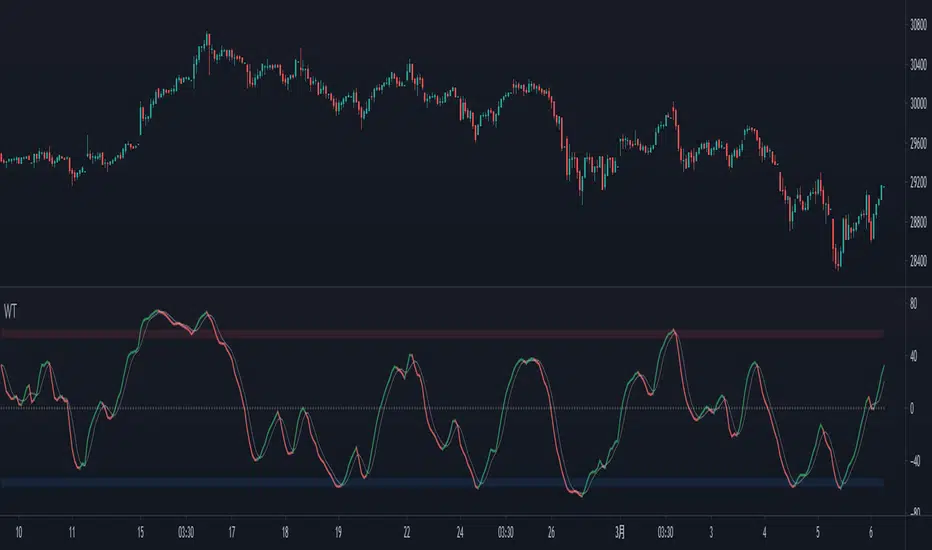
Search in scripts for "WaveTrend"

Range of a source displayed in thirdsThis indicator will take the value of any external source input and display how it has changed over time (the lookback period in settings). For the purposes of display here I'm using the WT1 line from Wavetrend with Crosses by LazyBear to provide a source input.
The highest and lowest value of the source over the lookback period are used to determine the highest and lowest point - the green and red lines at the top and bottom of the bands. This region is then mathematically split into three, such that the source (and its optional moving average line) can be defined as being in the top third, the middle or the bottom third.
Applications for this could be in risk management where you may wish to take on a larger position size when a certain indicator is in the top third, or decide that you want to enter / leave positions when the source crosses in / out of the extreme points.

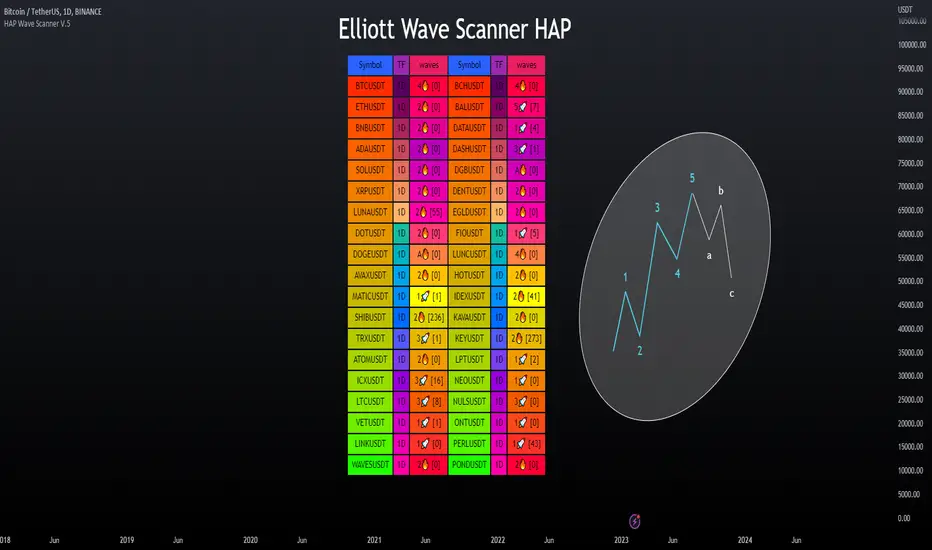
Elliott Wave Scanner - HAP [PRO] ▶Elliott Wave Scanner
This is an added feature of the wave drawing version, but this version is used for scanning multiple currency pairs simultaneously, based on the custom list you have specified as your preferred ones, making it more convenient for you.
This :
════════════════════════
This will be an adjustment of the number bars to be similar to the version in the drawing wave, with the only difference being that this version will be a scan of multiple waveforms simultaneously, including the input data format. It is recommended to only change the numbers, maintaining the original structure to avoid any errors, as demonstrated in the example below.
This is a valid example.👇
Wave0= (21),
Wave1= (13),
Wave2= (8),
Wave3= (21),
Wave4= (13),
Wave5= (34),
WaveA= (13),
WaveB= (8),
WaveC= (21)
**Kindly note to specify the numerical sequence of each wave. Parentheses should always be preceded by a comma and conclude on the final line without one.
════════════════════════
▶Let's take a look at the different parts of the scanned version.
════════════════════════
🎯 Bringing in the RSI to help make decisions, as referenced in the book by "Jason Perl".
if the market is advancing as part of a bullish HAP WAVE up sequence, then the RSI should remain above `40` during corrective setbacks for HAP WAVEs 2 and 4. Similarly, if the market is declining as part of a bearish HAP WAVE down sequence, then the RSI should remain beneath 60 during corrective for HAP WAVEs 2 and 4
For example, an uptrend in Wave tends to cause an RSI divergence between Wave 5 and Wave 3. When Wave 5 exceeds Wave 3, the RSI is often seen at Wave 5, which is lower than Wave 3.
Paid script
GKD-C Trading Channel Index [Loxx]Giga Kaleidoscope Trading Channel Index is a Confirmation module included in Loxx's "Giga Kaleidoscope Modularized Trading System".
█ Giga Kaleidoscope Modularized Trading System
What is Loxx's "Giga Kaleidoscope Modularized Trading System"?
The Giga Kaleidoscope Modularized Trading System is a trading system built on the philosophy of the NNFX (No Nonsense Forex) algorithmic trading.
What is an NNFX algorithmic trading strategy?
The NNFX algorithm is built on the principles of trend, momentum, and volatility. There are six core components in the NNFX trading algorithm:
1. Volatility - price volatility; e.g., Average True Range, True Range Double, Close-to-Close, etc.
2. Baseline - a moving average to identify price trend
3. Confirmation 1 - a technical indicator used to identify trends.
4. Confirmation 2 - a technical indicator used to identify trends.
5. Continuation - a technical indicator used to identify trends.
6. Volatility/Volume - a technical indicator used to identify volatility/volume breakouts/breakdown.
7. Exit - a technical indicator used to determine when a trend is exhausted.
How does Loxx's GKD (Giga Kaleidoscope Modularized Trading System) implement the NNFX algorithm outlined above?
Loxx's GKD v1.0 system has five types of modules (indicators/strategies). These modules are:
1. GKD-BT - Backtesting module (Volatility, Number 1 in the NNFX algorithm)
2. GKD-B - Baseline module (Baseline and Volatility/Volume, Numbers 1 and 2 in the NNFX algorithm)
3. GKD-C - Confirmation 1/2 and Continuation module (Confirmation 1/2 and Continuation, Numbers 3, 4, and 5 in the NNFX algorithm)
4. GKD-V - Volatility/Volume module (Confirmation 1/2, Number 6 in the NNFX algorithm)
5. GKD-E - Exit module (Exit, Number 7 in the NNFX algorithm)
(additional module types will added in future releases)
Each module interacts with every module by passing data between modules. Data is passed between each module as described below:
GKD-B => GKD-V => GKD-C(1) => GKD-C(2) => GKD-C(Continuation) => GKD-E => GKD-BT
That is, the Baseline indicator passes its data to Volatility/Volume. The Volatility/Volume indicator passes its values to the Confirmation 1 indicator. The Confirmation 1 indicator passes its values to the Confirmation 2 indicator. The Confirmation 2 indicator passes its values to the Continuation indicator. The Continuation indicator passes its values to the Exit indicator, and finally, the Exit indicator passes its values to the Backtest strategy.
This chaining of indicators requires that each module conform to Loxx's GKD protocol, therefore allowing for the testing of every possible combination of technical indicators that make up the six components of the NNFX algorithm.
What does the application of the GKD trading system look like?
Example trading system:
Backtest: Strategy with 1-3 take profits, trailing stop loss, multiple types of PnL volatility, and 2 backtesting styles
Baseline: Hull Moving Average as shown on the chart above
Volatility/Volume: Average Directional Index (ADX) as shown on the chart above
Confirmation 1: Trading Channel Index as shown on the chart above
Confirmation 2: Jurik Turning Point Oscillator
Continuation: Fisher Transform
Exit: Rex Oscillator
Each GKD indicator is denoted with a module identifier of either: GKD-BT, GKD-B, GKD-C, GKD-V, or GKD-E. This allows traders to understand to which module each indicator belongs and where each indicator fits into the GKD protocol chain.
Giga Kaleidoscope Modularized Trading System Signals (based on the NNFX algorithm)
Standard Entry
1. GKD-C Confirmation 1 Signal
2. GKD-B Baseline agrees
3. Price is within a range of 0.2x Volatility and 1.0x Volatility of the Goldie Locks Mean
4. GKD-C Confirmation 2 agrees
5. GKD-V Volatility/Volume agrees
Baseline Entry
1. GKD-B Baseline signal
2. GKD-C Confirmation 1 agrees
3. Price is within a range of 0.2x Volatility and 1.0x Volatility of the Goldie Locks Mean
4. GKD-C Confirmation 2 agrees
5. GKD-V Volatility/Volume agrees
6. GKD-C Confirmation 1 signal was less than 7 candles prior
Continuation Entry
1. Standard Entry, Baseline Entry, or Pullback; entry triggered previously
2. GKD-B Baseline hasn't crossed since entry signal trigger
3. GKD-C Confirmation Continuation Indicator signals
4. GKD-C Confirmation 1 agrees
5. GKD-B Baseline agrees
6. GKD-C Confirmation 2 agrees
1-Candle Rule Standard Entry
1. GKD-C Confirmation 1 signal
2. GKD-B Baseline agrees
3. Price is within a range of 0.2x Volatility and 1.0x Volatility of the Goldie Locks Mean
Next Candle:
1. Price retraced (Long: close < close or Short: close > close )
2. GKD-B Baseline agrees
3. GKD-C Confirmation 1 agrees
4. GKD-C Confirmation 2 agrees
5. GKD-V Volatility/Volume agrees
1-Candle Rule Baseline Entry
1. GKD-B Baseline signal
2. GKD-C Confirmation 1 agrees
3. Price is within a range of 0.2x Volatility and 1.0x Volatility of the Goldie Locks Mean
4. GKD-C Confirmation 1 signal was less than 7 candles prior
Next Candle:
1. Price retraced (Long: close < close or Short: close > close )
2. GKD-B Baseline agrees
3. GKD-C Confirmation 1 agrees
4. GKD-C Confirmation 2 agrees
5. GKD-V Volatility/Volume Agrees
PullBack Entry
1. GKD-B Baseline signal
2. GKD-C Confirmation 1 agrees
3. Price is beyond 1.0x Volatility of Baseline
Next Candle:
1. Price is within a range of 0.2x Volatility and 1.0x Volatility of the Goldie Locks Mean
3. GKD-C Confirmation 1 agrees
4. GKD-C Confirmation 2 agrees
5. GKD-V Volatility/Volume Agrees
█ Trading Channel Index
What is Trading Channel Index
The Trading Channel Index measures the location of average daily price relative to a smoothed average of average daily price. It is derived from the average difference between these two values.
Requirements
Inputs
Confirmation 1 and Solo Confirmation: GKD-V Volatility / Volume indicator
Confirmation 2: GKD-C Confirmation indicator
Continuation: GKD-C Confirmation indicator
Outputs
Confirmation 2 and Solo Confirmation: GKD-E Exit indicator
Confirmation 1: GKD-C Confirmation indicator
Continuation: GKD-E Exit indicator
Additional features will be added in future releases.
This indicator is only available to ALGX Trading VIP group members . You can see the Author's Instructions below to get more information on how to get access.

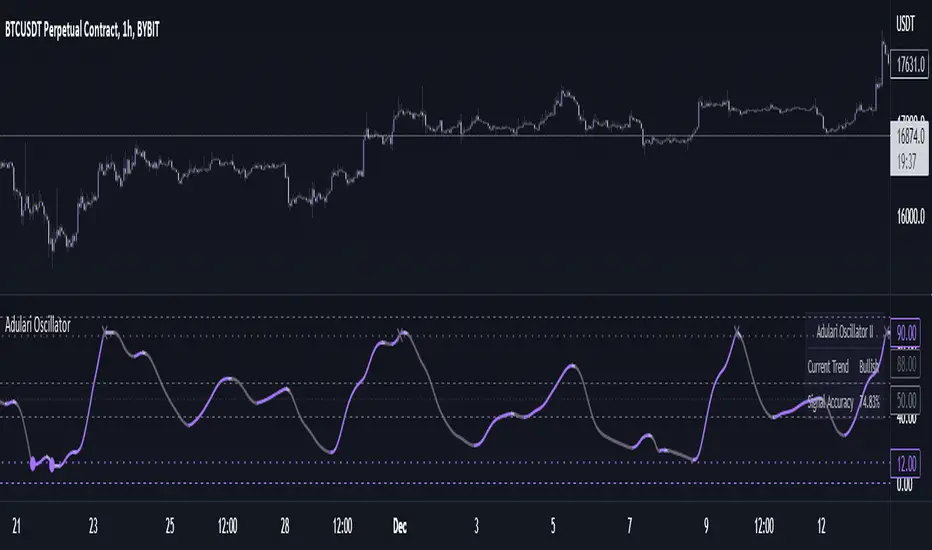
Adulari OscillatorThis indicator is included with Adulari Professional.
Adulari Oscillator is a trading tool that can be used on any asset, and any given timeframe. It is special because it self-optimizes, meaning no configuration is required before usage.
How do I use it?
Never use this indicator as standalone trading signal, it is meant to be used as confirmation.
Look for strong trends crossing on the middle line.
Combine the trend strength indications with the signals. For example: if a bullish signal was printed after a strong downtrend this may indicate a strong reversal.
The accuracy shown in the indicator is merely a tool. Past results do not indicate future results. Historical data will differ from future data.
Features:
Self-optimizing, no configuration required.
Purple dots for bullish trend reversals, gray crosses for bearish trend reversals.
Gradient histogram that shows the strength of a bullish or bearish trend with a stronger color.
White line that indicates clear bottoms or tops.
Automatically determined top and bottom borders that may show trend reversals.
Dashboard that shows the accuracy of the signals, total amount of signals, total amount won, and total amount lost.
Alert conditions that allow you to set alerts for bullish or bearish signals.
How does it work?
The oscillator line is calculated using our custom version of the very well-known and loved stochastic. The bullish signals are given when the oscillator value falls below the oversold line, and the bearish signals when the oscillator value exceeds the overbought line. These oversold and overbought lines are determined by our algorithm. The accuracy shown in the dashboard is calculated with the following methods: the highest or lowest price within the lookback range divided by the price at the moment of a signal multiplied by the minimum percentage change. When this condition is true it means a signal was valid and thus it will be added to the total wins, when the condition is false it will be added to the total losses. Accuracy is then determined by dividing the total wins by total signals. A win is when the minimum percentage move in the settings occurred within x amount of bars (settings) after a signal. When these conditions are not met, it will be considered a loss. Keep in mind that this is not a trading strategy, and these wins/losses do not represent actual trades. The accuracy also does not represent a winrate or anything of a sort while using the indicator.
This script is unique because it does a few things. It self-optimizes based on historical data, which I was not able to find in this specific stochastic like oscillator format. And it will show you the average accuracy of the signals based on all the signals given on the chart, which I was not able to find in this same exact format either.
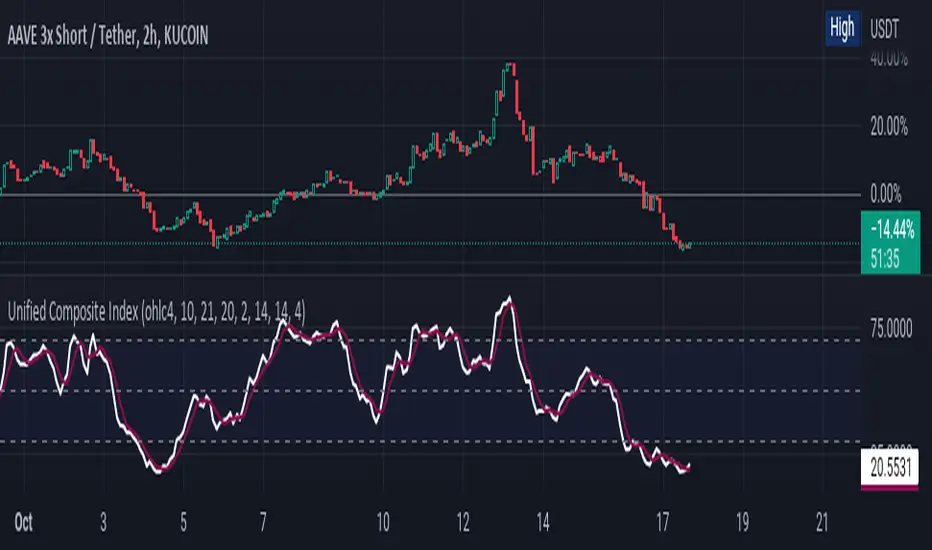
Unified Composite Index [UCI] [KuraiBlu] [LazyBear]The purpose of this indicator is to combine the four basic types of indicators (Trend, Volatility, Momentum and Volume) to create a singular, composite index in order to provide a more holistic means of observing potential changes within the market, known as the Unified Composite Index . The indicators used in this index are as follows:
Trend - Trend Composite Index
Volatility - Bollinger Bands %b
Momentum - Relative Strength Index
Volume - Money Flow Index
The average price source can’t be altered as I’ve made it an average between ((open + close) / 2) and ((high + low) / 2).
The best way to use this is by observing several of the indicators at once in conjunction with the average, rather than simply using the average produced to determine the right moment to enter, or exit a trade by itself. I've found when one indicator goes way out of bounds relative to the other three (and subsequently, the average array), then it presents a good buying, or selling opportunity.
Some adjustments were made to several of the indicators in order to standardize them on a scale of 1-100 so that they could better accommodate the average array that was finally produced. Thanks to LazyBear for letting me strip down the WaveTrend Oscillator.
MarketVision Screener█ OVERVIEW
• Screens 36 Assets at Once
• This Screener is Unique in that it turns my MarketVision series of Indicators Into a Complete Trading System
• To help you Automatically find Possible Turning Points in the Market the Following MarketVision Parameters are Displayed
o Linear Regression Direction and whether Price can be considered Over Bought / Sold according to the Linear Regression Channel (This works exceptionally well if used in confluence with manually drawn Fibonacci retracements)
o RSI value and Over / Very Over Bought / Sold condition
o Trend Meter – Shows Condition of the Trend Meter and its associated Trend / Money Flow Bar
o Wave Trend Crossing Condition taken from MarketVision B or Cipher B
o Wave Trend Divergences
o Super Trend Direction – Not a usual MarketVision parameter but it helps
• Furthermore you can choose where abouts on your chart you want the Screener displayed – this allows for multiple Screeners on one chart
█ HOW TO USE IT
• Look for Confluence between different parameters,
• For example Linear Regression Pointing Down and Price Over Bought according to both RSI and Linear Regression Channel, this is where you can look for maybe a Wave Trend cross down or a specific Candle Stick Pattern on you Chart with a Divergence
• Other confluences that work well are Trend Meter cross at the same time as a Wave Trend cross – Look for This Symbol "⯅ ⬱🡅⇶" or "⬱🡇⇶ ⯆"
• There are many possibilities the rest is up to you and your Trading Style / System
• Feel the Power
█ LIMITATIONS
• Can Not Set Alerts at This Stage – This is for a future Update or Script
• Slow Loading Time – As this is a rather long script Loading time is dependent on Internet Speed and your Computer Hardware
█ CREDITS
• Tradingview for the Pine Script Engine found under the hood of these amazing scripts
• QuantNomad and Others for their pioneering work making it possible to bring these sorts of advanced scripts to life
█ DISCLAIMER
• Not Financial Advice BUT
• Always use Proper Risk / Money Management – Never Risk more than you can Afford to Lose, Preferably not more than 1% - 2% of your Account
• Do Not FOMO or Revenge Trade
• Please remember that Past Performance may not be indicative of future results
Due to various factors, including changing market conditions, the strategy may no longer perform as well as in historical Back Testing

Bollinger but BetterA better Bollinger Band with an average of 20 EMAs as pivot price, which makes its standard deviation way more sensitive compared to traditional Bollinger Band.
-- My Tips --
Long flat convergence suggests a big potential price movement.
Short quick convergence of short supportive ema(default: 10days) and upper band suggests a safe middle entry point.
Recommended auxiliary indicator: Wavetrend by Lazybear, which points out entry and exit points quite accurately in bull market.
-- PS --
This system is a hybrid of EMA Ribbons and Bollinger Band.
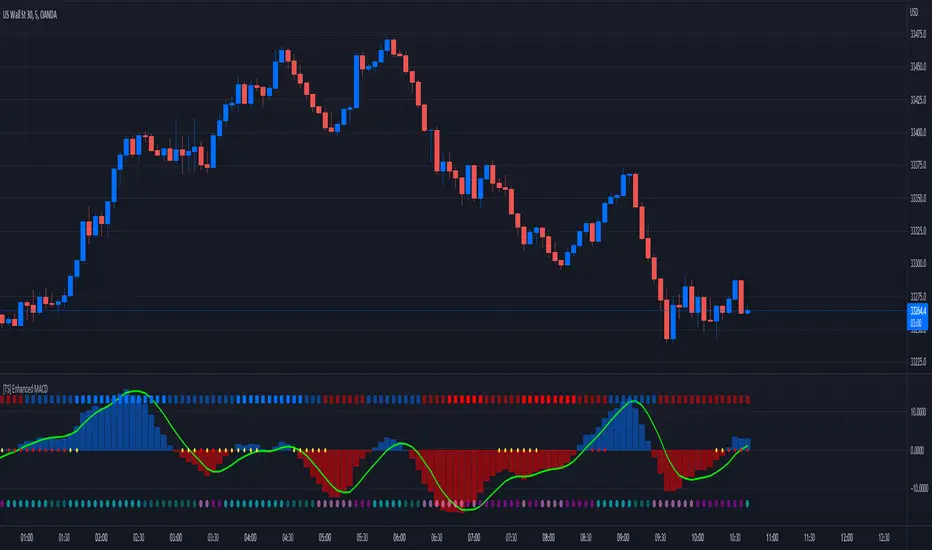
[TS] Enhanced MACDThis is an Enhanced version of the standard MACD Indicator.
It displays the MACD Histogram as a normalized oscillator for a better visual representation (With values between -100 to 100)
On the top we have the WaveTrend indicator, showing the general trend of an asset (4 Color codings)
On 0 line, with red and yellow circles, is displayed the Contraption (or so-called Squeeze) of the price action.
When these circles appear a major shift in trend is expected.
On the bottom, we have another set of circles, which measure the price compression - These signal a period of very low price volatility.
MA ClustersBackground :
This study allows to define ranges for contraction and expansion of a defined set of MA to analyse the the momentum at those specific situations.
In general all functions used are very basic but allows the user to set alerts when a cluster of MA enters a defined range within or outside the MAX and MIN of a selected MA cluster. The predefined length of the EMAs were put together by HurstHorns within a trading learning discord group and are designed for 1M timeframe to read the momentum for scalping entries - Thanks again for sharing.
Functions :
currently the following MA are available:
- ema
- sma
- smma
- wma
- vwma
- vma
the variable moving average is based on the calculation from lazybear.
- RSI Stoch Filter
- Wavetrend OB/OS filter
Currently only alerts for contraction are enabled to not overload the study but in case expansion would be from interest this can be added quickly.
Outlook:
Additional filters were added to see if they can add value in. the decision making or by simply filtering out noise. This is still quite experimental. Please share any useful observation I should add as additional filter option to find good setups. in relation to contractions or expansions.
Next version will get Bollinger bands for 1 selectable MA from the list for additional study options.
In case you are interested in more options such as more MA types or vwap.. just let me know. for VMA I need to do more research to add useful function for laddering or things like that.
In general The script itself can be easily extended by additional functions. As this is one of my first scripts the code itself might not be optimal or there are more elegant ways to come to the same goal. However please use for study purposes only and report bugs or enhancement requests.
good luck and happy trading!

Too Many Cooks trend indicatorToo many Cooks in The Kitchen
You have probably heard the adage "Too many cooks spoils the broth" before. The meaning behind it is obviously that when to many people are trying to work on the same task at once it simply devolves into a fight for control and creates a mess of the situation. But is this true for indicators is the question I had and thus I made this indicator, a simple combination of 8 random trend finding indicators I assembled (A list of these indicators and their authors will be available at the bottom of this page) . Is it any good though ? In short yes, it is a decent trend finding indicator and could likely be used in your strategy in the place of your current trend finding indicator if you so wish. However much of the versatility of the individual indicators IS lost and would not be possible to get back in this big mess of a broth, so this indicator will not be the be all end all of trend indicators nor will it be a free money machine like you may be expecting looking at the list of included indicators so the adage was correct to a degree.
List of Authors and their included indicators
Trading View defaults:
MACD (Modified by me)
Stochastic RSI (Modified by me)
Lazy Bear:
Wavetrend Oscilator (Modified by me)
Traders Dynamic Index (Modified by me)
HACOLT (Modified by me)
Algokid
AK Trend
Racer8
Average Force
KivancOzbilgic
Average Sentiment Osclilator
[MAD] Curve SimpleWelcome to my simple RSI Curve indicator
to the mathematical background:
This is an experimental adaptive support and resistance study based on the Reverse-Engineered Relative Strength Index (RevEngRSI) by Giorgos Siligardos, along with a zigzag study based on the Relative Strength Index by J. Welles Wilder.
Giorgos Siligardos holds a PhD in mathematics and a market maker certificate in derivatives from the Athens Stock Exchange. He is a developer of financial software and co-author of academic books on finance. Giorgos Siligardos was also a research and teaching fellow at the University of Crete for many years, as well as a lecturer in the Department of Finance and Insurance at the Technological Educational Institute of Crete, where he taught mathematics and finance courses and supervised master's theses.
This is the one time frame limited edition (but changeable).
Levels 3+4 are activated by a break of key levels
What to trade: formations and specific directions of popping up spikes (L3 and L4)
in the end you have to find a eye whats a valid Formation via expirience, BUT if learnt propperly you should be almost one candle before the action in your decission.
It is a optical support indicator, may use MACD Wavetrend or SupportResistance indicators as support
For a optical better clearer picture use "Kelter Worms" as background and disable the fillings in the color-settings
This here is the full featured pro version, multitimeframe and many additional options

Wave Trend OscillatorThis is a very standard version of the Wave Trend Oscillator.
The Channel and Average values are displayed as lines, most people display them as areas.
The Channel and Average difference is displayed as a histogram, most people display it as a tiny noisy area.
I was unable to find a standard version of the Wave Trend Oscillator.
The colorful hyped up versions of this indicator made me feel like a clown while using them.
I have essentially copied the style of the MACD with this indicator, to keep things professional.
With this WTO, you can change the timeframe and source.
You can also change the histogram average length and multiplier, making it usable.
The typical way that people display the histogram is completely unusable and just for appearance.
Now it does a decent job showing when the momentum of the WTO's downward movement is slowing down, just like how the MACD histogram works.
This indicator is essentially a normalized MACD, though they are calculated differently.
The Wave Trend Oscillator is useful for spotting/monitoring changed in mid-trend momentum.
In my experience, divergence in this indicator is a strong signal.
If the MACD is too slow for you, then this is a great alternative; without all the extra fluff people usually add to it.

The Divergent (Pro) - Advanced Divergence IndicatorAutomated divergence detection with unparalleled customizability for any market on TradingView.
This is the Pro version of The Divergent - Advanced Divergence Indicator .
The Pro version contains everything that is in the Basic version, plus:
1. Access to a 2nd indicator, called "The Divergent's Companion"
By applying the companion indicator to the same chart you have The Divergent on, you will have the divergence lines and labels plotted on your price chart as well:
2. Hidden Divergences
While the Basic version can only detect Regular Divergences, the Pro version can detect both Regular and Hidden Divergences:
3. Seven more oscillators to detect divergences on
The Basic version comes with the two most popular oscillators, the MACD and the RSI.
With the Pro version you get access to 7 more oscillators:
- CMF (Chaikin Money Flow)
- Stochastic RSI
- MFI (Money Flow Index)
- TCI (Trading Channel Index), also known as WaveTrend
- Balance of Power
- CCI (Commodity Channel Index)
- Awesome Oscillator
4. Alerts
With the Pro version you can set up alerts on The Divergent indicator, allowing you to get alerted to one of the following events:
1. Regular Bullish Divergence
2. Hidden Bullish Divergence
3. Regular Bearish Divergence
4. Hidden Bearish Divergence
5. Pivot Low Confirmed
6. Pivot High Confirmed
5. Divergence Verification
The Pro version allows you to measure the quality of the detected divergences.
With divergence verification enabled, The Divergent will tell you how many times a particular divergence "played out", i.e. how many times a bullish or bearish divergence has actually resulted in the change in price in the direction predicted by the divergence. You can configure the price % levels which are used to categorise the divergences as valid or invalid (or unknown).
6. Use the signals in your own Pine Script strategy / indicator
The Pro version comes with access to a Pine Script Library called The Divergent Library .
Just add The Divergent onto the same chart you have your strategy on, link the two together using a "source" input, and use the functions in the library to process the signals from The Divergent :
You can think of The Divergent being a DaaS ( D ivergece a s a S ervice)!
7. Customise the look of the divergence lines and labels
The Pro version allows you to change the style of the divergence lines and labels:
---

Golden Mile indicatorThis indicator is based on several different collectively calculated indicators which are already used by many traders.
These include:
RSI
MFI
WaveTrend
Stochastics, and a few more bits i've thrown in.
This indicator can be used on any time frame, and is highly effective at helping decide whether the pressure lies in Buys or Sells.
free access..
Enjoy! :)

Jetto's Indicator This indicator allows me to provide a free version of my custom indicator which utilities LazyBears WaveTrend indicator.

MarketVision BWith Special Thanks to Everyone who has gone before me, and who have both allowed me given me permission to bring my version of Market Cipher to the World
Especially LazyBear for his amazing Wave Trend Oscillator and for Aevir, falconCoin, vumanchu, Crypto_Spike and others who have freely brought MarketCipher to the Tradingview Community
Also special mention to RicardoSantos for his Divergence script
MarketVision B - My take on MarketCipher B / Market Cipher B, Ive just put outlines on the Wave Trend to add to the Visual Appeal and Added a Trend Meter and a few more options for the Oscillators
Nice To Look At
Oscillator 1 Choose Between - RSI, MFI and Ultimate Oscillator
For Stochastics Choose Between Standard and RSI Stochastics and for the source you can choose On Balance Volume
Wave Trend
Money Flow
Trend Meter & Signals Bar
Divergences are marked, However they are easy to spot and it is better to train your eyes to spot them before the indicator marks them out
Lots of Alerts and Loads of ways to trade using MarketVision
PS: You can make this look like the original by adjusting the parameters in the menu

Simple Wave Trend Wave Trend Oscillator with minimal functionality.
- Change color by crossing
- Overboughtr and Oversold band
- Zero line
True Momentum Oscillator"TMO calculates momentum using the delta of price. Giving a much better picture of trend, trend reversals and divergence than momentum oscillators using price". This is comparable to the WaveTrend Oscillator, gives more or less better or worse signals depending on the time frame and markets. This is a free and open source indicator found in many platforms, now ported to TV.
This indicator uses the closing and opening of the price in a way that reminds me of the Qstick indicator but it seems different. It's an oscillator with overbought and oversold zones and crossovers for entry and exits. I included the option of changing the moving averages from the standard exponential types used in its 3 functions to calculate the main and signal lines just in case the settings need to be changed further or if anyone wants to experiment to find better settings on top of just changing the lengths for each length type. I added dots for when the Main line crosses the Signal line. The Main line is darkened in case anyone needs to see it better.

CUSTOM_DAYTRADER_ALERTDescription.
The main component of this idea is the simple Rule of Buy Low & Sell High using the Williams R% and the Wavetrend to form a strong bias of Buyers and Sellers' participation.
A quick & easy application:
Buy Arrow: Wait for price to correct if price did not break the low before the Buy arrow buys at the close above the new High.
Sell Arrow: wait for the price to retrace, if the price did not break the high before the sell arrow sells at the close below the new low.
You can set an Alert easy to understand Buy and Sell Alerts.
Enjoy!
You can add this to your existing strategies and kindly share your finding to help others.

cloe V X.0 triple wave trend with trend This script is based on the lazybears wavetrend script
with a extra useful ema
the third ema is based on the last 200 periods and show how the trend is going in the time
- When the original wave cross the third ema it's means that we can continue long or short
- When the third ema stretchs below or up the 0 line it means that the current pair is oversell or overbought but in a large period of time so we can decide if we continue long or short

Buy/Sell/TP/SL/TSL Alerts ModuleThis tool is not a self-sufficient indicator, just an attachable module that allows you to enhance a specific indicator with risk management components without having a headache.
What you need to do, and actually this is the most important step, is to rewrite your indicator to a buy-sell signal form which will output only -1, 0, 1 values and then connect it to the module.
After that the module gives you a lot of possibilities to customize Take Profit, Stop Loss and Trailing Stop Loss levels through the settings window and to set all the alerts you need up.
Simple Buy/Sell setup for the RSI:
Now I am adding Stop Loss:
and Take Profit:
and finally Trailing Stop Loss:
Okay, I have shown how it works with RSI signals. Here is example for the MACD:
and example for the WaveTrend Oscillator:
If you have any questions don't hesitate to ask and contact me either via private messages on TradingView or via Telegram

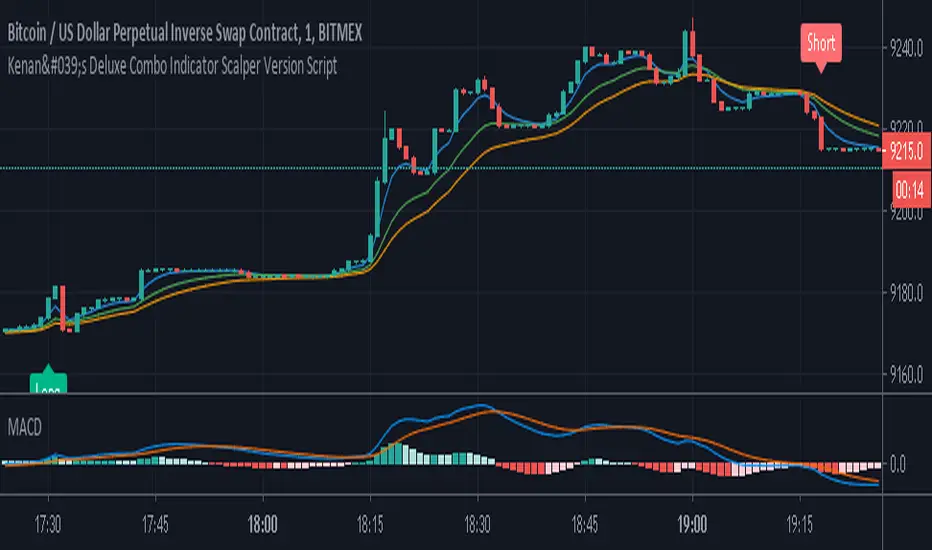
Kenan's Deluxe Combo Indicator Scalper Version ScriptThis is a combo strategy of sorts. I've been able to come up with this strategy after a lot of research.
Under Normal circumstances, when people look at dozens of indicators and they all signal, they open positions. So I decided to save people the trouble and put the major indicators together in a strategy.
All of the classic cross strategies usually give a lot of signal. Some of these signals are unnecessary and incorrect signals. Combining leading indicators. I tried to avoid the faulty signals.
Indicators and oscillators included in this strategy are:
1. Ema 5/13/21
2. Macd
3. Macd Dema
4. Ichimoku
5. Dmi
6. Stochastic
7. Aroon
8. Bollinger Band
9. Rsi
10. Chande Momentum Oscillator
11. Exponential Ease of Movement ( Eom )
12. Klinger Oscillator
13. Stochastic RSI
14. Ultimate Oscillator
15. Woodies CCI
16. Rate Of Change Lenght( Roc ) oscillator
17. WaveTrend Oscillator . It was created by @fskrypt.
18. Ehlers Adaptive CG Indicator . It was created by @LazyBear
19. Insync Index. It was created by @LazyBear
This script works by listening to the indicators and oscillators above. Opens new position after receiving signal verification signal from all
So how does this strategy close your position (optional).
1. You can close the position with the trailing stop option.
2. You can close the position according to the Rsi limits. To give an example. After a long position is opened, you can close the position after the rsi has risen above 70.
3. You can close the position according to the Bollinger Band . After a position is opened, you can close the position after the price moves out of the bollinger Band .
You can also change the values of indicators as desired. If you get better results. I would appreciate it if you could contact me via comment or private message.
I set the commission rate at 0.075 percent. If you want, you can change the settings yourself and make backtest.I changed the default settings for some indicators.