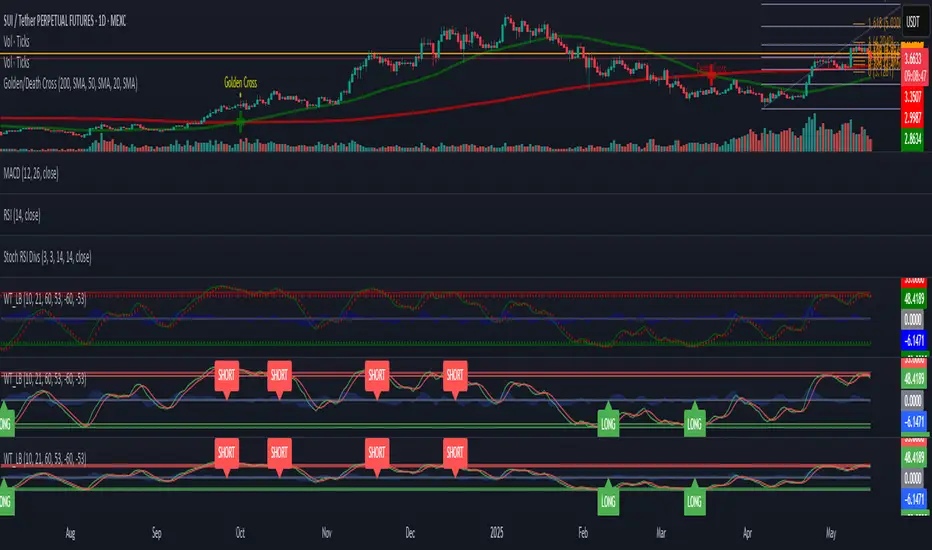
WaveTrend [LazyBear] with Long/Short LabelsWaveTrend Oscillator with Entry Signals (LONG/SHORT) – Advanced Edition
This indicator is based on the renowned WaveTrend Oscillator by LazyBear, a favorite among professional traders for spotting trend reversals with precision.
🚀 Features:
Original WaveTrend formula with dual-line structure (WT1 & WT2).
Customizable overbought and oversold zones for visual clarity.
Automatic LONG and SHORT signals plotted directly on the chart:
✅ LONG: When WT1 crosses above WT2 below the oversold zone.
❌ SHORT: When WT1 crosses below WT2 above the overbought zone.
Momentum histogram shows strength of market moves.
Fully optimized for Pine Script v5 and lightweight across all timeframes.
🔍 How to use:
Combine with support/resistance levels or candlestick reversal patterns.
Works best on 15min, 1H, or 4H charts.
Suitable for all markets: crypto, stocks, forex, indices.
📊 Ideal for:
Traders seeking clean, reliable entry signals.
Reversal strategies with technical confluence.
Visual confirmation of WaveTrend crossovers without manual interpretation.
💡 Pro Tip: Combine with EMA or RSI filters to further enhance accuracy.
Search in scripts for "WaveTrend"
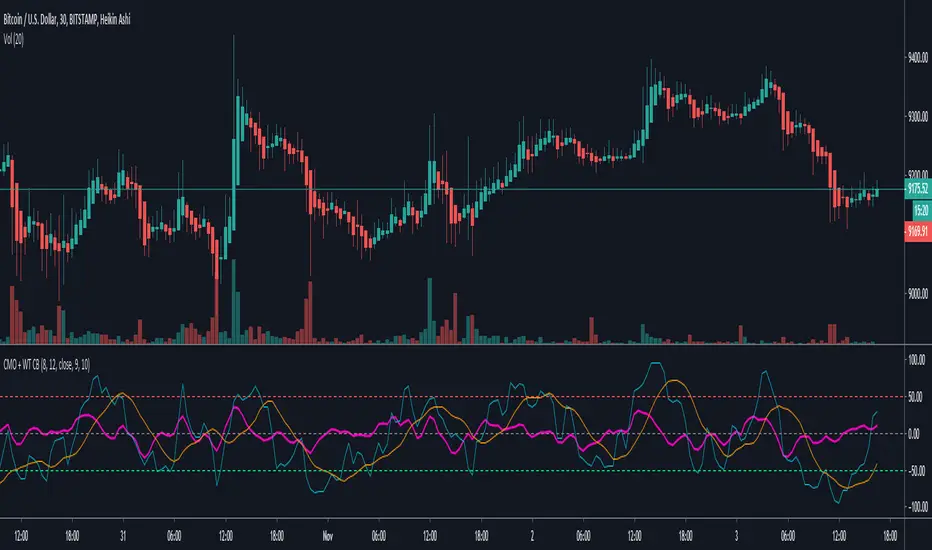
Chande Momentum Oscillator + WaveTrend Oscillator [ChuckBanger]This is a combination of Lazybears WaveTrend Oscillator (purple line) and Chande Momentum Oscillator (blue line with the orange line as a signal line). Use WaveTrend as a confirmation tool. It is consider as a selling point when CMO is over the red horizontal dotted line. The opposite applies if CMO line is under the red horizontal dotted line.
You can also use this with WaveTrand to confirm the sell or buy point. When WT line is over center line and CMO has crossed over it's signal line. It is a buy point. The opposite applies if WT line is under the center line and CMO is under its signal line.
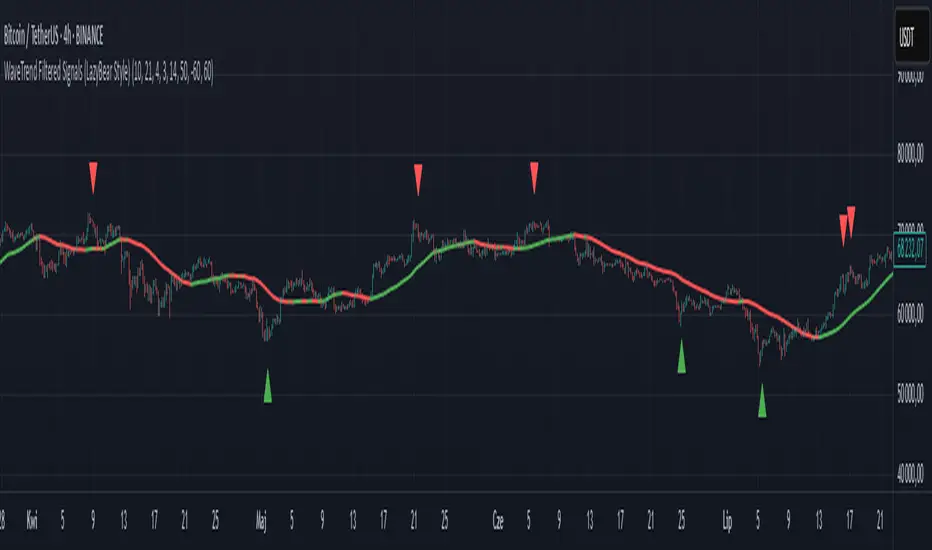
WaveTrend Filtered Signals (LazyBear Style)WaveTrend Filtered Signals (LazyBear Style)
This indicator is based on the popular WaveTrend oscillator (LazyBear) and adds several optional filters to improve signal quality:
✅ Available filters:
WT oversold/overbought zones – enabled by default. Signals are shown only if WT was previously in the specified zone (e.g., < -60 for longs, > 60 for shorts).
SMA trend filter – allows filtering signals in the direction of the moving average trend.
SMA position filter – signals appear only when price is above (for long) or below (for short) the moving average.
Consolidation filter – ignores signals during low-volatility sideways price movement.
💡 All filters are optional and can be enabled or disabled in the settings.
The default setup focuses on a clean approach: WaveTrend + oversold/overbought zones, with other filters left for customization.
Waddah Attar Explosion and WaveTrend Oscillator combinedWaddah Attar Explosion by LazyBear and WaveTrend Oscillator by Krypt.
All credits goes to LazyBear and Krypt, i have only done some combining with the two indicators, barcolors and BG colors to clarify entrys and exits.
Combine with CM_Williams Vix_Fix, Super Guppy R1.0 by JustUncleL and you have a powerful tool.
Barcolors to look for
Aggressive Buy 1 = Lime
Agressive Buy 2 = Aqua
Buy = Green
Sell 1 = Orange
Sell 2 = Red
This is my first try, so be nice to me :-)

WaveTrend LazyBear + BUY/SELL Labels (Custom Color)WaveTrend LazyBear + BUY/SELL Labels (Custom Color)

WaveTrend + Alert + LSMA + CrossWaveTrend inspired by LazyBear's WT indicator with addition of crossing dots, crossing alert and LSMA
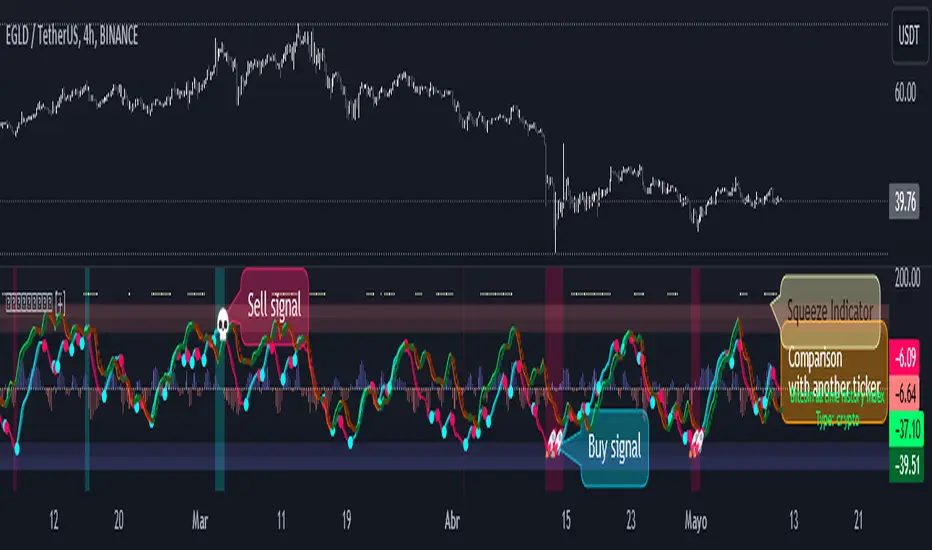
WaveTrend Oscillator PlusThe WaveTrend based on “Enhanced WaveTrend” of EliCobra. The WaveTrend Oscillator is a popular technical analysis tool used to identify overbought and oversold conditions in the market and generate trading signals. This indicator introduces additional features for improved analysis and comparison across assets.
WaveTrend:
The original WaveTrend indicator calculates two lines based on exponential moving averages and their relationship to the asset's price. The first line measures the distance between the asset's price and its EMA, while the second line smooths the first line over a specific period. The result is divided by 0.015 multiplied by the smoothed difference ('d' for reference). The indicator aims to identify overbought and oversold conditions by analyzing the relationship between the two lines.
In the original formula, the rudimentary estimation factor 0.015 times 'd' fails to accomodate for approximately a quarter of the data, preventing the indicator from reaching the traditional stationary levels of +-100. This limitation renders the indicator quantitatively biased, as it relies on the user's subjective adjustment of the levels. The enhanced version replaces this factor with the standard deviation of the asset's price, resulting in improved estimation accuracy and provides a more dynamic and robust outcome, we thereafter multiply the result by 100 to achieve a more traditional oscillation.
Enhancements and Features:
Dynamic Estimation: The original indicator uses an arbitrary estimation factor, while the enhanced version replaces it with the standard deviation of the asset's price. This modification provides a more dynamic and accurate estimation, adapting to the specific price characteristics of each asset.
Stationary Support and Resistance Levels: The enhanced version provides stationary key support and resistance levels that range from -150 to 150. These levels are determined based on the analysis of the indicator's data and encompass more than 95% of the indicator's values. These levels offer important reference points for traders to identify potential price reversals or significant price movements.
Comparison Across Assets: The enhanced version allows for better comparison and analysis across different assets. By incorporating the standard deviation of the asset's price, the indicator provides a more consistent and comparable interpretation of the market conditions across multiple assets.
Z-Score Analysis:
The Z-Score is a statistical measurement that quantifies how far a particular data point deviates from the mean in terms of standard deviations. In the enhanced version, the calculation involves determining the basis (mean) and deviation (standard deviation) of the asset's price to calculate its Z-Score, thereafter applying a smoothing technique to generate the final WaveTrend value.
Utility:
The offers traders and investors valuable insights into overbought and oversold conditions in the market. By analyzing the indicator's values and referencing the stationary support and resistance levels, traders can identify potential trend reversals, evaluate market strength, and make better informed analysis.
The following indicators were added:
⎆⎆ Squeeze Momentum Indicator
⎆⎆ Elliott Wave Oscillator
⎆⎆ Expert Trend Locator
WaveTrendnel Oscillator [UAlgo]🔶Description:
The WaveTrendnel Oscillator, is a technical analysis tool designed for traders to identify potential trend reversals and overbought/oversold conditions in the market. It combines the concepts of wave analysis and trend analysis to generate signals based on the current market conditions. This indicator aims to provide traders with insights into the strength and direction of the prevailing trend, facilitating better decision-making in trading strategies.
🔶Key Features:
Customizable Parameters: Users can customize various parameters including the source data, channel length, average length, and signal length according to their trading preferences and market conditions.
Signal Display: The indicator offers the option to display buy and sell signals on the chart, helping traders to visually identify potential entry and exit points.
Wave and Kernel Analysis: The WaveTrendnel Oscillator utilizes a rational quadratic kernel function, which applies a mathematical approach known as the kernel method. This method analyzes historical price data by assigning weights to each data point based on its proximity to the current period, providing a smoother and more accurate representation of market trends.
Overbought/Oversold Levels: Traders can define overbought and oversold levels using customizable threshold parameters, enabling them to identify potential reversal points in the market.
🔶Credit:
The WaveTrendnel Oscillator indicator is a modification of the original WaveTrend Oscillator developed by @LazyBear on TradingView.
🔶Disclaimer:
Use with Caution: This indicator is provided for educational and informational purposes only and should not be considered as financial advice. Users should exercise caution and perform their own analysis before making trading decisions based on the indicator's signals.
Not Financial Advice: The information provided by this indicator does not constitute financial advice, and the creator (UAlgo) shall not be held responsible for any trading losses incurred as a result of using this indicator.
Backtesting Recommended: Traders are encouraged to backtest the indicator thoroughly on historical data before using it in live trading to assess its performance and suitability for their trading strategies.
Risk Management: Trading involves inherent risks, and users should implement proper risk management strategies, including but not limited to stop-loss orders and position sizing, to mitigate potential losses.
No Guarantees: The accuracy and reliability of the indicator's signals cannot be guaranteed, as they are based on historical price data and past performance may not be indicative of future results.

SJ WaveTrendWaveTrend Indicator – Full English Brief for TradingView
Description:
The WaveTrend Oscillator (WT) is a momentum-based indicator originally developed by LazyBear, designed to identify overbought and oversold market conditions with high precision. It is conceptually similar to the RSI and Stochastic Oscillator but uses a wave-based mathematical approach to detect turning points in price action earlier and more smoothly.
⸻
🔍 How It Works
WaveTrend analyzes the difference between price and its moving average (typically the exponential moving average of the Typical Price).
It then applies multiple layers of smoothing to filter out noise and produce two oscillating lines — WT1 (fast) and WT2 (slow).
The crossing points between WT1 and WT2 are used to identify momentum shifts:
• When WT1 crosses above WT2 from below the oversold zone → Bullish signal
• When WT1 crosses below WT2 from above the overbought zone → Bearish signal
⸻
⚙️ Core Formula Concept
The WaveTrend calculation typically follows this process:
1. Compute the Typical Price (TP) = (High + Low + Close) / 3
2. Calculate the Exponential Moving Average (EMA) of TP over a short length
3. Determine the Raw Wave (ESA) and De-trended Price Oscillator (DPO)
4. Apply double smoothing to produce the final WT1 and WT2 values
These smoothed waves behave like energy waves that expand and contract based on market volatility — hence the name WaveTrend.
⸻
📈 Interpretation
• Overbought Zone: WT values above +60 to +70
• Oversold Zone: WT values below -60 to -70
• Crossovers: WT1 crossing WT2 signals a potential trend reversal
• Divergence: When price makes a new high/low but WT does not, it signals momentum weakening
⸻
🧠 Trading Insights
• Best used on higher timeframes (H1 and above) for trend confirmation, and on lower timeframes (M15–M30) for precise entries.
• Combine with ADX, EMA Cloud, or Volume Filters to confirm real momentum shifts and avoid false signals.
• You can highlight WT Diff (WT1 - WT2) to visualize momentum expansion and contraction; large positive or negative differences often precede strong reversals.

WaveTrend MACD Fusion Oscillator [MatrixQuantLabs]WaveTrend MACD Fusion Oscillator is a composite momentum oscillator that combines WaveTrend trend structure with MACD momentum analysis in a unified panel.
It is designed to help traders better align trend strength, wave timing, and signal confirmation through normalization, filtering, and divergence analysis.
Core Concept
Instead of using the original WaveTrend histogram structure, this indicator adopts the standard MACD histogram as its momentum foundation.
This design choice allows for clearer and more reliable differentiation of trend strength, while maintaining consistency across different symbols and timeframes through normalization.
WaveTrend is then applied as a wave timing and signal layer, making the overall structure easier to interpret and more robust in varying market conditions.
Key Features
Normalized MACD for Cross-Market Consistency
• The indicator uses standard MACD parameters (12/26/9) and applies normalization to scale values into a consistent range.
• This helps avoid chart distortion across different symbols and timeframes.
• An optional “Hide Weekly+” mode is provided to prevent higher-timeframe MACD values from compressing the panel scale.
MACD Histogram with Optional MACD Lines
• The MACD histogram visually represents bullish and bearish momentum, with dynamic coloring to reflect momentum expansion or contraction.
• MACD and Signal lines can be optionally displayed when deeper analysis is required.
Divergence Detection (Regular & Hidden)
Built-in divergence detection supports both MACD lines and histogram-based divergences, with selectable modes:
• Regular Divergence for potential reversals
• Hidden Divergence for trend continuation
Pivot-based confirmation and range filters help reduce noise and false signals.
WaveTrend Oscillator with Cross Strength Classification
• The WaveTrend module consists of a main trend line and a signal line, highlighting wave structure and momentum shifts.
• Golden crosses and death crosses are classified into multiple strength levels, allowing users to distinguish minor signals from more significant ones.
• The closer a counter-directional cross occurs to the overbought or oversold zones, the stronger the potential reversal signal.
• Optional Laguerre smoothing can be enabled to reduce noise and improve signal stability.
MACD-Based Signal Filtering
WaveTrend cross signals can be filtered using MACD conditions:
• Histogram Filter: Bullish crosses only when the MACD histogram is bullish, bearish crosses only when bearish
• Zero-Line Filter: Bullish crosses only above the MACD zero line, bearish crosses only below
These filters help align wave signals with the broader momentum context and reduce counter-trend noise.
Parameter Notes
Normalization Period
• Adjust this value if the indicator appears compressed or if different symbols show inconsistent scaling.
Pivot Right
• Higher values provide stronger confirmation with more delay; lower values are more sensitive and respond faster.
Laguerre Smoothing (Gamma)
• Lower values offer stronger smoothing and stability; higher values provide faster but noisier responses.
Usage Notes
• Use WaveTrend crosses to identify wave timing and momentum shifts.
• Use MACD (histogram and zero line) to assess trend direction and momentum strength.
• Divergence signals should be treated as early warnings, not standalone trade triggers.
• Best results are achieved when combined with trend analysis, price structure, or higher-timeframe context.
Disclaimer
This indicator is intended for educational and analytical purposes only and does not constitute financial advice. Always apply proper risk management and confirm signals with additional analysis.

WaveTrend Dynamic (Lazy Bear Style)█ OVERVIEW
The WaveTrend Dynamic indicator (in the style of Lazy Bear) is an advanced tool based on the Exponential Smoothing Average (ESA), which adapts to the volatility and price of a financial instrument. It is more flexible than the classic WaveTrend but shares a similar concept of bands around a main oscillator line.
The indicator uses dynamic bands calculated as distances from the ESA, with their width adjustable via the "level" parameter. This allows it to be tailored to various markets, timeframes, and volatility conditions, making it easier to identify trends, reversal points, and buy/sell signals.
█ CONCEPTS
The WaveTrend Dynamic combines oscillator functions with trend analysis. Below, we explain the key components in a simple way, understandable even for beginner users.
Core Calculations
The indicator relies on the adaptive ESA and a few straightforward steps:
1 — ESA (Adaptive Average): Calculated as a smoothed average of the price (from high, low, and close, or HLC3) using the ESA Length parameter (default: 10). This number determines how many past candles are considered in the calculation. The ESA quickly responds to price changes, helping to track trends.
2 — Deviation (D): Measures how much the price deviates from the ESA, factoring in market volatility. This allows the indicator to adapt to different instruments.
3 — Price Distance Indicator (CI): Shows how far the price is from the ESA relative to market volatility. This forms the basis for the main indicator line, reacting to price movements.
4 — WT1 (WaveTrend 1): The main line, smoothing the Price Distance Indicator (CI) with the Average Length parameter (default: 21). It reflects the direction of price movement and momentum.
5 — WT2 (WaveTrend 2): A signal line that further smooths WT1 (with a period of 4). It helps confirm signals through crossovers with WT1.
6 — Bands (UpperBand and LowerBand): These form a dynamic channel around the ESA. Their width depends on the level parameter (default: 100). Wider bands result in fewer but more reliable signals. In the original WaveTrend, the oscillator bands use lower values, such as 50 or 60. To achieve classic oscillator signals (more frequent WT1/WT2 crossovers outside the bands), set the level to 50–60.
Trend Identification
The indicator identifies two types of trends:
• Major Trend: Determined by the position of WT1 relative to the ESA. When WT1 is above the ESA, it indicates a bullish trend. When below, it signals a bearish trend. Line and fill colors reflect this trend.
• Mini-Trend: Based on WT1 and WT2 crossovers. When the lines cross, they change to the same color, signaling short-term changes or reversal points. This is ideal for quick trading decisions.
Visuals and Effects
• WT1 and WT2 Lines: Scaled to price and displayed on the price chart for easier analysis.
• Fills: Between the bands (UpperBand/LowerBand) and between WT1/WT2, with a "wave" effect that adjusts transparency based on the trend (green for bullish, red for bearish).
• Signals: Three types—return-to-band, WT1/WT2 crossovers outside the bands, and crossovers inside the bands. Signals are displayed as triangles with different colors for buy and sell.
█ FEATURES
Detailed features of the indicator, aligned with the order of settings in the script:
• Basic Parameters: ESA Length — controls ESA smoothing; Average Length — affects WT1 responsiveness; level (WT Level) — adjusts band width for signal filtering.
• Display Elements: Options to show/hide ESA, bands, WT1/WT2; customizable colors for lines, fills, and the wave effect.
• Signals: Three signal groups (return-to-band, crossovers outside bands, crossovers inside bands) with display and color customization options.
█ HOW TO USE
1 — Add the indicator to your TradingView chart and adjust parameters: — Increase ESA Length and Average Length for low-volatility markets (e.g., stocks), or decrease for cryptocurrencies or forex. — Set level to 50–60 for classic WaveTrend signals with WT1/WT2 crossovers outside bands. The default value of 100 creates wider bands and fewer signals.
2 — Analyze trends: — Major trend (WT1 vs. ESA) shows the overall market direction. — Mini-trends (WT1/WT2 crossovers) help time short-term entries.
3 — Use signals: — Return-to-band: Buy at the lower band, sell at the upper band (mean-reversion). — Crossovers outside bands: Indicate strong momentum (with a lower level, e.g., 50). — Crossovers inside bands: Signal weaker trend changes.
4 — Combine with other tools: Use with volume, RSI, or support/resistance for better decisions. Test on historical data to optimize settings.

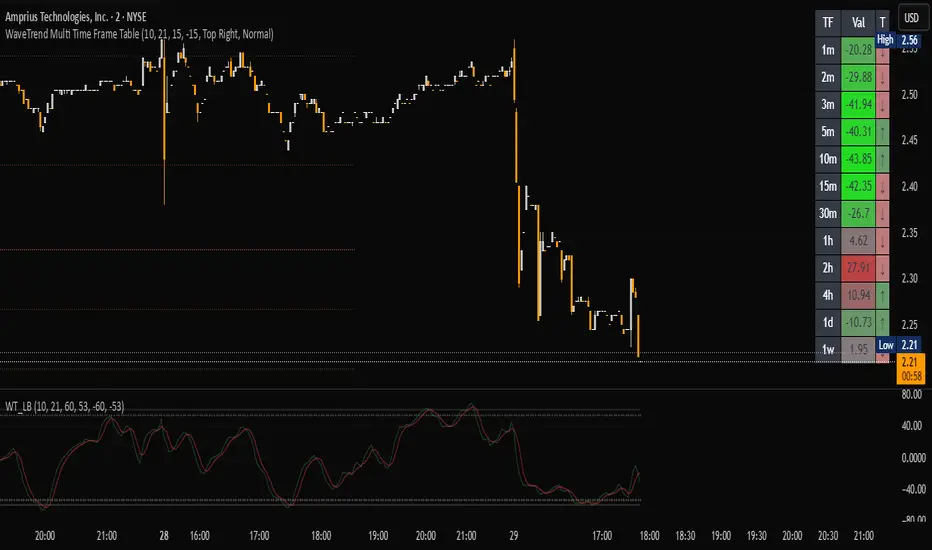
WaveTrend Matrix (1m-1w) – Custom ThresholdsA visual control panel for momentum exhaustion across ten key time-frames.
—
🧬 DNA
This is a fork of LazyBear’s original WaveTrend Oscillator .
The oscillator logic is 100 % intact; I simply stream the values into a compact table so that day- and swing-traders can see the “bigger picture” at a glance.
📈 What does it do?
Calculates WaveTrend on ten granularities: 1m, 3m, 5m, 15m, 30m, 1h, 2h, 4h, 1d, 1w.
Displays the current oscillator print in a color-coded matrix.
• Red = overbought (≥ high threshold)
• Green = oversold (≤ low threshold)
• Gray = neutral / in-range
All thresholds are user-adjustable.
Built on Pine v5, zero repainting, works on any symbol.
🛠 Parameters
Channel Length – WT “n1” (default 10)
Average Length – WT “n2” (default 21)
Red from – overbought cut-off (default +60)
Green under – oversold cut-off (default –60)
🚀 How to use it
1. Apply the indicator to your chart – no extra setup required.
2. Read the matrix top-down before every entry:
• Multiple deep-green rows → market broadly oversold → watch for longs.
• Multiple deep-red rows → market broadly overbought → watch for shorts or stay flat.
3. Combine with your trend filter (EMA-stack, VWAP, structure) to avoid counter-trend trades.
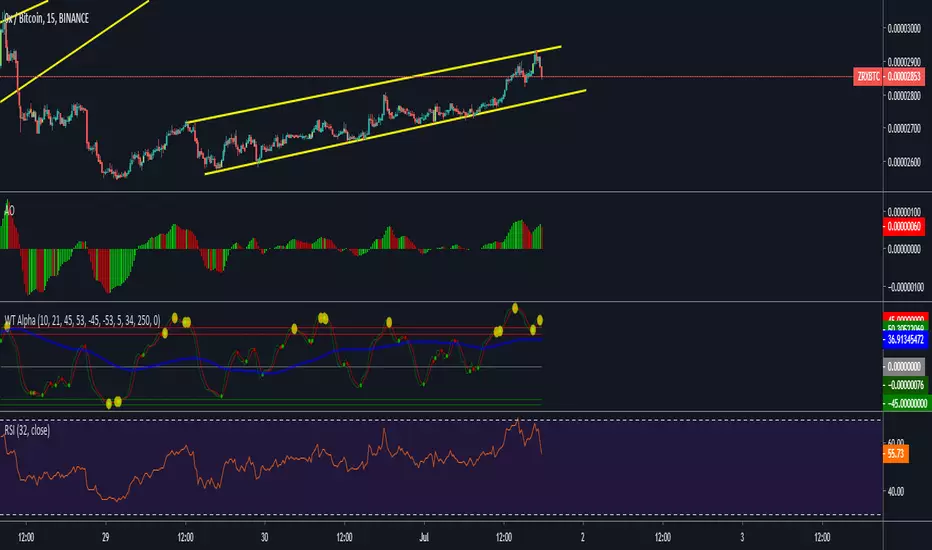
WaveTrend By LimaIndicator packing both WaveTrend and RSI.
Source code for the WaveTrend belongs to LazyBear and RSI well, it is a Pinescript method.

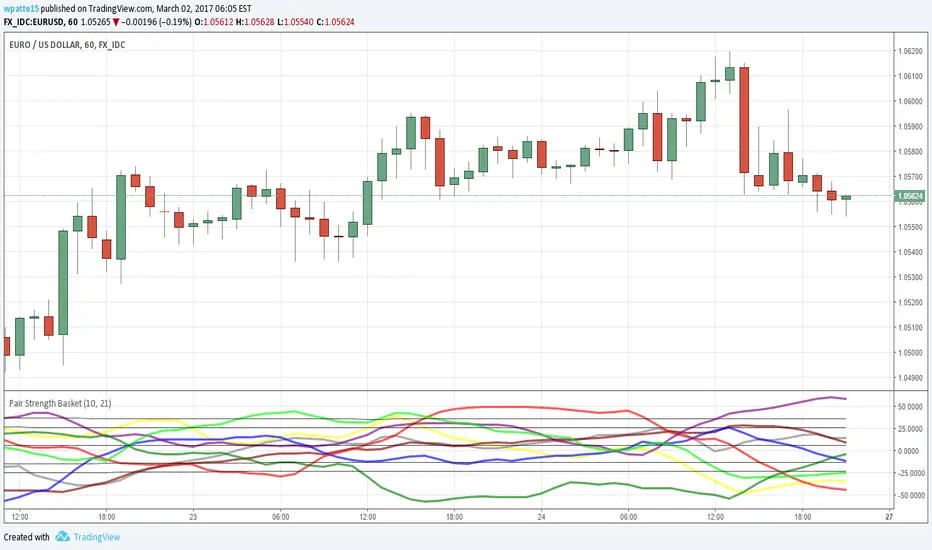
Pair Strength BasketAgain thanks to LazyBear for bringing over the wavetrend indicator and glaz for the idea of the basket of currencies. This is a power index based on the wavetrend indicator, I cut it down to 5 securities per currency since the limit of securities I could call was 40. I like to use to see which pair is the most OB/OS as it likely presents the best profit potential.
AUD = Yellow
CAD = Gray
CHF = Maroon
EUR = Blue
GBP = Red
JPY = Purple
NZD = Lime
USD = Green
STEEMSBD WaveTrendWaveTrend-Oscillator over synthetic STEEM/SBD based on STEEM/BTC and SBD/STB from Poloniex.
WaveTrend part is based on LazyBear's port of TS/MT indicator.

WaveTrend with Crosses [LazyBear]LazyBear's wavetrend oscillator enhanced with wavetrend cross visualization on the indicator as well as with bar color highlights.

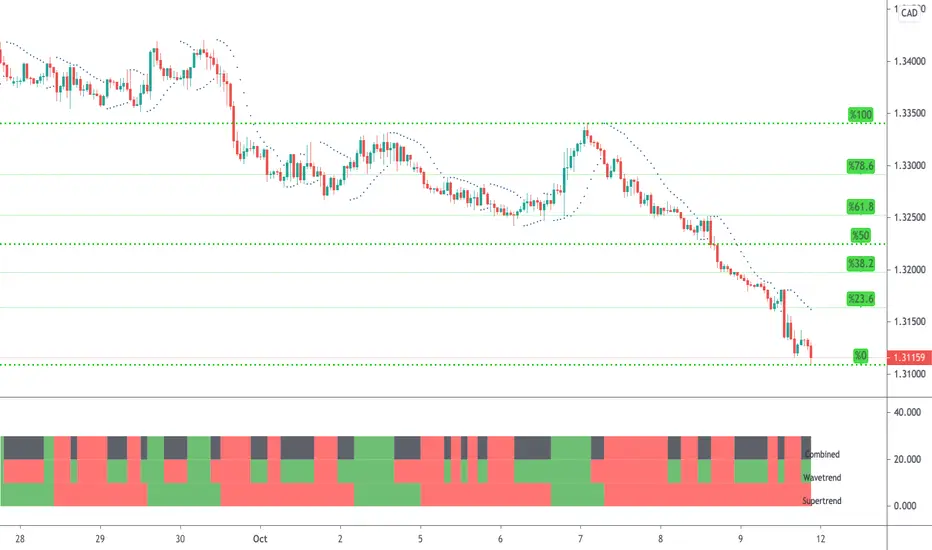
WaveTrend & Supertrend Comparison/CombinedThis compares two reasonably reliable strategies and shows where they are in agreement.
When the top line is GREEN - Then consider BUYing
When the top line is RED - Then consider SELLing
There are also alerts available.
WaveTrend with Crosses [LazyBear]Optical Change
Source from LazyBear
With big Hugs for this Indicator

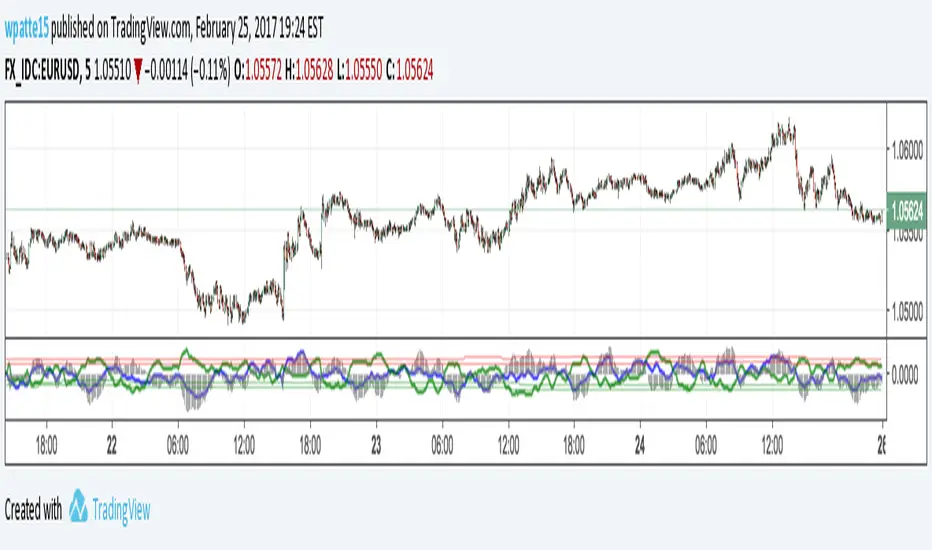
WaveTrend and Crossing EMA of RSIs by AlhazenLazyBear's WaveTrend Oscilator is simplified, and buy & sell signals are added. Green bars indicate SELL signal of WT, and Maroon bars indicate BUY signal of WT.
A new indicator added: Crossing EMA of two RSI's. RSI plots are shown with dotted lines. Lime bars indicate SELL signal of RSI, and Red bars indicate BUY signal of RSI.
You can combine WT and RSI together and decide to BUY or SELL.

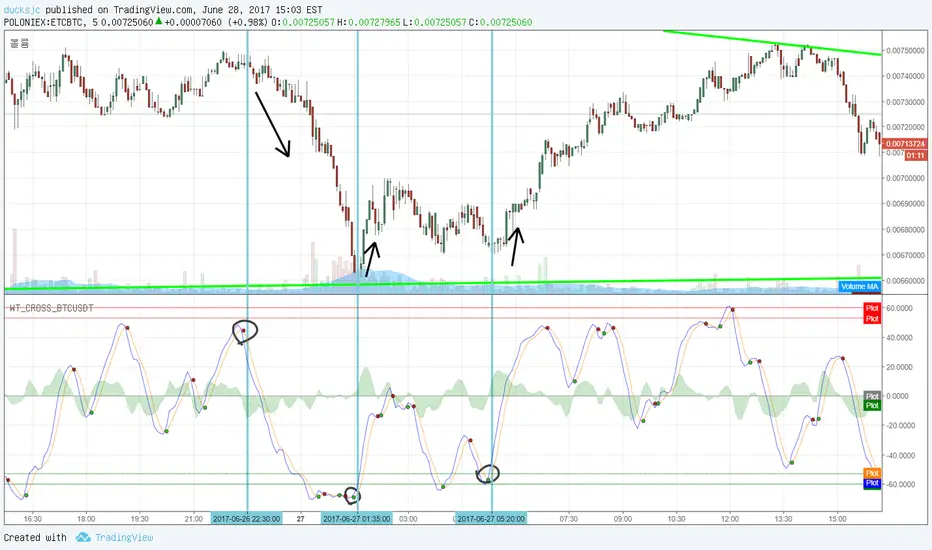
WaveTrend cross only BTCUSDT 1
The price of all altocons is affected by bit coin.
so, I made it. it show BTCUSDT WaveTrend only.
This chart is ETCBTC, and you can see the ETC price fallow BTC price after 5 minutes.
so amazing?
Pair Strength EURUSDThis is an application of the WaveTrend indicator by LazyBear against a basket of the eur and usd to come up with a total eur and usd wt value. You can change the currencies by altering which pairs its run on. As far as changes I removed the lagging 4sma and altered the OB OS to be 2 and 3 standard deviations from a 1000sma just to get a stable view as to where the values tend to rise to. I've had some success using it over the past week or so, when dollar is OB an euro is OS you can expect EURUSD to go up as those reverse and vice versa.
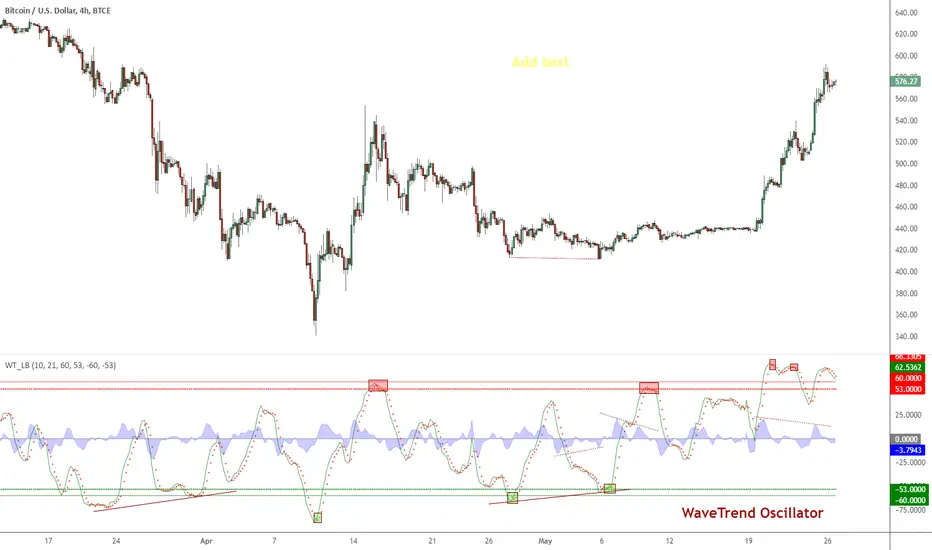
Indicator: WaveTrend Oscillator [WT]WaveTrend Oscillator is a port of a famous TS/MT indicator.
When the oscillator is above the overbought band (red lines) and crosses down the signal (dotted line), it is usually a good SELL signal. Similarly, when the oscillator crosses above the signal when below the Oversold band (green lines), it is a good BUY signal.
I have marked some cross-overs in the above chart. As you can see, they are *not* the only useful signals WT generates. Try it on your instrument and let me know what you think.