SAYO Zones📄 Description
🔹 SAYO Zones is a clean and objective trading tool designed for swing traders and day traders, suitable for stocks, crypto, and futures markets.
🔹 The indicator automatically maps dynamic Fibonacci-based price zones and combines them with momentum timing to help traders focus only on high-quality areas of interest.
🔹 It works on all timeframes, from intraday charts to higher timeframe swing setups.
🔹 This tool is not a signal generator by itself. 🔹 It is a decision-support indicator built to improve clarity, patience, and execution.
🔍 What SAYO Zones Does
🔹 Automatically calculates dynamic Fibonacci ranges 🔹 Highlights key price zones where reactions are statistically more likely 🔹 Filters out low-quality trades by identifying no-trade (blue) zones 🔹 Combines WaveTrend structure with Stochastic momentum for timing 🔹 Designed to work on all markets and all timeframes, including futures
🎯 Core Concept
🔹 Markets move in ranges. 🔹 Not every level is worth trading.
🔹 SAYO Zones helps you: 🔹 Focus only on meaningful price areas 🔹 Avoid entries inside low-probability zones 🔹 Align structure and momentum for better entries 🔹 The goal is clarity over frequency.
🧭 How to Use
🔹 SAYO Zones is built as an advanced trading methodology, while remaining clear and accessible for beginners. 🔹 The indicator provides visual arrows when specific structural and momentum conditions align.
🔹 How to approach a trade: 🔹 Wait for price to reach a meaningful zone 🔹 Avoid trades inside blue zones 🔹 When an arrow appears, it signals that structure and momentum are aligned 🔹 Use momentum confirmation to validate the setup
🔹 Once confirmed: 🔹 Define your stop loss based on structure or zone boundaries 🔹 Define your take profit according to your risk-to-reward plan 🔹 Execute the trade based on your strategy rules
🔹 The arrows are not meant to be followed blindly. 🔹 They are execution signals designed to help you act only when conditions are favorable. 🔹 This approach encourages discipline, patience, and structured risk management.
📈 Best Use Cases
🔹 Swing trading stocks 🔹 Day trading stocks 🔹 Swing trading crypto 🔹 Day trading crypto 🔹 Futures trading (index, commodities, and crypto futures) 🔹 All timeframes: 5m, 15m, 1H, 4H, Daily 🔹 Range, pullback, and structure-based strategies
⚠️ Important Notes
🔹 SAYO Zones is not a buy or sell guarantee 🔹 No indicator predicts the future 🔹 Always apply proper risk management 🔹 Best results come from combining this tool with a complete trading plan
🧠 Why SAYO Zones
🔹 Most indicators show too much information. 🔹 SAYO Zones is designed to show only what matters. 🔹 Whether you are a beginner learning structured trading, or an advanced trader refining execution, this tool helps you trade with more confidence and consistency.
🔔 Alerts
🔹 Custom alerts are included to notify you when potential conditions align, allowing you to stay focused without watching the chart continuously.
📌 Final Thought
🔹 SAYO Zones is not about trading more. 🔹 It is about trading better.
Search in scripts for "WaveTrend"

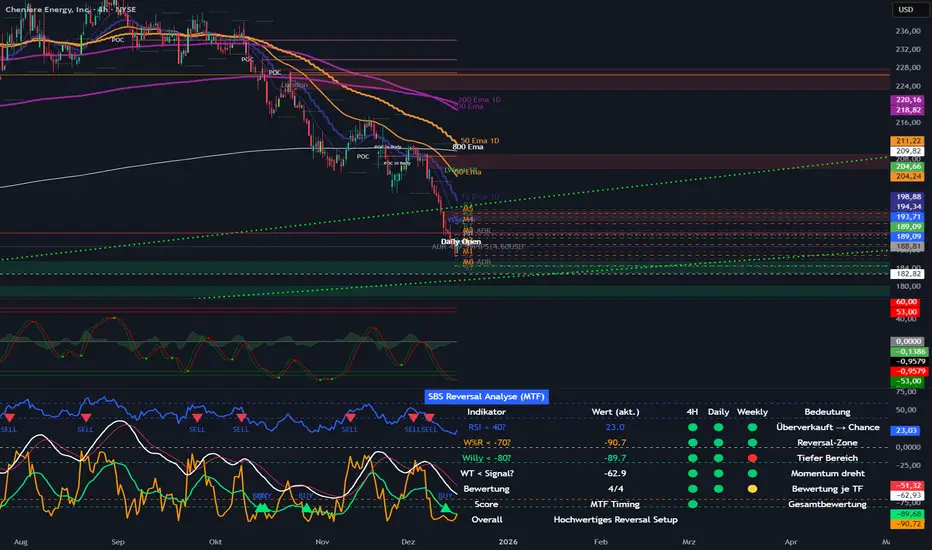
SBS Reversal Engine MTFSBS Reversal Engine (MTF) is a professional multi-timeframe indicator designed to identify high-quality reversal zones across stocks, crypto, and indices.
It combines RSI, Williams %R, a smoothed Williams oscillator ("Willy"), and a proprietary WaveTrend momentum filter to evaluate market conditions across 4H, Daily, and Weekly timeframes.
A visual traffic-light system provides a clear overview of oversold conditions, momentum shifts, and multi-timeframe alignment.
The integrated MTF Score System helps traders focus on high-quality setups where market structure, context, and timing align.
This indicator is an analytical tool and does not constitute financial advice.
© Step Buy Step 2025 – All rights reserved
All-in-One Momentum Composite The Four Components (and Why They're Chosen)
RSI (Relative Strength Index) – Classic overbought/oversold oscillator (14-period default). Measures speed and change of price movements.
Stochastic (%D line) – Smoothened momentum indicator that compares closing price to the price range over a period. Excellent at spotting reversals in ranging markets.
WaveTrend – Very popular in crypto and forex communities (originally by LazyBear). It’s essentially a momentum oscillator based on overbought/oversold channels, similar to a faster, smoother RSI/Stochastic hybrid. Known for early divergence signals and clean crossovers.
MACD Histogram – Captures momentum changes and trend strength via the difference between fast and slow EMAs. The histogram shows acceleration/deceleration.

Erva & nur (stoch rsi)This script builds a custom oscillator that combines WaveTrend, RSI and Stochastic RSI to analyze momentum and overbought/oversold zones.

LPC Rebate HunterLPC Rebate Hunter Version 1.3.5
From Static to Dynamic Momentum: Replaced the rigid RSI filter with a Multi-Engine Oscillator (WaveTrend, MFI, or RSI), allowing for smoother cycle detection.
From "Pivots" to "Smart Structure": The liquidity engine now detects Swing Failure Patterns (SFP)—identifying when price "pokes" a level to trap traders before reversing—and automatically cleans up mitigated zones.
Choppy Market Protection: Added an ADX (Average Directional Index) integration to strictly filter out signals during flat/sideways markets.
Risk Management Layer: Introduced a Smart Trailing Stop (ATR-based Chandelier Exit) to help traders manage active positions objectively.
Visual Overhaul: Features a modern gradient trend cloud and a fully adaptive "Heads-Up Display" (HUD) that provides real-time market stats.

QLC v8.4 – GIBAUUM BEAST + ANTI-FAKEOUTQLC v8.4 – GIBAUUM BEAST + ANTI-FAKEOUT
QLC v8.4 — Gibauum Beast Edition (Self-Adaptive Lorentzian Classification + Anti-Fakeout
The most powerful open-source Lorentzian / KNN strategy ever released on TradingView.
Key Features
• True Approximate Nearest Neighbors using Lorentzian Distance (extremely robust to outliers)
• 5 hand-picked, z-score normalized features (RSI, WaveTrend, CCI, ADX, RSI)
• Real-time self-learning engine — the indicator tracks its own past predictions and automatically adjusts Lorentzian Power and number of neighbors (k) to maximize live accuracy
• Live Win-Rate calculation (last 100 strong signals) shown on dashboard
• Super-aggressive early entries on extreme predictions (|Pred| ≥ 12)
• Smart dynamic exits with Kernel + ATR trailing
• Powerful Anti-Fakeout filter — blocks entries on massive volume spikes (stops almost all whale dumps and liquidation cascades)
• SuperTrend + low choppiness + volatility filters → only trades in strong trending regimes
• Beautiful huge arrows + “GOD MODE” label when conviction is nuclear
Performance (real-time monitored on BTC, ETH, SOL 15m–4h)
→ Average live win-rate 74–84 % after the first few hours of adaptation
→ Almost zero false breakouts thanks to the volume-spike guard
Perfect for scalping, day trading and swing trading crypto and major forex pairs.
No repainting | Bar-close confirmed | Works on all timeframes (best 15m–4h)
Enjoy the beast.

Rubotics BolleWilly Rubotics BolleWilly Signal Engine (Rubots BW)
This closed-source system fuses volatility expansion, band-reversion patterns, and Williams %R momentum shifts into a unified signal engine. Instead of merely combining common indicators, the BolleWilly model creates a custom interaction between Bollinger Band pressure and momentum exhaustion, allowing traders to identify potential reversal points directly on the price chart.
This is a signal model, not a full strategy, and is intended for discretionary use or as a modular input inside automated systems such as the Rubotics EA.
Core Components and Unique Features
Volatility Compression & Expansion (Bollinger Logic)
The indicator detects when price pushes outside the Bollinger structure and then snaps back inside.
This volatility expansion → reversion behavior acts as the foundational “energy release” condition for the system.
Williams %R Momentum Module
The script measures Williams %R and an EMA-smoothed version of it.
A valid signal requires:
* A %R crossover through its EMA
* A clear momentum reversal confirmation
* Proper alignment with the band-reversion condition
This filters out weak band touches and focuses on genuine directional shifts.
Band-Breach Lookback Window
A configurable lookback (default: 1 bar) verifies whether nearby candles breached the upper or lower Bollinger Band.
This ensures signals only occur after actual volatility expansion, not random drift.
Optional Candle Confirmation
You can require:
* Bullish candle for Buy signals
* Bearish candle for Sell signals
This helps remove signals during indecisive or doji-like bars.
Optional WaveTrend Exhaustion Filter
An additional WT2 layer (disabled by default) can be activated to confirm true exhaustion zones:
* WT oversold → allow long signals
* WT overbought → allow short signals
This strengthens signal quality in choppy or extended markets.
Signal Generation
A Buy signal requires:
1. Price re-enters the Bollinger structure after breaching below
2. Williams %R crosses upward through its EMA
3. (Optional) Candle is bullish
4. (Optional) WT2 confirms oversold exhaustion
5. Location is inside the volatility envelope
A Sell signal requires the mirrored conditions.
Signals appear as chart-based arrows and can be used for EA integration, discretionary confirmation, or execution filters.
Customization and Originality
* Every component (Bands, %R, EMA smoothing, WT filters, candle rules, lookback logic) is user-adjustable
* You can enable/disable entire modules to tune the model for different markets
* The logic is not a mash-up; it’s a sequenced interaction of volatility, momentum, and exhaustion filtering
* This makes the BolleWilly system fundamentally different from standard indicators
Closed-Source Justification
This script uses proprietary logic for its reversal-detection process and multi-layered filter sequencing.
Although the description fully explains how the concepts work, the underlying implementation remains part of the internal Rubotics framework — therefore the script is closed-source in accordance with TradingView rules.
This tool is not financial advice and is provided strictly for analytical and educational purposes.

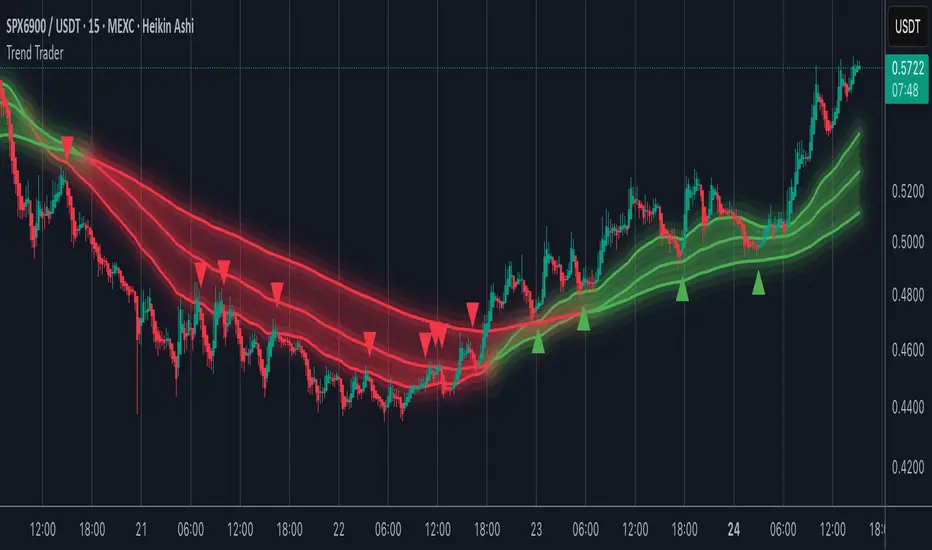
Trend TraderMost trend indicators don’t offer continuation signals or accurate bounce points, so I created this indicator that uses one of the most common trading levels (EMAs). This indicator uses the 50, 100, and 200 EMAs along with WaveTrend signals to trade trends. Buy Signals are filtered so that they only show up when the 100 EMA is above the 200. And Inverse for Sell Signals.
This indicator works well with both Stocks and Crypto. Default settings work best on 15 min, 1H, 2H, and 4H.
(Chart examples are using Heikin Ashi Candles, on Log Scale.)
*Buy and Sell Signals do not repaint.
Settings:
- Ability to show all buy and sell signals regardless of trend.
- To change the sensitivity of the buy and sell signals, change the “Average Length”
- (The lower the number the more sensitive, the higher the number the less they pop up)
- Ability to change EMA Lengths
imgur.com
Hyper MACDThe Hyper MACD is a customizable momentum indicator exclusively designed for Scalping that blends traditional MACD logic with dynamic signal coloring, overbought/oversold detection, and WaveTrend overlays. It supports multiple moving average types and highlights key momentum shifts with visual markers and alerts.
The settings/alerts are self explanatory and are optimized for quick scalping, works for any timeframe.
Suggested rules are.
The MACD line and Signal line must be above the zero line to scalp
The price begins do decay when the Signal turns from white to orange, however if both the lines are above zero line, then its still game to scalp but cautiously.
The colors are telling on both the lines, blue indicates a bullish surge on both and green on macd and white on signal suggests the bullish trend continuation
It also prints take profit arrows along the way, and also possible trend reversals.

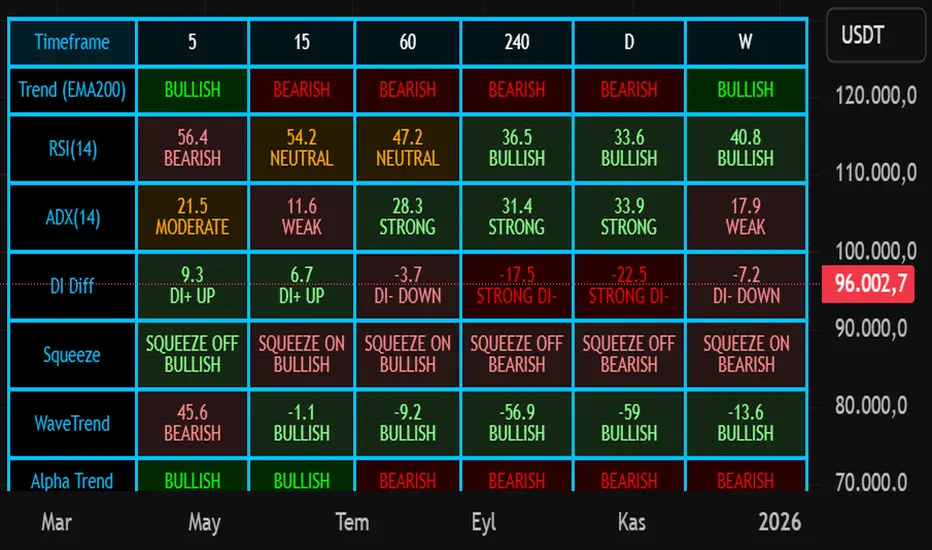
Nuh's Multi-Timeframe DashboardAll 10 indicators (EMA, RSI, ADX, RI, Squeezee, WaveTrend, Alpha Trend, SuperTrend, Stoch RSI, Vix Fix) across 7 time frames (5m, 15m, 1h, 2h, 4h, 1D, 1W) consolidated into a single table.
Cipher B Free | WaveTrend (v6)Uh.. I call this.. Mona Lisa kek. Tried creating my own version of Cipher B with Grok. Feel free to tweak to your heart's content

Hello Crypto! Modern Combo Snapshot
Unified long/short analyzer blending EMA structure, SuperTrend, WaveTrend, QQE, and volume pressure.
Background shading flags “watch” and “ready” states; optional long/short modules let you focus on one side.
Alerts fire when every checklist item aligns, while the side-panel table summarizes trend, momentum, liquidity, and overall score in real time.
Indicator → Trend Analysis
Indicator → Momentum Oscillators
Indicator → Volume Indicators
Tags:
cryptocurrency, bitcoin, altcoins, trend-following, momentum, volume, ema, supertrend, intraday, swing-trading, alerts, checklist, trading-strategy, risk-management

Modern Combo Crypto SuiteBlends long and short playbooks in one overlay with quick toggles.
Tracks EMA stacks, SuperTrend, WaveTrend, QQE, and volume to score bias.
Colors the chart background when watch/ready conditions align.
Fires alerts for imminent or fully aligned long/short setups.
Displays a live checklist table summarizing trend, momentum, and volume confidence.

Buy - Sell indicatorKey Features:
🎯 Multi-Indicator Signal System
Parabolic SAR + CCI (Commodity Channel Index) combination
Bollinger Bands with customizable smoothing
DEMA (Double Exponential Moving Average) trend confirmation
WaveTrend Cross oscillator
📊 Smart Trend Detection
EMA-based trend filter (21/50 periods)
Strong trend tracking with consecutive rise counter
Dynamic trailing stop mechanism
Volume surge detection for momentum confirmation
📈 Advanced Entry/Exit Logic
Fibonacci-based decline ratio filter (prevents premature entries)
Second bottom confirmation for safer entries
Dynamic sell levels that adapt to strong trends
Automatic pivot high/low detection
💰 DCA (Dollar Cost Averaging) System
Automatic DCA level plotting on 9/3 signal combinations
Customizable buy levels (-0.6%, -0.94% default)
Customizable sell targets (+0.85%, +1.5% default)
Visual price lines extending 50 bars forward
⚙️ Customizable Filters
Minimum bar spacing between signals (default: 20)
Volume filter with adjustable multiplier
Toggle for trend filters and hidden signal display
Separate controls for EMA lines, ratio info, and trend info
📋 Comprehensive Info Table
Real-time indicator values
Current trend status
DCA trigger status
Rally/decline ratio tracking
Last buy/sell prices
Best Used For:
Swing trading on 4H-1D timeframes
Cryptocurrency and volatile assets
Catching reversals at Bollinger Band extremes
Managing positions with predefined DCA levels
Alerts Available:
Buy signal alerts
Sell signal alerts
DCA 9/3 combination alerts

Turtle Body Setup by TradeTech AnalysisOverview
Turtle Body Setup is a minimalist, rules-based pattern detector built around a simple idea: a sequence of shrinking candle bodies (compression) often precedes a directional expansion (breakout). The script identifies those compression phases and then flags the first candle whose body expands significantly beyond the recent average, with polarity taken from the candle’s direction.
This is not a mash-up of many public indicators. It focuses on one original micro-structure concept: strict body-contraction → body-expansion . The logic is fully described below so traders and moderators can understand what it does and how to use it.
How it Works
1. Compression detection (body contraction):
• Over a user-defined window Compression Lookback (N), the script counts strictly shrinking candle bodies (|close-open|).
• When the count ≥ Min Shrinking Candles, we mark the market as in compression.
2. Expansion / Breakout qualification:
• Compute avgBody = SMA(body, N).
• A candle is a breakout when current body > avgBody × Breakout Body Multiplier.
• Polarity: green (close>open) → Bullish breakout; red (close

VSOVSO
This is similar to LazyBear's WaveTrend oscillator but handles momentum calculation differently and has some extra components for trade analysis.
The oscillator calculates an adaptive mean, then measures how far price deviates from that mean. Instead of just looking at raw deviation, it normalizes this by dividing by smoothed absolute deviation values.
The key difference is how it separates momentum - it splits the deviation into positive (up) and negative (down) components, then applies directional strength smoothing to each separately before combining them:
100 * (up_strength - down_strength) / (up_strength + down_strength)
This directional strength calculation gives more weight to sustained moves in either direction rather than just price volatility. The result is the main Momentum Wave oscillating between -100 and +100. The Signal Wave is just a smoothed version of this. The Momentum Gap shows the difference between them.
You'll see the Momentum Wave as a colored area/line with four color states, the Signal Wave as a white area, the Momentum Gap as a yellow line, the Drip Rate as cyan/purple area, and Velocity as a colored line at the bottom. The overbought/oversold zones are shaded, volatility bands adapt to current conditions, and major/minor signals show up as circles when the waves cross.
For trading, the Drip Rate is your long-term signal for bigger shifts. When it makes lower lows into resistance, look for reversals. Works great across multiple timeframes. Volatility squeezes signal big moves coming - use these with support/resistance and divergences. Top/bottom signals show momentum shifts and usually lead to pumps or drops.
Velocity shows breakout speed or rejections. Higher readings mean faster moves, regardless of direction. Wave colors reveal continuation patterns - green to purple to green means strong continuation up, red to cyan to red means continuation down.
The Momentum Gap can signal divergence on its own. The angle it crosses zero often hints at how fast the next move will be. When momentum goes outside the volatility bands, watch the next wave for divergence or confirmation.
Works best when you combine the Drip Rate across timeframes with squeeze setups and color changes for high-probability entries.
Works well with Heikin Ashi candles, or use the smoothed candle mode in the settings to mimic them. You can set the candle colors to the momentum wave colors as well, it can be helpful.
Here is a trade setup and how you can use it to take trades.

SulLaLuna — HTF M2 x Ultimate BB (Fusion) 🌕 **SulLaLuna — HTF M2 x Ultimate BB (Fusion)** 🚀💵
**By SulLaLuna Trading**
(Portions of the Bollinger Band logic adapted with permission/credit from the *Ultimate Buy & Sell Indicator* by its original author — thank you for the brilliance!)
---
🧭 **What This Is**
This is not just another price-following tool.
This is **a macro liquidity detector** — a **Daily Higher Timeframe Hull Moving Average of the Global M2 Money Supply**, smoothed via lower timeframe candles (default 5m, 48 Hull length), overlaid with **Ultimate-style double Bollinger Bands** to reveal *over-extension & mean reversion zones*.
It doesn’t chase candles.
It watches the tides beneath the market — the **money supply currents** that have a **direct correlation** to asset price behavior.
When liquidity expands → risk-on assets tend to rise.
When liquidity contracts → risk-off waves hit.
We ride those waves.
---
🔍 **What It Does**
* **Tracks Global M2** across major economies, FX-adjusted, and scales it to your chart’s price.
* **HTF Hull MA** (Daily, smoothed via 5m base) → gives you the macro liquidity trend.
* **Ultimate BB logic** applied to the HTF M2 Hull → inner/outer bands for volatility envelopes.
* **Pivot Labels** → ideal entry/exit zones on macro turns.
* **Over-Extension Alerts** → when HTF M2 Hull pushes outside the outer bands.
* **Re-Entry Alerts** → mean reversion triggers when liquidity moves back inside the range.
* **Background Paint** from chart TF M2 slope → for confluence on your entry timeframe.
---
📜 **Suggested How-To**
1. **Choose your execution chart** — e.g., 1–15m for scalps, 1H–4H for swings.
2. **Use the background paint** as your *local tide check* (chart TF M2 slope).
3. **Trade in the direction of the HTF M2 Hull** — green line = liquidity rising, red line = liquidity falling.
4. **Watch pivot labels** — these are potential “macro inflection” points.
5. **Confluence stack** — pair with ZLSMA, WaveTrend divergences, VWAP volume, or your favorite price-action setups.
6. **Size down** when HTF M2 Hull is flat/gray (chop zone).
7. **Scale in/out** on over-extension + re-entry alerts for higher probability swings.
---
⚠️ **Important Note**
This indicator **does not predict price** — it tracks macro liquidity flows that *influence* price.
Think of it as your market’s **tide chart**: when the water’s coming in, you can swim out; when it’s going out, you’d better be ready for the undertow.
---
📢 **Alerts Available**
* HTF Pivot HIGH / LOW
* Over-Extension (HTF Hull outside outer BB)
* Re-Entry (return from overbought/oversold)
---
🤝 **Join the SulLaLuna Tribe**
If this indicator helps you capture better entries, follow & share so more traders can learn to trade *math, not emotion*.
We rise together — **and we’ll meet you on the Moon** 🌕🚀💵.

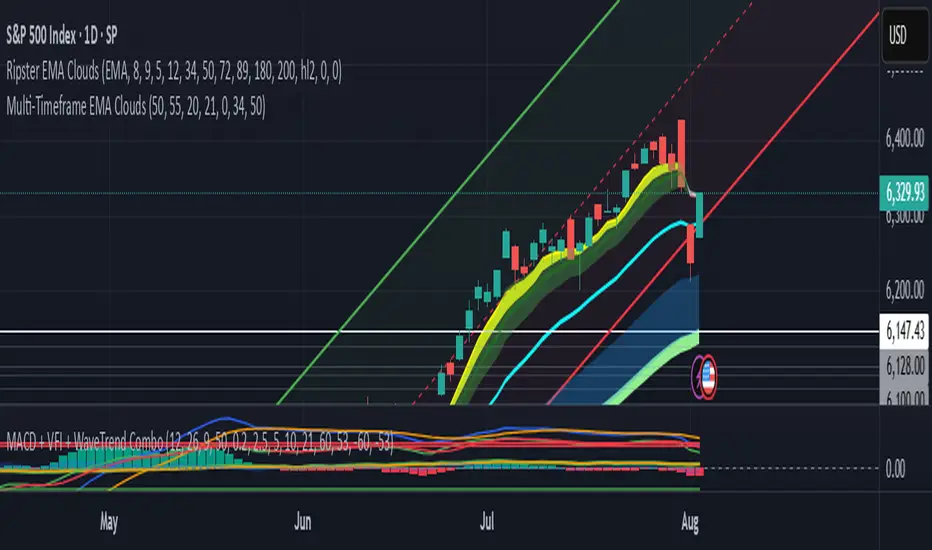
Divergence TridentA Combination of MACD + VFI + WaveTrend
Tradingview hates me and is making me explain this in greater detail so maybe this is enough????
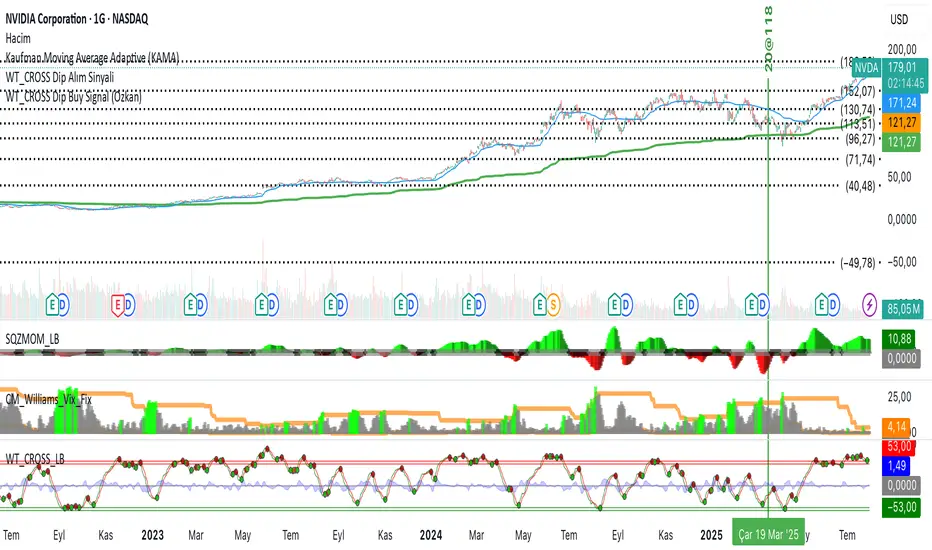
WT_CROSS Dip Buy Signal(ozkan)This script identifies potential buy opportunities based on WaveTrend (WT_CROSS) momentum crossing below the -60 level — often indicating oversold conditions.
Additional filters include price being above the Kaufman Adaptive Moving Average (KAMA) and volume below the 5-period average, which helps isolate pullbacks within an uptrend.
Buy Signal Conditions:
WT1 < -60
Price > KAMA
Volume < 5-period SMA of volume
Purpose:
To capture early entries at possible local bottoms during bullish trends while avoiding high-volume breakdown traps.
🔔 You can also set an alert based on this condition.
S/R with Multi-Indicator ConsensusThis script identifies key support and resistance levels by analyzing consensus across multiple technical indicators. Here's how it works:
Core Concept
The script monitors 14 different technical indicators simultaneously, looking for areas where most indicators agree on potential reversal points. When a strong consensus emerges (over 60% agreement by default), it marks these price levels as significant support or resistance zones.
Indicator Analysis
The script uses an advanced "harmonic convergence" technique that examines:
Momentum indicators (RSI, Stochastic, Williams %R)
Volume-based indicators (OBV, MFI)
Trend indicators (MACD, WaveTrend)
Volatility measures (ATR, Bollinger Bands)
Special proprietary oscillators (RVI, Ultimate Oscillator)
Each indicator is normalized to a 0-100 scale for consistent comparison. The script then applies a "quantum weighting" algorithm that gives more importance to indicators showing extreme readings.
Support/Resistance Identification
When multiple indicators simultaneously reach overbought or oversold conditions near the same price level, the script:
Records these "harmonic convergence points"
Applies volume-based weighting (heavier volume = stronger level)
Uses time decay to fade older, less relevant levels
Groups nearby levels using a proprietary "price magnetism" algorithm
Visual Features
Colored Lines: Red for resistance, green for support
Line Styles: Solid (strong), dashed (medium), dotted (weak)
Dynamic Width: Thicker lines indicate stronger consensus
Info Labels: Show price, strength percentage, and touch count
Info Table: Displays key statistics in the corner
In this script, "Consensus Type" refers to whether the majority of indicators are signaling a potential support (oversold) or resistance (overbought) level.
How It Works:
The script checks multiple normalized indicators (RSI, Stochastic, MACD, OBV, etc.) to see if they are in overbought (OB) or oversold (OS) zones.
It calculates a consensus score (0% to 100%) based on how many indicators agree:
Type = 1 → Most indicators are in overbought (resistance likely).
Type = -1 → Most indicators are in oversold (support likely).
Type = 0 → No clear consensus (neutral).
The strength of the signal depends on the consensus score (higher = stronger level).
Example:
If RSI, Stochastic, and MACD are all in overbought territory (above ob_threshold), the script detects a Type 1 (Resistance).
If Williams %R, CCI, and OBV are oversold (below os_threshold), it detects a Type -1 (Support).
Why It Matters:
Helps traders identify high-probability reversal zones.
Filters out weak levels where indicators don’t agree.
Works alongside volume weighting & time decay to prioritize the strongest S/R levels.
The Info Table in the top-right corner shows the current Consensus Type (1, -1, or 0) and its strength (e.g., 75% means 75% of indicators agree on resistance/support).

Macd, Wt Cross & HVPMacd Wt Cross & HVP – Advanced Multi-Signal Indicator
This script is a custom-designed multi-signal indicator that brings together three proven concepts to provide a complete view of market momentum, reversals, and volatility build-ups. It is built for traders who want to anticipate key market moves, not just react to them.
Why This Combination ?
While each tool has its strengths, their combined use creates powerful signal confluence.
Instead of juggling multiple indicators separately, this script synchronizes three key perspectives into a single, intuitive display—helping you trade with greater clarity and confidence.
1. MACD Histogram – Momentum and Trend Clarity
At the core of the indicator is the MACD histogram, calculated as the difference between two exponential moving averages (EMAs).
Color-coded bars represent momentum direction and intensity:
Green / blue bars: bullish momentum
Red / pink bars: bearish momentum
Color intensity shows acceleration or weakening of trend.
This visual makes it easy to detect trend shifts and momentum divergence at a glance.
2. WT Cross Signals – Early Reversal Detection
Overlaid on the histogram are green and red dots, based on the logic of the WaveTrend oscillator cross:
Green dots = potential bullish cross (buy signal)
Red dots = potential bearish cross (sell signal)
These signals are helpful for identifying reversal points during both trending and ranging phases.
3. Historical Volatility Percentile (HVP) – Volatility Compression Zones
Behind the histogram, purple vertical zones highlight periods of low historical volatility, based on the HVP:
When volatility compresses below a specific threshold, these zones appear.
Such periods are often followed by explosive price moves, making them prime areas for pre-breakout positioning.
By integrating HVP, the script doesn’t just tell you where the trend is—it tells you when the trend is likely to erupt.
How to Use This Script
Use the MACD histogram to confirm the dominant trend and its strength.
Watch for WT Cross dots as potential entry/exit signals in alignment or divergence with the MACD.
Monitor HVP purple zones as warnings of incoming volatility expansions—ideal moments to prepare for breakout trades.
Best results occur when all three elements align, offering a high-probability trade setup.
What Makes This Script Original?
Unlike many mashups, this script was not created by simply merging indicators. Each component was carefully integrated to serve a specific, complementary purpose:
MACD detects directional bias
WT Cross adds precision timing
HVP anticipates volatility-based breakout timing
This results in a strategic tool for traders, useful on multiple timeframes and adaptable to different trading styles (trend-following, breakout, swing).

Sigma 2.0 - Advanced Buy and Sell Signal IndicatorOverview:
Sigma 2.0 is a sophisticated trading indicator designed to help traders identify potential buy and sell opportunities across various financial markets. By leveraging advanced mathematical calculations and incorporating multiple analytical tools, Sigma 2.0 aims to enhance trading strategies by providing precise entry and exit signals.
Key Features:
Advanced Sigma Calculations:
Utilizes a combination of Exponential Moving Averages (EMAs) and price deviations to calculate the Sigma lines (sigma1 and sigma2).
Detects potential trend reversals through the crossover of these Sigma lines.
Customizable Signal Filtering:
Offers the ability to filter buy and sell signals based on user-defined thresholds.
Helps reduce false signals in volatile markets by setting overbought and oversold levels.
Overbought and Oversold Detection:
Identifies extreme market conditions where price reversals are more likely.
Changes the background color of the chart to visually indicate overbought or oversold states.
Integration of Exponential Moving Averages (EMAs):
Includes EMAs of different lengths (10, 21, 55, 200) to assist in identifying market trends.
EMAs act as dynamic support and resistance levels.
Higher Timeframe Signal Incorporation:
Allows users to include signals from a higher timeframe to align trades with the broader market trend.
Enhances the reliability of signals by considering multiple timeframes.
Custom Alerts:
Provides alert conditions for both buy and sell signals.
Enables traders to receive notifications, ensuring timely decision-making.
How It Works:
Sigma Calculation Methodology:
The indicator calculates an average price (ap) and applies EMAs to derive the Sigma lines.
sigma1 represents the smoothed price deviation, while sigma2 is a moving average of sigma1.
A crossover of sigma1 above sigma2 generates a buy signal, indicating potential upward momentum.
Conversely, a crossover of sigma1 below sigma2 generates a sell signal.
Signal Filtering and Thresholds:
Users can enable filtering to only consider signals when sigma1 is below or above certain thresholds.
This helps in focusing on more significant market movements and reducing noise.
Overbought/Oversold Levels:
The indicator monitors sigma1 to detect when the market is in extreme conditions.
Background color changes provide a quick visual cue for these conditions.
EMA Analysis:
The plotted EMAs help in confirming the trend direction.
They can be used alongside Sigma signals to validate trade entries and exits.
Higher Timeframe Signals:
Incorporates signals from a user-selected higher timeframe.
Helps in aligning trades with the overall market trend, increasing the potential success rate.
How to Use:
Adding the Indicator to Your Chart:
Search for "Sigma 2.0" in the TradingView Indicators menu and add it to your chart.
Configuring the Settings:
Adjust the Sigma configurations (Channel Length, Average Length, Signal Line Length) to suit your trading style.
Set the overbought and oversold levels according to your risk tolerance.
Choose whether to filter signals by thresholds.
Select the higher timeframe for additional signal confirmation.
Interpreting the Signals:
Buy Signals:
Indicated by a green triangle below the price bar.
Occur when sigma1 crosses above sigma2 and other conditions are met.
Sell Signals:
Indicated by a red triangle above the price bar.
Occur when sigma1 crosses below sigma2 and other conditions are met.
Higher Timeframe Signals:
Plotted with lime (buy) and maroon (sell) triangles.
Help confirm signals in the current timeframe.
Utilizing EMAs:
Observe the EMAs to gauge the overall trend.
Consider aligning buy signals when the price is above key EMAs and sell signals when below.
Setting Up Alerts:
Use the built-in alert conditions to receive notifications for buy and sell signals.
Customize alert messages as needed.
Credits:
Original Concept Inspiration:
This indicator is inspired by the WaveTrend oscillator and other momentum-based indicators.
Special thanks to the original authors whose work laid the foundation for this enhanced version.
Disclaimer:
Trading involves significant risk, and past performance is not indicative of future results.
This indicator is a tool to assist in analysis and should not be the sole basis for any trading decision.
Always perform thorough analysis and consider multiple factors before entering a trade.
Note:
Ensure your chart is clean and only includes this indicator when publishing.
The script is open-source and can be modified to fit individual trading strategies.
For any questions or support, feel free to reach out or comment.

AWR_WaveTrend Multitimeframe [adapted from LazyBear]I've adapted a script from Lazy Bear (WT trend oscillator)
WaveTrend Oscillator is a port of a famous TS/MT indicator.
When the oscillator (WT1 designed as a line) is above the overbought band (50 to 60) and crosses down the WT2 (dotted line), it is usually a good SELL signal. Similarly, when the oscillator crosses above the signal when below the Oversold band ( (-50 to -60)), it is a good BUY signal.
In this indicator, you can display at the same time, different time frames.
Choice possible are 1 mn, 15 mn, 30 mn, 60 mn, 120 mn, 240 mn, 1D, Week, Month.
Small time frames (1 to 30 mn) are represented by a blue lines (light to dark)
1H is in grey
2H & 4H are in purple (light to dark)
1D is in green
1W is in orange
1M is in black
You can choose which timeframes you want to display for the current period or for the last period closed.
In a few seconds, you perfectly see the selected timeframes trends.
There is also at the bottom right a table summing up all the different values of WT1, WT2 and difference between them.
Positive difference means an upside trend
Negative difference means a downside trend.
Another way of using this indicator is displaying only the difference between WT1 & WT2. It's giving the speed & the direction of all trends. Trends are our friends ...
You can observe the significent times frames and look if they are all positives or negatives or if the speed of lower timeframe cross a longer timeframe of if the speed is decreasing or increasing...
Difference values goes generaly from -20 to 20 (it can exceed a bit but really rare). 12 is already high level of speed.
Many uses possible.
In the exemple posted, I've selected WT1 and WT2 for timeframes 4H, Daily & Weekly.
Marker 1:
Orange lines (WT1) are far below - 50 (-67 here) and cross WT2 pointed lines : weekly buy signal
But this buy signal is balanced by 4H & Daily sell signal = it's marking start of hesitations of main trend !!!!
Marker 2 :
Next buy signal in 4H or daily would normaly confirm the start
Marker 3 :
Sell signal in 4H and daily but weekly has an upside trend ! Start of a counter trend in the trend. To find the perfect timing of that you have to look to lower time frames, because 4H and daily are giving many hesitations signals crossing down & crossing up many times in an overbought zone.
Marker 4 :
End of the counter trend. Most of the time, the countertrend don't go in the "over" zone. That's why if you trading in an counter trend, you have to keep it in mind.
Then a few days later you can see the sell signal. And what a sell signal ! 4H & daily are smashed down really fastly ! Trends change warning !
Marker 5
Long hesitation/change of the trend. Daily WT and 4H are below the weekly trends. Weekly start to go down.
Start of a counter trend inside the trend giving us the best selling signal at her end !
Marker 6 :
Long hesitation/change of the trend.
You have to look in lower time frames to identify the short trend. Difficult to find the best timing to get in. ....
I've add many alerts. When a time frame become positive or negative. When many time frames are positive or negative or above or below 47 level...
Please feel free to explore.
Hope it will help you.
Thanks to Lazybear ! Thousands thanks to Lazybear !
Exemple with difference
