Gap-Up Momentum Screener (S.S)
ENGLISH-VERSION
1) TradingView Gap Screener (for US stocks)
➤ Conditions
Gap-Up ≥ +3% (large gaps indicate institutional pressure)
Pre-market volume ≥ 150% of the 20-day average
RS line > 50
Price > 50 SMA
Market cap ≥ 1 billion USD
No penny stocks
2) Minervini Gap-Entry Strategy (Swing Trading)
This is a variant specifically optimized for gaps + momentum.
A) Setup Criteria
The stock must meet the following conditions:
Gap-Up ≥ +3%
First retracement ≤ 30% of the gap
High relative strength (RS line rising)
Volume on the gap day > 2× average
Price above 20 EMA, 50 SMA, 150 SMA, 200 SMA
No immediate resistance within 2–5%
B) Entry Setups
Entry 1: First Pullback Entry (FPE)
Wait for the first 1–3 day consolidation.
Entry → Breakout of the small range.
Stop → Below the low of the pullback.
Rule: No entry on the gap day itself.
Entry 2: High Tight Flag above the Gap
Stock rises > 10% after the gap
Then forms a 3–8 day sideways phase
Entry → Break above the flag’s high
Stop → Below the flag base
Entry 3: ORB Entry (Opening Range Breakout, 30 minutes)
Very effective for strong gaps.
Wait 30 minutes after the market opens
Entry → Break above the high of these first 30 minutes
Stop → Below the 30-minute low
C) Stop Levels
For FPE: 4–8%
For ORB: 1–2 × ATR(14)
For flags: 3–5%
D) Add Rules
Only if the stock continues showing strong volume:
Add on every new 3–5 day high
Add only above half-range levels
Maximum 3 adds
3) Early-Warning Module (Setup forming but not ready for entry)
This module marks stocks that are forming a setup but are not yet buyable.
➤ Criteria
Gap-Up ≥ 3%
Strong volume
Stock pulls back and consolidates (1–5 bars)
BUT no breakout yet
4) Exact Entry Checklist (Minervini-style, optimized for gaps)
Checklist before entry:
Gap ≥ +3%
20 EMA rising
Volume > 2× average
RS line rising
Price > 50 SMA
Pullback not deeper than 30% of the gap
3+ green signals from the Early-Warning diamonds
If all 7 are fulfilled → green light.
5) How to apply the strategy in daily practice
Morning (08:00–09:00)
Check the screener
Build your watchlist
Identify gaps
US Market Open (15:30)
Monitor the Early-Warning module
Sort gap momentum opportunities
16:00–17:00
Enter: First Pullback / ORB / Flag
Set stops
Determine position size based on risk
After 20:00
Check volume strength
If momentum fades → no more adds
Search in scripts for "a股开盘前15分钟交易规则"

KIRA INVESTORS📈 KIRA MOMENTUM STRATEGY – BUY & SELL
Title: KIRA EMA 9–21 + VWAP
🟢 BUY RULE
EMA 9 crosses above EMA 21
Price closes above VWAP
🔴 SELL RULE
EMA 9 crosses below EMA 21
Price closes below VWAP
🚫 NO TRADE ZONE
EMAs tangled
Price chopping near VWAP
🎯 TIMEFRAMES & RISK
TF: 5–15 min
Stop-loss: Swing high / low
Risk ≤ 1% per trade
💡 WHY IT WORKS
EMA crossover → Trend direction
VWAP → Confirms institutional bias
Only trades strong momentum moves


Kira EMA 9-21 + VWAP Buy/Sell🔥 KIRA MOMENTUM SETUP – BUY & SELL SYSTEM
Simple • Powerful • Trend-Based
✅ BUY CONDITION 🟢
EMA 9 crosses ABOVE EMA 21
AND
Price closes ABOVE VWAP
🔴 SELL CONDITION
EMA 9 crosses BELOW EMA 21
AND
Price closes BELOW VWAP
🚫 NO TRADE ZONE
❌ EMAs tangled
❌ Price chopping around VWAP
🎯 BEST TIMEFRAMES
✅ 5-Minute
✅ 15-Minute
(Indices & highly liquid stocks)
⚠️ RISK RULE
• Buy SL ➝ Below recent swing low
• Sell SL ➝ Above recent swing high
• Risk per trade ≤ 1%

rahulp33It is a 15-min high-low for the day; this will help the fellow chartist understand a trend emerging for the day. This indicator, along with others, gives a general sense of the daily trend, but it's not the sole factor to consider.

rahulpatkiIt is a 15-min high-low for the day; this will help the fellow chartist understand a trend emerging for the day. This indicator, along with others, provides a general idea of the daily trend, but it is not the only one to consider.

Structure Break Out + rsi divergence + alma SIMPLIFIED OBJECTIVE (dyor, nfa, test different assets and diff TF)
The goal of this script is to act as a Reversal Sniper. Most traders lose money by trying to guess the top or bottom of a market too early. This strategy solves that by waiting for two specific events to happen together:
First, a hidden shift in momentum (RSI Divergence).
Second, a confirmed change in price direction (Crossing the ALMA 20 Blue Line).
This ensures you only enter a trade when the market has confirmed it is ready to reverse.
TRADING RULES
BUY SIGNAL (Long Position)
Step 1: Look for a GREEN DIV label below the candles. This warns you that sellers are exhausted.
Step 2: Wait for a GREEN TRIANGLE with the text GO. This confirms the price has crossed above the Blue Line.
Step 3: Enter the Buy trade immediately when the candle with the GO signal closes.
SELL SIGNAL (Short Position)
Step 1: Look for a RED DIV label above the candles. This warns you that buyers are exhausted.
Step 2: Wait for a RED TRIANGLE with the text GO. This confirms the price has crossed below the Blue Line.
Step 3: Enter the Sell trade immediately when the candle with the GO signal closes.
EXIT RULES (How to Close the Trade)
The script draws lines on the chart to help you manage the trade.
Scenario A: The Perfect Win (Target Hit)
If price hits the Green Line, the trade is closed automatically for a profit. This is your Risk-Reward Target.
Scenario B: The Trend Change (Reversal)
If the price turns around and crosses the Blue Line in the wrong direction, close the trade immediately. Do not wait for the stop loss. This protects your profits or keeps losses small.
Scenario C: The Safety Net (Stop Loss)
If price hits the Red Line, the trade is closed for a loss. This is your safety guard to prevent a small loss from becoming a big one.
IMPORTANT NOTES
Never trade a DIV label without a GO signal. The DIV is just a warning; the GO is the trigger.
- This strategy works best on 15-Minute and 1-Hour timeframes.
- If t
he Blue Line is flat, be careful, as the market may be ranging. Ideally, you want to see the Blue Line angling up or down.

PyraTime Harmonic 369Concept and Methodology PyraTime Harmonic 369 is a quantitative time-projection tool designed to apply Modular Arithmetic to market analysis. Unlike linear time indicators, this tool projects non-linear integer sequences derived from Digital Root Summation (Base-9 Reduction).
The core logic utilizes the mathematical progression of the 3-6-9 constants. By anchoring to a user-defined "Origin Pivot," the script projects three distinct harmonic triads to identify potential Temporal Confluence—moments where mathematical time cycles align with price action.
Technical Features This script focuses on the Standard Scalar (1x) projection of the Digital Root sequence:
The Root-3 Triad (Red): Projects intervals of 174, 285, 396. (Mathematical Sum: 1+7+4=12→3)
The Root-6 Triad (Green): Projects intervals of 417, 528, 639. (Mathematical Sum: 4+1+7=12→3, inverted)
The Root-9 Triad (Blue): Projects intervals of 741, 852, 963. (Mathematical Sum: 7+4+1=12→3... completion to 9)
How to Use
Set Anchor: Input the time of a significant High or Low in the settings.
Select Resolution: This tool is optimized for 1-minute (Micro-Harmonics) and 15-minute (Intraday Harmonics) charts.
Analyze Clusters: The vertical lines represent calculated harmonic intervals. Traders look for "Clusters" where a Root-3 and Root-9 cycle land on adjacent bars, indicating a high-probability pivot.
System Architecture & Version Comparison This script represents the foundational layer of the PyraTime ecosystem.
This Script (PyraTime Harmonic 369):
Scalar: Standard 1x Multiplier only.
Focus: Intraday & Micro-structure (1m, 15m).
Engine: Core Digital Root Integers.
PyraTime Harmonic Matrix (Advanced Edition):
Scalar Engine: Unlocks Quad-Fractal (4x), Tri-Fractal (3x), and Bi-Fractal (2x) multipliers for institutional cycle analysis.
Apex Logic: Auto-detection of the "963" Completion Sequence (Gold Highlight).
Event Horizon: Includes a live Predictive Dashboard that calculates the time-delta to the next harmonic event across all scalar groups.
Disclaimer This tool is for the educational analysis of Number Theory in financial markets. It projects time intervals and does not predict price direction. Past performance does not guarantee future results.

PyraTime Intraday Cycles**Concept and Methodology**
PyraTime Intraday Cycles is a technical analysis tool designed to introduce the concept of **Temporal Cycle Projection**. While most indicators analyze price action (Y-axis), this tool focuses exclusively on the X-axis (Time).
By anchoring to a specific "Origin Pivot" (a user-defined High or Low), the script projects harmonic time intervals into the future. These vertical vectors serve as a grid, helping traders identify moments where time-based cycles may align with price structure.
**Technical Features**
This edition is optimized for **Multi-Timeframe Harmonic Flows**, utilizing a fixed algorithm for key intervals:
* **Anchor Point Logic:** The user manually selects a significant market pivot. The script calculates forward projections from this exact timestamp.
* **Standard Rhythms:** This version renders the **5-minute**, **15-minute**, **1-hour**, and **Daily** harmonic sequences. This allows for analysis across scalping, intraday, and swing trading structures.
* **Visual Confluence:** The indicator draws vertical lines to highlight potential zones of temporal exhaustion or acceleration.
**How to Use**
1. **Identify a Pivot:** Locate a significant High or Low on the chart.
2. **Set the Origin:** Open the settings and input the date/time of that pivot.
3. **Analyze Confluence:** Watch how price behaves when it approaches a vertical line. If price hits a key support/resistance level *at the same time* it hits a PyraTime vertical line, this is considered a high-probability "Time/Price" intersection.
**Version Comparison**
This script represents the foundational layer of the Great Pyramid system (PyraTime Apex).
* **PyraTime Intraday Cycles (This Script):** Focuses on Standard Timeframes (5m, 15m, 1h, Daily).
* **GPM Architecture (Advanced):** The full methodology extends these calculations to Esoteric Sequences (33, 144, 108), includes 3x Cycle Extensions, and features a Predictive Dashboard for complex multi-timeframe analysis.
**Disclaimer**
This tool is for educational and analytical purposes only. It identifies time cycles, not price direction. Past performance of a time cycle does not guarantee future results.

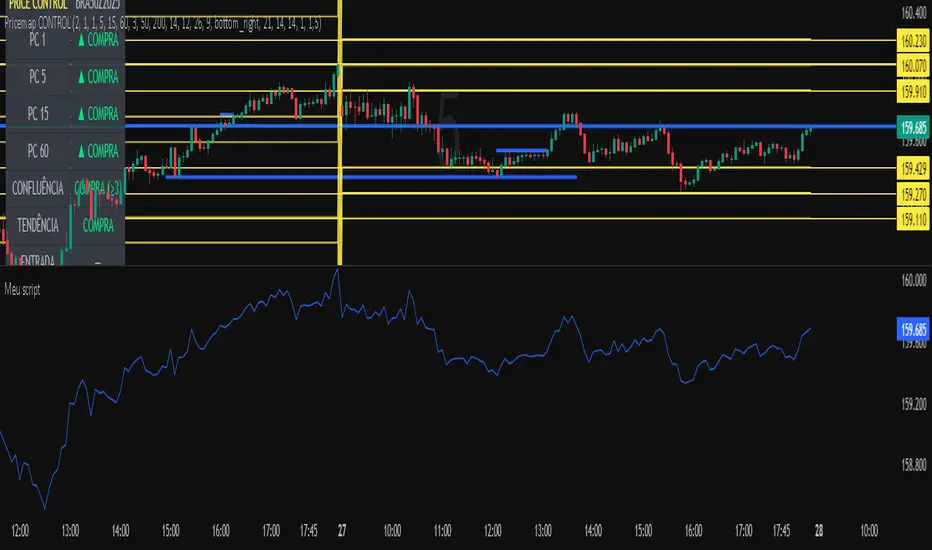
Meu scriptPricemap CONTROL (2, 1, 1, 5, 15, 60, 3, 50, 200, 14, 12, 26, 9, bottom_right, 21, 14, 14, 1, 1,5)
Stratégie SMC V18.2 (BTC/EUR FINAL R3 - Tendance)This strategy is an automated implementation of Smart Money Concepts (SMC), designed to operate on the Bitcoin/Euro (BTC/EUR) chart using the 15-minute Timeframe (M15).It focuses on identifying high-probability zones (Order Blocks) after a confirmed Break of Structure (BOS) and a Liquidity Sweep, utilizing an H1/EMA 200 trend filter to only execute trades in the direction of the dominant market flow.Risk management is strict: every trade uses a fixed Risk-to-Reward Ratio (R:R) of 1:3.🧱 Core Logic Components
1. Trend Filter (H1/EMA 200)Objective: To avoid counter-trend entries, which has allowed the success rate to increase to nearly $65\%$ in backtests.Mechanism: A $200$-period EMA is plotted on a higher timeframe (Default: H1/60 minutes).Long (Buy): Entry is only permitted if the current price (M15) is above the trend EMA.Short (Sell): Entry is only permitted if the current price (M15) is below the trend EMA.
2. Order Block (OB) DetectionA potential Order Block is identified on the previous candle if it is
accompanied by an inefficiency (FVG - Fair Value Gap).
3. Advanced SMC ValidationBOS (Break of Structure): A recent BOS must be confirmed by breaking the swing high/low defined by the swing length (Default: 4 M15 candles).Liquidity (Liquidity Sweep): The Order Block zone must have swept recent liquidity (defined by the Liquidity Search Length) within a certain tolerance (Default: $0.1\%$).Point of Interest: The OB must form in a premium zone (for shorts) or a discount zone (for longs) relative to the current swing range (above or below the $50\%$ level of the range).
4. Execution and Risk ManagementEntry: The trade is triggered when the price touches the active Order Block (mitigation).Stop Loss (SL): The SL is fixed at the low of the OB (for longs) or the high of the OB (for shorts).Take Profit (TP): The TP is strictly set at a level corresponding to 3 times the SL distance (R:R 1:3).Lot Sizing: The trade quantity is calculated to risk a fixed amount (Default: 2.00 Euros) per transaction, capped by a Lot Max and Lot Min defined by the user.
Input Parameters (Optimized for BTC/EUR M15)Users can adjust these parameters to modify sensitivity and risk profile. The default values are those optimized for the high-performing backtest (Profit Factor $> 3$).ParameterDescriptionDefault Value (M15)Long. Swing (BOS)Candle length used to define the swing (and thus the BOS).4Long. Recherche Liq.Number of candles to scan to confirm a liquidity sweep.7Tolérance Liq. (%)Price tolerance to validate the liquidity sweep (as a percentage of price).0.1Timeframe TendanceChart timeframe used for the EMA filter (e.g., 60 = H1).60 (H1)Longueur EMA TendancePeriods used for the trend EMA.200Lot Max (Quantité Max BTC)Maximum quantity of BTC the strategy is allowed to trade.0.01Lot Min Réel (Exigence Broker)Minimum quantity required by the broker/exchange.0.00001

Buy Sell SignalBuy Sell Signal - EMA Crossover with Dynamic Risk Management
OVERVIEW
This indicator combines a dual EMA crossover system with ATR-based dynamic stop loss and take profit levels to provide complete trade management signals. Unlike basic EMA crossover scripts, this tool automatically calculates and displays entry points, stop losses, and take profit targets based on market volatility, offering traders a complete trading framework in a single indicator.
HOW IT WORKS
The indicator uses three core components working together:
Trend Detection: A fast EMA (default 5) and slow EMA (default 13) identify trend direction. When the fast EMA crosses above the slow EMA, it signals bullish momentum; when it crosses below, it signals bearish momentum.
Entry Validation: Optional candle confirmation filter ensures the crossover is accompanied by a bullish/bearish candle close, reducing false signals in choppy markets.
Risk Management: Uses ATR (Average True Range, default 14 periods) to calculate:
Stop Loss: Positioned below/above recent swing low/high minus ATR multiplier (default 0.5x)
Take Profit: Calculated using customizable risk-reward ratio (default 3:1)
KEY FEATURES
✅ Automatic Position Tracking: Monitors active trades and displays current position status (LONG/SHORT/No position)
✅ Visual Trade Management: Shows entry price (white dashed line), stop loss (red line), and take profit (green line) in real-time
✅ Trade Outcome Signals: Displays clear markers when TP is hit (🎯), SL is triggered (❌), or position is invalidated by opposite signal
✅ Information Dashboard: Live table showing entry price, SL, TP, and actual R:R ratio
✅ Smart Position Invalidation: Automatically closes and invalidates previous positions when opposite trend signal appears
✅ Customizable Alerts: Five alert conditions for BUY/SELL signals, TP hits, SL triggers, and invalidations
INPUTS
Fast EMA Length (default 5): Responsive to recent price action
Slow EMA Length (default 13): Defines broader trend direction
ATR Period (default 14): Volatility measurement period
SL Multiplier (default 0.5): Distance from swing point to stop loss
Risk:Reward Ratio (default 3.0): Target profit relative to risk
Candle Confirmation (default ON): Requires bullish/bearish candle on crossover
HOW TO USE
Apply the indicator to your chart (works on all timeframes)
Adjust EMA periods based on your trading style (shorter for scalping, longer for swing trading)
Set your preferred risk-reward ratio
Enable alerts for automated notifications
When a BUY/SELL signal appears, the indicator automatically calculates and displays your complete trade plan
Monitor the information table for live position updates
Exit when TP is reached or SL is triggered
TRADING METHODOLOGY
This script implements a momentum-following strategy based on exponential moving average crossovers, enhanced with volatility-adjusted risk parameters. The ATR-based stop loss adapts to market conditions—wider stops in volatile markets, tighter stops in calm markets. The position invalidation feature prevents traders from holding outdated positions when market sentiment shifts.
BEST PRACTICES
Use on trending markets for best results
Higher timeframes (4H, Daily) produce fewer but more reliable signals.
For scalpe use 5 and 15 minutes(Risk).
Consider market context and fundamental factors alongside signals
Adjust ATR multiplier based on asset volatility
Test different EMA combinations for your preferred instruments
ORIGINALITY
While EMA crossover systems are common, this script's value lies in its complete integration of entry logic, dynamic risk management, position tracking, and automated invalidation—features typically requiring multiple separate indicators. The ATR-based stop loss calculation and automatic R:R visualization provide practical trade execution guidance that basic crossover indicators lack.
Important Notes:
This indicator does not guarantee profitable trades
Always practice proper risk management
Backtest settings on historical data before live trading
Past performance does not indicate future results

Grok/Claude AI Regime Engine • Grok/Claude X SeriesGrok/Claude AI Regime Engine
This is a TradingView indicator designed to identify market regimes (bullish, bearish, or neutral) and generate buy/sell signals based on multiple technical factors working together.
Core Concept
At its heart, this indicator tries to answer a simple question: "What kind of market are we in right now, and when should I consider buying or selling?"
It does this by blending several well-known technical analysis tools into a unified system. Think of it as a dashboard that synthesizes multiple indicators into clear, actionable information.
How It Determines Market Regime
The indicator creates what it calls a "Money Line" by combining two exponential moving averages (EMAs) — a fast one (default 8 periods) and a slow one (default 24 periods). These are weighted together, with the fast EMA getting 60% influence by default. This blended line serves as the primary trend reference.
Bullish regime is declared when the short EMA crosses above the long EMA, provided the RSI isn't already in overbought territory. Bearish regime kicks in when the opposite happens — short EMA crosses below long, as long as RSI isn't oversold. Neutral regime occurs when the indicator detects sideways, choppy conditions.
The neutral detection is particularly interesting. It uses two optional methods: one looks at how flat the Money Line's slope is (compared to recent volatility via ATR), and the other checks how close together the two EMAs are as a percentage of price. When the market is grinding sideways, these methods help the indicator avoid falsely calling a trend.
Signal Generation Logic
Buy and sell signals are generated using Donchian Channel breakouts as the trigger mechanism. The Donchian Channel tracks the highest high and lowest low over a lookback period (default 20 bars), using the previous bar's values to avoid repainting issues.
A buy signal fires when price touches or breaks below the lower Donchian band, suggesting a potential reversal from oversold conditions. A sell signal fires when price reaches the upper band. However, these raw breakout signals pass through several filters before being displayed:
FilterPurposeADX thresholdOnly signals when the market has sufficient trend strength (default: ADX > 25)RSI filterBuy signals require RSI to be oversold; sell signals require overbought RSICooldown periodPrevents signal spam by requiring a minimum number of bars between signalsClose confirmationOptional setting to require a candle close beyond the band, not just a wick
Additional Metrics Displayed
The indicator calculates and displays several supplementary metrics in an information panel. ADX (Average Directional Index) measures trend strength — values below 15 suggest a weak, ranging market, while above 25 indicates a strong trend. The colored dots at the bottom of the chart reflect this: white for weak, orange for moderate, blue for strong.
BBWP (Bollinger Band Width Percentile) measures current volatility relative to historical volatility over roughly a year of data. High readings suggest volatility expansion; low readings suggest compression, which often precedes significant moves.
Alerts and Notifications
The indicator generates alerts in two scenarios: when the market regime changes (bullish to bearish, etc.) and when buy/sell signals trigger. Alert messages include the ticker symbol, timeframe, current price, RSI, ADX, and other relevant context so you can quickly assess the situation without opening the chart.
Visual Customization
Users can toggle various display elements on or off, including the EMA lines, Donchian bands, shaded regime zones between the bands, and price labels at signal points. The shading between the upper and lower bands changes color based on the current regime — green for bullish, magenta for bearish, and blue for neutral — providing an at-a-glance view of market conditions over time.
Summary
This is essentially a trend-following system with mean-reversion entry signals, filtered by momentum and trend strength indicators. It's designed to help traders identify favorable market conditions and time entries while avoiding signals during choppy, directionless periods. The multiple confirmation layers aim to reduce false signals, though like any technical system, it will still produce losing trades in certain market conditions.

Advanced FVG Detector Pro📊 Advanced FVG Detector Pro - Smart Money Analysis Tool
Overview
The Advanced FVG Detector Pro is a sophisticated Pine Script v6 indicator designed to identify and track Fair Value Gaps (FVGs) with institutional-grade precision. This tool goes beyond basic gap detection by incorporating volume analysis, smart money scoring, and adaptive filtering to help traders identify high-probability trading opportunities.
What are Fair Value Gaps?
Fair Value Gaps (FVGs) are price inefficiencies that occur when the market moves so quickly that it leaves behind an imbalance or "gap" in price action. These gaps often act as magnets for future price movement as the market seeks to fill these inefficiencies. Professional traders and institutions closely monitor FVGs as they represent areas of potential support, resistance, and high-probability trade setups.
🎯 Key Features
1. Smart Money Scoring System
Proprietary algorithm that rates each FVG on a 0-100 scale Combines gap size, volume strength, price location, and trend alignment Filter out low-quality setups by setting minimum score thresholdsFocus on institutional-grade opportunities with scores above 70
2. Advanced Volume Validation
Validates FVGs with volume analysis to reduce false signals Only displays gaps formed during significant volume periods Customizable volume multiplier for different market conditions
Visual volume strength indicators on chart
3. Flexible Mitigation Options
Full Fill: Traditional complete gap closure Midpoint Touch: More aggressive entry strategy
Partial Fill: Customizable percentage-based mitigation (10-90%) Choose the strategy that matches your trading style
4. ATR-Based Adaptive Filtering
Automatically adjusts to market volatility using Average True Range Works consistently across any instrument, timeframe, or volatility regime No manual recalibration needed when switching markets Filters out noise while capturing meaningful gaps
5. Real-Time Statistics Dashboard
Live tracking of total active FVGs Bullish vs Bearish gap count Mitigation rate percentage
Average Smart Money Score Toggle on/off based on preference
6. Professional Visual Design
Clean, customizable color schemes Optional midline display for precise entry planning
Labels showing gap type, score, and volume strength Automatic extension of active gaps
Mitigated gaps change color for easy identification
📈 How to Use
For Day Traders:
Use 5-15 minute timeframes
Set ATR Multiplier to 0.15-0.25
Enable volume validation
Focus on FVGs with scores above 65
For Swing Traders:
Use 1H-4H timeframes
Set ATR Multiplier to 0.5-1.0
Use "Midpoint Touch" mitigation
Focus on FVGs with scores above 70
For Position Traders:
Use Daily timeframe
Set ATR Multiplier to 0.75-1.5
Use "Full Fill" mitigation
Focus on FVGs with scores above 75
🔧 Customization Options
Detection Settings:
Minimum FVG size percentage filter
ATR-based size filtering
Maximum number of gaps to display
Smart Money Score minimum threshold
Volume Analysis:
Volume validation toggle
Volume multiplier adjustment
Volume moving average period
Visual volume strength background
Mitigation Control:
Choose mitigation type (Full/Midpoint/Partial)
Set partial fill percentage
Auto-remove mitigated gaps
Control how long mitigated gaps remain visible
Visual Customization:
Bullish/Bearish/Mitigated colors
Show/hide midlines
Show/hide labels
Box extension length
Statistics dashboard toggle
🎓 Trading Strategy Ideas
1. FVG Retest Strategy
Wait for price to create a high-score FVG (70+)
Enter on the first retest of the gap
Place stop loss beyond the gap
Target the opposite side of the gap or next FVG
2. Confluence Trading
Combine FVGs with support/resistance levels
Look for FVGs near key moving averages (20/50 EMA)
Higher probability when FVG aligns with trendlines
Use multiple timeframe analysis
3. Breakout Confirmation
FVGs often form during strong breakouts
High-volume FVGs confirm breakout strength
Enter on mitigation of breakout FVG
Trail stops as new FVGs form in trend direction
⚡ Performance Optimizations
Efficient memory management for smooth chart performance
Optimized calculations run only once per bar
Smart array management prevents memory leaks
Works smoothly even with 100+ active FVGs
🔔 Alert System
Customizable alerts for new bullish FVGs
Customizable alerts for new bearish FVGs
Mitigation alerts for active gaps
Frequency control to avoid alert spam
💡 Pro Tips
Multi-Timeframe Approach: Identify major FVGs on higher timeframes (Daily/4H) and use lower timeframes (15M/5M) for precise entries
Volume Confirmation: The highest probability setups occur when FVGs form with 2x+ average volume
Trend Alignment: Trade FVGs in the direction of the major trend for best results
Patience Pays: Wait for price to return to the FVG rather than chasing breakouts
Risk Management: Always use stop losses beyond the FVG boundaries
📚 Educational Value
This indicator is perfect for:
Learning to identify institutional order flow
Understanding market microstructure
Developing price action trading skills
Recognizing supply and demand imbalances
Improving entry and exit timing
⚠️ Disclaimer
This indicator is a tool for technical analysis and should not be used as the sole basis for trading decisions. Always combine with proper risk management, fundamental analysis, and your own trading plan. Past performance does not guarantee future results.
🔄 Updates & Support
Regular updates will include:
Additional filtering options
Enhanced multi-timeframe analysis
More customization features
Performance improvements
📊 Best Pairs/Markets
Works excellently on:
Forex pairs (EUR/USD, GBP/USD, etc.)
Cryptocurrency (BTC, ETH, etc.)
Stock indices (SPX, NQ, etc.)
Individual stocks
Commodities (Gold, Oil, etc.)
Version Information
Version: 1.0
Pine Script: Version 6
Type: Overlay Indicator
Max Boxes: 500
Max Lines: 500

Josh FXJoshFX Multi-Timeframe Levels & Fair Value Gap Indicator
This powerful TradingView indicator provides a comprehensive view of key market levels and trends across multiple timeframes. Designed for traders who want precise entries and market context, it includes:
Previous Daily Levels: Automatically marks the previous day’s High, Low, and 50% midpoint.
Multi-Timeframe Trend: Displays the trend direction for 5-minute, 15-minute, 1-hour, and 4-hour charts directly on your current chart.
Daily Candle Display: Shows the current daily candle for quick visual reference.
Pivot Points: Accurately marks technical highs and lows (pivot points) to the exact unit on the chart.
Fair Value Gaps (FVGs): Highlights areas of imbalance for potential high-probability trade setups.
JoshFX Telegram Watermark: Includes branding for the JoshFX community.
This all-in-one tool is perfect for traders combining price action, liquidity concepts, and multi-timeframe analysis to find high-quality setups efficiently.

ORB indicatorthis indicator marks out the first 15 min high and low on the candle that opens in each session, very easy to read and minimalist
