Sexy RSI for sexy tradersHello fellow sexy traders.
I was tired of constantly having to add my own horizontals/MAs to the default RSI so I decided to make this modification.
The default settings include channels from 40-80 (green horizontals) for a bullish range, and 20-60 (red horizontals) for the bearish range.
Also includes white line at 50 level, and blue horizontals at extremes (90 and 10).
If RSI stays in one of the red or green range that can signify the trend direction, as directed by Andrew Cardwell (inventor of the RSI).
If you wish for other levels to be included, just let me know! Comment on here or dm me on twitter @boss_charts and I can add the settings for you, so all you have to do is click a button and it will set it to your desired config. I want this to be a tool that is useful for heavy traders to save them time.
Additionally, in order to tell the level of the RSI and how overextended it might be, I added the setting for the RSI to change color depending on its level. Current settings are as follows:
Normal RSI (30-70) = PURPLE
Conventional Overbought/Oversold (30-20 + 70-80) = RED
1st extended (20-15 + 80-85) = PINK
2nd extended (15-10 + 85-90) = ORANGE
VERY EXTENDED (<10 + >90) = YELLOW
That way you can get an idea of how drastic a move is by the color alone. According to Dr. Cardwell, a drastic move to over/under extended can be a sign of strength.
Finally, there are the default MAs added that Mr. Cardwell defines as useful for defining the trend. These being the 9 MA and 45 EMA/WMA.
The strategy with these is to have the MAs on both price and RSI. If the 9MA is above the 45 MA on both price and RSI, then this is bullish and you can look for longs.
Conversely, if the 9 is below the 45 on both RSI and price that is bearish, and you can look for shorts.
I added the background color change for the points where the MAs cross each other, so you do not have to have the MAs fogging up your charts to know where they are relative to one another. This is similar to my MA cross indicator which contains the same functionality.
Never financial advice. Backtest it for yourself and find MA configurations that work for you.
Enjoy! Feel free to send feedback/requests whenever.
Search in scripts for "a股近10年第二天溢价的股票"

Multi SMA EMA WMA HMA BB (5x8 MAs Bollinger Bands) MAX MTF - RRBMulti SMA EMA WMA HMA 4x7 Moving Averages with Bollinger Bands MAX MTF by RagingRocketBull 2019
Version 1.0
All available MAX MTF versions are listed below (They are very similar and I don't want to publish them as separate indicators):
ver 1.0: 4x7 = 28 MTF MAs + 28 Levels + 3 BB = 59 < 64
ver 2.0: 5x6 = 30 MTF MAs + 30 Levels + 3 BB = 63 < 64
ver 3.0: 3x10 = 30 MTF MAs + 30 Levels + 3 BB = 63 < 64
ver 4.0: 5(4+1)x8 = 8 CurTF MAs + 32 MTF MAs + 20 Levels + 3 BB = 63 < 64
ver 5.0: 6(5+1)x6 = 6 CurTF MAs + 30 MTF MAs + 24 Levels + 3 BB = 63 < 64
ver 6.0: 4(3+1)x10 = 10 CurTF MAs + 30 MTF MAs + 20 Levels + 3 BB = 63 < 64
Fib numbers: 8, 13, 21, 34, 55, 89, 144, 233, 377
This indicator shows multiple MAs of any type SMA EMA WMA HMA etc with BB and MTF support, can show MAs as dynamically moving levels.
There are 4 MA groups + 1 BB group, a total of 4 TFs * 7 MAs = 28 MAs. You can assign any type/timeframe combo to a group, for example:
- EMAs 9,12,26,50,100,200,400 x H1, H4, D1, W1 (4 TFs x 7 MAs x 1 type)
- EMAs 8,13,21,30,34,50,55,89,100,144,200,233,377,400 x M15, H1 (2 TFs x 14 MAs x 1 type)
- D1 EMAs and SMAs 8,13,21,30,34,50,55,89,100,144,200,233,377,400 (1 TF x 14 MAs x 2 types)
- H1 WMAs 13,21,34,55,89,144,233; H4 HMAs 9,12,26,50,100,200,400; D1 EMAs 12,26,89,144,169,233,377; W1 SMAs 9,12,26,50,100,200,400 (4 TFs x 7 MAs x 4 types)
- +1 extra MA type/timeframe for BB
There are several versions: Simple, MTF, Pro MTF, Advanced MTF, MAX MTF and Ultimate MTF. This is the MAX MTF version. The Differences are listed below. All versions have BB
- Simple: you have 2 groups of MAs that can be assigned any type (5+5)
- MTF: +2 custom Timeframes for each group (2x5 MTF) +1 TF for BB, TF XY smoothing
- Pro MTF: 4 custom Timeframes for each group (4x3 MTF), 1 TF for BB, MA levels and show max bars back options
- Advanced MTF: +4 extra MAs/group (4x7 MTF), custom Ticker/Symbols, Timeframe <>= filter, Remove Duplicates Option
- MAX MTF: +2 subtypes/group, packed to the limit with max possible MAs/TFs: 4x7, 5x6, 3x10, 4(3+1)x10, 5(4+1)x8, 6(5+1)x6
- Ultimate MTF: +individual settings for each MA, custom Ticker/Symbols
MAX MTF version tests the limits of Pinescript trying to squeeze as many MAs/TFs as possible into a single indicator.
It's basically a maxed out Advanced version with subtypes allowing for mixed types within a group (i.e. both emas and smas in a single group/TF)
Pinescript has the following limits:
- max 40 security calls (6 calls are reserved for dupe checks and smoothing, 2 are used for BB, so only 32 calls are available)
- max 64 plot outputs (BB uses 3 outputs, so only 61 plot outputs are available)
- max 50000 (50kb) size of the compiled code
Based on those limits, you can only have the following MAs/TFs combos in a single script:
1. 4x7, 5x6, 3x10 - total number of MTF MAs must always be <= 32, and you can still have BB and Num Levels = total MAs, without any compromises
2. 5(4+1)x8, 6(5+1)x6, 4(3+1)x10 - you can use the Current Symbol/Timeframe as an extra (+1) fixed TF with the same number of MTF MAs
- you don't need to call security to display MAs on the Current Symbol/Timeframe, so the total number of MTF MAs remains the same and is still <= 32
- to fit that many MAs into the max 64 plot outputs limit you need to reduce the number of levels (not every MA Group will have corresponding levels)
Features:
- 4x7 = 28 MAs of any type
- 4x MTF groups with XY step line smoothing
- +1 extra TF/type for BB MAs
- 2 MA subtypes within each group/TF
- 4x7 = 28 MA levels with adjustable group offsets, indents and shift
- supports any existing type of MA: SMA, EMA, WMA, Hull Moving Average (HMA)
- custom tickers/symbols for each group
- show max bars back option
- show/hide both groups of MAs/levels/BB and individual MAs
- timeframe filter: show only MAs/Levels with TFs <>= Current TF
- hide MAs/Levels with duplicate TFs
- support for custom TFs that are not available in free accounts: 2D, 3D etc
- support for timeframes in H: H, 2H, 4H etc
Notes:
- Uses timeframe textbox instead of input resolution dropdown to allow for 240 120 and other custom TFs
- Uses symbol textbox instead of input symbol to avoid establishing multiple dummy security connections to the current ticker - otherwise empty symbols will prevent script from running
- Possible reasons for missing MAs on a chart:
- there may not be enough bars in history to start plotting it. For example, W1 EMA200 needs at least 200 bars on a weekly chart.
- for charts with low/fractional prices i.e. 0.00002 << 0.001 (default Y smoothing step) decrease Y smoothing as needed (set Y = 0.0000001) or disable it completely (set X,Y to 0,0)
- for charts with high price values i.e. 20000 >> 0.001 increase Y smoothing as needed (set Y = 10-20). Higher values exceeding MAs point density will cause it to disappear as there will be no points to plot. Different TFs may require diff adjustments
- TradingView Replay Mode UI and Pinescript security calls are limited to TFs >= D (D,2D,W,MN...) for free accounts
- attempting to plot any TF < D1 in Replay Mode will only result in straight lines, but all TFs will work properly in history and real-time modes. This is not a bug.
- Max Bars Back (num_bars) is limited to 5000 for free accounts (10000 for paid), will show error when exceeded. To plot on all available history set to 0 (default)
- Slow load/redraw times. This indicator becomes slower, its UI less responsive when:
- Pinescript Node.js graphics library is too slow and inefficient at plotting bars/objects in a browser window. Code optimization doesn't help much - the graphics engine is the main reason for general slowness.
- the chart has a long history (10000+ bars) in a browser's cache (you have scrolled back a couple of screens in a max zoom mode).
- Reload the page/Load a fresh chart and then apply the indicator or
- Switch to another Timeframe (old TF history will still remain in cache and that TF will be slow)
- in max possible zoom mode around 4500 bars can fit on 1 screen - this also slows down responsiveness. Reset Zoom level
- initial load and redraw times after a param change in UI also depend on TF. For example: D1/W1 - 2 sec, H1/H4 - 5-6 sec, M30 - 10 sec, M15/M5 - 4 sec, M1 - 5 sec. M30 usually has the longest history (up to 16000 bars) and W1 - the shortest (1000 bars).
- when indicator uses more MAs (plots) and timeframes it will redraw slower. Seems that up to 5 Timeframes is acceptable, but 6+ Timeframes can become very slow.
- show_last=last_bars plot limit doesn't affect load/redraw times, so it was removed from MA plot
- Max Bars Back (num_bars) default/custom set UI value doesn't seem to affect load/redraw times
- In max zoom mode all dynamic levels disappear (they behave like text)
- Dupe check includes symbol: symbol, tf, both subtypes - all must match for a duplicate group
- For the dupe check to work correctly a custom symbol must always include an exchange prefix. BB is not checked for dupes
Good Luck! Feel free to learn from/reuse the code to build your own indicators.

APEX - WaveTrend [v1]WaveTrend is a smoothed oscillator which enables it to detect true reversals in an extremely accurate manner. The beauty of this indicator is that does not generate signals during choppy sideways markets.
The basic settings are 10 / 3 / 4 these are very aggressive settings, that will generate a lot of signals in all even not so volatile markets. If you need high-quality signals you settings close to 10 / 3 /21. The strongest buy/sell signals are given when the cross occurs above or below the threshold. In the 10 / 3 / 4 you threshold for buy should be around -90 values. If you use the very smoothed variant the threshold will be around -45 to -50 values.
This indicator will be first available in APEX v1 currently being beta tested.

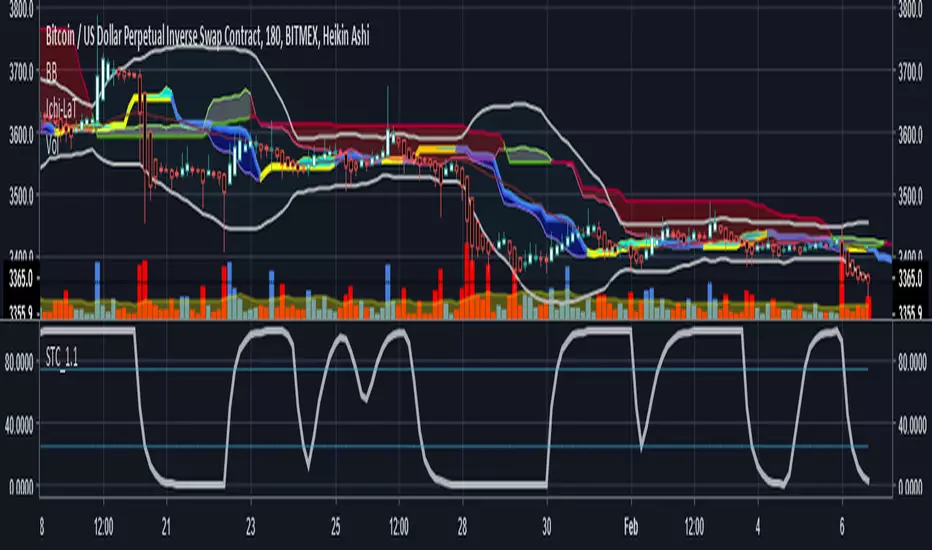
Schaff Trend Cycle 1.1 with signal codingThis is an edit of Lazy Bear's Schaff Trend Cycle original description here. I've added in the syntax so that you can generate an alert when it crosses the threshold in either direction. Just tick the box to show threshold crosses.
More background on the indicator is here.
www.investopedia.com
Other common settings are fast 23 slow 53 or 10/30, 3/10. I have also set it to 9/20 for test purposes. They have different pluses and minuses on different timeframes.
Double EMA & ALMA StrategyThe ALMA (50 period) acts as the main trend filter, meaning that long positions are taken above the ALMA and short positions are taken below the ALMA. For instance, the 5 and 10 period exponential moving averages are added on the chart to give early signals to the trend.
Therefore, when the 5/10 EMA triggers a bullish crossover, long signals are taken when price is above the ALMA, likewise, when the 5/10 EMA triggers a bearish crossover, short signals are taken when price is below the ALMA.
Find out optimal values by trying. May not produce accurate results in horizontal markets. Thank you.

Inverted Yield Curve with VIX Fear IndexUS 2 year and US 10 year comparison, inverted yield curve with VIX. I use this on a weekly chart with 2 moving averages, the 40 week (ma200 daily) and the 520 week (10 year median).
The bottom histogram is the VIX and the plot is the yield curve. When the VIX is above a certain level (you can set it in settings) and the ýield curve is close to or at inversion the background goes red.
The last seven recessions were preceded by an inverted yield curve. Here I combined the two main fear indexes, the VIX and the run for safe US treasuries (Inverted Yield Curve).
This is preset to the 2 year and 10 year US bond, weekly, and the normal VIX ticker but you can set it to whatever you like.
Published with source code for anyone to modify. Please comment below if you do so! This is the second in a series of indicators I intend to publish as a package of economic recoverty/recession symptom indicators.
Follow me for updates, next one up is commodities with dr Copper and oil!

Advanced Larry Williams 9.2- By EduHit rate greater than Setup 9.1
However, the stop of this setup becomes more expensive in certain situations.
PURCHASE SIGN
1 - Paper comes in a bullish trend in the operational term to be operated.
2 - Exponential moving average of 9 upward periods.
3 - Wait for a candle to make the largest closing (candle reference).
4 - If the next candle CLOSES below the minimum of the candle reference the setup is armed.
5 - Mark the candle maxim that closed below the reference. It's the trigger!
6 - If the next candle exceeds this maximum by 1 cent the trade is triggered. Put the stop loss at the low of the candle that closed below (0.01 to 0.10 below)
7 - If the next candle does not fire, let's lower the trigger to the lower maximums, SINCE the mm9exp does not turn down.
8 - It exceeded the maximum we will have the entrance.
9 - Original stop-loss in the minimum of the candle we set the maximum activated.
SIGN OF SALE
1 - Paper comes in a downtrend in the operating period to be operated.
2 - Exponential moving average of 9 periods descending.
3 - Wait for a candle that makes the lowest closing (candle reference).
4 - If the next candle CLOSE above the maximum of the reference candle the setup is armed.
5 - Bookmark the candle that closed above the reference. It's the trigger!
6 - If the next candle breaks this minimum, the trade is triggered.
7 - Place the stop-loss at the maximum of the candle that closed up.
8 - If the next candle does not trigger, we will raise the trigger to the highest minimums SINCE the exponential moving average of 9 periods does not turn upwards.
9 - It broke the minimum we will have the entrance.
10 - Stop-loss original in the maximum of the candle that we set the minimum activated.
*********************************************************************************************************************************************************
Índice de acerto Superior ao Setup 9.1
Porém o stop deste setup acaba se tornando mais caro em determinadas situações.
SINAL DE COMPRA
1 - Papel vem em tendência de alta no prazo operacional a ser operado.
2 - Média móvel exponencial de 9 períodos ascendente.
3 - Aguardar um candle que faça o maior fechamento (candle referência).
4 - Se o próximo candle FECHAR abaixo da mínima do candle referência o setup está armado.
5 - Marcar a máxima do candle que fechou abaixo do referência. É o gatilho!
6 - Se o próximo candle superar essa máxima em 1 centavo o trade é acionado. Colocar o stop-loss na mínima do candle que fechou abaixo (0,01 a 0,10 abaixo)
7 - Se o próximo candle não acionar, vamos abaixando o gatilho para as máximas menores DESDE QUE a mm9exp não vire para baixo.
8 - Superou a máxima teremos a entrada.
9 - Stop-loss original na mínima do candle que marcamos a máxima ativada.
SINAL DE VENDA
1 - Papel vem em tendência de baixa no prazo operacional a ser operado.
2 - Média móvel exponencial de 9 períodos descendente.
3 - Aguardar um candle que faça o menor fechamento (candle referência).
4 - Se o próximo candle FECHAR acima da máxima do candle referência o setup está armado.
5 - Marcar a mínima do candle que fechou acima do referência. É o gatilho!
6 - Se o próximo candle romper essa mínima o trade é acionado.
7 - Colocar o stop-loss na máxima do candle que fechou acima.
8 - Se o próximo candle não acionar, vamos levantando o gatilho para as mínimas maiores DESDE QUE a média móvel exponencial de 9 períodos não vire para cima.
9 - Rompeu a mínima teremos a entrada.
10 - Stop-loss original na máxima do candle que marcamos a mínima ativada.

Reset Every (Price)Someone requested a high/low price indicator that would reset the "remembered" prices daily. I started out doing just that, and then decided to make it much more configurable.
Choose the units (minutes, hours, days, weeks, months) and the number of those units, and this will reset the highest/lowest value remembered to the current values on your chosen time interval.
This should work with any time interval you desire, within reason...asking for resets every 4000 hours on a monthly chart will probably not work.
GE, monthly, every 7 months:
Ford, weekly, every 18 months:
Dow Jones Industrial Average, weekly, every 90 days:
LTCBTC, daily, every 10 days:
ETHUSD, 30 minutes, every 10 days:
BTCUSD, 1 minute, every 10 hours:
EURUSD, 1 minute, every 50 minutes:
Also, I am about to publish another version of this with just one source input that can be applied to any indicator...stay tuned!

XPloRR MA-Trailing-Stop StrategyXPloRR MA-Trailing-Stop Strategy
Long term MA-Trailing-Stop strategy with Adjustable Signal Strength to beat Buy&Hold strategy
None of the strategies that I tested can beat the long term Buy&Hold strategy. That's the reason why I wrote this strategy.
Purpose: beat Buy&Hold strategy with around 10 trades. 100% capitalize sold trade into new trade.
My buy strategy is triggered by the fast buy EMA (blue) crossing over the slow buy SMA curve (orange) and the fast buy EMA has a certain up strength.
My sell strategy is triggered by either one of these conditions:
the EMA(6) of the close value is crossing under the trailing stop value (green) or
the fast sell EMA (navy) is crossing under the slow sell SMA curve (red) and the fast sell EMA has a certain down strength.
The trailing stop value (green) is set to a multiple of the ATR(15) value.
ATR(15) is the SMA(15) value of the difference between the high and low values.
The scripts shows a lot of graphical information:
The close value is shown in light-green. When the close value is lower then the buy value, the close value is shown in light-red. This way it is possible to evaluate the virtual losses during the trade.
the trailing stop value is shown in dark-green. When the sell value is lower then the buy value, the last color of the trade will be red (best viewed when zoomed)(in the example, there are 2 trades that end in gain and 2 in loss (red line at end))
the EMA and SMA values for both buy and sell signals are shown as a line
the buy and sell(close) signals are labeled in blue
How to use this strategy?
Every stock has it's own "DNA", so first thing to do is tune the right parameters to get the best strategy values voor EMA , SMA, Strength for both buy and sell and the Trailing Stop (#ATR).
Look in the strategy tester overview to optimize the values Percent Profitable and Net Profit (using the strategy settings icon, you can increase/decrease the parameters)
Then keep using these parameters for future buy/sell signals only for that particular stock.
Do the same for other stocks.
Important : optimizing these parameters is no guarantee for future winning trades!
Here are the parameters:
Fast EMA Buy: buy trigger when Fast EMA Buy crosses over the Slow SMA Buy value (use values between 10-20)
Slow SMA Buy: buy trigger when Fast EMA Buy crosses over the Slow SMA Buy value (use values between 30-100)
Minimum Buy Strength: minimum upward trend value of the Fast SMA Buy value (directional coefficient)(use values between 0-120)
Fast EMA Sell: sell trigger when Fast EMA Sell crosses under the Slow SMA Sell value (use values between 10-20)
Slow SMA Sell: sell trigger when Fast EMA Sell crosses under the Slow SMA Sell value (use values between 30-100)
Minimum Sell Strength: minimum downward trend value of the Fast SMA Sell value (directional coefficient)(use values between 0-120)
Trailing Stop (#ATR): the trailing stop value as a multiple of the ATR(15) value (use values between 2-20)
Example parameters for different stocks (Start capital: 1000, Order=100% of equity, Period 1/1/2005 to now) compared to the Buy&Hold Strategy(=do nothing):
BEKB(Bekaert): EMA-Buy=12, SMA-Buy=44, Strength-Buy=65, EMA-Sell=12, SMA-Sell=55, Strength-Sell=120, Stop#ATR=20
NetProfit: 996%, #Trades: 6, %Profitable: 83%, Buy&HoldProfit: 78%
BAR(Barco): EMA-Buy=16, SMA-Buy=80, Strength-Buy=44, EMA-Sell=12, SMA-Sell=45, Strength-Sell=82, Stop#ATR=9
NetProfit: 385%, #Trades: 7, %Profitable: 71%, Buy&HoldProfit: 55%
AAPL(Apple): EMA-Buy=12, SMA-Buy=45, Strength-Buy=40, EMA-Sell=19, SMA-Sell=45, Strength-Sell=106, Stop#ATR=8
NetProfit: 6900%, #Trades: 7, %Profitable: 71%, Buy&HoldProfit: 2938%
TNET(Telenet): EMA-Buy=12, SMA-Buy=45, Strength-Buy=27, EMA-Sell=19, SMA-Sell=45, Strength-Sell=70, Stop#ATR=14
NetProfit: 129%, #Trade

Renko Price Bars Overlay// Shows the price renko bars (or range bars) instead of the PERIOD renko
// bars that are integrated into Trading View. The normal renko bars that
// Trading View offers only consider the drawing of a new brick when the
// price closes above or below the required brick size. This can produce
// misleading charts since depending on the time interval of a chart, new
// bricks may or may not be drawn. True price renko bars will draw a new
// brick immediately upon the price exceeding the next target brick size.
// When running this script in "Traditional" mode, the painting of the
// brick overlay band is INDEPENDENT of the chart interval. If price
// exceeds the required target price for the next brick, the band is
// updated immediately, instead of waiting for the price bar on the chart
// interval to close first. The brick starting anchor point will attempt
// to be a "nice number" at a round interval for the chart ticker. For
// example, if viewing EURUSD with the box size equal to 50 ticks/pips,
// the open and close prices will take the form of 1.2100, 1.2150, 1.2200,
// 1.2250, and so on. This is the same behavior as the normal traditional
// Renko bars in Trading View and other major trading platforms such as
// Meta Trader.
// Use the tick size in traditional mode to specify the block size, in
// ticks. This may give interesting results in FOREX pairs... as the tick
// size in Trading View may be 0.00001 instead of the normal pip size of
// 0.0001, so a 10 pip block size may be '100', and not the expected '10'.
// FOREX futures should work in the manner expected, a 10 pip block size
// will indeed equal 0.0010.
// The "ATR" mode functions differently than the Trading View built in
// version. The block size is updated each time the range is exceeded.
// In Trading View, when using the ATR mode, the ATR is the last ATR
// value calculated on the ENTIRE data interval, and is applied to all
// past data. You can see this when you press the '+' sign of the ticker
// in the top left of the chart window and you will see the brick size
// as a constant, the brick size is not a function of the ever changing
// ATR value of the price action. The block size of this script is not
// updated for each price candle (i.e. each 1HR on a 1HR chart), instead
// it is updated only when the price thresholds are exceeded requiring a
// the band to be updated. At that point the current ATR is considered
// and the brick size is updated.
// Options exist to show the current high and low of the brick, and to
// show the required levels that the price must exceed to draw a new
// brick and update the band.
Please leave comments if you notice any bugs or would like any new features added. I don't find much use for plotting the H/L of the current renko candle, but I have seen some request it in the past.
Cheers.

EMA Indicators with BUY sell SignalCombine 3 EMA indicators into 1. Buy and Sell signal is based on
- Buy signal based on 20 Days Highest High resistance
- Sell signal based on 10 Days Lowest Low support
Input :-
1 - Short EMA (20), Mid EMA (50) and Long EMA (200)
2 - Resistance (20) = 20 Days Highest High line
3 - Support (10) = 10 Days Lowest Low line

Volume Range EventsChanges in the feelings (positive, negative, neutral) in the market concerning the valuation of an instrument are often preceded with sudden outbursts of buying and selling frenzies. The aim of this indicator is to report such outbursts. We can see them as expansions of volume, sometimes 10 times more than usual. and as extensions of the trading range, also sometimes 10 times more than usual (e.g. usual range is 10 cent suddenly a whole dollar.) The changes are calculated in such a way that these fit between plus and minus 100 percent, the bars are scaled in some sort of logarithmic way. The Emoline is the same as the one in the True Balance of Power indicator, which I already published
ONLY RISES ARE EVENTS
Sometimes analysts are tempted to give meaning to low volume or small ranges. These simply mean that the market has little interest in trading this instrument. I believe that in such cases the trader needs to wait for expansion and extension events to happen, then he can make a better guess of where the market is heading. As events often mark the beginning or ending of a trend, this indicator provides an early and clear signal, because it doesn’t bother us about non-events.
WHAT IS USUAL?
If the algorithm would use an average as a normal to scale volume or range events, then previous peaks will act as spoilers by making the average so high that a following peak is scaled too small. I developed a function, usual() , that kicks out all extremes of a ‘population of values’ and which returns the average of the non-extreme values. It can be called with any serial. This function is called by both algorithms that report volume and range peaks, which guarantees that the results are really comparable. As this function has a fixed look back of 8 periods, we might state that ‘usual’ is a short lived relative value. I think this doesn’t matter for the practical use of the indicator.
COLORING AND INTERPRETATION
I follow the categories in the ‘Better Volume Indicator’, published by LeazyBear, these are:
1. Climactic Volumes, event >40 % (this means peak is 1.5 X usual)
LIME: Climax Buying Volume, direction up, range event also > 30 %
RED: Climax Selling Volume, direction down, range event also > 30 %
AQUA: Climax Churning Volume, both directions, range event < 30%
2. Smaller Volumes, event <40 %
GREEN: Supportive Volume, both directions, if combined with range event
BLUE: Churning Volume, both directions, if not combined with range event (Professional Trading)
3. Just Range Events
BLACK histogram bars (Amateurish Trading)

Forex Master v4.0 (EUR/USD Mean-Reversion Algorithm)DESCRIPTION
Forex Master v4.0 is a mean-reversion algorithm currently optimized for trading the EUR/USD pair on the 5M chart interval. All indicator inputs use the period's closing price and all trades are executed at the open of the period following the period where the trade signal was generated.
There are 3 main components that make up Forex Master v4.0:
I. Trend Filter
The algorithm uses a version of the ADX indicator as a trend filter to trade only in certain time periods where price is more likely to be range-bound (i.e., mean-reverting). This indicator is composed of a Fast ADX and a Slow ADX, both using the same look-back period of 50. However, the Fast ADX is smoothed with a 6-period EMA and the Slow ADX is smoothed with a 12-period EMA. When the Fast ADX is above the Slow ADX, the algorithm does not trade because this indicates that price is likelier to trend, which is bad for a mean-reversion system. Conversely, when the Fast ADX is below the Slow ADX, price is likelier to be ranging so this is the only time when the algorithm is allowed to trade.
II. Bollinger Bands
When allowed to trade by the Trend Filter, the algorithm uses the Bollinger Bands indicator to enter long and short positions. The Bolliger Bands indicator has a look-back period of 20 and a standard deviation of 1.5 for both upper and lower bands. When price crosses over the lower band, a Long Signal is generated and a long position is entered. When price crosses under the upper band, a Short Signal is generated and a short position is entered.
III. Money Management
Rule 1 - Each trade will use a limit order for a fixed quantity of 50,000 contracts (0.50 lot). The only exception is Rule
Rule 2 - Order pyramiding is enabled and up to 10 consecutive orders of the same signal can be executed (for example: 14 consecutive Long Signals are generated over 8 hours and the algorithm sends in 10 different buy orders at various prices for a total of 350,000 contracts).
Rule 3 - Every order will include a bracket with both TP and SL set at 50 pips (note: the algorithm only closes the current open position and does not enter the opposite trade once a TP or SL has been hit).
Rule 4 - When a new opposite trade signal is generated, the algorithm sends in a larger order to close the current open position as well as open a new one (for example: 14 consecutive Long Signals are generated over 8 hours and the algorithm sends in 10 different buy orders at various prices for a total of 350,000 contracts. A Short Signal is generated shortly after the 14th Long Signal. The algorithm then sends in a sell order for 400,000 contracts to close the 350,000 contracts long position and open a new short position of 50,000 contracts).

My5min1. Follow the instructions for entry and exit exactly as above. Don’t second guess, or assume/presume anything.
2. Avoid entering the trade when the price is temporarily above /below 10 day MA, but the price candle hasn’t fully formed yet. Enter the trade only after the price candle closes above/below the 10 day MA.
3. Exit the trade immediately when the price candle closes above/below 10 day MA in the direction opposite to the trade. Don’t remain in the trade wishing it to turn in your favor.
4. Never ever trade in the opposite direction of the market. i.e. don’t buy when the price is below 200 day MA and sell when the price is above 200 day MA.
5. Take profits when limit is reached. Don’t be greedy and keep on increasing the target. Remember- A bird in hand is worth two in the bush.

MACD, backtest 2015+ only, cut in half and doubledThis is only a slight modification to the existing "MACD Strategy" strategy plugin!
found the default MACD strategy to be lacking, although impressive for its simplicity. I added "year>2014" to the IF buy/sell conditions so it will only backtest from 2015 and beyond ** .
I also had a problem with the standard MACD trading late, per se. To that end I modified the inputs for fast/slow/signal to double. Example: my defaults are 10, 21, 10 so I put 20, 42, 20 in. This has the effect of making a 30min interval the same as 1 hour at 10,21,10. So if you want to backtest at 4hr, you would set your time interval to 2hr on the main chart. This is a handy way to make shorter time periods more useful even regardless of strategy/testing, since you can view 15min with alot less noise but a better response.
Used on BTCCNY OKcoin, with the chart set at 45 min (so really 90min in the strategy) this gave me a percent profitable of 42% and a profit factor of 1.998 on 189 trades.
Personally, I like to set the length/signals to 30,63,30. Meaning you need to triple the time, it allows for much better use of shorter time periods and the backtests are remarkably profitable. (i.e. 15min chart view = 45min on script, 30min= 1.5hr on script)
** If you want more specific time periods you need to try plugging in different bar values: replace "year" with "n" and "2014" with "5500". The bars are based on unix time I believe so you will need to play around with the number for n, with n being the numbers of bars.

Hash Pivot DetectorHash Pivot Detector
Professional Support & Resistance Detection with Multi-Timeframe Zone Analysis
Developed by Hash Capital Research, the Hash Pivot Detector is a sophisticated indicator designed for identifying key support and resistance levels using pivot-based detection with institutional-grade zone analysis.
Key Features
Zone-Based Detection
Unlike traditional single-line S/R indicators, Hash Pivot Detector uses configurable zones around pivot levels to represent realistic institutional order areas. Adjustable zone width accommodates different asset volatilities.
Multi-Timeframe Analysis
Displays higher timeframe support/resistance levels alongside current timeframe pivots, providing crucial context for institutional positioning and stronger price barriers.
Clean Visual Design
Features Hash Capital's signature fluorescent color scheme (pink resistance, cyan support) optimized for dark charts with high contrast and instant visual recognition. Semi-transparent zones keep your chart clean and readable.
How It Works
The indicator uses pivot high/low detection with configurable left and right bar parameters. When a pivot is confirmed, it plots:
Primary support/resistance lines at pivot levels
Semi-transparent zones representing realistic order areas
Higher timeframe S/R levels as crosses for additional context
Recommended Settings
For Swing Trading:
Pivot Bars: 10-20 left/right
Zone Width: 0.5-1.0%
HTF: Daily (on 1H-4H charts)
For Intraday Trading:
Pivot Bars: 5-10 left/right
Zone Width: 0.3-0.5%
HTF: 1H or 4H (on 5min-15min charts)
Asset-Specific Zone Width:
Forex/Crypto: 0.3-0.5%
Stocks: 0.5-1.0%
Volatile Assets: 1.0-2.0%
What Makes It Different
✓ Zone-based approach (more realistic than lines)
✓ Multi-timeframe confluence detection
✓ Minimal visual clutter with maximum information
✓ Professional institutional aesthetic
✓ Comprehensive tooltips for easy optimization
✓ No repainting - all pivots are confirmed
Best Used For
Identifying high-probability entry/exit zones
Setting stop-loss and take-profit levels
Recognizing breakout/breakdown areas
Multi-timeframe confluence analysis
Swing trading and position trading
Intraday scalping with adjusted parameters
Notes
Works on all timeframes and markets
Fully customizable colors and parameters
All settings include detailed optimization guidance
Clean code, efficient performance
No alerts or notifications (visual analysis only)

Algoticks.in: Supertrend Strategy (Directional option sample)Supertrend Strategy - User Guide
Overview
This is a trend-following strategy based on the Supertrend indicator. It generates signals when the trend direction changes (Green to Red or Red to Green). It is fully integrated with Algoticks.in API for automated trading on Delta Exchange, with specialized logic for Options trading.
Strategy Logic
Long Signal: When Supertrend flips to Green (Bullish Trend Start)
Short Signal: When Supertrend flips to Red (Bearish Trend Start)
Automatically closes opposite positions before entering new ones
Quick Setup
1. Add to TradingView
Open TradingView and go to the chart
Click "Pine Editor" at the bottom
Paste the script code
Click "Add to Chart"
2. Configure Strategy Parameters
Strategy Settings
ATR Length (default: 10): The lookback period for Average True Range
Factor (default: 3.0): The multiplier for the ATR bands. Higher values = fewer signals (less noise), Lower values = more signals (scalping).
General API Settings
Paper Trading : Enable for testing without real money
Signal Type : Choose "Trading Signal" (default) for tracking
Exchange : DELTA (Delta Exchange)
Segment :
futures - Perpetual contracts
options - Call/Put options
spot - Spot trading
Order Settings: Basic
Quantity : Number of contracts (e.g., 1, 0.5, 2)
Validity :
GTC - Good Till Cancelled
IOC - Immediate or Cancel
FOK - Fill or Kill
DAY - Day order
Product : cross_margin or isolated_margin
Order Settings: Entry Type
Choose how orders are executed:
Market Order : Immediate fill at best price
Limit Order : Fill at specified price or better
Stop Market : Triggers at stop price, then market order
Stop Limit : Triggers at stop price, then limit order
Entry Prices (for Limit/Stop orders)
Limit Price:
Price : The value to use
Type : Last Price / Mark Price / Index Price
Mode :
Absolute - Exact price (e.g., 65000)
Relative - Offset from entry price
% Checkbox : If checked, relative uses percentage; if unchecked, uses points
Example:
Absolute: 65000 → Order at exactly 65000
Relative 1% (checked): Entry ± 1% of entry price
Relative 100 (unchecked): Entry ± 100 points
Trigger Price: Same logic as Limit Price, used for Stop orders
Exit / Bracket Prices (SL/TP)
Stop Loss (SL):
Type : Price type to monitor (Mark Price recommended)
Mode : Absolute or Relative
% : Percentage or points
SL : Stop loss value (e.g., 2 for 2%)
Trig : Optional trigger price (creates Stop-Limit SL)
Take Profit (TP): Same structure as SL
Example:
Long entry at 65000, SL = 2% → Exit at 63700 (65000 - 2%)
Short entry at 65000, TP = 3% → Exit at 63050 (65000 - 3%)
3. Options Trading Setup (CRITICAL)
This strategy has special logic for Options trading to handle directional bias correctly.
Scenario A: Options Buying (Long Volatility)
You want to BUY Calls when the trend is Up, and BUY Puts when the trend is Down.
Segment : options
Strike Selection : Dynamic
Algo Type : Options Buying Algo
What happens:
Long Signal (Green Supertrend) → System sends BUY action. Backend buys a Call (CE) .
Short Signal (Red Supertrend) → System sends BUY action. Backend buys a Put (PE) .
Scenario B: Options Selling (Short Volatility)
You want to SELL Puts when the trend is Up (Bullish), and SELL Calls when the trend is Down (Bearish).
Segment : options
Strike Selection : Dynamic
Algo Type : Options Selling Algo
What happens:
Long Signal (Green Supertrend) → System sends SELL action. Backend sells a Put (PE) .
Short Signal (Red Supertrend) → System sends SELL action. Backend sells a Call (CE) .
Dynamic Strike Settings:
Strike Offset : 0 (ATM), +1 (OTM for Calls/ITM for Puts), -1 (ITM for Calls/OTM for Puts)
Strike Interval : Gap between strikes (e.g., BTC: 500, ETH: 50)
Expiry Date Formats:
T+0 - Today
T+1 - Tomorrow
current week - This Friday
next week - Next Friday
current month - Last Friday of month
131125 - Specific date (13 Nov 2025)
4. Create Alert for Automation
Right-click on chart → "Add Alert"
Condition : Select your strategy name
Alert Actions : Webhook URL
Webhook URL : Your Algoticks.in API endpoint
Message : Leave as {{strategy.order.alert_message}} (contains JSON)
Click "Create"
The alert will automatically send JSON payloads to your API when signals occur.
Example Configurations
Futures Trend Following
Strategy: ATR=10, Factor=3.0
Segment: futures
Order Type: market_order
Quantity: 1
SL: 2% (Relative)
TP: 6% (Relative)
Options Buying (Directional)
Segment: options
Strike Selection: Dynamic
Algo Type: Options Buying Algo
Strike Offset: 0 (ATM)
Strike Interval: 500 (for BTC)
Expiry: current week
Order Type: market_order
Important Notes
Paper Trading First : Always test with paper trading enabled before live trading
Order Tags : Automatically generated for tracking (max 18 chars)
Position Management : Strategy closes opposite positions automatically
Signal Confirmation : Uses barstate.isconfirmed to prevent repainting
JSON Payload : All settings are converted to JSON and sent via webhook
Troubleshooting
No signals : Check if Supertrend is flipping on your timeframe
Orders not executing : Verify webhook URL and API credentials
Wrong strikes : Double-check Strike Interval for your asset
SL/TP not working : Ensure values are non-zero and mode is correct
Support
For API setup and connector configuration, see visit Algoticks.in documentation.

PoC Migration Map [BackQuant]PoC Migration Map
A volume structure tool that builds a side volume profile, extracts rolling Points of Control (PoCs), and maps how those PoCs migrate through time so you can see where value is moving, how volume clusters shift, and how that aligns with trend regime.
What this is
This indicator combines a classic volume profile with a segmented PoC trail. It looks back over a configurable window, splits that window into bins by price, and shows you where volume has concentrated. On top of that, it slices the lookback into fixed bar segments, finds the local PoC in each segment, and plots those PoCs as a chain of nodes across the chart.
The result is a "migration map" of value:
A side volume profile that shows how volume is distributed over the recent price range.
A sequence of PoC nodes that show where local value has been accepted over time.
Lines that connect those PoCs to reveal the path of value migration.
Optional trend coloring based on EMA 12 and EMA 21, so each PoC also encodes trend regime.
Used together, this gives you a structural read on where the market has actually traded size, how "value" is moving, and whether that movement is aligned or fighting the current trend.
Core components
Lookback volume profile - a side histogram built from all closes and volumes in the chosen lookback window.
Segmented PoC trail - rolling PoCs computed over fixed bar segments, plotted as nodes in time.
Trend heatmap - optional color mapping of PoC nodes using EMA 12 versus EMA 21.
PoC labels - optional labels on every Nth PoC for easier reading and referencing.
How it works
1) Global lookback and binning
You choose:
Lookback Bars - how far back to collect data.
Number of Bins - how finely to split the price range.
The script:
Finds the highest high and lowest low in the lookback.
Computes the total price range and divides it into equal binCount slices.
Assigns each bar's close and volume into the appropriate price bin.
This creates a discretized volume distribution across the entire lookback.
2) Side volume profile
If "Show Side Profile" is enabled, a right-hand volume profile is drawn:
Each bin becomes a horizontal bar anchored at a configurable "Right Offset" from the current bar.
The horizontal width of each bar is proportional to that bin's volume relative to the maximum volume bin.
Optionally, volume values and percentages are printed inside the profile bars.
Color and transparency are controlled by:
Base Profile Color and its transparency.
A gradient that uses relative volume to modulate opacity between lower volume and higher volume bins.
Profile Width (%) - how wide the maximum bin can extend in bars.
This gives you an at-a-glance view of the volume landscape for the chosen lookback window.
3) Segmenting for PoC migration
To build the PoC trail, the lookback is divided into segments:
Bars per Segment - bars in each local cluster.
Number of Segments - how many segments you want to see back in time.
For each segment:
The script uses the same price bins and accumulates volume only from bars in that segment.
It finds the bin with the highest volume in that segment, which is the local PoC for that segment.
It sets the PoC price to the center of that bin.
It finds the "mid bar" of the segment and places the PoC node at that time on the chart.
This is repeated for each segment from older to newer, so you get a chain of PoCs that shows how local value has migrated over time.
4) Trend regime and color coding
The indicator precomputes:
EMA 12 (Fast).
EMA 21 (Slow).
For each PoC:
It samples EMA 12 and EMA 21 at the mid bar of that segment.
It computes a simple trend score as fast EMA minus slow EMA.
If trend heatmap is enabled, PoC nodes (and the lines between them) are colored by:
Trend Up Color if EMA 12 is above EMA 21.
Trend Down Color if EMA 12 is below EMA 21.
Trend Flat Color if they are roughly equal.
If the trend heatmap is disabled, PoC color is instead based on PoC migration:
If the current PoC is above the previous PoC, use the Up PoC Color.
If the current PoC is below the previous PoC, use the Down PoC Color.
If unchanged, use the Flat PoC Color.
5) Connecting PoCs and labels
Once PoC prices and times are known:
Each PoC is connected to the previous one with a dotted line, using the PoC's color.
Optional labels are placed next to every Nth PoC:
Label text uses a simple "PoC N" scheme.
Label background uses a configurable label background color.
Label border is colored by the PoC's own color for visual consistency.
This turns the PoCs into a visual path that can be read like a "value trajectory" across the chart.
What it plots
When fully enabled, you will see:
A right-sided volume profile for the chosen lookback window, built from volume by price.
Colored horizontal bars representing each price bin's relative volume.
Optional volume text showing each bin's volume and its percentage of the profile maximum.
A series of PoC nodes spaced across the chart at the mid point of each segment.
Dotted lines connecting those PoCs to show the migration path of value.
Optional PoC labels at each Nth node for easier reference.
Color-coding of PoCs and lines either by EMA 12 / 21 trend regime or by up/down PoC drift.
Reading PoC migration and market pressure
Side profile as a pressure map
The side profile shows where trading has been most active:
Thick, opaque bars represent high volume zones and possible high interest or acceptance areas.
Thin, faint bars represent low volume zones, potential rejection or transition areas.
When price trades near a high volume bin, the market is sitting on an area of prior acceptance and size.
When price moves quickly through low volume bins, it often does so with less friction.
This gives you a static map of where the market has been willing to do business within your lookback.
PoC trail as a value migration map
The PoC chain represents "where value has lived" over time:
An upward sloping PoC trail indicates value migrating higher. Buyers have been willing to transact at increasingly higher prices.
A downward sloping trail indicates value migrating lower and sellers pushing the center of mass down.
A flat or oscillating trail indicates balance or rotational behaviour, with no clear directional acceptance.
Taken together, you can interpret:
Side profile as "where the volume mass sits", a static pressure field.
PoC trail as "how that mass has moved", the dynamic path of value.
Trend heatmap as a regime overlay
When PoCs are colored by the EMA 12 / 21 spread:
Green PoCs mark segments where the faster EMA is above the slower EMA, that is, a local uptrend regime.
Red PoCs mark segments where the faster EMA is below the slower EMA, that is, a local downtrend regime.
Gray PoCs mark flat or ambiguous trend segments.
This lets you answer questions like:
"Is value migrating higher while the trend regime is also up?" (trend confirming value).
"Is value migrating higher but most PoCs are red?" (value against the prevailing trend).
"Has value started to roll over just as PoCs flip from green to red?" (early regime transition).
Key settings
General Settings
Lookback Bars - how many bars back to use for both the global volume profile and segment profiles.
Number of Bins - how many price bins to split the high to low range into.
Profile Settings
Show Side Profile - toggle the right-hand volume profile on or off.
Profile Width (%) - how wide the largest volume bar is allowed to be in terms of bars.
Base Profile Color - the starting color for profile bars, with transparency.
Show Volume Values - if enabled, print volume and percent for each non-zero bin.
Profile Text Color - color for volume text inside the profile.
PoC Migration Settings
Show PoC Migration - toggle the PoC trail plotting.
Bars per Segment - the number of bars contained in each segment.
Number of Segments - how many segments to build backwards from the current bar.
Horizontal Spacing (bars) - spacing between PoC nodes when drawn. (Used to separate PoCs horizontally.)
Label Every Nth PoC - draw labels at every Nth PoC (0 or 1 to suppress labels).
Right Offset (bars) - horizontal offset to anchor the side profile on the right.
Up PoC Color - color used when a PoC is higher than the previous one, if trend heatmap is off.
Down PoC Color - color used when a PoC is lower than the previous one, if trend heatmap is off.
Flat PoC Color - color used when the PoC is unchanged, if trend heatmap is off.
PoC Label Background - background color for PoC labels.
Trend Heatmap Settings
Color PoCs By Trend (EMA 12 / 21) - when enabled, overrides simple up/down coloring and uses EMA-based trend colors.
Fast EMA - length for the fast EMA.
Slow EMA - length for the slow EMA.
Trend Up Color - color for PoCs in a bullish EMA regime.
Trend Down Color - color for PoCs in a bearish EMA regime.
Trend Flat Color - color for neutral or flat EMA regimes.
Trading applications
1) Value migration and trend confirmation
Use the PoC path to see if value is following price or lagging it:
In a healthy uptrend, price, PoCs, and trend regime should all lean higher.
In a weakening trend, price may still move up, but PoCs flatten or start drifting lower, suggesting fewer participants are accepting the new highs.
In a downtrend, persistent downward PoC migration confirms that sellers are winning the value battle.
2) Identifying acceptance and rejection zones
Combine the side profile with PoC locations:
High volume bins near clustered PoCs mark strong acceptance zones, good areas to watch for re-tests and decision points.
PoCs that quickly jump across low volume areas can indicate rejection and fast repricing between value zones.
High volume zones with mixed PoC colors may signal balance or prolonged negotiation.
3) Structuring entries and exits
Use the map to refine trade location:
Fade trades against value migration are higher risk unless you see clear signs of exhaustion or regime change.
Pullbacks into prior PoC zones in the direction of the current PoC slope can offer higher quality entries.
Stops placed beyond major accepted zones (clusters of PoCs and high volume bins) are less likely to be hit by random noise.
4) Regime transitions
Watch how PoCs behave as the EMA regime changes:
A flip in EMA 12 versus EMA 21, coupled with a turn in PoC slope, is a strong signal that value is beginning to move with the new trend.
If EMAs flip but PoC migration does not follow, the trend signal may be early or false.
A weakening PoC path (lower highs in PoCs) while trend colors are still green can warn of a late-stage trend.
Best practices
Start with a moderate lookback such as 200 to 300 bars and a moderate bin count such as 20 to 40. Too many bins can make the profile overly granular and sparse.
Align "Bars per Segment" with your trading horizon. For example, 5 to 10 bars for intraday, 10 to 20 bars for swing.
Use the profile and PoC trail as structural context rather than as a direct buy or sell signal. Combine with your existing setups for timing.
Pay attention to clusters of PoCs at similar prices. Those are areas where the market has repeatedly accepted value, and they often matter on future tests.
Notes
This is a structural volume tool, not a complete trading system. It does not manage execution, position sizing or risk management. Use it to understand:
Where the bulk of trading has occurred in your chosen window.
How the center of volume has migrated over time.
Whether that migration is aligned with or fighting the current trend regime.
By turning PoC evolution into a visible path and adding a trend-aware heatmap, the PoC Migration Map makes it easier to see how value has been moving, where the market is likely to feel "heavy" or "light", and how that structure fits into your trading decisions.

TF7 Option vs Index Change RatioOverview
This indicator helps traders visualise the strength and direction of an option's price movement compared to its underlying index (NIFTY or SENSEX).
It calculates a Change Ratio, which is the percentage move in the option compared to the index movement during the same bar. This is especially useful for intraday traders looking for signs of momentum, divergence, or unusual strength/weakness in option pricing.
How It Works
The ratio is calculated as:
(Option LTP − Option Open) / (Index Close − Index Open)
The value is capped between −10 and +10 to filter out extreme or invalid spikes.
The ratio is displayed as a color-coded column chart:
🟩 Green bars: Option is moving in the same direction as the index.
🟥 Red bars: Option is underperforming or moving opposite to the index.
A compact table shows the last 5 bars of:
Option price change (with +/− sign)
Index price change
Calculated ratio (also color-coded)
You can toggle the table visibility in the settings.
Inputs & Features
Select underlying index: NIFTY or SENSEX
Toggle the data table display
Clean formatting with signed values and conditional color highlights
⚠️ Disclaimer
This is a visual analysis tool, not a buy/sell signal. Always validate with your trading strategy and risk management
#OptionsTrading, #NIFTY, #SENSEX, #ChangeRatio, #IndexAnalysis, #Momentum, #Divergence, #Intraday

Strategy: HMA 50 + Supertrend SniperHMA 50 + Supertrend Confluence Strategy (Trend Following with Noise Filtering)
Description:
Introduction and Concept This strategy is designed to solve a common problem in trend-following trading: Lag vs. False Signals. Standard Moving Averages often lag too much, while price action indicators can generate false signals during choppy markets. This script combines the speed of the Hull Moving Average (HMA) with the volatility-based filtering of the Supertrend indicator to create a robust "Confluence System."
The primary goal of this script is not just to overlay two indicators, but to enforce a strict rule where a trade is only taken when Momentum (HMA) and Volatility Direction (Supertrend) are in perfect agreement.
Why this combination? (The Logic Behind the Mashup)
Hull Moving Average (HMA 50): We use the HMA because it significantly reduces lag compared to SMA or EMA by using weighted calculations. It acts as our primary Trend Direction detector. However, HMA can be too sensitive and "whipsaw" during sideways markets.
Supertrend (ATR-based): We use the Supertrend (Factor 3.0, Period 10) as our Volatility Filter. It uses Average True Range (ATR) to determine the significant trend boundary.
How it Works (Methodology) The strategy uses a boolean logic system to filter out low-quality trades:
Bullish Confluence: The HMA must be rising (Slope > 0) AND the Close Price must be above the Supertrend line (Uptrend).
Bearish Confluence: The HMA must be falling (Slope < 0) AND the Close Price must be below the Supertrend line (Downtrend).
The "Choppy Zone" (Noise Filter): This is a unique feature of this script. If the HMA indicates one direction (e.g., Rising) but the Supertrend indicates the opposite (e.g., Downtrend), the market is considered "Choppy" or indecisive. In this state, the script paints the candles or HMA line Gray and exits all positions (optional setting) to preserve capital.
Visual Guide & Signals To make the script easy to interpret for traders who do not read Pine Script, I have implemented specific visual cues:
Green Cross (+): Indicates a LONG entry signal. Both HMA and Supertrend align bullishly.
Red Cross (X): Indicates a SHORT entry signal. Both HMA and Supertrend align bearishly.
Thick Line (HMA): The main line changes color based on the trend.
Green: Bullish Confluence.
Red: Bearish Confluence.
Gray: Divergence/Choppy (No Trade Zone).
Thin Step Line: This is the Supertrend line, serving as your dynamic Trailing Stop Loss.
Strategy Settings
HMA Length: Default is 50 (Mid-term trend).
ATR Factor/Period: Default is 3.0/10 (Standard for trend catching).
Exit on Choppy: A toggle switch allowing users to decide whether to hold through noise or exit immediately when indicators disagree.
Risk Warning This strategy performs best in trending markets (Forex, Crypto, Indices). Like all trend-following systems, it may experience drawdown during prolonged accumulation/distribution phases. Please backtest with your specific asset before using it with real capital.

OBV + WaveTrend Volume Scalper [GratefulFutures]This script is a combination script of three different strategies that provides buy and sell signals based on the change of volume with momentum confirmations.
Sources used:
This script relies on the outstanding scripts of the great script writer LazyBear: LazyBear
The following scripts were used in this publication:
1. A modified "On-Balance Volume Oscillator" modified from LazyBear's original script:
2. Wavetrend Oscillator with crosses, Author: LazyBear
3. Squeeze Momentum Oscillator, Author: LazyBear
This script functions based on the following criteria being true:
1. On balance volume oscillator turning from negative to positive (buy) or positive to negative (sell)
2. Squeeze Momentum value is increasing (buy) or decreasing (sell)
3. Wavetrend 1 (wt1) is greater than wavetrend 2 (wt2) (buy)/ Wavetrend 1 (wt1) is less than wavetrend 2 (wt2) (sell)
By combining these factors the indicator is able to signal exactly when net buying turns to net selling (OBV) and when this change is most advantageous to continue based on the momentum and price action of the underlying asset (SQMOMO and Wavetrend).
This allows you to pair volume and price action for a powerful tool to identify where price will reverse or continue providing exceptional entries for short term trades, especially when combined with other aspects such as support and resistance, or volume profile.
How to use:
Simply adjust the settings to your preference and read the given signals as generated.
Settings
There are multiple ways to tune the signals generated. It is set standard for my preferred use on a 1 minute chart.
OBV Oscillator Settings
The first 4 dropdowns in the Inputs section tune the On Balance Volume Oscillator (OBVO) portion of the indicator. You can choose if you want it to calculate based on close, open, high, low, or other value.
The most impactful in the entire settings is going to be the length and smoothing of the OBVO EMA. Making this number lower increasing the sensitivity to changes in volume, making the signals come quicker but is more susceptible to quick fluctuations. A value of between (5-20) is reasonable for the OBVO EMA length. There is a separate smoothing factor titled OBV Smoothing Length and below that, OBV Smoothing Type , a value of (2) is standard with "SMA" for smoothing type with a value of between 2-10 being reasonable. You may also play with these values to see what you like for your trading style.
Wavetrend Settings
The next 3 options are to modify the wavetrend portion of the indicator. I do not modify these from standard, and feel that they work appropriately on all time frames at the following values: n1 length (10), n2 length (20), Wavetrend Signal SMA length (4)
Squeeze Momentum Settings
The following 5 options through the end modify the Squeeze momentum portion of the indicator. The only one that modifies the signals generated is the KC Length , Making this number lower increasing the sensitivity to changes in price action, making the signals come quicker but is more susceptible to quick fluctuations. A value of between (18-25) is reasonable for KC Length .
Style Setting
You may select if you want to see the buy and sell signals. The following 5 options Raw OBV Osc through Squeeze Momentum allow you to see where each specific requirement was met, posted as a vertical line, but for live use it is recommended to turn all of these vertical lines off and only use the buy and sell signals.
Time Frames:
While this script is most effective on shorter time frames (1 minute for scalping and daytrading) it is also viable to use it on longer timeframes, due to the nature of its components being independent of time frame.
Examples of use - (Green and red vertical lines are for visualization purpose and are not part of the script)
SPY 1 Minute (Factory Settings):
SPX 15 minutes (Factory Settings):
Considerations
This script is meant primarily for short term trading, trades on the basis of seconds to minutes primarily. While they can be a good indication of volume lining up with momentum, it is always wise to use them in combination with other factors such as support, resistance, market structure, volume levels, or the many other techniques out there...
As Always... Happy Trading.
-Not_A_Mad_Scientist (GreatfulFutures Trade University)

Dual TF Bearish Divergence (Working)//@version=6
indicator("Dual TF Bearish Divergence (Working)", overlay=true)
// ----------------- SIMPLE BEARISH DIVERGENCE FUNCTION -------------------
bearDiv(src, rsiLen, lookbackMin, lookbackMax) =>
r = ta.rsi(src, rsiLen)
ph = ta.pivothigh(src, lookbackMin, lookbackMin)
ph_rsi = ta.pivothigh(r, lookbackMin, lookbackMin)
ph2 = ph
ph2_rsi = ph_rsi
priceHH = not na(ph) and not na(ph2) and ph > ph2
rsiLH = not na(ph_rsi) and not na(ph2_rsi) and ph_rsi < ph2_rsi
barsOk = lookbackMin >= lookbackMin and lookbackMin <= lookbackMax
priceHH and rsiLH and barsOk
// ----------------- TF CALLS -------------------
b60 = request.security(syminfo.tickerid, "60", bearDiv(close, 14, 10, 15))
b240 = request.security(syminfo.tickerid, "240", bearDiv(close, 14, 10, 15))
dual = b60 and b240
// ----------------- PLOT -------------------
plotshape(dual, title="Dual Bear Div", style=shape.labeldown,
color=color.red, size=size.small, text="🔻BearDiv")
// ----------------- ALERT -------------------
alertcondition(dual, "Dual Bearish Div 60+240",
"Bearish Divergence on both 60m & 240m")

MA Strength Indicator EnhancedThe "MA Strength" is an indicator that measures market trend strength or (in the case of forex pairs) the relative strength of individual currencies based on up to five different moving averages (MA). It offers multiple calculation methods, such as simple summation, normalized value, or measuring ATR/percentage distance from the price. The results are summarized in a clear table, and it provides customizable alerts for trend changes or shifts in currency strength. The high level of configurability (e.g., MA weighting, "all MA alignment" requirement) allows for fine-tuning the strategy.
💬 Interpreting the Table (Top Rows)
The top row of the table shows the final output of the indicator. This changes according to the set "Table Mode".
Trend Mode: The top row shows the final, aggregated trend status (e.g., "BULLISH", "NEUTRAL") and the corresponding "Trend Value". This is the value the indicator compares to its thresholds.
Forex Mode: (Only on 6-character pairs): The top two rows show the strength of the Base currency and the Quote currency separately.
Calculation of the top rows:
The indicator calculates the individual score of all active MAs (according to the chosen method).
Trend Value: This is the final value calculated from the scores.
If "Enable Averaging" is ON, this will be the average of the scores (e.g., MA1 score is 5.0, MA2 score is 7.0 -> Trend Value is 6.0).
If averaging is OFF, this will be the sum of the scores (e.g., 5.0 + 7.0 = 12.0).
Forex Calculation: "Forex Mode" uses this "Trend Value". If the Trend Value is +6.0 (on an EURUSD pair):
The Base currency (EUR) value will be +6.0.
The Quote currency (USD) value will be -6.0.
The indicator compares these values to the thresholds to determine the "STRONG" status for EUR and "WEAK" status for USD.
📊 Calculation Methods
The indicator can calculate trend strength using 5 methods. The final "Trend Value" is derived from the results of these calculations.
Sum:
Description: Simply adds up the individual scores of all enabled moving averages (MA).
Formula: If the price is above an MA, it gets the "Score Above" value (e.g., +2.0); if below, it gets the "Score Below" value (e.g., -2.0).
Example: Result = (MA1 score) + (MA2 score) + ...
Normalized:
Description: Takes the sum obtained by the "Sum" method and converts it to a scale between -100% (maximally bearish) and +100% (maximally bullish). It takes into account the maximum possible positive and negative scores.
Formula: Result = (Total Score / Max Possible Score) * 100
Percentage Distance:
Description: This method also considers distance. The further the price is from the MA in percentage terms, the higher the score.
Formula: MA Score = (|Close Price - MA| / MA * 100) * Weight (The "Weight" is the "Score Above/Below" value set in settings).
ATR Distance:
Description: Similar to percentage distance, but normalizes the distance using volatility via ATR (Average True Range).
Formula: MA Score = (|Close Price - MA| / ATR) * Weight
Candle Count:
Description: Counts how many consecutive candles have been above or below the MA. It multiplies this number by the set weight.
Formula: MA Score = (Number of consecutive candles) * Weight
⚙️ Settings Options
Moving Averages (MA 1-5)
For each moving average, you can set:
Enable MA: Turn the specific MA on or off.
Type: The type of moving average (SMA, EMA, WMA, etc.).
Period: The period of the MA (e.g., 50, 200).
Score Above / Below: The most important setting. This defines the "weight" of the MA in the calculation. In "Sum" mode, this is a fixed score; in distance-based modes, this is a multiplier (weight). It is advisable to write a positive number for "Score Above" and a negative number for "Score Below".
Calculation Settings
Enable Averaging: If this is on, the indicator shows the average of the active MA scores, not the total score.
Exception: This function is not available in "Normalized" mode.
Require All MA Alignment: This is a strict filter. If enabled, the indicator only gives a "BULLISH" (or "STRONG") signal if the price is above all enabled moving averages. Similarly, a "BEARISH" signal only occurs if the price is below all moving averages. If the price is on the opposite side of even just one MA (e.g., above 4, below 1), the status becomes "NEUTRAL", regardless of the scores.
Strength / Trend Thresholds
Enable Extra Levels: If active, statuses are expanded: "EXT. BULLISH" / "EXT. BEARISH" (Trend mode) or "EXT. STRONG" / "EXT. WEAK" (Forex mode). This indicates stronger, overbought/oversold conditions.
Threshold setting: The thresholds (e.g., "Strong Above - ATR") determine when the calculated value counts as a "STRONG" or "WEAK" status.
🔢 Setting Thresholds via Calculation
If "Enable Averaging" is OFF, the "Trend Value" shown in the table will be the sum of the individual MA scores. Therefore, we must define the threshold by adding up the minimum expected performance from each moving average. This allows us to set different expectations for short, medium, and long-term averages.
Step 1: Determine MA weights
In our example, we use 3 active MAs with the following weights (Score Above values):
MA1 (Short): Weight = +2
MA2 (Medium): Weight = +3
MA3 (Long): Weight = +4
Step 2: Determine the minimum expected distance
Define a minimum distance expected from each MA to trigger a "Strong" signal.
Step 3: Calculate target scores and the final threshold
Note: If "Enable Averaging" is ON, the resulting value (sum of target scores) must be
averaged to get the final threshold.
Example 1: ATR Distance
-Goal: I want a "Strong" signal if the price is...
...at least 1.0 ATR above MA1 (Short),
...at least 1.5 ATR above MA2 (Medium),
...and at least 2.0 ATR above MA3 (Long).
-Calculation (Expected Distance * Weight):
MA1 Target Score: 1.0 * 2 = 2.0
MA2 Target Score: 1.5 * 3 = 4.5
MA3 Target Score: 2.0 * 4 = 8.0
-Final Threshold (Sum of Target Scores): 2.0 + 4.5 + 8.0 = 14.5
-Setting: Set "Strong Above - ATR" threshold to 14.5.
If "Enable Averaging" is ON, the obtained value must be averaged, and the result will be the
threshold: 4.8 (14.5 / 3 = 4.83).
Example 2: Percentage Distance
-Goal: I want a "Strong" signal if the price is...
...at least 0.5% above MA1,
...at least 1.0% above MA2,
...and at least 1.5% above MA3.
-Calculation (Expected Distance * Weight):
MA1 Target Score: 0.5 * 2.0 = 1.0
MA2 Target Score: 1.0 * 3.0 = 3.0
MA3 Target Score: 1.5 * 4.0 = 6.0
-Final Threshold (Sum): 1.0 + 3.0 + 6.0 = 10.0
-Setting: Set "Strong Above - Percentage" threshold to 10.0.
If "Enable Averaging" is ON, the obtained value must be averaged, and the result will be the
threshold.
Example 3: Candle Count
-Goal: I want a "Strong" signal if...
...at least 3 consecutive candles are above MA1,
...at least 5 consecutive candles are above MA2,
...and at least 10 consecutive candles are above MA3.
-Calculation (Expected Candle Count * Weight):
MA1 Target Score: 3 * 2.0 = 6.0
MA2 Target Score: 5 * 3.0 = 15.0
MA3 Target Score: 10 * 4.0 = 40.0
-Final Threshold (Sum): 6.0 + 15.0 + 40.0 = 61.0
-Setting: Set "Strong Above - Candle" threshold to 61.0.
If "Enable Averaging" is ON, the obtained value must be averaged, and the result will be the
threshold.
Example 4: Sum
In this mode, distance does not matter, only whether the price is above or below the MA.
-Goal: "Strong" signal if the price is above the long-term averages, but can be below the short-term (MA1).
MA1 (Short): Can be below (Weight: -2.0)
MA2 (Medium): Must be above (Weight: +3.0)
MA3 (Long): Must be above (Weight: +4.0)
-Calculation: -2.0 + 3.0 + 4.0 = 5.0
-Setting: Set "Strong Above - Sum" threshold to 5.0.
If it must be above all three moving averages, the threshold would be 2.0 + 3.0 + 4.0 = 9.0.
If "Enable Averaging" is ON, the obtained value must be averaged, and the result will be the
threshold.
Example 5: Normalized
The basic logic is similar to the "Sum" method.
-Goal: "Strong" signal if price is above MA2 and MA3, but potentially below MA1.
-Calculation: Target Sum: 5.0. Max Possible Score (above all): 9.0.
-Threshold: (5.0 / 9.0) * 100 = 55.5
In this calculation method, averaging cannot be set.
The Usage of the "ATR %" Row
The "ATR %" row shows the percentage movement of an average candle.
How to use this with "Percentage Distance" mode:
This number gives a baseline. It helps decide if the "Percentage Distance" threshold is realistic.
Example: You see the "ATR %" value is hovering around 1.2%. This means a "normal" candle moves about 1.2%.
If you set the Percentage threshold to 0.5%, it is too low. The indicator will constantly give a "Strong" signal because even average movement (noise) exceeds the threshold.
Correct Usage: If "normal" movement is 1.2%, then a "strong" movement (trend) needs to be significantly larger. For example, set the threshold to double the ATR %: 2.4 (2 * 1.2). Thus, you only get a "Strong" signal if the movement is twice the average volatility.
Supplementary Information
Rounding Differences:
The numbers displayed in the table and the precision of calculations in the background differ.
Table Display: The indicator rounds numbers to two decimal places in the table. So, if the value is 0.996, the table shows 1.00 (rounded up).
Internal Calculation: The background calculation uses much higher precision. When determining status (STRONG vs NEUTRAL), the program compares the precise, unrounded value to the threshold.
Result: Due to rounding, it may happen that if the threshold is 1.00 and the table shows 1.00, the status flickers between Strong and Neutral. If this is bothersome, it is advisable to set a slightly lower threshold (e.g., 0.98).
🔔 Alert Settings
The indicator can send alerts when the status changes.
Alert Method:
Trend: Alerts when the main trend status changes (e.g., from "NEUTRAL" to "BULLISH"). You can specify which direction to alert for (e.g., only "BULLISH").
Forex: Works only on 6-character forex pairs. You can set separate alerts for the Base or Quote currency.
Forex Strength Level: You can specify at which status level to alert (e.g., "WEAK" or "EXT. STRONG").
📈 Trading Tips
Trend Confirmation: Use the "BULLISH" / "BEARISH" status to confirm your existing strategy (e.g., breakouts, bounces off support).
Forex Pairing: In Forex mode, look for pairs where the Base currency is "STRONG" and the Quote currency is "WEAK" (or "EXT. STRONG" / "EXT. WEAK") for a long position.
Short Position: Reverse the above (Base: WEAK, Quote: STRONG).
