Miggy Oscillator — NeoWave v7.4.3 Adaptive ProMiggy Oscillator — NeoWave v7.4.3 Adaptive Pro
Miggy Oscillator — NeoWave v7.4.3 Adaptive Pro is an adaptive market oscillator built to identify trend reversals, momentum exhaustion, and liquidity pivot zones across multiple timeframes.
It combines NeoWave-style wave phase detection, volatility-adjusted threshold bands, and contextual divergence logic to deliver reliable reversal signals for Scalp, Intraday, and Swing trading.
Key Concepts
This script introduces a custom wave-phase engine that estimates the current stage of market structure rather than simply combining existing indicators.
It uses asymmetric momentum smoothing and ATR-based volatility scaling to adapt naturally between calm and high-volatility environments.
Divergences are context-aware: they only trigger when both momentum inflection and wave-phase confirmation align, minimizing false signals common to classic RSI or MACD tools.
How It Works
Wave Phase Detection
Calculates the relative position of price within impulsive or corrective phases based on momentum deviation from a dynamic baseline.
Adaptive Threshold Bands
Expands or contracts automatically with real-time volatility to keep sensitivity consistent across different market regimes.
Divergence and Exhaustion Logic
Bullish divergence: price forms a lower low while the oscillator forms a higher low during a corrective phase.
Bearish divergence: price forms a higher high while the oscillator forms a lower high during an impulsive phase.
Exhaustion tags appear when the oscillator pierces an adaptive band and momentum slope weakens.
Mode System
Scalp Mode: high sensitivity, short reaction window.
Intraday Mode: balanced sensitivity and confirmation.
Swing Mode: slower reaction, wide filters for large-scale moves.
Optional Long-Only Bias
Filters out short setups to focus on bullish structures.
How to Use
Choose the operational mode based on your timeframe.
Monitor interactions between the oscillator and outer bands for possible exhaustion or divergence.
Confirm the signal using structure or candle confirmation.
Manage risk:
Tight stops for Scalp mode (1–5 min).
ATR-based stops for Intraday mode (5–30 min).
Structural stops for Swing mode (1H+).
For better accuracy, combine it with Miggy Wave AI or Miggy Fibonacci Matrix to find confluence zones.
Inputs and Customization
Mode Selector: Scalp / Intraday / Swing
Sensitivity Control
Band Multiplier (threshold width)
Divergence Confirmation Bars
Long-Only Option
Color Presets: Miggy Neon (default), Solana Glow, Arctic Pulse, or custom
Signal Labels On/Off
Alert Language: EN or ES
Alerts
Available alert conditions:
Bullish Reversal Detected
Bearish Reversal Detected
Momentum Exhaustion Near Band
Example alert text:
Miggy Oscillator — Bullish reversal detected (Mode: {mode})
Miggy Oscillator — Bearish reversal detected (Mode: {mode})
Miggy Oscillator — Momentum exhaustion near {upper/lower} band
Best Practices
Always confirm divergence with price structure or higher timeframe context.
Avoid taking counter-trend signals in strong trends without confirmation.
Adjust Band Multiplier or switch mode during extreme volatility.
Works on Crypto, Forex, Stocks, Indices, and Commodities.
Limitations
This is not an automated trading system.
It is a technical analysis tool intended to help visualize momentum imbalances and potential reversals.
Performance depends on market conditions and trader confirmation.
Versioning and License
Uses TradingView’s Update feature for improvements (no separate minor releases).
Any future legacy fork will be explained clearly in the description.
License: MIT (open source).
Developed by Miggy.io / Mr. Migraine — 2025.
Publication Compliance
English-only title and description.
No emojis or special characters.
Original adaptive algorithm with detailed explanation.
Clear usage instructions.
Suitable for a clean chart publication preview.
Search in scripts for "ai"

Bifurcation Point Adaptive (Auto Oscillator ML)Bifurcation Point Adaptive - Auto Oscillator ML
Overview
Bifurcation Point Adaptive (🧬 BPA-ML) represents a paradigm shift in divergence-based trading systems. Rather than relying on static oscillator settings that quickly become obsolete as market dynamics shift, BPA-ML employs multi-armed bandit machine learning algorithms to continuously discover and adapt to the optimal oscillator configuration for your specific instrument and timeframe. This self-learning core is enhanced by a Cognitive Analytical Engine (CAE) that provides market-state intelligence, filtering out low-probability setups before they reach your chart.
The result is a system that doesn't just detect divergences - it understands context, learns from outcomes, and evolves with the market.
What Sets This Apart: Technical Comparison
The TradingView community has many excellent divergence indicators and several claiming "machine learning" capabilities. However, a detailed technical analysis reveals that BPA-ML operates at a fundamentally different level of sophistication.
Machine Learning: Real vs Marketing
Most indicators labeled "ML" or "AI" on TradingView use one of three approaches:
K-Nearest Neighbors (KNN): These indicators find similar historical patterns and assume current price will behave similarly. This is pattern matching, not learning. The system doesn't improve over time or adapt based on outcomes - it simply searches historical data for matches.
Clustering (K-Means): These indicators group volatility or market states into categories (high/medium/low). This is statistical classification, not machine learning. The clusters are recalculated but don't learn which classifications produce better results.
Gaussian Process Regression (GPR): These indicators use kernel weighting to create responsive moving averages. This is advanced curve fitting, not learning. The system doesn't evaluate outcomes or adjust strategy.
BPA-ML's Approach: True Reinforcement Learning
BPA-ML implements multi-armed bandit algorithms - a proven reinforcement learning technique used in clinical trials, A/B testing, and recommendation systems. This is fundamentally different:
Exploration vs Exploitation: The system actively balances trying new configurations (exploration) against using proven winners (exploitation). KNN and clustering don't do this - they simply process current data against historical patterns.
Reward-Based Learning: Every configuration is scored based on actual forward returns, normalized by volatility and clipped to prevent outlier dominance. The system receives a bonus when signals prove profitable. This creates a feedback loop where the indicator literally learns what works for your specific instrument and timeframe.
Four Proven Algorithms: UCB1 (Upper Confidence Bound), Thompson Sampling (Bayesian), Epsilon-Greedy, and Gradient-based learning. Each has different exploration characteristics backed by peer-reviewed research. You're not getting marketing buzzwords - you're getting battle-tested algorithms from academic computer science.
Continuous Adaptation: The learning never stops. As market microstructure evolves, the bandit discovers new optimal configurations. Other "adaptive" indicators recalculate but don't improve - they use the same logic on new data. BPA-ML fundamentally changes which logic it uses based on what's working.
The Configuration Grid: 40 Arms vs Fixed Settings
Traditional divergence indicators use a single oscillator with fixed parameters - typically RSI with length 14. More advanced systems might let you choose between RSI, Stochastic, or CCI, but you're still picking one manually.
BPA-ML maintains a grid of 40 candidate configurations:
- 5 oscillator families (RSI, Stochastic, CCI, MFI, Williams %R)
- 4 length parameters (short, medium, medium-long, long)
- 2 smoothing settings (fast, slow)
The bandit evaluates all 40 continuously and automatically selects the optimal one. When market microstructure changes - say, from trending crypto to ranging forex - the system discovers this and switches configurations without your intervention.
Why This Matters: Markets exhibit different characteristics. Bitcoin on 5-minute charts might favor fast Stochastic (high sensitivity to quick moves), while EUR/USD on 4-hour charts might favor smoothed RSI (filtering noise in steady trends). Manual optimization is guesswork. The bandit discovers these nuances mathematically.
Cognitive Analytical Engine: Beyond Simple Filters
Many divergence indicators include basic filters - perhaps checking if RSI is overbought/oversold or if volume increased. These are single-metric gates that treat all market states the same.
BPA-ML's CAE synthesizes five intelligence layers into a comprehensive market-state assessment:
Trend Conviction Score (TCS): Combines ADX normalization, multi-timeframe EMA alignment, and structural persistence. This isn't just "is ADX above 25?" - it's a weighted composite that captures trending vs ranging regimes with nuance. The threshold itself is adaptive via mini-bandit if enabled.
Directional Momentum Alignment (DMA): ATR-normalized EMA spread creates a regime-aware momentum indicator. The same price move reads differently in high vs low volatility environments. Most indicators ignore this context.
Exhaustion Modeling: Aggregates volume spikes, pin bar formations, extended runs without pullback, and extreme oscillator readings into a unified probability of climax. This multi-factor approach catches exhaustion signals that single metrics miss. High exhaustion can override trend filters - allowing reversal trades at genuine turning points that basic filters would block.
Adversarial Validation: Before approving a bullish signal, the engine quantifies both the bull case AND the bear case. If the opposing case dominates by a threshold, the signal is blocked. This is game-theory applied to trading - most indicators don't check if you're fighting obvious strength in the opposite direction.
Confidence Scoring: Every signal receives a 0-1 quality score blending all CAE components plus divergence strength. You can size positions by confidence - a concept absent in most divergence indicators that treat all signals identically.
Adaptive Parameters: Mini-Bandits
Even the filtering thresholds themselves learn. Most indicators have you set pivot lookback periods, minimum divergence strength, and trend filter strictness manually. These are instrument-specific - what works for one asset fails on another.
BPA-ML's mini-bandits optimize:
- Pivot lookback strictness (balance between catching small structures vs requiring major swings)
- Minimum slope change threshold (filter weak divergences vs allow early entries)
- TCS threshold for trend filtering (how strict counter-trend blocking should be)
These learn the same way the oscillator bandit does - via reward scoring and outcome evaluation. The entire system personalizes to your trading context.
Visual Intelligence: Five Presentation Modes
Most indicators offer basic customization - perhaps choosing colors or line thickness. BPA-ML includes five distinct visual modes, each designed for specific use cases:
Quantum Mode: Renders signals as probability clouds where opacity encodes confidence. High-confidence signals are bold and opaque; low-confidence signals are faint and translucent. This visually guides position sizing in a way that static markers cannot. No other divergence indicator I've found uses confidence-based visual encoding.
Holographic Mode: Multi-layer gradient bands create depth perception showing signal quality zones. Excellent for teaching and presentations.
Cyberpunk Mode: Neon centerlines with particle glow trails. High-contrast for immersive dark-theme trading.
Standard Mode: Professional dashed lines and zones. Clean, presentation-ready.
Minimal Mode: Maximum performance for backtesting and low-powered devices.
The visual system isn't cosmetic - it's part of the decision support infrastructure.
Dashboard: Real-Time Intelligence
Many indicators include dashboards showing current indicator values or basic statistics. BPA-ML's dashboard is a comprehensive control center:
Oscillator Section: Shows which configuration is currently selected, why it's selected (pull statistics, reward scores), and learning progression (warmup, learning, active).
CAE Section: Real-time TCS, DMA, Exhaustion, Adversarial cases, and Confidence scores with visual indicators (emoji-coded states, bar graphs, trend arrows).
Bandit Performance: Algorithm selection, mode (Switch vs Blend), arm distribution, differentiation metrics, learning diagnostics.
State Metrics Grid (Large mode): Normalized readings for trend alignment, momentum, volatility, volume flow, Bollinger position, ROC, directional movement, oscillator bias - all synthesized into a composite market state.
This level of transparency is rare. Most "black box" indicators hide their decision logic. BPA-ML shows you exactly why it's making decisions in real-time, enabling informed discretionary overrides.
Repainting: Complete Transparency
Many divergence indicators don't clearly disclose repainting behavior. BPA-ML offers three explicit timing modes:
Realtime: Shows developing signals on current bar. Repaints by design - this is a preview mode for learning, not for trading.
Confirmed: Signals lock at bar close. Zero repainting. Recommended for live trading.
Pivot Validated: Waits for full pivot confirmation (5+ bar delay). Highest purity, zero repainting, ideal for backtesting divergence quality.
You choose the mode based on your priority - speed vs certainty. The transparency empowers rather than obscures.
Educational Value: Learning Platform
Most indicators are tools - you use them, but you don't learn from them. BPA-ML is designed as a learning platform:
Advisory Mode: Signals always appear, but blocked signals receive warning annotations explaining why CAE would have filtered them. You see the decision logic in action without missing learning opportunities.
Dashboard Transparency: Real-time display of all metrics shows exactly how market state influences decisions.
Comprehensive Documentation: In-indicator tooltips, extensive publishing statement, and user guides explain not just what to click, but why the algorithms work and how to apply them strategically.
Algorithm Comparisons: By trying different bandit algorithms (UCB1 vs Thompson vs Epsilon vs Gradient), you learn the differences between exploration strategies - knowledge applicable beyond trading.
This isn't just a signal generator - it's an educational tool that teaches machine learning concepts, market intelligence interpretation, and systematic decision-making.
What This System Is NOT
To be completely transparent about positioning:
Not a Prediction System: BPA-ML doesn't predict future prices. It identifies structural divergences, assesses current market state, and learns which oscillator configurations historically correlated with better forward returns. The learning is retrospective optimization, not fortune telling.
Not Fully Automated: This is a decision support tool, not a push-button profit machine. You still need to execute trades, manage risk, and apply discretionary judgment. The confidence scores guide position sizing, but you determine final risk allocation.
Not Beginner-Friendly: The sophistication comes with complexity. This system requires understanding of divergence trading, basic machine learning concepts, and market state interpretation. It's designed for intermediate to advanced traders willing to invest time in learning the system.
Not Magic: Even with optimal configurations and intelligent filtering, markets are probabilistic. Losing trades are inevitable. The system improves your probability distribution - it doesn't eliminate risk or guarantee profits.
The Fundamental Difference
Here's the core distinction:
Traditional Divergence Indicators: Detect patterns and hope they work.
"ML" Indicators (KNN/Clustering): Detect patterns and compare to historical similarities.
BPA-ML: Detects patterns, evaluates outcomes, learns which detection methods work best for this specific context, understands market state before suggesting trades, and continuously improves without manual intervention.
The difference isn't incremental - it's architectural. This is trading system infrastructure with embedded intelligence, not just a pattern detector with filters.
Who This Is For
BPA-ML is ideal for traders who:
- Value systematic approaches over discretionary guessing
- Appreciate transparency in decision logic
- Are willing to let systems learn over 200+ bars before judging performance
- Trade liquid instruments on 5-minute to daily timeframes
- Want to learn machine learning concepts through practical application
- Seek professional-grade tools without institutional price tags
It's not ideal for:
- Absolute beginners needing simple plug-and-play systems
- 1-minute scalpers (noise dominates at very low timeframes)
- Traders of illiquid instruments (insufficient data for learning)
- Those seeking magic solutions without understanding methodology
- Impatient optimizers wanting instant perfection
What Makes This Original
The innovation in BPA-ML lies in three interconnected breakthroughs that work synergistically:
1. Multi-Armed Bandit Oscillator Selection
Traditional divergence indicators require manual optimization - you choose RSI with a length of 14, or Stochastic with specific settings, and hope they work. BPA-ML eliminates this guesswork through machine learning. The system maintains a grid of 40 candidate oscillator configurations spanning five oscillator families (RSI, Stochastic, CCI, MFI, Williams %R), four length parameters, and two smoothing settings. Using proven bandit algorithms (UCB1, Thompson Sampling, Epsilon-Greedy, or Gradient-based learning), the system continuously evaluates which configuration produces the best forward returns and automatically switches to the winning arm. This isn't random testing - it's intelligent exploration with exploitation, balancing the discovery of new opportunities against leveraging proven configurations.
2. Cognitive Analytical Engine (CAE)
Divergences occur constantly, but most fail. The CAE solves this by computing a comprehensive market intelligence layer:
Trend Conviction Score (TCS): Synthesizes ADX normalization, multi-timeframe EMA alignment, and structural persistence into a single 0-1 metric that quantifies how strongly the market is trending. When TCS exceeds your threshold, the system knows to avoid counter-trend trades unless other factors override.
Directional Momentum Alignment (DMA): Measures the spread between fast and slow EMAs, normalized by ATR. This creates a regime-aware momentum indicator that adjusts its interpretation based on current volatility.
Exhaustion Modeling: Aggregates volume spikes, pin bar formations, extended runs above/below EMAs, and extreme RSI readings into a probability that the current move is reaching climax. High exhaustion can override trend filters, allowing reversal trades at genuine turning points.
Adversarial Validation: Before approving a bullish signal, the engine quantifies both the bull case (proximity to support EMAs, oversold conditions, volume confirmation) and the bear case (distance to resistance, overbought conditions). If the opposing case dominates by your threshold, the signal is blocked or flagged with a warning.
Confidence Scoring: Every signal receives a 0-1 confidence score blending TCS, momentum magnitude, pullback quality, market state metrics, divergence strength, and adversarial advantage. You can gate signals on minimum confidence, ensuring only high-probability setups reach your attention.
3. Adaptive Parameter Mini-Bandits
Beyond the oscillator itself, BPA-ML uses additional bandit systems to optimize:
- Pivot lookback strictness
- Minimum slope change threshold
- TCS threshold for trend filtering
These parameters are often instrument-specific. The adaptive bandits learn these nuances automatically.
Why These Components Work Together
Each layer serves a specific purpose in the signal generation hierarchy:
Layer 1 - Oscillator Selection: The bandit ensures you're always using the oscillator configuration best suited to current market microstructure.
Layer 2 - Divergence Detection: With the optimal oscillator selected, the engine scans for structural divergences using confirmed pivots.
Layer 3 - CAE Filtering: Raw divergences are validated against market intelligence.
Layer 4 - Spacing & Timing: Quality signals need proper spacing to avoid over-trading.
This isn't a random collection of indicators. It's a decision pipeline where each stage refines signal quality, and the machine learning ensures the entire system stays calibrated to your specific trading context.
Core Components - Deep Dive
Divergence Engine
The foundation is a dual-mode divergence detector:
Regular Divergence: Price makes a higher high while oscillator makes a lower high (bearish), or price makes a lower low while oscillator makes a higher low (bullish). These signal potential reversals.
Hidden Divergence: Price makes a lower high while oscillator makes a higher high (bullish continuation), or price makes a higher low while oscillator makes a lower low (bearish continuation). These signal trend strength.
Pivots are confirmed using symmetric lookback periods. Divergence strength is quantified via slope separation between price and oscillator.
Signal Timing Modes
Realtime (live preview): Shows potential signals on current bar. Repaints by design. Use for learning only.
Confirmed (1-bar delay): Signals lock at bar close. No repainting. Recommended for live trading.
Pivot Validated: Waits for full pivot confirmation (5+ bar delay). Highest purity, best for backtesting.
Multi-Armed Bandit Algorithms
UCB1: Optimism under uncertainty. Excellent balance for most use cases.
Thompson Sampling: Bayesian approach with smooth exploration. Great for long-term adaptation.
Epsilon-Greedy: Simple exploitation with random exploration. Easy to understand.
Gradient-based: Lightweight weight adjustment based on rewards. Fast and efficient.
Bandit Operating Modes
Switch Mode: Uses top-ranked arm directly. Maximum amplitude, crisp signals.
Blend Mode: Softmax mixture with dominant-arm preservation. Ensemble stability while maintaining amplitude for overbought/oversold crossings.
How to Use This Indicator
Initial Setup
1. Apply BPA-ML to your chart
2. Select visual mode (Minimal/Standard/Holographic/Cyberpunk/Quantum)
3. Choose signal timing - "Confirmed (1-bar delay)" for live trading
4. Set Oscillator Type to "Auto (ML)" and enable it
5. Select bandit algorithm - UCB1 recommended
6. Choose Blend mode with temperature 0.4-0.5
CAE Configuration
Start with "Advisory" mode to learn the system. Signals appear with warnings if CAE would have blocked them.
Switch to "Filtering" mode when comfortable - CAE actively blocks low-quality signals.
Enable the three primary filters:
- Strong Trend Filter
- Adversarial Validation
- Confidence Gating
Parameter Guidance by Trading Style
Scalping (1-5 minute charts):
- Algorithm: Thompson or UCB1
- Mode: Blend (temp 0.3-0.4)
- Horizon: 8-12 bars
- Min Confidence: 0.30-0.40
- TCS Threshold: 0.70-0.80
- Spacing: 8-12 any, 16-24 same-side
Day Trading (15min-1H charts):
- Algorithm: UCB1
- Mode: Blend (temp 0.4-0.6)
- Horizon: 12-24 bars
- Min Confidence: 0.35-0.45
- TCS Threshold: 0.80-0.85
- Spacing: 12-20 any, 20-30 same-side
Swing Trading (4H-Daily charts):
- Algorithm: UCB1 or Thompson
- Mode: Blend (temp 0.6-1.0) or Switch
- Horizon: 20-40 bars
- Min Confidence: 0.40-0.55
- TCS Threshold: 0.85-0.95
- Spacing: 20-40 any, 30-60 same-side
Signal Interpretation
Bullish Signals: Green markers below price. Enter long when detected.
Bearish Signals: Red markers above price. Enter short when detected.
Blocked Signals: Orange X markers show filtered signals (Advisory mode).
Confidence Rings: Single ring at 50%+ confidence, double at 70%+. Use for position sizing.
Dashboard Metrics
Oscillator Section: Shows active type, value, state, and parameters.
Cognitive Engine:
- TCS: 0.80+ indicates strong trend
- DMA: Momentum direction and strength
- Exhaustion: 0.75+ warns of reversal
- Bull/Bear Case: Adversarial scoring
- Differential: Net directional advantage
Bandit Performance: Shows algorithm, mode, selected configuration, and learning diagnostics.
Visual Zones
- Bullish Zone: Blue/cyan tint - favorable for longs
- Bearish Zone: Red/magenta tint - favorable for shorts
- Exhaustion Zone: Yellow warning - reduce sizing
Visual Mode Selection
Minimal: Clean triangles, maximum performance
Standard: Dashed lines with zones, professional presentation
Holographic: Gradient bands, excellent for teaching
Cyberpunk: Neon glow trails, high contrast
Quantum: Probability cloud with confidence-based opacity
Calculation Methodology
Oscillator Computation
For each bandit arm: calculate base oscillator, apply smoothing, normalize to 0-100.
Switch mode: use top arm directly.
Blend mode: softmax mixture blended with dominant arm (70/30) to preserve amplitude.
Divergence Detection
1. Identify price and oscillator pivots using symmetric periods
2. Store recent pivots with bar indices
3. Scan for slope disagreements within lookback range
4. Require minimum slope separation
5. Classify as regular or hidden divergence
6. Compute strength score
CAE Metrics
TCS: 0.35×ADX + 0.35×structural + 0.30×alignment
DMA: (EMA21 - EMA55) / ATR14
Exhaustion: Aggregates volume, divergence, RSI extremes, pins, extended runs
Confidence: 0.30×TCS + 0.25×|DMA| + 0.20×pullback + 0.15×state + 0.10×divergence + adversarial
Bandit Rewards
Every horizon period: compute log return normalized by ATR, clip to ±0.5, bonus if signal was positive. Update arm statistics per algorithm.
Ideal Market Conditions
Best Performance:
- Liquid instruments with clear structure
- Trending markets with consolidations
- 5-minute to daily timeframes
- Consistent volume and participation
Learning Requirements:
- Minimum 200 bars for warmup
- Ideally 500-1000 bars for full confidence
- Performance improves as bandit accumulates data
Challenging Conditions:
- Extremely low liquidity
- Very low timeframes (1-minute or below)
- Extended sideways consolidation
- Fundamentally-driven gap markets
Dashboard Interpretation Guide
TCS:
- 0.00-0.50: Weak trend, reversals viable
- 0.50-0.75: Moderate trend, mixed approach
- 0.75-0.85: Strong trend, favor continuation
- 0.85-1.00: Very strong trend, counter-trend high risk
DMA:
- -2.0 to -1.0: Strong bearish
- -0.5 to 0.5: Neutral
- 1.0 to 2.0: Strong bullish
Exhaustion:
- 0.00-0.50: Fresh move
- 0.50-0.75: Mature, watch for reversals
- 0.75-0.85: High exhaustion
- 0.85-1.00: Critical, reversal imminent
Confidence:
- 0.00-0.30: Low quality
- 0.30-0.50: Moderate quality
- 0.50-0.70: High quality
- 0.70-1.00: Premium quality
Common Questions
Why no signals?
- Blend mode: lower temperature to 0.3-0.5
- Loosen OB/OS to 65/35
- Lower min confidence to 0.35
- Reduce spacing requirements
- Use Confirmed instead of Pivot Validated
Why frequent oscillator switching?
- Normal during warmup (first 200+ bars)
- After warmup: may indicate regime shifting market
- Lower temperature in Blend mode
- Reduce learning rate or epsilon
Blend vs Switch?
Use Switch for backtesting and maximum exploitation.
Use Blend for live trading with temperature 0.3-0.5 for stability.
Recalibration frequency?
Never needed. System continuously adapts via bandit learning and weight decay.
Risk Management Integration
Position Sizing:
- 0.30-0.50 confidence: 0.5-1.0% risk
- 0.50-0.70 confidence: 1.0-1.5% risk
- 0.70+ confidence: 1.5-2.0% risk (maximum)
Stop Placement:
- Reversals: beyond divergence pivot plus 1.0-1.5×ATR
- Continuations: beyond recent swing opposite direction
Targets:
- Primary: 2-3×ATR from entry
- Scale at interim levels
- Trail after 1.5×ATR in profit
Important Disclaimers
BPA-ML is an advanced technical analysis tool for identifying high-probability divergence patterns and assessing market state. It is not a complete trading system. Machine learning components adapt to historical patterns, which does not guarantee future performance. Proper risk management, position sizing, and additional confirmation methods are essential. No indicator eliminates losing trades.
Backtesting results may differ from live performance due to execution factors and dynamic bandit learning. Always validate on demo before committing real capital. CAE filtering reduces but does not eliminate false signals. Market conditions change rapidly. Use appropriate stops and never risk excessive capital on any single trade.
— Dskyz, Trade with insight. Trade with anticipation.

Crypto Breadth Engine [alex975]
A normalized crypto market breadth indicator with a customizable 40 coin input panel — revealing whether rallies are broad and healthy across major coins and altcoins or led by only a few.
📊 Overview
The Crypto Breadth Engine measures the real participation strength of the crypto market by analyzing the direction of the 40 largest cryptocurrencies by market capitalization.
⚙️ How It Works
Unlike standard breadth tools that only count assets above a moving average, this indicator measures actual price direction:
+1 if a coin closes higher, –1 if lower, 0 if unchanged.
The total forms a Breadth Line, statistically normalized using standard deviation to maintain consistent readings across timeframes and volatility conditions.
🧩 Dynamic Input Mask
All 40 cryptocurrencies are fully editable via the input panel, allowing users to easily replace or customize the basket (Top 40, Layer-1s, DeFi, Meme Coins, AI Tokens, etc.) without touching the code.
This flexibility keeps the indicator aligned with the evolving crypto market.
🧭 Trend Bias
The indicator classifies market structure as Bullish, Neutral, or Bearish, based on how the Breadth Line aligns with its moving averages (10, 20, 50).
💡 Dashboard
A compact on-chart table displays in real time:
• Positive and negative coins
• Participation percentage
• Current trend bias
🔍 Interpretation
• Rising breadth → broad, healthy market expansion
• Falling breadth → narrowing participation and structural weakness
Ideal for TOTAL, TOTAL3, or custom crypto baskets on 1D,1W.
Developed by alex975 – Version 1.0 (2025).
-------------------------------------------------------------------------------------
🇮🇹 Versione Italiana
📊 Panoramica
Il Crypto Breadth Engine misura la partecipazione reale del mercato crypto, analizzando la direzione delle 40 principali criptovalute per capitalizzazione.
Non si limita a contare quante coin sono sopra una media mobile, ma calcola la variazione effettiva del prezzo:
+1 se sale, –1 se scende, 0 se invariato.
La somma genera una Breadth Line normalizzata statisticamente, garantendo letture coerenti su diversi timeframe e fasi di volatilità.
🧩 Mascherina dinamica
L’indicatore include una mascherina d’input interattiva che consente di modificare o sostituire liberamente i 40 ticker analizzati (Top 40, Layer-1, DeFi, Meme Coin, ecc.) senza intervenire nel codice.
Questo lo rende sempre aggiornato e adattabile all’evoluzione del mercato crypto.
⚙️ Funzionamento e Trend Bias
Classifica automaticamente il mercato come Bullish, Neutral o Bearish in base alla relazione tra la breadth e le medie mobili (10, 20, 50 periodi).
💡 Dashboard
Una tabella compatta mostra in tempo reale:
• Numero di coin positive e negative
• Percentuale di partecipazione
• Stato attuale del trend
🔍 Interpretazione
• Breadth in crescita → mercato ampio e trend sano
• Breadth in calo → partecipazione ridotta e concentrazione su pochi asset
Ideale per analizzare TOTAL, TOTAL3 o panieri personalizzati di crypto.
Funziona su timeframe 1D, 4H, 1W.
Sviluppato da alex975 – Versione 1.0 (2025).


【SY】AI量化指标Strategy Description
This strategy is designed to capture market momentum through structured price behavior and dynamic risk management. It seeks to identify moments when the market transitions between accumulation and expansion phases, entering positions that align with the prevailing directional bias.
The approach prioritizes disciplined execution, precise trade timing, and consistent risk-to-reward balance. Position management follows a clear set of predefined conditions to reduce emotional interference and enhance long-term performance stability.
Emphasis is placed on adaptability rather than prediction — the strategy reacts to changing market structure, allowing profits to grow while protecting capital through controlled exit conditions. It performs best in trending or transitional environments where volatility supports directional continuation.

Luxy BIG beautiful Dynamic ORBThis is an advanced Opening Range Breakout (ORB) indicator that tracks price breakouts from the first 5, 15, 30, and 60 minutes of the trading session. It provides complete trade management including entry signals, stop-loss placement, take-profit targets, and position sizing calculations.
The ORB strategy is based on the concept that the opening range of a trading session often acts as support/resistance, and breakouts from this range tend to lead to significant moves.
What Makes This Different?
Most ORB indicators simply draw horizontal lines and leave you to figure out the rest. This indicator goes several steps further:
Multi-Stage Tracking
Instead of just one ORB timeframe, this tracks FOUR simultaneously (5min, 15min, 30min, 60min). Each stage builds on the previous one, giving you multiple trading opportunities throughout the session.
Active Trade Management
When a breakout occurs, the indicator automatically calculates and displays entry price, stop-loss, and multiple take-profit targets. These lines extend forward and update in real-time until the trade completes.
Cycle Detection
Unlike indicators that only show the first breakout, this tracks the complete cycle: Breakout → Retest → Re-breakout. You can see when price returns to test the ORB level after breaking out (potential re-entry).
Failed Breakout Warning
If price breaks out but quickly returns inside the range (within a few bars), the label changes to "FAILED BREAK" - warning you to exit or avoid the trade.
Position Sizing Calculator
Built-in risk management that tells you exactly how many shares to buy based on your account size and risk tolerance. No more guessing or manual calculations.
Advanced Filtering
Optional filters for volume confirmation, trend alignment, and Fair Value Gaps (FVG) to reduce false signals and improve win rate.
Core Features Explained
### 1. Multi-Stage ORB Levels
The indicator builds four separate Opening Range levels:
ORB 5 - First 5 minutes (fastest signals, most volatile)
ORB 15 - First 15 minutes (balanced, most popular)
ORB 30 - First 30 minutes (slower, more reliable)
ORB 60 - First 60 minutes (slowest, most confirmed)
Each level is drawn as a horizontal range on your chart. As time progresses, the ranges expand to include more price action. You can enable or disable any stage and assign custom colors to each.
How it works: During the opening minutes, the indicator tracks the highest high and lowest low. Once the time period completes, those levels become your ORB high and low for that stage.
### 2. Breakout Detection
When price closes outside the ORB range, a label appears:
BREAK UP (green label above price) - Price closed above ORB High
BREAK DOWN (red label below price) - Price closed below ORB Low
The label shows which ORB stage triggered (ORB5, ORB15, etc.) and the cycle number if tracking multiple breakouts.
Important: Signals appear on bar close only - no repainting. What you see is what you get.
### 3. Retest Detection
After price breaks out and moves away, if it returns to test the ORB level, a "RETEST" label appears (orange). This indicates:
The original breakout level is now acting as support/resistance
Potential re-entry opportunity if you missed the first breakout
Confirmation that the level is significant
The indicator requires price to move a minimum distance away before considering it a valid retest (configurable in settings).
### 4. Failed Breakout Detection
If price breaks out but returns inside the ORB range within a few bars (before the breakout is "committed"), the original label changes to "FAILED BREAK" in orange.
This warns you:
The breakout lacked conviction
Consider exiting if already in the trade
Wait for better setup
Committed Breakout: The indicator tracks how many bars price stays outside the range. Only after staying outside for the minimum number of bars does it become a committed breakout that can be retested.
### 5. TP/SL Lines (Trade Management)
When a breakout occurs, colored horizontal lines appear showing:
Entry Line (cyan for long, orange for short) - Your entry price (the ORB level)
Stop Loss Line (red) - Where to exit if trade goes against you
TP1, TP2, TP3 Lines (same color as entry) - Profit targets at 1R, 2R, 3R
These lines extend forward as new bars form, making it easy to track your trade. When a target is hit, the line turns green and the label shows a checkmark.
Lines freeze (stop updating) when:
Stop loss is hit
The final enabled take-profit is hit
End of trading session (optional setting)
### 6. Position Sizing Dashboard
The dashboard (bottom-left corner by default) shows real-time information:
Current ORB stage and range size
Breakout status (Inside Range / Break Up / Break Down)
Volume confirmation (if filter enabled)
Trend alignment (if filter enabled)
Entry and Stop Loss prices
All enabled Take Profit levels with percentages
Risk/Reward ratio
Position sizing: Max shares to buy and total risk amount
Position Sizing Example:
If your account is $25,000 and you risk 1% per trade ($250), and the distance from entry to stop loss is $0.50, the calculator shows you can buy 500 shares (250 / 0.50 = 500).
### 7. FVG Filter (Fair Value Gap)
Fair Value Gaps are price inefficiencies - gaps left by strong momentum where one candle's high doesn't overlap with a previous candle's low (or vice versa).
When enabled, this filter:
Detects bullish and bearish FVGs
Draws semi-transparent boxes around these gaps
Only allows breakout signals if there's an FVG near the breakout level
Why this helps: FVGs indicate institutional activity. Breakouts through FVGs tend to be stronger and more reliable.
Proximity setting: Controls how close the FVG must be to the ORB level. 2.0x means the breakout can be within 2 times the FVG size - a reasonable default.
### 8. Volume & Trend Filters
Volume Filter:
Requires current volume to be above average (customizable multiplier). High volume breakouts are more likely to sustain.
Set minimum multiplier (e.g., 1.5x = 50% above average)
Set "strong volume" multiplier (e.g., 2.5x) that bypasses other filters
Dashboard shows current volume ratio
Trend Filter:
Only shows breakouts aligned with a higher timeframe trend. Choose from:
VWAP - Price above/below volume-weighted average
EMA - Price above/below exponential moving average
SuperTrend - ATR-based trend indicator
Combined modes (VWAP+EMA, VWAP+SuperTrend) for stricter filtering
### 9. Pullback Filter (Advanced)
Purpose:
Waits for price to pull back slightly after initial breakout before confirming the signal.
This reduces false breakouts from immediate reversals.
How it works:
- After breakout is detected, indicator waits for a small pullback (default 2%)
- Once pullback occurs AND price breaks out again, signal is confirmed
- If no pullback within timeout period (5 bars), signal is issued anyway
Settings:
Enable Pullback Filter: Turn this filter on/off
Pullback %: How much price must pull back (2% is balanced)
Timeout (bars): Max bars to wait for pullback (5 is standard)
When to use:
- Choppy markets with many fake breakouts
- When you want higher quality signals
- Combine with Volume filter for maximum confirmation
Trade-off:
- Better signal quality
- May miss some valid fast moves
- Slight entry delay
How to Use This Indicator
### For Beginners - Simple Setup
Add the indicator to your chart (5-minute or 15-minute timeframe recommended)
Leave all default settings - they work well for most stocks
Watch for BREAK UP or BREAK DOWN labels to appear
Check the dashboard for entry, stop loss, and targets
Use the position sizing to determine how many shares to buy
Basic Trading Plan:
Wait for a clear breakout label
Enter at the ORB level (or next candle open if you're late)
Place stop loss where the red line indicates
Take profit at TP1 (50% of position) and TP2 (remaining 50%)
### For Advanced Traders - Customized Setup
Choose which ORB stages to track (you might only want ORB15 and ORB30)
Enable filters: Volume (stocks) or Trend (trending markets)
Enable FVG filter for institutional confirmation
Set "Track Cycles" mode to catch retests and re-breakouts
Customize stop loss method (ATR for volatile stocks, ORB% for stable ones)
Adjust risk per trade and account size for accurate position sizing
Advanced Strategy Example:
Enable ORB15 only (disable others for cleaner chart)
Turn on Volume filter at 1.5x with Strong at 2.5x
Enable Trend filter using VWAP
Set Signal Mode to "Track Cycles" with Max 3 cycles
Wait for aligned breakouts (Volume + Trend + Direction)
Enter on retest if you missed the initial break
### Timeframe Recommendations
5-minute chart: Scalping, very active trading, crypto
15-minute chart: Day trading, balanced approach (most popular)
30-minute chart: Swing entries, less screen time
60-minute chart: Position trading, longer holds
The indicator works on any intraday timeframe, but ORB is fundamentally a day trading strategy. Daily charts don't make sense for ORB.
DEFAULT CONFIGURATION
ON by Default:
• All 4 ORB stages (5/15/30/60)
• Breakout Detection
• Retest Labels
• All TP levels (1/1.5/2/3)
• TP/SL Lines (Detailed mode)
• Dashboard (Bottom Left, Dark theme)
• Position Size Calculator
OFF by Default (Optional Filters):
• FVG Filter
• Pullback Filter
• Volume Filter
• Trend Filter
• HTF Bias Check
• Alerts
Recommended for Beginners:
• Leave all defaults
• Session Mode: Auto-Detect
• Signal Mode: Track Cycles
• Stop Method: ATR
• Add Volume Filter if trading stocks
Recommended for Advanced:
• Enable ORB15 + ORB30 only (disable 5 & 60)
• Enable: Volume + Trend + FVG
• Signal Mode: Track Cycles, Max 3
• Stop Method: ATR or Safer
• Enable HTF Daily bias check
## Settings Guide
The settings are organized into logical groups. Here's what each section controls:
### ORB COLORS Section
Show Edge Labels: Display "ORB 5", "ORB 15" labels at the right edge of the levels
Background: Fill the area between ORB high/low with color
Transparency: How see-through the background is (95% is nearly invisible)
Enable ORB 5/15/30/60: Turn each stage on or off individually
Colors: Assign colors to each ORB stage for easy identification
### SESSION SETTINGS Section
Session Mode: Choose trading session (Auto-Detect works for most instruments)
Custom Session Hours: Define your own hours if needed (format: HHMM-HHMM)
Auto-Detect uses the instrument's natural hours (stocks use exchange hours, crypto uses 24/7).
### BREAKOUT DETECTION Section
Enable Breakout Detection: Master switch for signals
Show Retest Labels: Display retest signals
Label Size: Visual size for all labels (Small recommended)
Enable FVG Filter: Require Fair Value Gap confirmation
Show FVG Boxes: Display the gap boxes on chart
Signal Mode: "First Only" = one signal per direction per day, "Track Cycles" = multiple signals
Max Cycles: How many breakout-retest cycles to track (6 is balanced)
Breakout Buffer: Extra distance required beyond ORB level (0.1-0.2% recommended)
Min Distance for Retest: How far price must move away before retest is valid (2% recommended)
Min Bars Outside ORB: Bars price must stay outside for committed breakout (2 is balanced)
### TARGETS & RISK Section
Enable Targets & Stop-Loss: Calculate and show trade management
TP1/TP2/TP3 checkboxes: Select which profit targets to display
Stop Method: How to calculate stop loss placement
- ATR: Based on volatility (best for most cases)
- ORB %: Fixed % of ORB range
- Swing: Recent swing high/low
- Safer: Widest of all methods
ATR Length & Multiplier: Controls ATR stop distance (14 period, 1.5x is standard)
ORB Stop %: Percentage beyond ORB for stop (20% is balanced)
Swing Bars: Lookback period for swing high/low (3 is recent)
### TP/SL LINES Section
Show TP/SL Lines: Display horizontal lines on chart
Label Format: "Short" = minimal text, "Detailed" = shows prices
Freeze Lines at EOD: Stop extending lines at session close
### DASHBOARD Section
Show Info Panel: Display the metrics dashboard
Theme: Dark or Light colors
Position: Where to place dashboard on chart
Toggle rows: Show/hide specific information rows
Calculate Position Size: Enable the position sizing calculator
Risk Mode: Risk fixed $ amount or % of account
Account Size: Your total trading capital
Risk %: Percentage to risk per trade (0.5-1% recommended)
### VOLUME FILTER Section
Enable Volume Filter: Require volume confirmation
MA Length: Average period (20 is standard)
Min Volume: Required multiplier (1.5x = 50% above average)
Strong Volume: Multiplier that bypasses other filters (2.5x)
### TREND FILTER Section
Enable Trend Filter: Require trend alignment
Trend Mode: Method to determine trend (VWAP is simple and effective)
Custom EMA Length: If using EMA mode (50 for swing, 20 for day trading)
SuperTrend settings: Period and Multiplier if using SuperTrend mode
### HIGHER TIMEFRAME Section
Check Daily Trend: Display higher timeframe bias in dashboard
Timeframe: What TF to check (D = daily, recommended)
Method: Price vs MA (stable) or Candle Direction (reactive)
MA Period: EMA length for Price vs MA method (20 is balanced)
Min Strength %: Minimum strength threshold for HTF bias to be considered
- For "Price vs MA": Minimum distance (%) from moving average
- For "Candle Direction": Minimum candle body size (%)
- 0.5% is balanced - increase for stricter filtering
- Lower values = more signals, higher values = only strong trends
### ALERTS Section
Enable Alerts: Master switch (must be ON to use any alerts)
Breakout Alerts: Notify on ORB breakouts
Retest Alerts: Notify when price retests after breakout
Failed Break Alerts: Notify on failed breakouts
Stage Complete Alerts: Notify when each ORB stage finishes forming
After enabling desired alert types, click "Create Alert" button, select this indicator, choose "Any alert() function call".
## Tips & Best Practices
### General Trading Tips
ORB works best on liquid instruments (stocks with good volume, major crypto pairs)
First hour of the session is most important - that's when ORB is forming
Breakouts WITH the trend have higher success rates - use the trend filter
Failed breakouts are common - use the "Min Bars Outside" setting to filter weak moves
Not every day produces good ORB setups - be patient and selective
### Position Sizing Best Practices
Never risk more than 1-2% of your account on a single trade
Use the built-in calculator - don't guess your position size
Update your account size monthly as it grows
Smaller accounts: use $ Amount mode for simplicity
Larger accounts: use % of Account mode for scaling
### Take Profit Strategy
Most traders use: 50% at TP1, 50% at TP2
Aggressive: Hold through TP1 for TP2 or TP3
Conservative: Full exit at TP1 (1:1 risk/reward)
After TP1 hits, consider moving stop to breakeven
TP3 rarely hits - only on strong trending days
### Filter Combinations
Maximum Quality: Volume + Trend + FVG (fewest signals, highest quality)
Balanced: Volume + Trend (good quality, reasonable frequency)
Active Trading: No filters or Volume only (many signals, lower quality)
Trending Markets: Trend filter essential (indices, crypto)
Range-Bound: Volume + FVG (avoid trend filter)
### Common Mistakes to Avoid
Chasing breakouts - wait for the bar to close, don't FOMO into wicks
Ignoring the stop loss - always use it, move it manually if needed
Over-leveraging - the calculator shows MAX shares, you can buy less
Trading every signal - quality > quantity, use filters
Not tracking results - keep a journal to see what works for YOU
## Pros and Cons
### Advantages
Complete all-in-one solution - from signal to position sizing
Multiple timeframes tracked simultaneously
Visual clarity - easy to see what's happening
Cycle tracking catches opportunities others miss
Built-in risk management eliminates guesswork
Customizable filters for different trading styles
No repainting - what you see is locked in
Works across multiple markets (stocks, forex, crypto)
### Limitations
Intraday strategy only - doesn't work on daily charts
Requires active monitoring during first 1-2 hours of session
Not suitable for after-hours or extended sessions by default
Can produce many signals in choppy markets (use filters)
Dashboard can be overwhelming for complete beginners
Performance depends on market conditions (trends vs ranges)
Requires understanding of risk management concepts
### Best For
Day traders who can watch the first 1-2 hours of market open
Traders who want systematic entry/exit rules
Those learning proper position sizing and risk management
Active traders comfortable with multiple signals per day
Anyone trading liquid instruments with clear sessions
### Not Ideal For
Swing traders holding multi-day positions
Set-and-forget / passive investors
Traders who can't watch market open
Complete beginners unfamiliar with trading concepts
Low volume / illiquid instruments
## Frequently Asked Questions
Q: Why are no signals appearing?
A: Check that you're on an intraday timeframe (5min, 15min, etc.) and that the current time is within your session hours. Also verify that "Enable Breakout Detection" is ON and at least one ORB stage is enabled. If using filters, they might be blocking signals - try disabling them temporarily.
Q: What's the best ORB stage to use?
A: ORB15 (15 minutes) is most popular and balanced. ORB5 gives faster signals but more noise. ORB30 and ORB60 are slower but more reliable. Many traders use ORB15 + ORB30 together.
Q: Should I enable all the filters?
A: Start with no filters to see all signals. If too many false signals, add Volume filter first (stocks) or Trend filter (trending markets). FVG filter is most restrictive - use for maximum quality but fewer signals.
Q: How do I know which stop loss method to use?
A: ATR works for most cases - it adapts to volatility. Use ORB% if you want predictable stop placement. Swing is for respecting chart structure. Safer gives you the most room but largest risk.
Q: Can I use this for swing trading?
A: Not really - ORB is fundamentally an intraday strategy. The ranges reset each day. For swing trading, look at weekly support/resistance or moving averages instead.
Q: Why do TP/SL lines disappear sometimes?
A: Lines freeze (stop extending) when: stop loss is hit, the last enabled take-profit is hit, or end of session arrives (if "Freeze at EOD" is enabled). This is intentional - the trade is complete.
Q: What's the difference between "First Only" and "Track Cycles"?
A: "First Only" shows one breakout UP and one DOWN per day maximum - clean but might miss opportunities. "Track Cycles" shows breakout-retest-rebreak sequences - more signals but busier chart.
Q: Is position sizing accurate for options/forex?
A: The calculator is designed for shares (stocks). For options, ignore the share count and use the risk amount. For forex, you'll need to adapt the lot size calculation manually.
Q: How much capital do I need to use this?
A: The indicator works for any account size, but practical day trading typically requires $25,000 in the US due to Pattern Day Trader rules. Adjust the "Account Size" setting to match your capital.
Q: Can I backtest this strategy?
A: This is an indicator, not a strategy script, so it doesn't have built-in backtesting. You can visually review historical signals or code a strategy script using similar logic.
Q: Why does the dashboard show different entry price than the breakout label?
A: If you're looking at an old breakout, the ORB levels may have changed when the next stage completed. The dashboard always shows the CURRENT active range and trade setup.
Q: What's a good win rate to expect?
A: ORB strategies typically see 40-60% win rate depending on market conditions and filters used. The strategy relies on positive risk/reward ratios (2:1 or better) to be profitable even with moderate win rates.
Q: Does this work on crypto?
A: Yes, but crypto trades 24/7 so you need to define what "session start" means. Use Session Mode = Custom and set your preferred daily reset time (e.g., 0000-2359 UTC).
## Credits & Transparency
### Development
This indicator was developed with the assistance of AI technology to implement complex ORB trading logic.
The strategy concept, feature specifications, and trading logic were designed by the publisher. The implementation leverages modern development tools to ensure:
Clean, efficient, and maintainable code
Comprehensive error handling and input validation
Detailed documentation and user guidance
Performance optimization
### Trading Concepts
This indicator implements several public domain trading concepts:
Opening Range Breakout (ORB): Trading strategy popularized by Toby Crabel, Mark Fisher and many more talanted traders.
Fair Value Gap (FVG): Price imbalance concept from ICT methodology
SuperTrend: ATR-based trend indicator using public formula
Risk/Reward Ratio: Standard risk management principle
All mathematical formulas and technical concepts used are in the public domain.
### Pine Script
Uses standard TradingView built-in functions:
ta.ema(), ta.atr(), ta.vwap(), ta.highest(), ta.lowest(), request.security()
No external libraries or proprietary code from other authors.
## Disclaimer
This indicator is provided for educational and informational purposes only. It is not financial advice.
Trading involves substantial risk of loss and is not suitable for every investor. Past performance shown in examples is not indicative of future results.
The indicator provides signals and calculations, but trading decisions are solely your responsibility. Always:
Test strategies on paper before using real money
Never risk more than you can afford to lose
Understand that all trading involves risk
Consider seeking advice from a licensed financial advisor
The publisher makes no guarantees regarding accuracy, profitability, or performance. Use at your own risk.
---
Version: 3.0
Pine Script Version: v6
Last Updated: October 2024
For support, questions, or suggestions, please comment below or send a private message.
---
Happy trading, and remember: consistent risk management beats perfect entry timing every time.

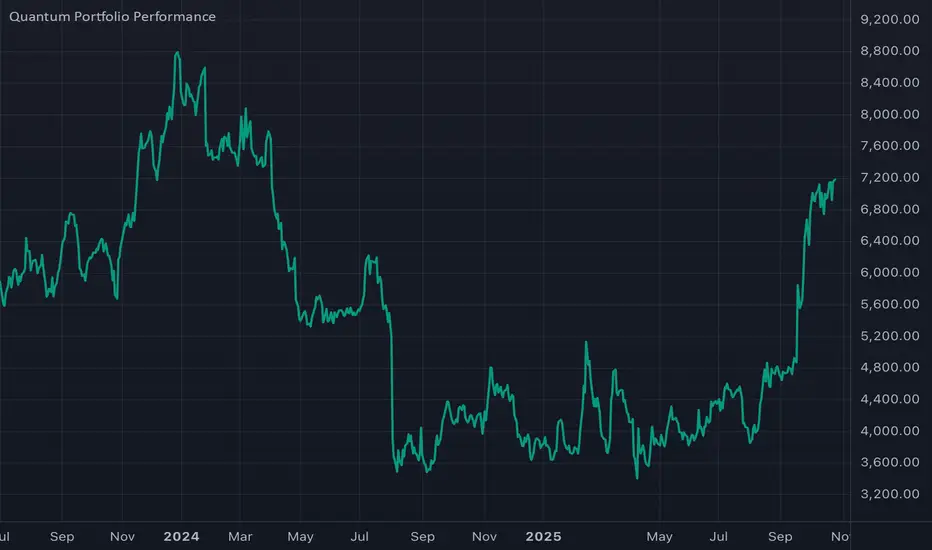
Thematic Portfolio: Quantum Computing & Core TechThis indicator tracks the aggregated performance of a curated thematic portfolio representing the Quantum Computing & Core Technology sector.
It combines leading equities and ETFs with predefined weights to reflect a diversified exposure across quantum hardware, AI infrastructure, and semiconductor backbones.
Composition:
Stocks: Rigetti (RGTI), IonQ (IONQ), D-Wave (QBTS), Palantir (PLTR), Intel (INTC), Arqit (ARQQ)
ETFs: BUG, QTUM, SOXX, IHAK
Methodology:
Each component’s normalized performance is weighted according to its strategic importance within the theme (R&D intensity, infrastructure leverage, and hardware dependence). The indicator dynamically aggregates the weighted series to visualize the cumulative return of the quantum computing ecosystem versus traditional benchmarks.
Intended use:
Compare thematic returns vs. S&P 500 or NASDAQ
Identify macro inflection points in the quantum tech narrative
Backtest thematic exposure strategies or structure twin-win / delta-one certificates
Note: This script is for analytical and educational purposes only and does not constitute financial advice.
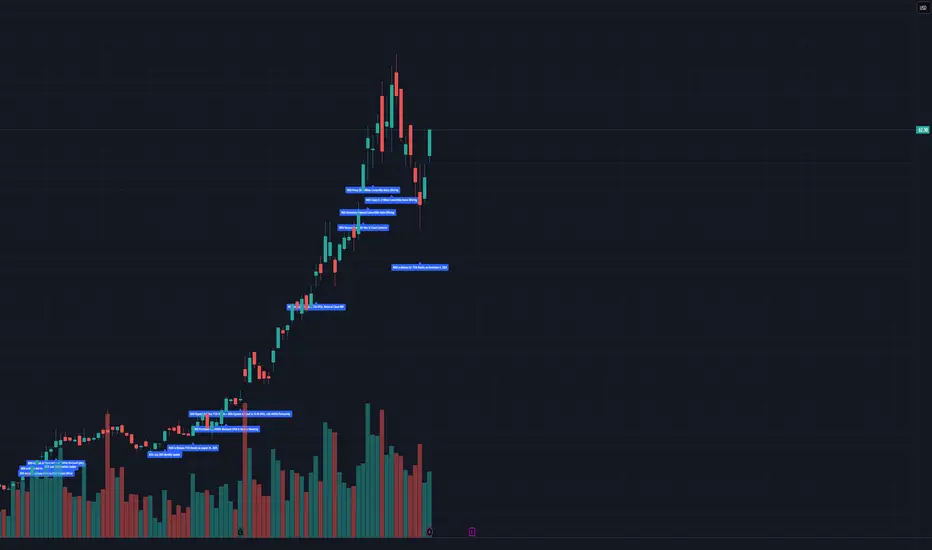
IREN PR Markers IREN Press Release Marker
This indicator plots the dates and titles of official Iris Energy (IREN) press releases directly on the price chart.
All events were sourced from IREN’s Investor Relations News & Updates page and include major company announcements such as data-center expansions, GPU purchases, financing deals, and AI-cloud milestones.
You can overlay it on NASDAQ:IREN or any other chart (e.g., Bitcoin, NASDAQ, or S&P 500) to visualize how IREN’s corporate news aligns with broader market moves.
Features
Automatically marks each press release with a labeled event below the candle.
Combines multiple announcements from the same day into one label.
Works on any timeframe (best viewed on Daily).
All data pulled directly from IREN’s public investor website.
Use Cases
Correlate IREN’s announcements with stock, crypto, or macro price reactions.
Identify historical patterns around GPU orders, expansions, or earnings reports.
Great for traders studying news-driven volatility and timing.
IREN Press Release Markers through Oct 26th 2025IREN Press Release Marker
This indicator plots the dates and titles of official Iris Energy (IREN) press releases directly on the daily price chart.
All events were sourced from IREN’s Investor Relations News & Updates page and include major company announcements such as data-center expansions, GPU purchases, financing deals, and AI-cloud milestones.
You can overlay it on IREN or any other chart (e.g., Bitcoin, NASDAQ, or S&P 500) to visualize how IREN’s corporate news aligns with broader market moves.
Features
Automatically marks each press release with a labeled event below the candle.
Combines multiple announcements from the same day into one label.
Works on any timeframe (only viewed on Daily).
All data pulled directly from IREN’s public investor website.
Use Cases
Correlate IREN’s announcements with stock, crypto, or macro price reactions.
Identify historical patterns around GPU orders, expansions, or earnings reports.
Great for traders studying news-driven volatility and timing.

Trading Toolkit - Comprehensive AnalysisTrading Toolkit – Comprehensive Analysis
A unified trading analysis toolkit with four sections:
📊 Company Info
Fundamentals, market cap, sector, and earnings countdown.
📅 Performance
Date‑range analysis with key metrics.
🎯 Market Sentiment
CNN‑style Fear & Greed Index (7 components) + 150‑SMA positioning.
🛡️ Risk Levels
ATR/MAD‑based stop‑loss and take‑profit calculations.
Key Features
CNN‑style Fear & Greed approximation using:
Momentum: S&P 500 vs 125‑DMA
Price Strength: NYSE 52‑week highs vs lows
Market Breadth: McClellan Volume Summation (Up/Down volume)
Put/Call Ratio: 5‑day average (inverted)
Volatility: VIX vs 50‑DMA (inverted)
Safe‑Haven Demand: 20‑day SPY–IEF return spread
Junk‑Bond Demand: HY vs IG credit spread (inverted)
Normalization: z‑score → percentile (0–100) with ±3 clipping.
CNN‑aligned thresholds:
Extreme Fear: 0–24 | Fear: 25–44 | Neutral: 45–54 | Greed: 55–74 | Extreme Greed: 75+.
Risk tools: ATR & MAD volatility measures with configurable multipliers.
Flexible layout: vertical or side‑by‑side columns.
Data Sources
S&P 500: CBOE:SPX or AMEX:SPY
NYSE: INDEX:HIGN, INDEX:LOWN, USI:UVOL, USI:DVOL
Options: USI:PCC (Total PCR), fallback INDEX:CPCS (Equity PCR)
Volatility: CBOE:VIX
Treasuries: NASDAQ:IEF
Credit Spreads: FRED:BAMLH0A0HYM2, FRED:BAMLC0A0CM
Risk Management
ATR risk bands: 🟢 ≤3%, 🟡 3–6%, ⚪ 6–10%, 🟠 10–15%, 🔴 >15%
MAD‑based stop‑loss and take‑profit calculations.
Author: Daniel Dahan
(AI Generated, Merged & enhanced version with CNN‑style Fear & Greed)

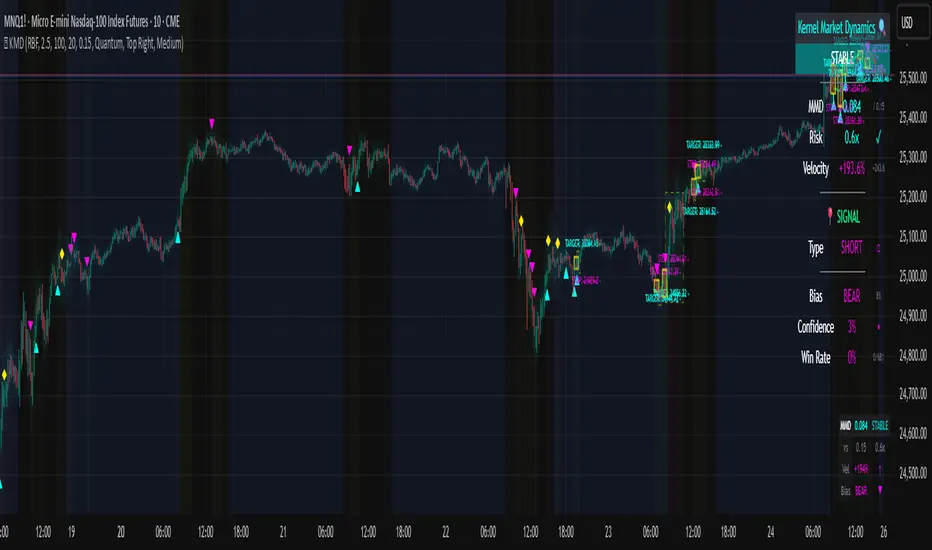
Kernel Market Dynamics🔍 Kernel Market Dynamics Pro - Advanced Distribution Divergence Detection System
OVERVIEW
Kernel Market Dynamics Pro (KMD Pro) is a revolutionary market regime detection system that employs Maximum Mean Discrepancy (MMD) - a cutting-edge statistical technique from machine learning - to identify when market behavior diverges from its recent historical distribution patterns. The system transforms complex statistical divergence analysis into actionable trading signals through kernel density estimation, regime classification algorithms, and multi-dimensional visualization frameworks that reveal hidden market transitions before traditional indicators can detect them.
WHAT MAKES IT ORIGINAL
While conventional indicators measure price or momentum divergence, KMD Pro analyzes distribution divergence - detecting when the statistical properties of market returns fundamentally shift from their baseline state. This approach, borrowed from high-frequency trading and quantitative finance, uses kernel methods to map market data into high-dimensional feature spaces where regime changes become mathematically detectable. The system is the first TradingView implementation to combine MMD with real-time regime visualization, making institutional-grade statistical arbitrage techniques accessible to retail traders.
HOW IT WORKS (Technical Methodology)
1. KERNEL DENSITY ESTIMATION ENGINE
Maximum Mean Discrepancy (MMD) Calculation:
The core innovation - measures distance between probability distributions:
• Maps return distributions to Reproducing Kernel Hilbert Space (RKHS)
• Computes empirical mean embeddings for reference and test windows
• Calculates supremum of mean differences across all RKHS functions
• MMD = ||μ_P - μ_Q||_H where H is the RKHS induced by kernel k
Three Kernel Functions Available:
RBF (Radial Basis Function) Kernel:
• k(x,y) = exp(-||x-y||²/2σ²)
• Gaussian kernel with smooth, infinite-dimensional feature mapping
• Bandwidth σ controls sensitivity (0.5-10.0 user configurable)
• Optimal for normally distributed returns
• Default choice providing balanced sensitivity
Laplacian Kernel:
• k(x,y) = exp(-|x-y|/σ)
• Exponential decay with heavier tails than RBF
• More sensitive to outliers and sudden moves
• Ideal for volatile, news-driven markets
• Faster regime shift detection at cost of more false positives
Cauchy Kernel:
• k(x,y) = 1/(1 + ||x-y||²/σ²)
• Heavy-tailed distribution from statistical physics
• Robust to extreme values and fat-tail events
• Best for cryptocurrency and emerging markets
• Most stable signals with fewer whipsaws
Implementation Details:
• Reference window: 30-300 bars of baseline distribution
• Test window: 10-100 bars of recent distribution
• Double-sum kernel matrix computation with O(m*n) complexity
• EMA smoothing (period 3) reduces noise in raw MMD
• Real-time updates every bar with incremental calculation
2. REGIME DETECTION FRAMEWORK
Three-State Regime Classification:
STABLE Regime (MMD < threshold):
• Market follows historical distribution patterns
• Mean-reverting behavior dominates
• Low probability of breakouts
• Reduced position sizing recommended
• Visual: Subtle background coloring
SHIFTING Regime (threshold < MMD < 2×threshold):
• Distribution divergence detected
• Transition period with directional bias emerging
• Optimal entry zone for trend-following
• Increased volatility expected
• Visual: Yellow/orange zone highlighting
EXTREME Regime (MMD > 2×threshold):
• Severe distribution anomaly
• Black swan or structural break potential
• Maximum caution required
• Consider hedging or exit
• Visual: Red/magenta warning zones
Adaptive Threshold System:
• Base threshold: 0.05-1.0 (default 0.15)
• Volatility adjustment: ±30% based on ATR ratio
• Regime persistence: 20-bar minimum for stability
• Cooldown periods prevent signal clustering
3. DIRECTIONAL BIAS DETERMINATION
Multi-Factor Direction Analysis:
Distribution Mean Comparison:
• Recent mean = SMA(normalized_returns, test_window)
• Reference mean = SMA(normalized_returns, reference_window)
• Direction = sign(recent_mean - reference_mean)
Momentum Confluence:
• Price momentum = close - close
• Volume momentum = volume/SMA(volume, reference_window)
• Weighted composite direction score
Trend Alignment:
• Fast EMA vs Slow EMA positioning
• Slope analysis of regression line
• Multi-timeframe bias confirmation (optional)
4. SIGNAL GENERATION ARCHITECTURE
Entry Signal Logic:
Stage 1 - Regime Shift Detection:
• MMD crosses above threshold
• Sustained for minimum 2 bars
• No signals within cooldown period
Stage 2 - Direction Confirmation:
• Distribution mean aligns with momentum
• Volume ratio > 1.0 (optional)
• Price above/below VWAP (optional)
Stage 3 - Risk Assessment:
• Calculate ATR-based stop distance
• Verify risk/reward ratio > 1.5
• Check for nearby support/resistance
Stage 4 - Signal Generation:
• Long: Regime shift + bullish direction
• Short: Regime shift + bearish direction
• Extreme: MMD > 2×threshold warning
5. PROBABILITY CLOUD VISUALIZATION
Adaptive Confidence Intervals:
• Standard deviation multiplier = 1 + MMD × 3
• Inner band: ±0.5 ATR × multiplier (68% probability)
• Outer band: ±1.0 ATR × multiplier (95% probability)
• Width expands with divergence magnitude
• Real-time adjustment every bar
Interpretation:
• Narrow cloud: Low uncertainty, stable regime
• Wide cloud: High uncertainty, shifting regime
• Asymmetric cloud: Directional bias present
6. MOMENTUM FLOW VECTORS
Three-Style Momentum Visualization:
Flow Arrows:
• Length proportional to momentum strength
• Width indicates confidence (1-3 pixels)
• Angle shows rate of change
• Frequency: Every 5 bars or on events
Gradient Bars:
• Vertical lines from price
• Height = momentum/ATR ratio
• Opacity based on strength
• Continuous flow indication
Momentum Ribbon:
• Envelope around price action
• Expands in momentum direction
• Color intensity shows strength
7. SIGNAL CONNECTION SYSTEM
Relationship Mapping:
• Links consecutive signals with lines
• Solid lines: Same direction (continuation)
• Dotted lines: Opposite direction (reversal)
• Maximum 10 connections maintained
• Distance limit: 100 bars
Purpose:
• Identifies signal clusters
• Shows trend development
• Reveals regime persistence
• Confirms directional bias
8. REGIME ZONE MAPPING
Unified Zone Visualization:
• Main zones: Full regime periods (entry to exit)
• Emphasis zones: Specific trigger points
• Historical memory: Last 20 regime shifts
• Color gradient based on intensity
• Border style indicates zone type
Zone Analytics:
• Duration tracking
• Maximum excursion
• Retest probability
• Support/resistance conversion
9. DYNAMIC RISK MANAGEMENT
ATR-Based Position Sizing:
• Stop loss: 1.0 × ATR from entry
• Target 1: 2.0 × ATR (2R)
• Target 2: 4.0 × ATR (4R)
• Volatility-adjusted scaling
Visual Target System:
• Entry pointer lines
• Target boxes with prices
• Stop boxes with invalidation
• Real-time P&L tracking
10. PROFESSIONAL DASHBOARD
Real-Time Metrics Display:
Primary Metrics:
• Current MMD value and threshold
• Risk level (MMD/threshold ratio)
• Velocity (rate of change)
• Acceleration (second derivative)
Signal Information:
• Active signal type and entry
• Stop loss and targets
• Current P&L percentage
• Bars since signal
Market Metrics:
• Directional bias (BULL/BEAR)
• Confidence percentage
• Win rate statistics
• Signal count tracking
Visual Design:
• Four position options
• Three size modes
• Five color themes
• Gauge visualizations
• Status banners
11. MMD INFO PANEL
Floating Statistics:
• Compact 3×4 table
• MMD vs threshold comparison
• Velocity with direction arrows
• Current bias indication
• Always-visible reference
FIVE COLOR THEMES
Quantum: Cyan/Magenta/Yellow - Modern, high contrast, optimal visibility
Matrix: Green/Red - Classic terminal aesthetic, traditional
Fire: Orange/Gold/Red - Warm spectrum, energetic feel
Aurora: Northern lights palette - Unique, beautiful gradients
Nebula: Deep space colors - Purple/Blue, futuristic
HOW TO USE
Step 1: Select Your Kernel
• RBF for normal markets (stocks, forex majors)
• Laplacian for volatile markets (small-caps, news-driven)
• Cauchy for fat-tail markets (crypto, emerging markets)
Step 2: Configure Bandwidth
• 0.5-2.0: Scalping (high sensitivity)
• 2.0-5.0: Day trading (balanced)
• 5.0-10.0: Swing trading (smooth signals)
Step 3: Set Analysis Windows
• Reference: 3-5× your holding period
• Test: Reference ÷ 3 approximately
• Adjust based on timeframe
Step 4: Calibrate Threshold
• Start with 0.15 default
• Increase if too many signals
• Decrease for earlier detection
Step 5: Enable Visuals
• Probability Cloud for volatility assessment
• Momentum Flow for direction confirmation
• Regime Zones for historical context
• Signal Connections for trend visualization
Step 6: Monitor Dashboard
• Check MMD vs threshold
• Verify regime state
• Confirm directional bias
• Review confidence metrics
Step 7: Execute Signals
• Wait for triangle markers
• Verify regime shift confirmed
• Check risk/reward setup
• Enter at close or next open
Step 8: Manage Position
• Place stop at calculated level
• Scale out at Target 1 (2R)
• Trail remainder to Target 2 (4R)
• Exit if regime reverses
OPTIMIZATION GUIDE
By Market Type:
Forex Majors:
• Kernel: RBF
• Bandwidth: 2.0-3.0
• Windows: 100/30
• Threshold: 0.15
Stock Indices:
• Kernel: RBF
• Bandwidth: 3.0-4.0
• Windows: 150/50
• Threshold: 0.20
Cryptocurrencies:
• Kernel: Cauchy
• Bandwidth: 2.5-3.5
• Windows: 100/30
• Threshold: 0.10-0.15
Commodities:
• Kernel: Laplacian
• Bandwidth: 2.0-3.0
• Windows: 200/60
• Threshold: 0.15-0.25
By Timeframe:
Scalping (1-5m):
• Test Window: 10-20
• Reference: 50-100
• Bandwidth: 1.0-2.0
• Cooldown: 5-10 bars
Day Trading (15m-1H):
• Test Window: 30-50
• Reference: 100-150
• Bandwidth: 2.0-3.0
• Cooldown: 10-20 bars
Swing Trading (4H-Daily):
• Test Window: 50-100
• Reference: 200-300
• Bandwidth: 3.0-5.0
• Cooldown: 20-50 bars
ADVANCED FEATURES
Multi-Timeframe Capability:
• HTF MMD calculation via security()
• Regime alignment across timeframes
• Fractal analysis support
Statistical Arbitrage Mode:
• Pair trading applications
• Spread divergence detection
• Cointegration breaks
Machine Learning Integration:
• Export signals for ML training
• Regime labels for classification
• Feature extraction support
PERFORMANCE METRICS
Computational Complexity:
• MMD calculation: O(m×n) where m,n are window sizes
• Memory usage: O(m+n) for kernel matrices
• Update frequency: Every bar (real-time)
• Optimization: Incremental updates where possible
Typical Signal Frequency:
• Conservative settings: 2-5 signals/week
• Balanced settings: 5-10 signals/week
• Aggressive settings: 10-20 signals/week
Win Rate Expectations:
• Trend following mode: 40-50% wins, 2:1 reward/risk
• Mean reversion mode: 60-70% wins, 1:1 reward/risk
• Depends heavily on market conditions
IMPORTANT DISCLAIMERS
• This indicator detects statistical divergence, not future price direction
• MMD measures distribution distance, not predictive probability
• Past regime shifts do not guarantee future performance
• Kernel methods are descriptive statistics, not AI predictions
• Requires minimum 100 bars historical data for stability
• Performance varies significantly across market conditions
• Not suitable for illiquid or heavily manipulated markets
• Always use proper risk management and position sizing
• Backtest thoroughly on your specific instruments
• This is an analysis tool, not a complete trading system
THEORETICAL FOUNDATION
The Maximum Mean Discrepancy was introduced by Gretton et al. (2012) as a kernel-based statistical test for comparing distributions. In financial markets, we adapt this technique to detect when return distributions shift, indicating potential regime changes. The mathematical rigor of MMD provides a robust, non-parametric approach to identifying market transitions without assuming specific distribution shapes.
SUPPORT & UPDATES
• Questions or configuration help via TradingView messaging
• Bug reports addressed within 48 hours
• Feature requests considered for monthly updates
• Video tutorials available on request
• Join our community for strategy discussions
FINAL NOTES
KMD Pro represents a paradigm shift in technical analysis - moving from price-based indicators to distribution-based detection. By measuring statistical divergence rather than price divergence, the system identifies regime changes that precede traditional breakouts. This anticipatory capability, combined with comprehensive visualization and risk management, provides traders with an institutional-grade toolkit for navigating modern market dynamics.
Remember: The edge comes not from the indicator alone, but from understanding when market distributions diverge from their normal state and positioning accordingly. Use KMD Pro as part of a complete trading strategy that includes fundamental analysis, risk management, and market context.
BTC Confluence Score + Confirmed Signals (12m/1h)This script combines 7 different signals across multiple timeframes (12 min + 1 hour + BTC dominance), then only gives you a BUY or SELL when everything aligns.
It’s designed to filter out fake-outs and help you catch momentum reversals that stick.
WHAT IT’S DOING UNDER THE HOOD
Timeframes
12 min (fast) → short-term trigger (RSI, Stoch RSI, volatility)
1 hour (slow) → trend confirmation (EMA structure, RSI, MACD)
BTC Dominance (1 h) → strength/flow confirmation (is capital rotating into BTC or alts?)
This gives you a multi-timeframe confluence, which is what professional traders look for before entering a trade.
2. The 7 “Score” Ingredients
Each bar gets a “score” from –7 (super bearish) to +7 (super bullish) based on:
# Condition Bullish signal (+1) Bearish signal (–1)
1 RSI (12m) RSI > 50 RSI < 50
2 RSI (1h) RSI > 50 RSI < 50
3 MACD Histogram > 0 Histogram < 0
4 BTC Dominance level > 59.8 % < 59.8 %
5 BTC Dominance trend 3 EMA > 8 EMA 3 EMA < 8 EMA
6 1h EMAs trend 50 EMA > 200 EMA and price > 50 EMA 50 EMA < 200 EMA and price < 50 EMA
7 Volatility (ATR) Current ATR > average (momentum increasing) —
The Confluence Score bar at the bottom shows this numerically:
💚 +5 to +7 → Strong bullish conditions
❤️ –5 to –7 → Strong bearish conditions
🩶 Between –2 and +2 → Choppy / neutral
3️⃣ Confirmed Entry Logic (the clear triangles you see now)
You’ll now see only two real actionable markers:
✅ BUY (Green Triangle Up)
Triggered when:
Stoch RSI crosses upward on 12 min
RSI > 50 (momentum confirmation)
MACD histogram > 0 (trend shift)
Confluence score ≥ 4 (default threshold)
This means momentum + trend + structure + volume all agree on an upward move.
→ Ideal for going long or closing shorts.
🚨 SELL (Red Triangle Down)
Triggered when:
Stoch RSI crosses downward
RSI < 50
MACD histogram < 0
Confluence score ≥ 4 bearish
That’s your exit / short confirmation.
4️⃣ Color Bars (Score Strength)
At the bottom of the chart:
💚 Green Bars = full bullish confluence (+5 or more)
💛 Lime/Orange Bars = moderate bullish or early reversal
❤️ Red Bars = strong bearish confluence (–5 or less)
🩶 Gray Bars = chop/no edge
If you prefer visual simplicity, just use:
BUY = Green Triangle appears on green bars
SELL = Red Triangle appears on red bars
That’s your “double confirmation.”
🎯 HOW TO TRADE IT
⏱ Timeframes
Use 12 min for entries (fast scalps or 1–2 hr setups).
Confirm direction with the 1 hour timeframe — only trade in that direction.
💰 Entry Playbook
Signal What to Do
✅ Green Triangle appears Enter long or scale in. Set stop below recent swing low.
🚨 Red Triangle appears Exit long / enter short / scale out.
Bars gray or alternating Stay out — market is undecided.
🧮 Min Score Setting
Default = 4 (balanced).
Raise to 5 for cleaner, fewer signals.
Lower to 3 for more aggressive, frequent trades.
📲 Alerts
You can now create TradingView alerts using:
BUY Confirmed
SELL Confirmed
Set alert type:
“Once per bar close” — so you only get notified after confirmation, not mid-bar noise.
Y ou now have your own BTC AI Confluence System:
Filters all noise from RSI, MACD, EMAs, volatility, and BTC dominance
Waits for perfect alignment across multiple timeframes
Gives you one simple green (BUY) or red (SELL) signal
Lets you scalp 1–2 % moves safely or swing trade confirmations

DAMMU AUTOMATICAL AI ENRTY AND TARGET AND EXITMain Components
Supertrend System –
Detects market trend direction (Buy/Sell zones).
→ Green = Uptrend (Buy)
→ Red = Downtrend (Sell)
SMA Filter –
Uses 50 & 200 moving averages to confirm overall trend.
→ Price above both → Bullish
→ Price below both → Bearish
Buy/Sell Signals –
Generated when Supertrend flips direction and SMA confirms.
→ Triangle up = Buy
→ Triangle down = Sell
Take Profit / Stop Loss Levels –
Automatically calculated after Buy/Sell entry.
→ TP1, TP2, SL shown on chart
ADX (Sideways Zone Filter) –
If ADX < 25 → Market sideways → Avoid trades
Shows “No Trade Zone” area
Smart Money Concepts (SMC) Tools –
🔹 Market structure (HH, HL, LH, LL)
🔹 Order blocks (OB)
🔹 Equal highs/lows
🔹 Fair Value Gaps (FVG)
🔹 Premium & Discount zones
Helps find institutional entry points
Visual Display –
Color-coded background (trend zones)
Labels for buy/sell/structure
Optional FVG and order block boxes
Risk Management –
Input-based position sizing, SL & TP management
(to calculate profit levels and minimize loss)

The Ultimate TPE by ATKDaily Energy Trigger Levels – AI-Enhanced Precision
This indicator captures the daily energy of price movement by extending the day’s high/low trigger levels across the chart. It translates daily institutional flow into clean visual levels, dynamic alerts, and actionable signals.
Key Highlights
🔹 Automatic Daily Energy Mapping – anchors to each day’s high and low in your selected timezone.
🔹 Full Chart Extension – upper and lower lines stretch across all timeframes for constant context.
🔹 Custom Color Control – personalize your green/red levels for clarity.
🔹 1-Minute Arrow Signals – see precise entries when price crosses daily energy zones.
🔹 Proximity & Touch Alerts – get notified when price touches or approaches your levels within a tick range.
🔹 Dynamic Alert Text – each alert displays the exact level name, price, and Long/Short direction.
Why It Matters
Every day creates a unique energy signature in price action. By tracking how the market respects or rejects those levels, traders can see where liquidity and momentum build up. TPE visualizes that energy in real time, helping you react faster and with greater precision.
Best Use Case
Use on the 1-minute chart for scalping or fine entry timing.

ORB [RAJ AI]Defines customizable opening range periods with flexible time settings
Supports both single and multiple ORB sessions throughout the trading day
Calculates dynamic high/low buffers with configurable points or percentage offsets
Risk Management:
Configurable take profit levels (up to 3 targets) for both long and short positions
Adjustable stop loss settings with points or percentage-based calculations
Advanced trade sequencing to prevent repeated signals
Distance-based entry restrictions from previous trades

The Wave Levels (ORB Indicator)This Indicator is made for the ORB trader. It's purpose is to help make your charting faster by providing some basic key levels to reference at a glance. This was optimized to be used on the 5m timeframe.
Key features:
1. Green and Red ORB rays to indicate the 15 minute Opening Range. These ranges will only extend as long as its respective session's length.
2. Previous sessions zones for historical easily identification of historical data (best used in UTC-4 timezone)
3. White Liquidity Rays. These rays are used to mark a previous session's high or low which hasn't been swept yet. This makes for a good TP area or identifying a potential reversal area.
Once a previous session high or low has been taken, the ray will automatically remove.
I am not a professional coder. This indicator was created by continuously prompting AI commands over the course of 3 days.

EchoFlowEchoFlow — Where Intelligence Becomes Rhythm
Powered by next-gen AI, EchoFlow transforms data, code, and creativity into seamless motion.
It doesn’t just automate — it anticipates.
From thought to execution, EchoFlow is the pulse of intelligent systems, syncing every action with precision, speed, and intuition.

Chronos Reversal Labs🧬 Chronos Reversal Lab - Machine Learning Market Structure Analysis
OVERVIEW
Chronos Reversal Lab (CRL) is an advanced market structure analyzer that combines computational intelligence kernels with classical technical analysis to identify high-probability reversal opportunities. The system integrates Shannon Entropy analysis, Detrended Fluctuation Analysis (DFA), Kalman adaptive filtering, and harmonic pattern recognition into a unified confluence-based signal engine.
WHAT MAKES IT ORIGINAL
Unlike traditional reversal indicators that rely solely on oscillators or pattern recognition, CRL employs a multi-kernel machine learning approach that analyzes market behavior through information theory, statistical physics, and adaptive state-space estimation. The system combines these computational methods with geometric pattern analysis and market microstructure to create a comprehensive reversal detection framework.
HOW IT WORKS (Technical Methodology)
1. COMPUTATIONAL KERNELS
Shannon Entropy Analysis
Measures market uncertainty using information theory:
• Discretizes price returns into bins (user-configurable 5-20 bins)
• Calculates probability distribution entropy over lookback window
• Normalizes entropy to 0-1 scale (0 = perfectly predictable, 1 = random)
• Low entropy states (< 0.3 default) indicate algorithmic clarity phases
• When entropy drops, directional moves become statistically more probable
Detrended Fluctuation Analysis (DFA)
Statistical technique measuring long-range correlations:
• Analyzes price series across multiple box sizes (4 to user-set maximum)
• Calculates fluctuation scaling exponent (Alpha)
• Alpha > 0.5: Trend persistence (momentum regime)
• Alpha < 0.5: Mean reversion tendency (reversal regime)
• Alpha range 0.3-1.5 mapped to trading strategies
Kalman Adaptive Filter
State-space estimation for lag-free trend tracking:
• Maintains separate fast and slow Kalman filters
• Process noise and measurement noise are user-configurable
• Tracks price state with adaptive gain adjustments
• Calculates acceleration (second derivative) for momentum detection
• Provides cleaner trend signals than traditional moving averages
2. HARMONIC PATTERN DETECTION
Identifies geometric reversal patterns:
• Gartley: 0.618 AB/XA, 0.786 AD/XA retracement
• Bat: 0.382-0.5 AB/XA, 0.886 AD/XA retracement
• Butterfly: 0.786 AB/XA, 1.272-1.618 AD/XA extension
• Cypher: 0.382-0.618 AB/XA, 0.786 AD/XA retracement
Pattern Validation Process:
• Requires alternating swing structure (XABCD points)
• Fibonacci ratio tolerance: 0.02-0.20 (user-adjustable precision)
• Minimum 50% ratio accuracy score required
• PRZ (Potential Reversal Zone) calculated around D point
• Zone size: ATR-based with pattern-specific multipliers
• Active pattern tracking with 100-bar invalidation window
3. MARKET STRUCTURE ANALYSIS
Swing Point Detection:
• Pivot-based swing identification (3-21 bars configurable)
• Minimum swing size: ATR multiples (0.5-5.0x)
• Adaptive filtering: volatility regime adjustment (0.7-1.3x)
• Swing confirmation tracking with RSI and volume context
• Maintains structural history (up to 500 swings)
Break of Structure (BOS):
• Detects price crossing previous swing highs/lows
• Used for trend continuation vs reversal classification
• Optional requirement for signal validation
Support/Resistance Detection:
• Identifies horizontal levels from swing clusters
• Touch counting algorithm (price within ATR×0.3 tolerance)
• Weighted by recency and number of tests
• Dynamic updating as structure evolves
4. CONFLUENCE SCORING SYSTEM
Multi-factor analysis with regime-aware weighting:
Hierarchical Kernel Logic:
• Entropy gates advanced kernel activation
• Only when entropy < threshold do DFA and Kalman accelerate scoring
• Prevents false signals during chaotic (high entropy) conditions
Scoring Components:
ML Kernels (when entropy low):
• Low entropy + trend alignment: +3.0 points × trend weight
• DFA super-trend (α>1.5): +4.0 points × trend weight
• DFA persistence (α>0.65): +2.5 points × trend weight
• DFA mean-reversion (α<0.35): +2.0 points × mean-reversion weight
• Kalman acceleration: up to +3.0 points (scaled by magnitude)
Classical Technical Analysis:
• RSI oversold (<30) / overbought (>70): +1.5 points
• RSI divergence (bullish/bearish): +2.5 points
• High relative volume (>1.5x): +0-2.0 points (scaled)
• Volume impulse (>2.0x): +1.5 points
• VWAP extremes: +1.0 point
• Trend alignment (Kalman fast vs slow): +1.5 points
• MACD crossover/momentum: +1.0 point
Structural Factors:
• Near support (within 0.5 ATR): +0-2.0 points (inverse distance)
• Near resistance (within 0.5 ATR): +0-2.0 points (inverse distance)
• Harmonic PRZ zone: +3.0 to +6.0 points (pattern score dependent)
• Break of structure: +1.5 points
Regime Adjustments:
• Trend weight: 1.5× in trend regime, 0.5× in mean-reversion
• Mean-reversion weight: 1.5× in MR regime, 0.5× in trend
• Volatility multiplier: 0.7-1.3× based on ATR regime
• Theory mode multiplier: 0.8× (Conservative) to 1.2× (APEX)
Final Threshold:
Base threshold (default 3.5) adjusted by:
• Theory mode: -0.3 (APEX) to +0.8 (Conservative)
• Regime: +0.5 (high vol) to -0.3 (low vol or strong trend)
• Filter: +0.2 if regime filter enabled
5. SIGNAL GENERATION ARCHITECTURE
Five-stage validation process:
Stage 1 - ML Kernel Analysis:
• Entropy threshold check
• DFA regime classification
• Kalman acceleration confirmation
Stage 2 - Structural Confirmation:
• Market structure supports directional bias
• BOS alignment (if required)
• Swing point validation
Stage 3 - Trigger Validation:
• Engulfing candle (if required)
• HTF bias confirmation (if strict HTF enabled)
• Harmonic PRZ alignment (if confirmation enabled)
Stage 4 - Consistency Check:
• Anticipation depth: checks N bars back (1-13 configurable)
• Ensures Kalman acceleration direction persists
• Filters whipsaw conditions
Stage 5 - Structural Soundness (Critical Filter):
• Verifies adequate room before next major swing level
• Long signals: must have >0.25 ATR clearance to last swing high
• Short signals: must have >0.25 ATR clearance to last swing low
• Prevents trades directly into obvious structural barriers
Dynamic Risk Management:
• Stop-loss: Placed beyond last structural swing ± 2 ticks
• Take-profit 1: Risk × configurable R1 multiplier (default 1.5R)
• Take-profit 2: Risk × configurable R2 multiplier (default 3.0R)
• Confidence score: Calibrated 0-99% based on confluence + kernel boost
6. ADAPTIVE REGIME SYSTEM
Continuous market state monitoring:
Trend Regime:
• Kalman fast vs slow positioning
• Multi-timeframe alignment (optional HTF)
• Strength: ATR-normalized fast/slow spread
Volatility Regime:
• Current ATR vs 100-bar average
• Regime ratio: 0.7-1.3 typical range
• Affects swing size filtering and cooldown periods
Signal Cooldown:
• Base: User-set bars (1-300)
• High volatility (>1.5): cooldown × 1.5
• Low volatility (<0.5): cooldown × 0.7
• Post-BOS: minimum 20-bar cooldown enforced
FOUR OPERATIONAL MODES
CONSERVATIVE MODE:
• Threshold adjustment: +0.8
• Mode multiplier: 0.8×
• Strictest filtering for highest quality
• Recommended for: Beginners, large accounts, swing trading
• Expected signals: 3-5 per week (typical volatile instrument)
BALANCED MODE:
• Threshold adjustment: +0.3
• Mode multiplier: 1.0×
• Standard operational parameters
• Recommended for: General trading, learning phase
• Expected signals: 5-10 per week
APEX MODE:
• Threshold adjustment: -0.3
• Mode multiplier: 1.2×
• Maximum sensitivity, reduced cooldowns
• Recommended for: Scalping, high volatility, experienced traders
• Expected signals: 10-20 per week
INSTITUTIONAL MODE:
• Threshold adjustment: +0.5
• Mode multiplier: 1.1×
• Enhanced structural weighting, HTF emphasis
• Recommended for: Professional traders, swing positions
• Expected signals: 4-8 per week
VISUAL COMPONENTS
1. Fibonacci Retracement Levels
• Auto-calculated from most recent swing structure
• Standard levels: 0%, 23.6%, 38.2%, 50%, 61.8%, 78.6%, 100%, 127.2%, 161.8%, 200%, 261.8%
• Key levels emphasized (50%, 61.8%, 100%, 161.8%)
• Color gradient from bullish to bearish based on level
• Automatic cleanup when levels are crossed
• Label intensity control (None/Fib only/All)
2. Support and Resistance Lines
• Dynamic horizontal levels from swing clusters
• Width: 2px solid lines
• Colors: Green (support), Red (resistance)
• Labels show price and level type
• Touch-based validation (minimum 2 touches)
• Real-time updates and invalidation
3. Harmonic PRZ Boxes
• Displayed around pattern completion (D point)
• Pattern-specific colors (Gartley: purple, Bat: orange, etc.)
• Box height: ATR-based zone sizing
• Score-dependent transparency
• 100-bar active window before removal
4. Confluence Boxes
• Appear when confluence ≥ threshold
• Yellow/orange gradient based on score strength
• Height: High to low of bar
• Width: 1 bar on each side
• Real-time score-based transparency
5. Kalman Filter Lines
• Fast filter: Bullish color (green default)
• Slow filter: Bearish color (red default)
• Width: 2px
• Transparency adjustable (0-90%)
• Optional display toggle
6. Signal Markers
• Long: Green triangle below bar (tiny size)
• Short: Red triangle above bar (tiny size)
• Appear only on confirmed signals
• Includes alert generation
7. Premium Dashboard
Features real-time metrics with visual gauges:
Layout Options:
• Position: 4 corners selectable
• Size: Small (9 rows) / Normal (12 rows) / Large (14 rows)
• Themes: Supreme, Cosmic, Vortex, Heritage
Metrics Displayed:
• Gamma (DFA - 0.5): Shows trend persistence vs mean-reversion
• TCI (Trend Strength): ATR-normalized Kalman spread with gauge
• v/c (Relative Volume): Current vs average with color coding
• Entropy: Market predictability state with gauge
• HFL (High-Frequency Line): Kalman fast/slow difference / ATR
• HFL_acc (Acceleration): Second derivative momentum
• Mem Bias: Net bullish-bearish confluence (-1 to +1)
• Assurance: Confidence × (1-entropy) metric
• Squeeze: Bollinger Band / Keltner Channel squeeze detection
• Breakout P: Probability estimate from DFA + trend + acceleration
• Score: Final confluence vs threshold (normalized)
• Neighbors: Active harmonic patterns count
• Signal Strength: Strong/Moderate/Weak classification
• Signal Banner: Current directional bias with emoji indicators
Gauge Visualization:
• 10-bar horizontal gauges (█ filled, ░ empty)
• Color-coded: Green (strong) / Gold (moderate) / Red (weak)
• Real-time updates every bar
HOW TO USE
Step 1: Configure Mode and Resolution
• Select Theory Mode based on trading style (Conservative/Balanced/APEX/Institutional)
• Set Structural Resolution (Standard for fast markets, High for balanced, Ultra/Institutional for swing)
• Enable Adaptive Filtering (recommended for all volatile assets)
Step 2: Enable Desired Kernels
• Shannon Entropy: Essential for predictability detection (recommended ON)
• DFA Analysis: Critical for regime classification (recommended ON)
• Kalman Filter: Provides lag-free trend tracking (recommended ON)
• All three work synergistically; disabling reduces effectiveness
Step 3: Configure Confluence Factors
• Enable desired technical factors (RSI, MACD, Volume, Divergence)
• Enable Liquidity Mapping for support/resistance proximity scoring
• Enable Harmonic Detection if trading pattern-based setups
• Adjust base confluence threshold (3.5 default; higher = fewer, cleaner signals)
Step 4: Set Trigger Requirements
• Require Engulfing: Adds precision, reduces frequency (recommended for Conservative)
• Require BOS: Ensures structural alignment (recommended for trend-following)
• Require Structural Soundness: Critical filter preventing traps (highly recommended)
• Strict HTF Bias: For multi-timeframe traders only
Step 5: Adjust Visual Preferences
• Enable/disable Fibonacci levels, S/R lines, PRZ boxes, confluence boxes
• Set label intensity (None/Fib/All)
• Adjust transparency (0-90%) for overlay clarity
• Configure dashboard position, size, and theme
Step 6: Configure Alerts
• Enable master alerts toggle
• Select alert types: Anticipation, Confirmation, High Confluence, Low Entropy
• Enable JSON details for automated trading integration
Step 7: Interpret Signals
• Wait for triangle markers (green up = long, red down = short)
• Check dashboard for confluence score, entropy, DFA regime
• Verify signal aligns with higher timeframe bias (if using HTF setting)
• Confirm adequate space to take-profit levels (no nearby structural barriers)
Step 8: Execute and Manage
• Enter at close of signal candle (or next bar open)
• Set stop-loss at calculated level (visible in alert if JSON enabled)
• Scale out at TP1 (1.5R default), trail remaining to TP2 (3.0R default)
• Exit early if entropy spikes >0.7 or DFA regime flips against position
CUSTOMIZATION GUIDE
Timeframe Optimization:
Scalping (1-5 minutes):
• Theory Mode: APEX
• Anticipation Depth: 3-5
• Structural Resolution: STANDARD
• Signal Cooldown: 8-12 bars
• Enable fast kernels, disable HTF bias
Day Trading (15m-1H):
• Theory Mode: BALANCED
• Anticipation Depth: 5-8
• Structural Resolution: HIGH
• Signal Cooldown: 12-20 bars
• Standard configuration
Swing Trading (4H-Daily):
• Theory Mode: INSTITUTIONAL
• Anticipation Depth: 8-13
• Structural Resolution: ULTRA or INSTITUTIONAL
• Signal Cooldown: 20-50 bars
• Enable HTF bias, strict confirmations
Market Type Optimization:
Forex Majors:
• All kernels enabled
• Harmonic patterns effective
• Balanced or Institutional mode
• Standard settings work well
Stock Indices:
• Emphasis on volume analysis
• DFA critical for regime detection
• Conservative or Balanced mode
• Enable liquidity mapping
Cryptocurrencies:
• Adaptive filtering essential
• Higher volatility regime expected
• APEX mode for active trading
• Wider ATR multiples for swing sizing
IMPORTANT DISCLAIMERS
• This indicator does not predict future price movements
• Computational kernels calculate probabilities, not certainties
• Past confluence scores do not guarantee future signal performance
• Always backtest on YOUR specific instruments and timeframes before live trading
• Machine learning kernels require calibration period (minimum 100 bars of data)
• Performance varies significantly across market conditions and regimes
• Signals are suggestions for analysis, not automated trading instructions
• Proper risk management (stops, position sizing) is mandatory
• Complex calculations may impact performance on lower-end devices
• Designed for liquid markets; avoid illiquid or gap-prone instruments
PERFORMANCE CONSIDERATIONS
Computational Intensity:
• DFA analysis: Moderate (scales with length and box size parameters)
• Entropy calculation: Moderate (scales with lookback and bins)
• Kalman filtering: Low (efficient state-space updates)
• Harmonic detection: Moderate to High (pattern matching across swing history)
• Overall: Medium computational load
Optimization Tips:
• Reduce Structural Analysis Depth (144 default → 50-100 for faster performance)
• Increase Calc Step (2 default → 3-4 for lighter load)
• Reduce Pattern Analysis Depth (8 default → 3-5 if harmonics not primary focus)
• Limit Draw Window (150 bars default prevents visual clutter on long charts)
• Disable unused confluence factors to reduce calculations
Best Suited For:
• Liquid instruments: Major forex, stock indices, large-cap crypto
• Active timeframes: 5-minute through daily (avoid tick/second charts)
• Trending or ranging markets: Adapts to both via regime detection
• Pattern traders: Harmonic integration adds geometric confluence
• Multi-timeframe analysts: HTF bias and regime detection support this approach
Not Recommended For:
• Illiquid penny stocks or micro-cap altcoins
• Markets with frequent gaps (stocks outside regular hours without gap adjustment)
• Extremely fast timeframes (tick, second charts) due to calculation overhead
• Pure mean-reversion systems (unless using CONSERVATIVE mode with DFA filters)
METHODOLOGY NOTE
The computational kernels (Shannon Entropy, DFA, Kalman Filter) are established statistical and signal processing techniques adapted for financial time series analysis. These are deterministic mathematical algorithms, not predictive AI models. The term "machine learning" refers to the adaptive, data-driven nature of the calculations, not neural networks or training processes.
Confluence scoring is rule-based with regime-dependent weighting. The system does not "learn" from historical trades but adapts its sensitivity to current volatility and trend conditions through mathematical regime classification.
SUPPORT & UPDATES
• Questions about configuration or usage? Send me a message on TradingView
• Feature requests are welcome for consideration in future updates
• Bug reports appreciated and addressed promptly
• I respond to messages within 24 hours
• Regular updates included (improvements, optimizations, new features)
FINAL REMINDERS
• This is an analytical tool for confluence analysis, not a standalone trading system
• Combine with your existing strategy, risk management, and market analysis
• Start with paper trading to learn the system's behavior on your markets
• Allow 50-100 signals minimum for performance evaluation
• Adjust parameters based on YOUR timeframe, instrument, and trading style
• No indicator guarantees profitable trades - proper risk management is essential
— Dskyz, Trade with insight. Trade with anticipation.
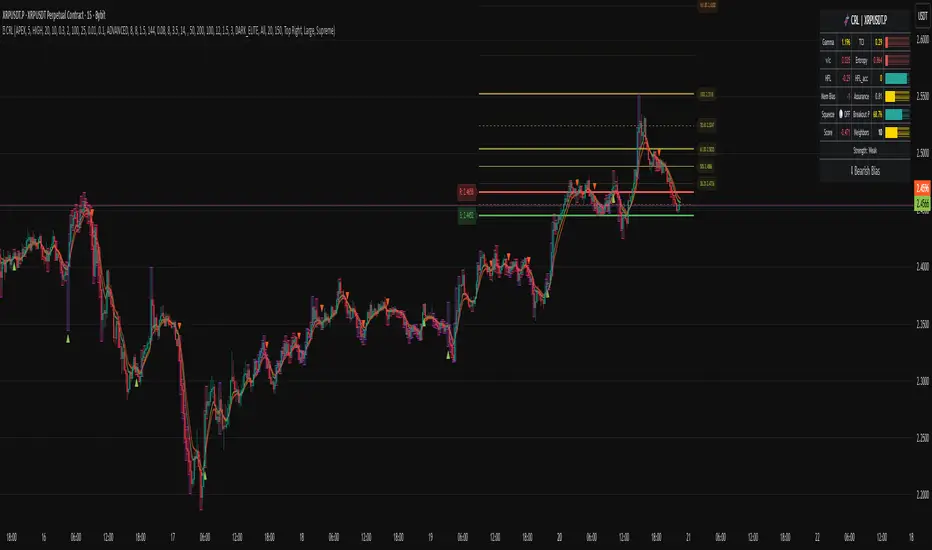
MACD AI Flux Pro Dashboard V. 2Acknowledgment
This indicator is built upon the MACD-V (Volatility-Normalized MACD) methodology originally created by Alex Spiroglou, CMT, whose research (2015–2022) introduced the principle of normalizing MACD momentum by volatility (MACD/ATR). Full acknowledgment and credit are hereby given to Mr. Spiroglou as the original author of the MACD-V concept and framework.
Indicator Overview — MACD-V Flux Pro Dashboard V.2
The MACD-V Flux Pro Dashboard advances Spiroglou’s volatility-normalized foundation into a comprehensive multi-system architecture that unifies momentum, trend, volatility, and compression analytics in one visual framework. It is engineered for precision decision-making in both intraday and swing-trading environments.
Key Dashboard Features:
Dynamic Probability Engine: Calculates real-time long and short probabilities by weighting momentum, slope, compression, and volume pressure components into a composite score.
Multi-Timeframe Confirmation (HTF Tiles): Displays live directional agreement across fast, mid, and slow timeframes for confidence filtering and signal validation.
Regime Detection System: Automatically classifies the market as Trend Up, Trend Down, Compression, or Transition, applying background color cues for instant context.
Risk and News Filters: Integrates ATR-based risk gating and customizable “mute windows” to block trade signals during high-volatility or scheduled news events.
VWAP and Adaptive Bands: Plots VWAP with configurable ATR or standard-deviation bands to highlight over-extension and pullback zones.
Trend-Day and Opening-Range Logic: Monitors RTH (Regular Trading Hours) price behavior to identify potential trend-day conditions.
Smart Entry Arrows: Generates visual long/short signals only when multiple subsystems confirm direction, slope strength, and proximity to VWAP within defined thresholds.
On-Chart Dashboard Panel: Presents live metrics including probability bias, regime state, ATR level, risk status, and news filters with adaptive color-coding and optional emoji cues for intuitive interpretation.
Chart Display Summary:
All elements are presented directly on the main chart, combining price structure, VWAP bands, EMAs, and regime background shading with the real-time dashboard panel. The design eliminates the need for a secondary pane, offering a consolidated and context-rich view of market dynamics

Dammu AI ADVANCED PRO1. Indicator Overview
Name: Dammu
Type: Overlay indicator (draws on price chart)
Purpose: Combines SuperTrend, SMA/EMA trends, Swing/Structure analysis, Order Blocks, Fair Value Gaps, High/Low levels, TP/SL labels, and alerts.
Pine Script Version: v5
2. SuperTrend Module
Computes SuperTrend line using ATR and sensitivity.
Signals:
Bullish: Price crosses above SuperTrend.
Bearish: Price crosses below SuperTrend.
Plots buy/sell labels 🚀🐻 based on SMA comparison and SuperTrend cross.
3. SMA/EMA Trend Components
SMA8 & SMA9: Used for additional trend confirmation.
EMA lines: Multiple EMAs with different multipliers for trend detection.
Trend Cloud: Uses Hull MA for trend smoothing.
4. Risk Management
TP/SL Levels: Automatic calculation of stop-loss and take-profit (TP1, TP2, TP3).
Configurable ATR-based risk percentage.
Lines and labels drawn for visual TP/SL.
5. Chart Features
Smooth Range Filter: Filters noise for trend detection.
Colored Trend Cloud: Upward trend = cyan, downward = red.
Sideways Market: ADX filter to color bars purple if trend is weak/sideways.
Bar Colors: Green/red based on SuperTrend signals.
6. Swing & Structure Analysis
Detects Swing Highs/Lows, labels as HH, LH, LL, HL.
Detects CHoCH (Change of Character) or BOS (Break of Structure).
Can show internal or swing structures with configurable label size and color.
7. Order Blocks (Smart Money Concepts)
Detects Internal Order Blocks (iOB) and Swing Order Blocks (OB).
Stores top/bottom/left/time/type in arrays.
Colors and shows boxes based on bullish/bearish type.
Automatically deletes OB if price breaks the block.
8. Fair Value Gaps (FVG)
Identifies gaps between candles as potential trading zones.
Configurable bullish/bearish colors and extension bars.
9. EQH/EQL (Equal Highs/Lows)
Detects equal highs/lows using a threshold.
Plots dotted lines and labels EQH/EQL.
10. High/Low Levels MTF
Optional plotting of previous daily, weekly, monthly highs/lows.
11. Premium/Discount Zones
Plots Premium, Discount, and Equilibrium Zones.
Colors: Premium = red, Discount = green, Equilibrium = gray.
12. Alerts
Buy/Sell alerts for:
SuperTrend crossover
BOS/CHoCH (swing/internal)
EQH/EQL triggers
13. Miscellaneous
Configurable visuals: line style, label size, transparency.
Adjustable volatility filters, ATR lengths, smoothing constants.
Integrated risk & reward visualization.
✅ In short:
This is an all-in-one Smart Money + Trend indicator with SuperTrend signals, swing/structure detection, order blocks, FVGs, EQH/EQL, TP/SL visualization, and optional alerts. It’s designed for both trend-following and order-block-based trading.
If you want, I can make a super-short 1-paragraph version that summarizes it even faster for quick reference.

Dammu AI PROType & Purpose
Multi-functional trend, swing, and smart money concept indicator.
Combines SuperTrend, SMA, ATR-based risk management, swing structures, order blocks, EQH/EQL, and Fair Value Gaps (FVG).
Designed for identifying trends, entries/exits, and support/resistance zones.
2. Trend Detection
SuperTrend with ATR smoothing (nsensitivity*7 factor) for buy/sell signals.
SMA filter (8 & 9 periods) confirms trend strength.
Bar color changes:
Green if close > supertrend.
Red if close < supertrend.
Cirrus Cloud highlights trend zones with semi-transparent colors.
3. Swing & Structure
Detects pivot highs/lows and labels them as HH/LH (Highs), HL/LL (Lows).
Generates BOS (Break of Structure) and CHoCH (Change of Character) signals.
Internal swing structures and order blocks for short-term intraday moves.
4. Order Blocks
Internal Order Blocks (iOBs) and Swing Order Blocks (OBs).
Boxes drawn for bullish/bearish zones.
Auto-delete when broken.
Option to filter blocks by ATR or Cumulative Mean Range.
5. Risk Management
TP/SL levels based on ATR and user-defined % risk.
Shows lines and labels for:
Entry
Stop Loss
TP1, TP2, TP3
Adjustable line style (solid/dashed/dotted).
6. Fair Value Gaps (FVG)
Highlights bullish and bearish gaps.
Option for auto-threshold filtering.
Extendable FVG boxes.
7. EQH/EQL
Detects Equal Highs (EQH) and Equal Lows (EQL) for potential reversals.
Dotted lines with labels.
8. Smart Money Concepts (SMC) Features
Shows:
Swings (internal & swing structure)
Internal order blocks
Premium/Discount zones
Fair Value Gaps
Highs/Lows from previous day/week/month
Configurable for historical vs present display.
9. Alerts
Buy/Sell triggers:
bull = crossover of close above SuperTrend.
bear = crossunder of close below SuperTrend.
Alerts for BOS/CHoCH, EQH/EQL, and OB breaks.
10. Visualization
Trend clouds, colored bars, SMA markers, SuperTrend labels.
Multi-layered info displayed without cluttering the chart.
Customizable colors, line styles, and transparency.
✅ Summary:
This indicator is a comprehensive trading tool for trend detection, swing structure, order block analysis, and risk management. It’s built for smart money and SMC-based trading, offering visual cues and alerts for key trading decisions.

Buy/Sell Signals [WynTrader]My name is WynTrader. I cumulate 24 years of experience.
This Indicator produces Buy/Sell Signals using these features:
- Fast and Slow Moving averages (modifiable) optimized at EMA-8 and SMA-35
- Bollinger Bands (modifiable) optimized at Basis-18 and Multiplier-1
Also, the Buy/Sell Signals are conditioned by three Filters (optionable, modifiable) :
. Bollinger-Bands Lookback
. High-Low vs Candle Range %
. Distance from Fast and Slow Moving averages %
The Results Calculation presented in a Table are based :
- on the Current Chart Visible Range (optionable)
or
- on the specified TIme Frame Start and End Dates (modifiable)
The Table shows Calculation Results of the Buy and Sell Signals that are activated on the chart, with the Number of Trades (Signals), the Winning Points and the Win Rate %. The Buy&Hold starts calculation at the first Buy encountered.
So be surprised by my Buy/Sell Indicator. But always remember that the world is not perfect. The Graal Indicator, even with AI, doesn't already exist, maybe one day (all of us richier...), but not now. , depending on the chart product (stocks...), volatility, probabilities, unpredictable behaviour. , the moves, etc.
Enjoy
WynTrader
P. s. :
My name is WynTrader. I cumulate 24 years of experience. In 2001, I took an intensive technical analysis course taught by an exceptional friend, Cyril, who taught me everything I know. The foundation I gained through his teaching remains solid and relevant to this day, never failing me.
Before i made this Indicator, I have used many Trading View Buy/Sell Indicators using alone or combined RSI, SMI, OBV, MACD ATR, ADX, Neural, Fractal, Geometry, etc., that are already available for the Trading View community. A great thanks to those who give their time that help me build this tool.
Note that I'm not a programmer, so... ;-)
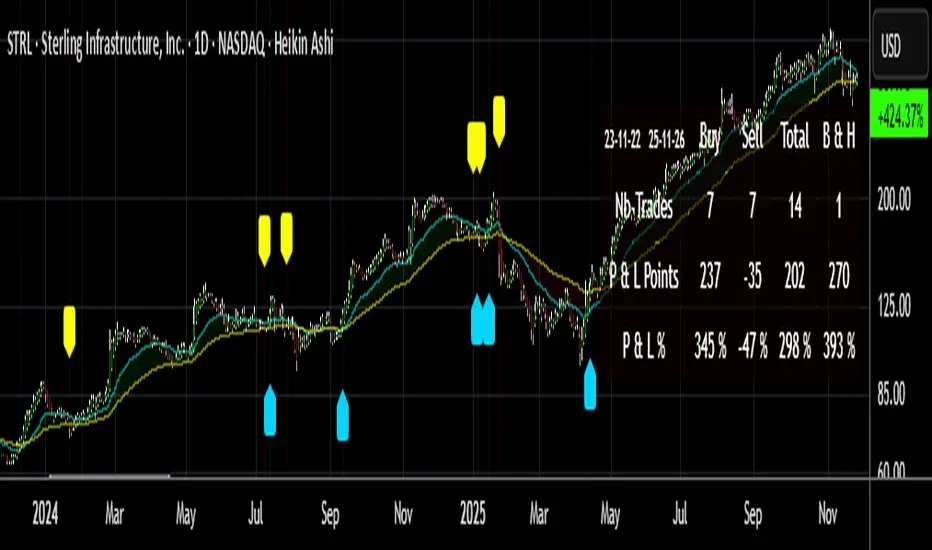
Quarter Levels — Auto Recentering NQ onlyQuarter Levels — Auto Recentering (PERMANENT) + Big Offset Labels
What it is
This tool paints true horizontal key levels that traders naturally anchor to: the 00 / 25 / 50 / 75 quarter levels (black), the 35 / 65 / 90 reaction levels (red), and the 10 / 80 sweep/edge levels (purple).
Lines are infinite horizontals and the grid auto-recenters ±200 points around current price each new bar. Labels on the right show the last two digits (e.g., 25, 35, 50, 65, 75, 80, 90), so you instantly know which level you’re at.
Why it helps
Markets often “snap” to simple numbers. These levels create a clean scaffold for intraday structure, pullbacks, and rotations—without clutter or lagging math.
Color Legend
Black — 00 / 25 / 50 / 75:
Core quarter levels. Expect frequent pauses, re-tests, and rotations.
Use: default S/R map; bias for mean-reversion inside ranges.
Red — 35 / 65 / 90:
“Continuation / reaction” levels. Price often accelerates through these once momentum takes.
Use: breakout guides and precise take-profit targets.
Purple — 10 / 80:
Sweep / edge levels. Price often wicks into these and rejects.
Use: fade the last push, or confirm a sweep before a reversal.
How it works
The script draws the levels as extend.both horizontals (not derived from candle points).
Every new bar, it rebuilds the grid around close ± 200 pts (editable in code: RANGE_POINTS).
Prices are snapped to tick (syminfo.mintick) so lines lock to the Y-axis.
Labels show only the offset (two-digit number) to keep the chart clean.
Setup & Customization
No inputs required.
If you want tweaks, open the code and edit at the top:
RANGE_POINTS – widen/narrow the vertical coverage.
LABEL_OFFSET – push labels further to the right.
LABEL_SIZE – size.small / normal / large.
Color & width constants (per group).
Practical Use (playbook)
Use this grid as a price map, not a signal generator. Combine it with your execution tools.
1) In Range Conditions
Fade to Black: When price rotates inside a range, look for exhaustion into black levels (00/25/50/75).
Plan: wait for rejection (wick + failed follow-through), enter back toward the mid/next quarter. Stop just beyond the level; first target the next red or black.
Purple Sweeps: Watch quick spikes into 10/80 that immediately fail.
Plan: fade the sweep with tight risk; scale out at 25/75; hold a runner to 50.
2) In Trend / Momentum
Red Rails (35/65/90): When momentum is strong, price often steps through red levels cleanly.
Plan: use them as continuation targets or trail anchors. If pullback holds above a prior red level, consider continuation with stop below that level.
Quarter-to-Quarter Ladders: In clean trends, expect quarter-to-quarter traversals (00→25→50→75→00…).
Plan: add on pullbacks to 25 or 50 with trend confirmation (e.g., 9/21 EMA stack or anchored VWAP hold).
3) Confluence (AI-logic suggestions)
Pair the grid with any two of:
VWAP / Anchored VWAP: Rejections at a quarter level + VWAP = higher quality entry.
EMAs (9/21/50/200): Use as directional filter. Only take longs at quarters when fast EMAs > slow EMAs.
Liquidity cues: Prior high/low, session O/H/L, or liquidity pools aligning with a quarter level.
Orderflow / footprint: Aggressive delta through a red level? Expect follow-through to the next black or red.
Volatility (ATR): If ATR expands, lean more on red levels (continuations). In compression, lean more on black and purple (fades).
Risk & Management Tips
Stops: Just beyond the level you’re trading against. Let the level “be wrong” to prove you wrong.
Targets: Next red or black line. Scale at the first, hold a small runner to the next.
Session awareness: Levels interact differently in Asia/EU/US. In US RTH, expect sharper responses at red and purple.
Timeframes: Works across all. Intraday (1–15m) for entries; 1h/4h daily for context.
Do not chase: If you miss the touch, wait for the next level; the map is dense by design.
Limitations
This indicator does not generate buy/sell signals; it supplies a stable structure.
In runaway trends, price can cut through multiple lines—use trend filters and risk caps.
Auto-recentering means the visible band travels with price; if you need static levels far away, increase RANGE_POINTS.
Troubleshooting
No labels? Make sure max_labels_count isn’t hit and SHOW_LABELS = true.
Labels too close to price? Increase LABEL_OFFSET.
Too many lines? Reduce RANGE_POINTS or hide a color group in code.
Credits / License
Created by: TRC — The Refuge Camp
License: Free to use on TradingView with attribution.
If you fork or embed, please credit “TRC — The Refuge Camp” and link back to the original post/profile.
Quick Start (TL;DR)
Add the script.
Trade the map:
Fade purple/black in ranges.
Target red/black in trends.
Combine with VWAP/EMAs or your orderflow tool for confirmation.
Respect stops just beyond the level; scale at the next line.
Happy trading, and welcome to the Quarter-Level grid.
