Support & Resistance AI LevelScopeSupport & Resistance AI LevelScope
Support & Resistance AI LevelScope is an advanced, AI-driven tool that automatically detects and highlights key support and resistance levels on your chart. This indicator leverages smart algorithms to pinpoint the most impactful levels, providing traders with a precise, real-time view of critical price boundaries. Save time and enhance your trading edge with effortless, intelligent support and resistance identification.
Key Features:
AI-Powered Level Detection: The LevelScope algorithm continuously analyzes price action, dynamically plotting support and resistance levels based on recent highs and lows across your chosen timeframe.
Sensitivity Control: Customize the sensitivity to display either major levels for a macro view or more frequent levels for detailed intraday analysis. Easily adjust to suit any trading style or market condition.
Level Strength Differentiation: Instantly recognize the strength of each level with visual cues based on how often price has touched each one. Stronger levels are emphasized, highlighting areas with higher significance, while weaker levels are marked subtly.
Customizable Visuals: Tailor the look of your chart with customizable color schemes and line thickness options for strong and weak levels, ensuring clear visibility without clutter.
Proximity Alerts: Receive alerts when price approaches key support or resistance, giving you a heads-up for potential market reactions and trading opportunities.
Who It’s For:
Whether you're a day trader, swing trader, or just want a quick, AI-driven way to identify high-probability levels on your chart, Support & Resistance AI LevelScope is designed to keep you focused and informed. This indicator is the perfect addition to any trader’s toolkit, empowering you to make more confident, data-backed trading decisions with ease.
Upgrade your analysis with AI-powered support and resistance—no more manual lines, only smart levels!
Search in scripts for "ai"

Luxmi AI Ultimate 1 Min Option ScalperThe Luxmi AI Ultimate 1 Min Option Scalper is a specialized trading indicator designed for use in options trading. This tool is particularly focused on providing actionable signals to option buyers within a one-minute timeframe, making it highly suitable for scalping—a trading strategy aimed at profiting from small price changes. Below is an elaboration on how this indicator functions and its significance in trading decisions:
### Key Features of Luxmi AI Ultimate 1 Min Option Scalper
1. **Enter and Don't Signals:**
- **Enter Signals:** These signals indicate the optimal moments to enter a trade, suggesting when to buy an option. They are typically based on sophisticated algorithms that analyze price movements, volume, volatility, and other relevant market data.
- **Don't Signals:** These signals advise traders to refrain from entering a trade. This could be due to market conditions that are not conducive to profitable trading, such as high volatility, low liquidity, or unclear directional trends.
2. **Directional Trading Strategy:**
- The Luxmi AI Ultimate 1 Min Option Scalper focuses on directional trading, which involves making trades based on the expected direction of the market. For option buyers, this means taking positions that profit from upward (call options) or downward (put options) movements in the price of the underlying asset.
3. **Scalping Approach:**
- Scalping is a short-term trading strategy that involves making numerous trades over the course of a trading session, aiming to capitalize on small price changes. The one-minute timeframe is particularly suited for scalping, as it allows traders to quickly enter and exit positions to capture minimal but frequent profits.
### Functionality and Benefits
1. **Real-Time Analysis:**
- The indicator provides real-time analysis and signals, ensuring that traders receive timely information to make quick trading decisions. This is crucial in the fast-paced environment of scalping, where delays can significantly impact profitability.
2. **Automated Decision-Making Support:**
- By automating the signal generation process, the Luxmi AI Ultimate 1 Min Option Scalper helps reduce the cognitive load on traders. This automation can lead to more consistent trading performance, as it mitigates the impact of emotional and psychological factors that often influence human decision-making.
3. **Market Adaptability:**
- The indicator is designed to adapt to changing market conditions, adjusting its signals based on the latest data. This adaptability enhances its effectiveness in various market environments, whether trending, ranging, or highly volatile.
4. **Risk Management:**
- Incorporating "Don't" signals as part of the strategy helps traders avoid entering trades in unfavorable conditions, thereby managing risk more effectively. This feature is particularly valuable in preventing losses and preserving capital.
5. **Educational Value:**
- For less experienced traders, using the Luxmi AI Ultimate 1 Min Option Scalper can provide a learning experience. By observing the signals and their outcomes, traders can develop a better understanding of market dynamics and refine their trading strategies.
### Practical Application
- **Setup:** Traders integrate the Luxmi AI Ultimate 1 Min Option Scalper into their trading platforms. This setup typically involves installing the indicator and configuring it to monitor the specific options and market data relevant to the trader's strategy.
- **Monitoring:** During trading hours, traders monitor the signals provided by the indicator. They prepare to act quickly on "Enter" signals and heed "Don't" signals to avoid unnecessary risks.
- **Execution:** When an "Enter" signal is generated, traders execute the recommended trade, buying the corresponding option. They then manage their positions closely, ready to exit based on their predetermined profit targets or stop-loss levels.
In summary, the Luxmi AI Ultimate 1 Min Option Scalper is a powerful tool for option buyers, providing critical buy and hold signals in a highly time-sensitive manner. Its primary benefits include enhancing decision-making speed, improving trading consistency, and managing risk, all of which are essential for successful scalping in options trading.

Hidden Zone Detector AI - Crypto/Forex/StockHidden Zone Detector AI - Crypto Forex Stock
Hidden Zone Detector AI is a professional TradingView indicator designed to find hidden supply and demand zones across markets — crypto, forex and stocks — and surface high-probability areas earlier than classical pivot-only methods. It combines price structure analysis, volatility/ATR sizing, volume profiling and multi-mode AI heuristics (Fast / Balanced / Accurate) to generate prediction zones, highlight tested areas, and visually mark zone breakouts. Built with practical trader workflow in mind: configurable anti-repaint options, adaptable Light/Dark UI, clear labels, and candle-coloring for immediate visual context.
How it works
• Detects hidden zones by scanning pivot formations and finding internal “hidden” bars that represent real institutional activity (not just visible swing points).
• Scores zones by size (ATR-relative), volume, and touch characteristics to produce a strength percentage (Weak/Medium/Strong).
• AI heuristics aggregate price, momentum, moving averages, RSI/MACD signals and volume patterns to propose prediction zones — adjustable for speed vs. accuracy.
• Zones are drawn as persistent boxes with optional midlines, labels, and tailored styling when broken or tested.
Main advantages
• Early edge: finds hidden zones that often act before obvious pivots.
• Actionable visuals: labeled zones, color-coded candles, and breakout styling speed decision-making.
• Flexible AI modes: choose Fast for responsiveness, Balanced for day-to-day use, or Accurate for stricter signals.
• Anti-repaint controls: require confirmed bars for predictions to improve signal reliability.
• Multi-market ready: tuned for crypto, forex and stock chart behavior.
• Light/Dark friendly: UI color handling ensures labels remain readable on any chart background.
• Open & reusable: released under Mozilla Public License 2.0 (MPL-2.0) — use and adapt freely with attribution.
Best practices & tips
• Start with Balanced mode and sensitivity ~5; increase sensitivity for earlier but noisier predictions.
• Use prediction confirmation (Require AI Prediction Confirmation) for lower repaint risk.
• Combine zone reads with higher-timeframe context and orderflow/volume tools for stronger entries.
• Adjust max active zones and opacity to keep charts clean on lower timeframes.
License & author
Mozilla Public License 2.0 (MPL-2.0).
Author: a_jabbaroff — created with care for the TradingView community and fellow traders.

MBAND 200 4H BTC/USDT - By MGS-TradingMBAND 200 4H BTC/USDT with RSI and Volume by MGS-Trading: A Neural Network-Inspired Indicator
Introduction:
The MBAND 200 4H BTC/USDT with RSI and Volume represents a groundbreaking achievement in the integration of artificial intelligence (AI) into cryptocurrency market analysis. Developed by MGS-Trading, this indicator is the culmination of extensive research and development efforts aimed at leveraging AI's power to enhance trading strategies. By synthesizing neural network concepts with traditional technical analysis, the MBAND indicator offers a dynamic, multi-dimensional view of the market, providing traders with unparalleled insights and actionable signals.
Innovative Approach:
Our journey to create the MBAND indicator began with a simple question: How can we mimic the decision-making prowess of a neural network in a trading indicator? The answer lay in the weighted aggregation of Exponential Moving Averages (EMAs) from multiple timeframes, each serving as a unique input akin to a neuron in a neural network. These weights are not arbitrary; they were painstakingly optimized through backtesting across various market conditions to ensure they reflect the significance of each timeframe’s contribution to overall market dynamics.
Core Features:
Neural Network-Inspired Weights: The heart of the MBAND indicator lies in its AI-inspired weighting system, which treats each timeframe’s EMA as an input node in a neural network. This allows the indicator to process complex market data in a nuanced and sophisticated manner, leading to more refined and informed trading signals.
Multi-Timeframe EMA Analysis: By analyzing EMAs from 15 minutes to 3 days, the MBAND indicator captures a comprehensive snapshot of market trends, enabling traders to make informed decisions based on a broad spectrum of data.
RSI and Volume Integration: The inclusion of the Relative Strength Index (RSI) and volume data adds layers of confirmation to the signals generated by the EMA bands. This multi-indicator approach helps in identifying high-probability setups, reinforcing the neural network’s concept of leveraging multiple data points for decision-making.
Usage Guidelines:
Signal Interpretation: The MBAND bands provide a visual representation of the market’s momentum and direction. A price moving above the upper band signals strength and potential continuation of an uptrend, while a move below the lower band suggests weakness and a possible downtrend.
Overbought/Oversold Conditions: The RSI component identifies when the asset is potentially overbought (>70) or oversold (<30). Traders should watch for these conditions near the MBAND levels for potential reversal opportunities.
Volume Confirmation: An increase in volume accompanying a price move towards or beyond an MBAND level serves as confirmation of the strength behind the move. This can indicate whether a breakout is likely to sustain or if a reversal has substantial backing.
Strategic Entry and Exit Points: Combine the MBAND readings with RSI and volume indicators to pinpoint strategic entry and exit points. For example, consider entering a long position when the price is near the lower MBAND, RSI indicates oversold conditions, and there is a notable volume increase.
About MGS-Trading:
At MGS-Trading, we are passionate about harnessing the transformative power of AI to revolutionize cryptocurrency trading. Our indicators and tools are designed to provide traders with advanced analytics and insights, drawing on the latest AI techniques and methodologies. The MBAND 200 4H BTC/USDT with RSI and Volume indicator is a prime example of our commitment to innovation, offering traders a sophisticated, AI-enhanced tool for navigating the complexities of the cryptocurrency markets.
Disclaimer:
The MBAND indicator is provided for informational purposes only and does not constitute investment advice. Trading cryptocurrencies involves significant risk and can result in the loss of your investment. We recommend conducting your own research and consulting with a qualified financial advisor before making any trading decisions.

Celestial Mirror AI Score PRO - Destiny QuantCelestial Mirror AI Score PRO - Destiny Quant | 【天機鏡】AI 評分系統
English Description
The Strategic Brain of Quantitative Trading. The Celestial Mirror AI Score PRO is a multi-factor weighting engine designed by Destiny Quant Lab. It acts as a digital "Mirror," revealing the hidden truth of market quality. By integrating over 10+ quantitative factors, including the proprietary Zanger Explosion Algorithm, it provides a real-time AI Score (0-99).
Institutional Detection: Uses advanced VSA logic to track "Smart Money" footprints.
Dual Engine: Switch between "Factor Analysis" (Swing) and "Explosion" (Momentum) modes.
Quant Dashboard: Real-time monitoring of momentum, volume structure, and pivot hierarchy.
中文說明
量化交易的策略大腦 【天機鏡】AI 評分系統 PRO 是由 天機量化實驗室 開發的多因子加權引擎。它如同數位之鏡,照見市場體質的虛實。本指標結合了 10 多項量化因子與獨家 Zanger 爆發演算法,將複雜盤面轉化為 0-99 的即時評分。
機構追蹤:透過進階量價分析 (VSA) 偵測大戶資金流向。
雙模式引擎:提供適合波段的「因子分析」與捕捉飆股噴發的「爆發預測」模式。
天機數據面板:即時監測動能、量能與樞軸位置,讓數據一目了然。
🚀 Get Access / 獲取授權 This is an Invite-only script. To unlock the Celestial Mirror, please:
Visit the link in my profile.
Send a direct message for subscription details.
本指標為 僅限邀請 (Invite-only)。欲獲取授權,請:
點擊我個人主頁的連結(官網/商店)。
透過 TradingView 私訊聯繫我了解訂閱詳情。

NEURAL FLOW | The AI-Powered Regime Classifier [by @Ash_TheTrade📉 Stop Trading Blindly. Filter the Noise with AI.
Why do your favorite strategies work perfectly one week and bleed your account the next?
The answer is simple: Context.
A Moving Average crossover works in a trend but gets slaughtered in chop. RSI works in a range but fails in a strong breakout. Most indicators are "dumb"—they apply the same math regardless of the market's current reality.
I created Neural Flow to fix this.
Developed by @Ash_TheTrader, this isn't just another buy/sell arrow indicator. It is a sophisticated market Regime Classifier built on concepts derived from machine learning (Lorentzian Distance algorithms).
It doesn't just tell you where price is; it tells you what the market is doing.
🧠 The Concept: How It Works
The core idea behind this script is simple yet powerful: Don't trade unless the environment is right.
The Neural Flow algorithm acts like a veteran trader watching over your shoulder. It analyzes multiple "neurons" (data points representing momentum, volatility, and cyclicality) and compares the current price action to historical data.
By identifying what "state" the market is currently in, it paints your chart in real-time, acting as the ultimate filter for any strategy you use.
👁️ The 4 Market Regimes
The indicator instantly classifies the market into one of four distinct states, visualizing them with a full-chart background glow and candle painting:
1. 🐂 Bull Trend (Neon Green)
The market has clear upward momentum, healthy RSI, and strong trend orientation.
Action: Look for Long entries. Buy dips.
2. 🐻 Bear Trend (Neon Red)
The market has clear downward momentum and weak underlying metrics.
Action: Look for Short entries. Sell rallies.
3. 🚫 CHOP (Grey/Monochrome)
This is the most important feature. The AI has detected low volatility squeeze conditions or directionless ADX. This is where 80% of traders lose money due to fake-outs and whipsaws.
Action: DO NOT TRADE. Sit on your hands and preserve capital.
4. ⚡ Breakout Detected (Gold/Yellow)
The algorithm has detected a sudden, violent expansion in volatility (Bollinger Width explosion) following a period of chop. The direction is not yet confirmed, but a big move is imminent.
Action: Get ready. Watch for a transition into a Bull or Bear regime.
💻 The Glassmorphism Dashboard & AI Confidence
In the corner of your chart, you will find a futuristic, transparent "Glass UI" dashboard designed by @Ash_TheTrader.
It provides instant situational awareness without cluttering your view.
The AI Confidence Score:
This is your conviction meter. It calculates how aligned the various "neurons" of the algorithm are (ranging from 0% to 100%).
A Bull Trend with 40% Confidence might be weak and prone to reversal.
A Bull Trend with 85%+ Confidence indicates strong confluence across multiple data points.
Pro Tip from @Ash_TheTrader: Only take trades when the AI Confidence is above 75%.
🚀 How to Use This in Your Trading
This tool is designed to be versatile.
As a Strategy Filter (Recommended): Use your existing favorite strategy (e.g., MACD, SMC, Price Action). Before taking a trade, glance at the Neural Flow background.
Your strategy says Buy, but the background is Grey (Chop)? Skip the trade.
Your strategy says Sell, and the background is Red (Bear)? Take the trade with confidence.
As a Standalone System: Wait for the market to transition out of "Grey Chop" into a "Green Bull" or "Red Bear" regime. Confirm that the "AI Confidence" on the dashboard is high (>70%), and enter in the direction of the new trend.
⚙️ Settings & Customization
While the default settings are tuned for most markets, @Ash_TheTrader believes in flexibility:
Training Window: Adjust the sensitivity of the regime detection.
Visuals: Customize all colors to match your chart aesthetic.
Glass Dashboard: Move it, resize it, or turn it off completely.
Baseline EMA: Toggle the 50-period baseline reference line on or off to keep your charts ultra-clean.
A Note from the Author:
"Trading isn't about catching every move; it's about catching the right moves and staying safe during the noise. I built this tool to help me instantly recognize when to step on the gas and when to hit the brakes. I hope it brings clarity to your charts."
— @Ash_TheTrader
Disclaimer: This tool is for informational purposes only and does not constitute financial advice. Always manage your risk.

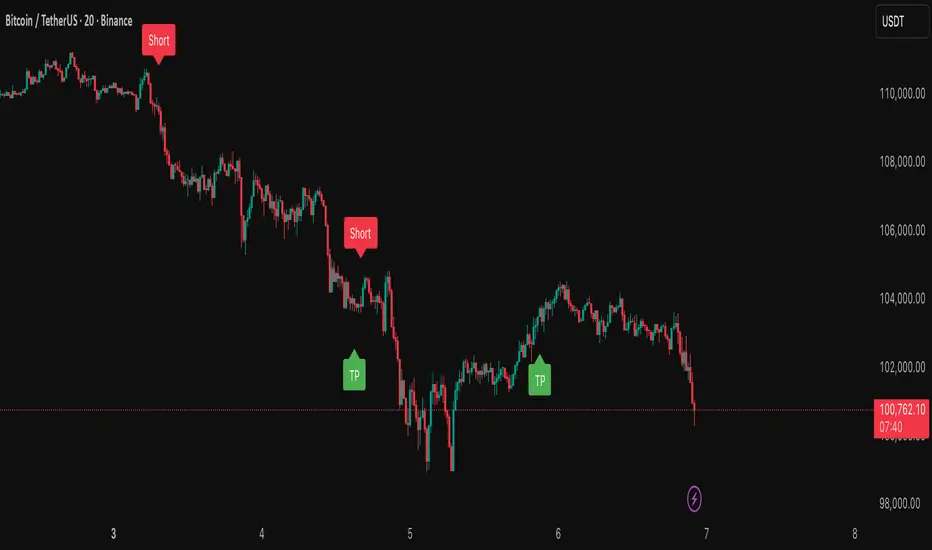
Unlock Your Trading Edge with the Boost AIBINANCE:BTCUSDT
Stop the guesswork. Stop the "analysis paralysis." Stop using tools that look great in hindsight but fail in live trading.
We've combined more than 10 years of trading expertise with cutting edge AI to bring to you Boost AI for one reason: to create a real, tradeable edge.
This isn't just another "signal" indicator. It's an AI-driven engine that has been rigorously backtested, showing a 55x return over the last 5 years of market data. This indicator is built for BTC and is ideal on a 20min timeframe.
Why it's the only indicator you'll need:
Crystal-Clear Signals: Get simple, actionable "Buy" and "Sell" signals. No more confusion.
100% NON-REPAINTING: This is our core promise. The signal you see is the signal you trade. What you see on the chart is what you would have seen in real-time. No repainting. No back-fitting. No excuses.
AI-Driven Edge: Our proprietary AI model adapts to changing market conditions, identifying high-probability setups that human analysis often misses.
Proven Performance: The 55x backtest isn't a "perfect scenario" guess. It's the result of 5 years of historical data, giving you a baseline of the algorithm's performance.
Disclaimer: Past performance is not indicative of future results. The 55x return is based on a historical backtest and does not guarantee future profits. All trading involves risk, and you should only trade with capital you can afford to lose.
How to Get Access:
Access is $9.99 USDT per month.
Send Payment: Transfer 9.99 USDT (on the ERC-20 network) to this address: 0x1d8cb08411bdd334781e290e4fc2e64c9da67c9c
After paying, send us a DM and we'll give you access.
Get Access: Payment verification and granting access to your TradingView account may take upto 24 hours (However, in most cases, users have been given access in a few hours)
Execution Heatmap v4.1 — AI EnhancedThis indicator is an AI‑style execution dashboard that compresses structure, momentum, volume, volatility, and risk into a compact heatmap panel plus BUY/SELL signals on the chart. It is specifically tuned for gold and silver, automatically adapting its thresholds to the volatility profile of XAU/GC and XAG/SI symbols.
Core architecture
The system builds a multi‑factor model in layers:
Adaptive structure engine: Tracks dynamic higher‑high / lower‑low progression using rolling reference highs and lows, classifying price as structural UP, DOWN, or NEUTRAL.
Precision VWAP bias: Uses VWAP with a small threshold band to filter out noise and label price as ABOVE, BELOW, or neutral relative to value.
Impulse & angle: Combines short‑term rate of change and normalized slope (price vs ATR over 5 bars) to detect directional thrust, then clamps values into
for stable scoring.
Volume, wicks, and patterns
Adaptive volume tiers: Uses a 20‑bar volume average with gold/silver‑specific multipliers to tag candles as SURGE, HIGH, NORMAL, or LOW volume, with distinct coloring for extremes.
Wick analytics: Measures upper/lower wick size vs total range to detect demand/supply style rejections and encode them as bullish or bearish wick signals.
AI pattern score: Blends structure, VWAP, impulse, wicks, and angle into a normalized pattern score, then classifies it as STRONG↑, NEU↑, NEU, NEU↓, or STRONG↓ with color‑coded emphasis.
AI scoring and prediction layer
Predictive engine: Uses a neural‑network‑style weighted sum of structure, VWAP, impulse, wicks, angle, volume, and pattern to generate a prediction score in
, then converts it into a percentage and arrow (↑, ↑↑, ↓, ↓↓, →) for intuitive directional bias.
Execution score: Aggregates key factors into an EXEC score (0–200+ style scale), color‑graded from weak (red) through medium (orange) to strong (green) execution context.
Uncertainty & risk: Separately models uncertainty (low impulse/angle or low conviction) and risk (fake breaks, VWAP position, uncertainty tier, low volume), then feeds them into a combined confidence calculation.
Final signal & confidence
Final classification:
BUY: High exec score, high confidence, and controlled risk.
SELL: Very low exec score, low confidence in upside, and acceptable risk.
WAIT: All other conditions where edge or clarity is insufficient.
Confidence bar: A textual mini‑bar (🟩 blocks) plus percentage shows how strong the current signal environment is, making it easy to visually gauge setup quality at a glance.
Professional heatmap panel
A two‑column table in the top‑right of the chart organizes the logic into layers:
Base layer: STRUCT, VWAP, IMPULSE, VOLUME.
AI layer: FAKE, REGIME (Trend/Pullback/Reverse/Chop), ANGLE.
Decision layer: PATTERN, PREDICT, EXEC, RISK, CONF, and FINAL direction.

Flux AI PullBack System (Hybrid Pro)Flux AI PullBack System (Hybrid Pro)
//Session-Aware | Adaptive Confluence | Grace Confirm Logic//
Overview:
The Flux AI PullBack System (Hybrid Pro v5) is an adaptive, session-aware pullback indicator designed to identify high-probability continuation setups within trending markets. It automatically adjusts between “Classic” and “Enhanced” logic modes based on volatility, volume, and ATR slope, allowing it to perform seamlessly across different market sessions (Asian, London, and New York).
Core Features:
Hybrid Auto Mode — Dynamically switches between Classic (fast-moving) and Enhanced (strict) modes.
Session-Aware Context — Optimized for intraday trading in ES, NQ, and SPY.
Grace Confirmation Logic — Validates pullbacks with a follow-through condition to reduce noise.
Adaptive EMA Zone (38/62) — Highlights pullback areas with dynamic aqua fill and transparency linked to trend strength.
Noise Suppression Filter — Prevents false pullbacks during EMA crossovers or unstable transitions.
Weighted Confluence Model — Combines trend, ATR, volume, and swing structure for confirmation strength.
Pine v6 Compliant Alerts — Constant-string safe, ready for webhooks and automation.
Visual Elements:
Aqua EMA Zone: Displays the “breathing” pullback band (tightens during volatility spikes).
PB↑ / PB↓ Markers: Confirmed pullbacks with subtle transparency and fixed label size.
Bar Highlights: Yellow for pullbacks; ice-blue for confirmed continuation.
Use Cases
Perfect for:
Intraday trend traders
0DTE SPX / ES scalpers
Futures traders (NQ, MNQ, MES)
Algorithmic strategy builders using webhooks
Recommended Timeframes:
1–15 minute charts (scalping / intraday)
Higher timeframes for swing confirmations.
Attribution:
This open-source script was inspired by Chris Moody’s “CM Slingshot System” and JustUncleL’s Pullback Tools, but it was built from scratch using AI-assisted code refinement (ChatGPT).
All logic and enhancements are original, not derived from proprietary software.
License: MIT (Open Source)
© 2025 Ken Anderson — You may modify, use, or redistribute with credit.
Keywords:
Pullback, Reversal, AI Trading, EMA Zone, Session Aware, Futures Trading, SPX, ES, NQ, ATR Filter, Volume Confirmation, Flux System, Pine Script v6, Non-Repainting, Adaptive Trading Indicator.

Luxmi AI Filtered Option Scalping Signals (INDEX)Introduction:
Luxmi AI Filtered Option Scalping Signals (INDEX) is an enhanced iteration of the Luxmi AI Directional Option Buying (Long Only) indicator. It's designed for use on index charts alongside the Luxmi AI Smart Sentimeter (INDEX) indicator to enhance performance. This indicator aims to provide refined signals for option scalping strategies, optimizing trading decisions within index markets.
Understanding directional bias is crucial when trading index and index options because it helps traders align their strategies with the expected movement of the underlying index.
The Luxmi AI Filtered Option Scalping Signals (INDEX) indicator aims to simplify and expedite decision-making through comprehensive technical analysis of various data points on a chart. By leveraging advanced analysis of data points, this indicator scrutinizes multiple factors simultaneously to offer traders clear and rapid insights into market dynamics.
The indicator is specifically designed for option scalping, a trading strategy that aims to profit from short-term price fluctuations. It prioritizes signals that are conducive to quick execution and capitalizes on rapid market movements typical of scalping strategies.
Major Features:
Trend Cloud:
Working Principle:
The script utilizes the Relative Strength Index (RSI) to assess market momentum, identifying bullish and bearish phases based on RSI readings. It calculates two boolean variables, bullmove and bearmove, which signal shifts in momentum direction by considering changes in the Exponential Moving Average (EMA) of the closing price. When RSI indicates bullish momentum and the closing price's EMA exhibits positive changes, bullmove is triggered, signifying the start of a bullish phase. Conversely, when RSI suggests bearish momentum and the closing price's EMA shows negative changes, bearmove is activated, marking the beginning of a bearish phase. This systematic approach helps in understanding the current trend of the price. The script visually emphasizes these phases on the chart using plot shape markers, providing traders with clear indications of trend shifts.
Benefits of Using Trend Cloud:
Comprehensive Momentum Assessment: The script offers a holistic view of market momentum by incorporating RSI readings and changes in the closing price's EMA, enabling traders to identify both bullish and bearish phases effectively.
Structured Trend Recognition: With the calculation of boolean variables, the script provides a structured approach to recognizing shifts in momentum direction, enhancing traders' ability to interpret market dynamics.
Visual Clarity: Plotshape markers visually highlight the start and end of bullish and bearish phases on the chart, facilitating easy identification of trend shifts and helping traders to stay informed.
Prompt Response: Traders can promptly react to changing market conditions as the script triggers alerts when bullish or bearish phases begin, allowing them to seize potential trading opportunities swiftly.
Informed Decision-Making: By integrating various indicators and visual cues, the script enables traders to make well-informed decisions and adapt their strategies according to prevailing market sentiment, ultimately enhancing their trading performance.
How to use this feature:
The most effective way to maximize the benefits of this feature is to use it in conjunction with other key indicators and visual cues. By combining the color-coded clouds, which indicate bullish and bearish sentiment, with other features such as IS candles, microtrend candles, volume candles, and sentimeter candles, traders can gain a comprehensive understanding of market dynamics. For instance, aligning the color of the clouds with the trend direction indicated by IS candles, microtrend candles, and sentimeter candles can provide confirmation of trend strength or potential reversals.
Furthermore, traders can leverage the trend cloud as a trailing stop-loss tool for long entries, enhancing risk management strategies. By adjusting the stop-loss level based on the color of the cloud, traders can trail their positions to capture potential profits while minimizing losses. For long entries, maintaining the position as long as the cloud remains green can help traders stay aligned with the prevailing bullish sentiment. Conversely, a shift in color from green to red serves as a signal to exit the position, indicating a potential reversal in market sentiment and minimizing potential losses. This integration of the trend cloud as a trailing stop-loss mechanism adds an additional layer of risk management to trading strategies, increasing the likelihood of successful trades while reducing exposure to adverse market movements.
Moreover, the red cloud serves as an indicator of decay in option premiums and potential theta effect, particularly relevant for options traders. When the cloud turns red, it suggests a decline in option prices and an increase in theta decay, highlighting the importance of managing options positions accordingly. Traders may consider adjusting their options strategies, such as rolling positions or closing out contracts, to mitigate the impact of theta decay and preserve capital. By incorporating this insight into options pricing dynamics, traders can make more informed decisions about their options trades.
Scalping Cloud:
The scalping cloud serves as a specialized component within the trend cloud feature, specifically designed to pinpoint potential long and short entry points within the overarching trend cloud. Here's how it works:
Trend Identification: The trend cloud feature typically highlights the prevailing trend direction based on various technical indicators, price action, or other criteria. It visually represents the momentum and direction of the market over a given period.
Refined Entry Signals: Within this broader trend context, the scalping cloud narrows its focus to identify shorter-term trading opportunities. It does this by analyzing more granular price movements and shorter timeframes, seeking out potential entry points that align with the larger trend.
Long and Short Entries: The scalping cloud distinguishes between potential long (buy) and short (sell) entry opportunities within the trend cloud. For instance, within an uptrend indicated by the trend cloud, the scalping cloud might identify brief retracements or pullbacks as potential long entry points. Conversely, in a downtrend, it may signal short entry opportunities during temporary upward corrections.
Risk Management: By identifying potential entry points within the context of the trend, the scalping cloud also aids in risk management. Traders can use these signals to place stop-loss orders and manage their positions effectively, reducing the risk of adverse price movements.
The scalping cloud operates by analyzing the crossover and crossunder events between two key indicators: the Double Exponential Moving Average (DEMA) and a Weighted Average. Here's how it works:
Double Exponential Moving Average (DEMA): DEMA is a type of moving average that seeks to reduce lag by applying a double smoothing technique to price data. It responds more quickly to price changes compared to traditional moving averages, making it suitable for identifying short-term trends and potential trading opportunities.
Weighted Average: The weighted average calculates the average price of an asset over a specified period. However, it incorporates a weighting scheme that assigns more significance to recent price data, resulting in a more responsive indicator that closely tracks current market trends.
CE and NO CE Signals:
CE signals typically represent a Long Scalping Opportunity, suggesting that conditions are favorable for entering a long position. These signals indicate a strong upward momentum in the market, which traders can exploit for short-term gains through scalping strategies.
On the other hand, when there are no CE signals present, it doesn't necessarily mean that the trend has reversed or turned bearish. Instead, it indicates that the trend is still bullish, but the market is experiencing an active pullback. During a pullback, prices may temporarily retreat from recent highs as traders take profits or reevaluate their positions. While the overall trend remains upward, the pullback introduces a degree of uncertainty, making it less favorable for entering new long positions.
In such a scenario, traders may opt to exercise caution and refrain from entering new long positions until the pullback phase has concluded. Instead, they might consider waiting for confirmation signals, such as the resumption of CE signals or other bullish indications, before reengaging in long positions.
PE and NO PE Signals:
PE signals typically indicate a Short Entry opportunity, signaling that market conditions are conducive to entering a short position.
Conversely, when there are no PE signals present, it signifies that while the trend remains bearish, the market is currently in an active phase of consolidation or pullback. During such periods, prices may temporarily rise from recent lows, reflecting a pause in the downward momentum. While the overall trend remains downward, the absence of PE signals suggests that it may not be an optimal time to enter new short positions.
In this context, traders may exercise caution and wait for clearer signals before initiating new short positions. They might monitor the market closely for signs of a resumption in bearish momentum, such as the emergence of PE signals or other bearish indications. Alternatively, traders may choose to wait on the sidelines until market conditions stabilize or provide clearer directional signals.
Working Principle Of CE and PE Signals:
The feature calculates candlestick values based on the open, high, low, and close prices of each bar. By comparing these derived candlestick values, it determines whether the current candlestick is bullish or bearish. Additionally, it signals when there is a change in the color (bullish or bearish) of the derived candlesticks compared to the previous bar, enabling traders to identify potential shifts in market sentiment.
Micro Trend Candles:
Working Principle:
This feature begins by initializing variables to determine trend channel width and track price movements. Average True Range (ATR) is then calculated to measure market volatility, influencing the channel's size. Highs and lows are identified within a specified range, and trends are assessed based on price breaches, with potential changes signaled accordingly. The price channel is continually updated to adapt to market shifts, and arrows are placed to indicate potential entry points. Colors are assigned to represent bullish and bearish trends, dynamically adjusting based on current market conditions. Finally, candles on the chart are colored to visually depict the identified micro trend, offering traders an intuitive way to interpret market sentiment and potential entry opportunities.
Benefits of using Micro Trend Candles:
Traders can use these identified micro trends to spot potential short-term trading opportunities. For example:
Trend Following: Traders may decide to enter trades aligned with the prevailing micro trend. If the candles are consistently colored in a certain direction, traders may consider entering positions in that direction.
Reversals: Conversely, if the script signals a potential reversal by changing the candle colors, traders may anticipate trend reversals and adjust their trading strategies accordingly. For instance, they might close existing positions or enter new positions in anticipation of a trend reversal.
It's important to note that these micro trends are short-term in nature and may not always align with broader market trends. Therefore, traders utilizing this script should consider their trading timeframes and adjust their strategies accordingly.
How to use this feature:
This feature assigns colors to candles to represent bullish and bearish trends, with adjustments made based on current market conditions. Green candles accompanied by a green trend cloud signal a potential long entry, while red candles suggest caution, indicating a bearish trend. This visual representation allows traders to interpret market sentiment intuitively, identifying optimal entry points and exercising caution during potential downtrends.
Scalping Candles (Inspired by Elliott Wave and Open Interest Concepts):
Working Principle:
This feature draws inspiration from the Elliot Wave method, utilizing technical analysis techniques to discern potential market trends and sentiment shifts. It begins by calculating the variance between two Exponential Moving Averages (EMAs) of closing prices, mimicking Elliot Wave's focus on wave and trend analysis. The shorter-term EMA captures immediate price momentum, while the longer-term EMA reflects broader market trends. A smoother Exponential Moving Average (EMA) line, derived from the difference between these EMAs, aids in identifying short-term trend shifts or momentum reversals.
Benefits of using Scalping Candles Inspired by Elliott Wave:
The Elliott Wave principle is a form of technical analysis that attempts to predict future price movements by identifying patterns in market charts. It suggests that markets move in repetitive waves or cycles, and traders can potentially profit by recognizing these patterns.
While this script does not explicitly analyze Elliot Wave patterns, it is inspired by the principle's emphasis on trend analysis and market sentiment. By calculating and visualizing the difference between EMAs and assigning colors to candles based on this analysis, the script aims to provide traders with insights into potential market sentiment shifts, which can align with the broader philosophy of Elliott Wave analysis.
How to use this feature:
Candlestick colors are assigned based on the relationship between the EMA line and the variance. When the variance is below or equal to the EMA line, candles are colored red, suggesting a bearish sentiment. Conversely, when the variance is above the EMA line, candles are tinted green, indicating a bullish outlook. Though not explicitly analyzing Elliot Wave patterns, the script aligns with its principles of trend analysis and market sentiment interpretation. By offering visual cues on sentiment shifts, it provides traders with insights into potential trading opportunities, echoing Elliot Wave's emphasis on pattern recognition and trend analysis.
Chart Timeframe Support and Resistance:
Working Principle:
This feature serves to identify and visualize support and resistance levels on the chart, primarily based on the chosen Chart Timeframe (CTF). It allows users to specify parameters such as the number of bars considered on the left and right sides of each pivot point, as well as line width and label color. Moreover, users have the option to enable or disable the display of these levels. By utilizing functions to calculate pivot highs and lows within the specified timeframe, the script determines the highest high and lowest low surrounding each pivot point.
Additionally, it defines functions to create lines and labels for each detected support and resistance level. Notably, this feature incorporates a trading method that emphasizes the concept of resistance turning into support after breakouts, thereby providing valuable insights for traders employing such strategies. These lines are drawn on the chart, with colors indicating whether the level is above or below the current close price, aiding traders in visualizing key levels and making informed trading decisions.
Benefits of Chart Timeframe Support and Resistance:
Identification of Price Levels: Support and resistance levels help traders identify significant price levels where buying (support) and selling (resistance) pressure may intensify. These levels are often formed based on historical price movements and are regarded as areas of interest for traders.
Decision Making: Support and resistance levels assist traders in making informed trading decisions. By observing price reactions near these levels, traders can gauge market sentiment and adjust their strategies accordingly. For example, traders may choose to enter or exit positions, set stop-loss orders, or take profit targets based on price behavior around these levels.
Risk Management: Support and resistance levels aid in risk management by providing reference points for setting stop-loss orders. Traders often place stop-loss orders below support levels for long positions and above resistance levels for short positions to limit potential losses if the market moves against them.
How to use this feature:
Planning Long Positions: When considering long positions, it's advantageous to strategize when the price is in proximity to a support level identified by the script. This suggests a potential area of buying interest where traders may expect a bounce or reversal in price. Additionally, confirm the bullish bias by ensuring that the trend cloud is green, indicating favorable market conditions for long trades.
Waiting for Breakout: If long signals are generated near resistance levels detected by the script, exercise patience and wait for a breakout above the resistance. A breakout above resistance signifies potential strength in the upward momentum and may present a more opportune moment to enter long positions. This approach aligns with trading methodologies that emphasize confirmation of bullish momentum before initiating trades.
StopLoss and Target Lines:
In addition to generating entry signals, this indicator also incorporates predefined stop-loss ray lines and configurable risk-reward (R:R) target lines to enhance risk management and profit-taking strategies. Here's how these features work:
Predefined Stop-loss Ray Lines: The indicator automatically plots stop-loss ray lines on the chart, serving as visual guidelines for setting stop-loss levels. These stop-loss lines are predetermined based on specific criteria, such as volatility levels, support and resistance zones, or predefined risk parameters. Traders can use these lines as reference points to place their stop-loss orders, aiming to limit potential losses if the market moves against their position.
Configurable Risk-Reward (R:R) Target Lines: In addition to stop-loss lines, the indicator allows traders to set configurable risk-reward (R:R) target lines on the chart. These target lines represent predefined price levels where traders intend to take profits based on their desired risk-reward ratio. By adjusting the placement of these lines, traders can customize their risk-reward ratios according to their trading preferences and risk tolerance.
Risk Management: The predefined stop-loss ray lines help traders manage risk by providing clear exit points if the trade goes against their expectations. By adhering to these predetermined stop-loss levels, traders can minimize potential losses and protect their trading capital, thereby enhancing overall risk management.
Profit-taking Strategy: On the other hand, the configurable R:R target lines assist traders in establishing profit-taking strategies. By setting target levels based on their desired risk-reward ratio, traders can aim to capture profits at predefined price levels that offer favorable risk-reward profiles. This allows traders to systematically take profits while ensuring that potential gains outweigh potential losses over the long term.
The stop-loss and target lines incorporated in this indicator are dynamic in nature, providing traders with the flexibility to utilize them as trailing stop-loss and extended take-profit targets. Here's how these dynamic features work:
Trailing Stop-loss: Traders can employ the stop-loss lines as trailing stop-loss levels, allowing them to adjust their stop-loss orders as the market moves in their favor. As the price continues to move in the desired direction, indicator can dynamically adjust the stop-loss line to lock in profits while still allowing room for potential further gains. This trailing stop-loss mechanism helps traders secure profits while allowing their winning trades to continue running as long as the market remains favorable.
Extended Take Profit Targets: Similarly, traders can utilize the target lines as extended take-profit targets, enabling them to capture additional profits beyond their initial profit targets. By adjusting the placement of these target lines based on evolving market conditions or technical signals, traders can extend their profit-taking strategy to capitalize on potential price extensions or trend continuations. This flexibility allows traders to maximize their profit potential by capturing larger price movements while managing their risk effectively.
Rangebound Bars:
When the Rangebound Bars feature is enabled, the indicator represents candles in a distinct purple color to visually denote periods of sideways or range-bound price action. This visual cue helps traders easily identify when the market is consolidating and lacking clear directional momentum. Here's how it works:
Purple Candle Color: When the Rangebound Bars feature is active, the indicator displays candlesticks in a purple color to highlight periods of sideways price movement. This color differentiation stands out against the usual colors used for bullish (e.g., green or white) and bearish (e.g., red or black) candles, making it easier for traders to recognize range-bound conditions at a glance.
Signaling Sideways Price Action: The purple coloration of candles indicates that price movements are confined within a relatively narrow range and lack a clear upward or downward trend. This may occur when the market is consolidating, experiencing indecision, or undergoing a period of accumulation or distribution.
Working Principle:
The Rangebound Bars feature of this indicator is designed to assist traders in identifying and navigating consolidating market conditions, where price movements are confined within a relatively narrow range. This feature utilizes Pivot levels and the Average True Range (ATR) concept to determine when the market is range-bound and provides signals to stay out of such price action. Here's how it works:
Pivot Levels: Pivot levels are key price levels derived from the previous period's high, low, and closing prices. They serve as potential support and resistance levels and are widely used by traders to identify significant price levels where price action may stall or reverse. The Rangebound Bars feature incorporates Pivot levels into its analysis to identify ranges where price tends to consolidate.
Average True Range (ATR): The Average True Range is a measure of market volatility that calculates the average range between the high and low prices over a specified period. It provides traders with insights into the level of price volatility and helps set appropriate stop-loss and take-profit levels. In the context of the Rangebound Bars feature, ATR is used to gauge the extent of price fluctuations within the identified range.

Luxmi AI Smart Sentimeter (Index) "Performance or the direction of indices depend on the performance or direction of its constituents"
The above statement succinctly highlights the fundamental relationship between the movements of stock indices and the individual stocks that comprise them. Essentially, the statement underscores the fact that the overall performance and direction of an index are directly influenced by the collective performance and direction of its constituent stocks.
In essence, when the majority of stocks within an index experience positive movements, such as price increases or upward trends, the index itself tends to rise. Conversely, if a significant number of constituent stocks exhibit negative movements, such as price decreases or downward trends, the index is likely to decline.
This interdependence between indices and their constituents reflects the broader market sentiment and economic conditions. Individual stock movements contribute to the overall market sentiment, which is reflected in the movements of the index. Therefore, investors and traders often analyze the performance of underlying constituents to gain insights into market trends, sentiment shifts, and potential trading opportunities.
In summary, the statement emphasizes the integral role that individual stocks play in shaping the performance and direction of stock indices, highlighting the importance of monitoring constituent stocks when analyzing and trading in the financial markets.
Analyzing the performance of underlying constituents is crucial when trading index futures and options due to several reasons:
Index Composition Impact: Index futures and options derive their value from the performance of the underlying index, which, in turn, is determined by the constituent stocks. Understanding how individual stocks within the index are performing provides insights into the broader market sentiment and direction.
Diversification Assessment: Indices typically consist of a diverse range of stocks across various sectors. Analyzing the performance of these constituent stocks allows traders to assess the overall health of the market and identify sector-specific trends or weaknesses. This information is vital for constructing a well-diversified portfolio and managing risk effectively.
Sector Rotation Strategies: Different sectors perform differently under various market conditions. Analyzing the performance of underlying constituents enables traders to identify sectors that are outperforming or underperforming relative to the broader market. This insight can be utilized to implement sector rotation strategies, where traders adjust their portfolio allocations based on the expected performance of different sectors.
Options Pricing and Hedging: In options trading, the performance of underlying constituents directly affects the pricing of options contracts. Volatility, correlation among stocks, and individual stock movements all influence options prices. By analyzing the performance of underlying constituents, traders can better understand the factors driving options pricing and implement more effective hedging strategies.
Technical Analysis Confirmation: Technical analysis techniques often rely on price movements and patterns observed in individual stocks. Analyzing the performance of underlying constituents can confirm or invalidate technical signals generated by the index itself, providing additional conviction for trading decisions.
In summary, analyzing the performance of underlying constituents when trading index futures and options is essential for understanding market dynamics, identifying trading opportunities, managing risk, and making informed trading decisions. By staying informed about individual stock movements within an index, traders can gain a deeper understanding of market trends and position themselves for success in the ever-changing financial markets.
Workng Principle of Luxmi AI Smart Sentimeter:
The Luxmi AI Smart Sentimeter indicator is a powerful tool designed for traders to gain insights into market sentiment and trend strength. This indicator amalgamates data from multiple stocks to provide a comprehensive overview of market conditions. Let's delve into its components, functionalities, and potential applications.
Firstly, the indicator allows users to input symbols for up to ten different stocks. These symbols serve as the basis for retrieving closing prices, which are essential for conducting technical analysis. The flexibility to choose symbols empowers traders to tailor their analysis according to their preferences and market focus.
The indicator's core functionality revolves around the calculation of a combined Moving Averages of various lenghts, which aggregates the closing prices of the selected stocks. This combined combined analysis serves as a pivotal metric for assessing overall market trends and sentiment. By incorporating data from multiple stocks, the indicator offers a holistic view of market dynamics, reducing the impact of individual stock fluctuations.
To further refine the analysis, the combined Moving Average Data undergoes a smoothing process using another additional Moving Average (SMA). This smoothing mechanism helps filter out noise and provides a clearer depiction of underlying trends, thereby enhancing the indicator's effectiveness.
Moreover, the indicator computes an oscillator by measuring the difference between the combined MA and the smoothed MA. This oscillator serves as a valuable tool for gauging trend strength and identifying potential reversal points in the market, offering further insights into market momentum and directionality.
The indicator's graphical representation includes plots of the oscillator and its MA, facilitating visual interpretation of trend dynamics and momentum shifts. Furthermore, the script generates visual signals, such as UP and DOWN triangles, to highlight crossover and crossunder events on the oscillator, aiding traders in making timely and informed trading decisions.
In practice, the Luxmi AI Smart Sentimeter indicator offers a myriad of applications for traders across various trading styles and timeframes. Traders can utilize it to assess market sentiment, identify trend reversals, and confirm trade signals generated by other technical indicators. Additionally, the indicator can serve as a valuable tool for conducting market analysis, formulating trading strategies, and managing risk effectively.
In conclusion, the Luxmi AI Smart Sentimeter indicator represents a sophisticated yet accessible tool for traders seeking to navigate the complexities of the financial markets. With its robust features, customizable parameters, and insightful analysis, this indicator stands as a testament to the potential of data-driven approaches in trading and investment.
Settings:
The Index Constituent Analysis setting empowers users to input the constituents of a specific index, facilitating the analysis of market sentiments based on the performance of these individual components. An index serves as a statistical measure of changes in a portfolio of securities representing a particular market or sector, with constituents representing the individual assets or securities comprising the index.
By providing the constituent list, users gain insights into market sentiments by observing how each constituent performs within the broader index. This analysis aids traders and investors in understanding the underlying dynamics driving the index's movements, identifying trends or anomalies, and making informed decisions regarding their investment strategies.
This setting empowers users to customize their analysis based on specific indexes relevant to their trading or investment objectives, whether tracking a benchmark index, sector-specific index, or custom index. Analyzing constituent performance offers a valuable tool for market assessment and decision-making.
Example: BankNifty Index and Its Constituents
Illustratively, the BankNifty index represents the performance of the banking sector in India and includes major banks and financial institutions listed on the National Stock Exchange of India (NSE). Prominent constituents of the BankNifty index include:
State Bank of India (SBIN)
HDFC Bank
ICICI Bank
Kotak Mahindra Bank
Axis Bank
IndusInd Bank
Punjab National Bank (PNB)
Yes Bank
Federal Bank
IDFC First Bank
By utilizing the Index Constituent Analysis setting and inputting these constituent stocks of the BankNifty index, traders and investors can assess the individual performance of these banking stocks within the broader banking sector index. This analysis enables them to gauge market sentiments, identify trends, and make well-informed decisions regarding their trading or investment strategies in the banking sector.
Example: NAS100 Index and Its Constituents
Similarly, the NAS100 index, known as the NASDAQ-100, tracks the performance of the largest non-financial companies listed on the NASDAQ stock exchange. Prominent constituents of the NAS100 index include technology and consumer discretionary stocks such as:
Apple Inc. (AAPL)
Microsoft Corporation (MSFT)
Amazon.com Inc. (AMZN)
Alphabet Inc. (GOOGL)
Facebook Inc. (FB)
Tesla Inc. (TSLA)
NVIDIA Corporation (NVDA)
PayPal Holdings Inc. (PYPL)
Netflix Inc. (NFLX)
Adobe Inc. (ADBE)
By inputting these constituent stocks of the NAS100 index into the Index Constituent Analysis setting, traders and investors can analyze the individual performance of these technology and consumer discretionary stocks within the broader NASDAQ-100 index. This analysis facilitates the evaluation of market sentiments, identification of trends, and informed decision-making regarding trading or investment strategies in the technology and consumer sectors.
Example: FTSE 100 Index and Its Constituents
The FTSE 100 index represents the performance of the 100 largest companies listed on the London Stock Exchange (LSE) by market capitalization. Some notable constituents of the FTSE 100 index include:
HSBC Holdings plc
BP plc
GlaxoSmithKline plc
Unilever plc
Royal Dutch Shell plc
AstraZeneca plc
Diageo plc
Rio Tinto plc
British American Tobacco plc
Reckitt Benckiser Group plc
Timeframe Selection:
If a traders wshes to analyze the constituent in a higher timeframe they can simply switch to HTF from the dropdown without changing the chart timeframe.
Weight:
Weight needs to be a positive number when applied on the index future or call option charts.
Weight must be configured to a negative number when this indicator is applied on a put option chart (Put options move in the opposite direction compared to it's stock or index).
Happy Trading,

Affirmify AI — Entry PrecisionAffirmify AI — Entry Precision is a multi-factor directional model with entry-quality filter and ATR-based SL/TP, synced with the Affirmify core engine.
What is Affirmify AI — Entry Precision?
Affirmify AI — Entry Precision is the TradingView front-end of the Affirmify core model.
It combines:
multi-timeframe trend filters
momentum & volatility conditions
an entry-quality check (candle body vs ATR)
ATR-based SL/TP engine
The script is designed to mirror the logic of the Affirmify Python backend used on AffirmifyHub.com.
Core idea
1.Score (core direction):
Built from ADX, EMA trend, RSI zone, MACD histogram, DI+/DI- and ATR volatility penalty.
Score ≥ +2 → BUY bias
Score ≤ −2 → SELL bias
Between −1 and +1 → no clear direction.
2.Higher-timeframe (MTF) confirmation:
Same style of scoring on a higher TF (default 4H).
If MTF direction conflicts with the main timeframe, the script will show “MTF conflict / NO TRADE” and block signals.
3.Entry quality filter:
Checks if the candle body is large enough vs ATR (Min body size (x ATR)).
Output:
CONFIRMED – direction + volatility + body are aligned
WAIT FOR BETTER ENTRY – direction ok, but body is too small
NO QUALITY ENTRY – conditions are not met.
4.ATR-based SL/TP engine:
Internal engine (uses ATR × multiplier or minimal tick distance).
Values are shown on the panel only (no lines drawn on chart), so the chart stays clean.
Panel overview
The panel in the top-right shows:
Action – BUY / SELL / NO TRADE
Status – CONFIRMED / WAIT FOR BETTER ENTRY / NO SIGNAL / MTF conflict
Entry – last confirmed entry price
SL / TP – suggested ATR-based stop-loss and take-profit
Higher TF – higher timeframe filter state (ON/OFF and TF used)
Score – core multi-factor score on the current timeframe
Vol – “Normal volatility” or “Low volatility (ATR penalized)”
Inputs – quick guide
Trend & Filters
EMA Fast / Mid / Slow – EMAs used for trend & bias detection
ADX Length – period for ADX (trend strength)
RSI Length – period for RSI zone filter
ATR Length – ATR used for volatility & body/SL/TP logic
Low ATR threshold (% of price) – defines when the market is considered “low volatility”.
Higher timeframe confirmation
Use higher timeframe filter – enable / disable MTF confirmation
Higher TF – e.g. 240 (4H), 60 (1H), etc.
Entry Precision
Min body size (x ATR) – minimum body vs ATR required for a CONFIRMED entry.
SL / TP
Min SL = ATR x – minimal ATR distance for SL
Min TP = ATR x – minimal ATR distance for TP
Min SL in ticks / Min TP in ticks – hard floor, based on instrument tick size.
Visuals
Show info panel – show / hide the top-right dashboard
Show status badges – textual badges above the last candle
Draw ENTRY/SL/TP (panel only, legacy) – kept for compatibility; does not draw lines in this version.
Alerts
The script provides three alert conditions:
Affirmify: BUY confirmed
Triggered when BUY direction is aligned and entry quality is CONFIRMED (no MTF conflict).
Affirmify: SELL confirmed
Triggered when SELL direction is aligned and entry quality is CONFIRMED (no MTF conflict).
Affirmify: wait for better entry
Direction is valid, but candle body is not yet strong enough – potential setup forming.
You can connect these alerts to your own automation, bots or dashboards.
How to use it (typical workflow)
Select your symbol and timeframe (most users focus on 1H / 4H).
Wait for the panel to show a clear Action (BUY or SELL) with a solid Score (≥ +2 or ≤ −2).
Look for Status = CONFIRMED for actual entries.
Use the panel SL / TP values as a starting point for your own risk management.
Avoid trades when:
Status shows “NO SIGNAL” or “NO CLEAR DIRECTION”
MTF conflict is active
Volatility is extremely low for your style.
Access & subscription
This is an invite-only script connected to the AffirmifyHub ecosystem.
Access is managed via private subscription on AffirmifyHub.com.
After activation you will receive TradingView access to this indicator from the author account.
For questions about access, licensing or private use, please contact the author via TradingView DM or through AffirmifyHub.
Important notice
This tool does not guarantee profits and should never be used as a standalone decision engine.
Always combine it with:
your own price action reading
multi-timeframe context
strict position sizing and risk management.
Markets are risky – never trade money you cannot afford to lose.Multi-factor directional model with entry-quality filter and ATR-based SL/TP levels, synced with the Affirmify core Python engine.

AOT Red Storm V25 Adaptive EditionOverview
AOT Red Storm V25 is an invite-only, institutional-style trend suite designed for intraday and swing traders.
It does not try to predict exact tops or bottoms. Instead, it focuses on:
Multi-timeframe trend alignment
Smart 8-minute internal timeframe for cleaner structure
Adaptive support/resistance zones
Volatility and volume-based risk filtering
A compact HUD to summarize market state in one glance
Core Components
This script is not a simple mashup of public indicators.
It integrates several classic building blocks into a single, coherent decision framework:
Adaptive Supertrend Core:
Supertrend is calculated on an internal 8-minute timeframe (for intraday charts up to 60m), which we found offers a better balance between noise and structure for crypto futures.
WaveTrend Tactical Radar:
WaveTrend is only used for exit timing and risk-off zones (overheat / exhaustion), not as a standalone entry trigger. It works together with the trend core and cooldown logic.
Dual-Layer Support & Resistance:
Local SR zones are drawn on the current chart for execution precision, while 30m-level zones track higher-timeframe liquidity and turning areas.
Trendlines & Structural BOS:
Automatic trendlines and BOS (Break of Structure) are derived from pivot points, to visualize trend continuation vs. potential reversals.
Volatility & Volume Risk Filter:
Abnormal range bars and daily volume completion are monitored to help traders avoid chasing dangerous moves.
AI-style HUD Panel:
The on-chart HUD summarizes trend, momentum, volatility, and volume completion into a compact dashboard so traders don’t need to open multiple indicators.
How it works in practice
The 8-minute engine drives the main trend color and entry markers.
Local & 30m SR zones provide execution context and profit-taking areas.
WaveTrend helps identify when to reduce risk or take partial profits during extended moves.
The HUD acts as a “mission control” view to keep the trader aligned with the dominant state of the market.
Intended Use
For traders who already understand risk management and position sizing.
As a decision support tool, not as an auto-trading holy grail.
Best used on BTC/ETH futures from 1m–30m charts.
What it is NOT
It is not a guaranteed-profit system.
It is not an AI that predicts the future.
It does not replace your own risk control or psychology.
Risk Notice
Trading and investing involve risk. Historical behavior of any logic or visual structure does not guarantee future results. This script is for informational and educational purposes only and does not constitute financial advice.
概览
AOT Red Storm V25 是一套面向实盘交易员的“机构级趋势可视化套件”,采用封闭源码 + 邀请制。
它不是在“预测行情”,而是帮助你:
对齐多周期趋势结构
用 8 分钟内部周期做更干净的趋势骨架
叠加本地 + 30m 双重支撑阻力
利用波动率和成交量过滤危险行情
用一个 HUD 面板把核心信息集中展示
核心模块
8m SuperTrend 趋势骨架:内部固定使用 8 分钟周期来做趋势与结构识别,减少噪音。
WaveTrend 战术雷达:只用于辅助止盈/减仓,而不是单独进场信号。
本地 + 30m 支撑阻力区:当前周期做精确执行,30m 负责定位大级别流动性区域。
自动趋势线 + BOS:用结构高低点标记 HH/LL / BOS,辅助趋势延续与反转识别。
波动 & 量能风控:用异常大K / 当日量能进度,提示极端风险。
AI 风格 HUD 面板:把趋势、动能、波动率、量能等压缩在一个信息面板中。
适用人群
有一定交易经验,重视风控与执行纪律的交易员;
用作决策辅助,而不是“闭眼跟随”的圣杯系统;
建议用于 BTC/ETH 永续 1–30m 等周期。
不是什么
不保证稳定盈利;
不预测未来;
不替代你的仓位管理与心理建设。

Bayesian Order Flow Predictor📌 Bayesian Order Flow Predictor — Advanced Probability Engine for Nasdaq and Futures
This indicator is a next-generation probabilistic forecasting system designed for Nasdaq traders who rely on Order Flow, Auction Market Theory, Value Area dynamics, market structure, DOM imbalance, and Bayesian probability models.
It combines 7 professional-grade factors (DOM, CVD, RSI, EMA trend, ATR volatility, Market Structure, Value Area positioning) into a unified Bayesian probability panel that outputs a clean bullish/bearish probability curve with high-confidence reversal and trend-continuation signals.
Engineered for scalpers, day traders, futures traders, and ICT-style order flow technicians, it delivers real-time directional probability, session-aware signals, and optional news-filter exclusion.
⭐ Features
Bayesian Probability Model (0–100%)
DOM imbalance scoring across dynamic depth levels
Cumulative Volume Delta (CVD) scoring
Market structure detection (HH/LL micro-trend shifts)
RSI momentum and overbought/oversold scoring
EMA directional bias + ATR-normalized deviation
Value Area positioning (VAH / VAL / POC) with optional previous-session mode
Session filtering (only signals during active hours)
Automated news filter (exclude signals around scheduled macro events)
Bull/Bear probability zones with background coloring
Anti-repetition system (no double signals in same direction)
Designed for future scalping, futures order flow, and high-precision timing
🧠 Bayesian Probability Engine — How It Works
The model evaluates 7 independent market factors simultaneously:
DOM imbalance
CVD pressure
Market structure
RSI deviation
EMA trend
Value Area position
ATR volatility shift
Each factor is transformed into a normalized score, multiplied by its weighting parameter, and aggregated into a global score.
This score is then passed through a Bayesian logistic function to convert uncertainty into a smooth probability curve, giving traders a clean, mathematically stable, and noise-resistant forecast.
📈 Buy & Sell Signal Logic
Signals trigger when:
Bullish Probability crosses above the user threshold
Bearish Probability crosses below the opposite threshold
Session is active
No protected news event is occurring
This avoids noise, prevents over-signaling, and focuses only on high-confidence inflection points.
🎯Fully compatible with the indicator: ➡️ AI Probabilistic Orderflow scalper
Both indicators synchronize perfectly when used together:
Bayesian panel → trend probability
Scalper v1 → timing + TP/SL engine
Together they create a complete probability-driven revenue management system for scalping Future.
📘 How to Use
Add the indicator to your chart
Set your trading session (e.g., 09:30–16:00 EST)
Adjust weights depending on your style (Order Flow / Momentum / Value Area)
Watch the probability curve:
Above threshold → bullish bias
Below threshold → bearish bias
Take signals when the curve crosses thresholds, not when flat
Combine with "AI Probabilistic Orderflow scalper" indicator for execution timing
Avoid high-impact news using the News Filter
💎 Advantages
Professional-grade Bayesian model
Works in all volatility regimes
Noise-resistant and smoother than traditional oscillators
Integrates Order Flow + Auction Theory + Momentum + Volatility
Perfect for NQ scalpers seeking an AI-style probability dashboard
Reduces emotional decision-making
Compatible with any execution strategy
Optimized for high winrate scalping and sniper entries

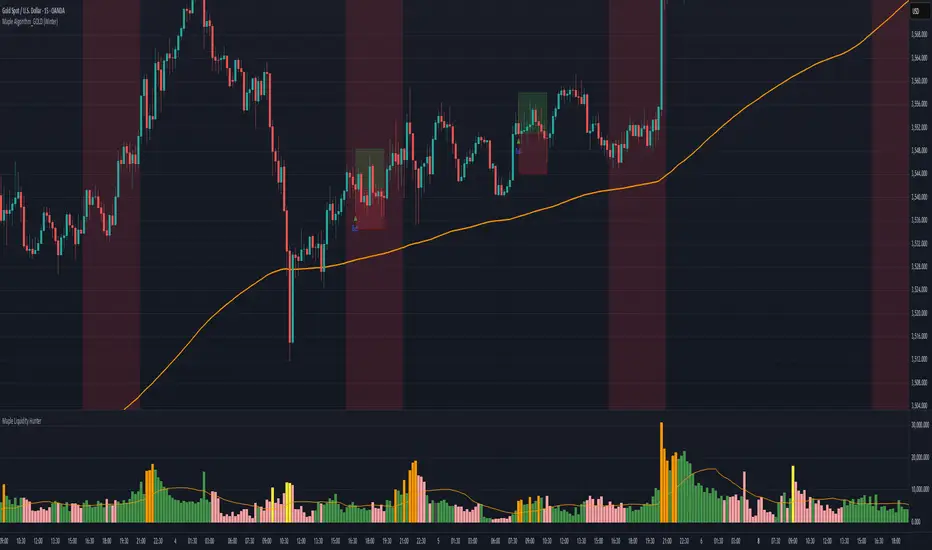
Maple Algorithm_GOLDMaple Algorithm – AI-Powered Gold Indicator
Maple Algorithm is an AI-inspired indicator designed specifically around the price behavior of Gold (XAUUSD).
It automatically calculates and plots take-profit (TP) and stop-loss (SL) levels based on dynamic market conditions, allowing traders to capture precise entries and exits.
✨ Key Features
AI-driven adaptive model trained on Gold’s market structure
Auto-generated TP/SL zones for precision trading
Compatible with your own strategies — scale from 1:2 RRR up to even higher setups
Optimized for scalping and short-term momentum bursts
⚠️ Disclaimer:
This indicator is for educational and research purposes only. It does not guarantee future results. Always test thoroughly before applying to live trading.
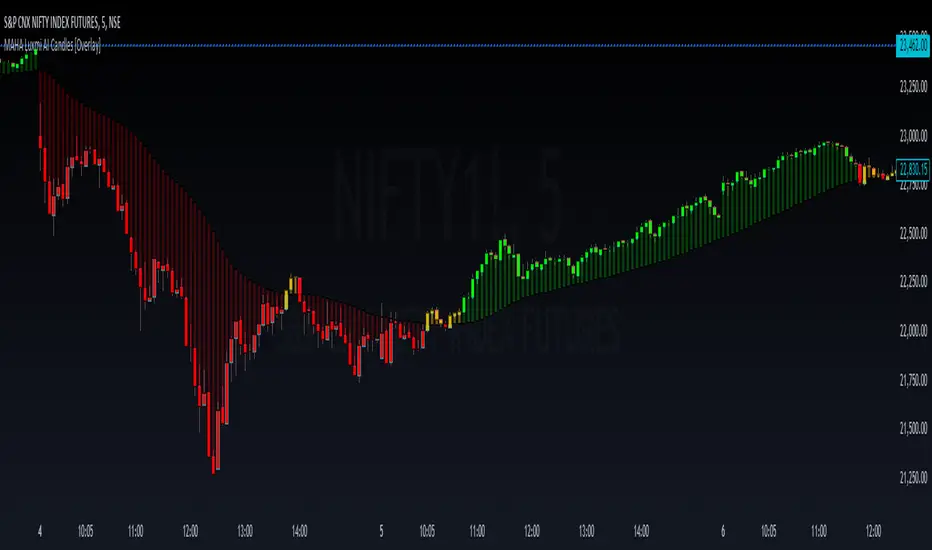
MAHA Luxmi AI Candles [Overlay]The MAHA Luxmi AI Candles trading indicator is a sophisticated tool designed to assist traders in identifying potential trading opportunities by utilizing a combination of Moving Average (MA) and Heikin-Ashi (HA) techniques, further enhanced with a custom formula. Here’s a detailed breakdown of its functionalities:
1. Integration of MA and HA Techniques
MAHA stands for Moving Average and Heikin-Ashi. This indicator modifies these traditional techniques with a unique custom formula, aiming to provide more accurate and reliable signals for traders. The combination enhances the smoothing effect of Moving Averages with the trend indication of Heikin-Ashi candles.
2. Four-Colored Candles for Trend Indication
The indicator uses a color-coded system to denote different market conditions and potential trading opportunities:
- Green Candles: These candles indicate a potential long opportunity. The appearance of a green candle suggests that the market is showing bullish tendencies, prompting traders to consider entering a long position.
- Blue Candles: These candles signify an active pullback within a bullish trend. The blue candle warns traders of a possible temporary reversal within the overall bullish trend, suggesting caution and the need for confirmation before continuing with a long position or preparing for a potential reversal.
- Red Candles: These candles represent a potential short opportunity. A red candle indicates bearish market conditions, signaling traders to consider entering a short position.
- Yellow Candles: These candles denote an active pullback within a bearish trend. The presence of a yellow candle indicates a temporary reversal within the bearish trend, urging traders to be cautious with short positions and look for signs of continuation or reversal.
3. MAHA Bars for Distance and Area of Interest
In addition to the colored candles, the MAHA Luxmi AI Candles indicator also plots MAHA bars. These bars share the same color coding and usage as the candles, providing a consistent visual representation of market conditions:
- Green Bars: Indicate a potential long opportunity, aligning with green candles.
- Blue Bars: Show an active pullback in a bullish trend, aligning with blue candles.
- Red Bars: Represent a potential short opportunity, aligning with red candles.
- Yellow Bars: Indicate an active pullback in a bearish trend, aligning with yellow candles.
The MAHA bars help traders gauge the distance between the current price and the area of interest, enhancing their understanding of how close or far the price is from key levels identified by the MAHA formula. This aids in making better decisions regarding entry and exit points.
4. Trailing Stop Loss Feature
The base of the MAHA Bars can also be used as a trailing stop loss. This feature provides a dynamic stop loss level that adjusts with the market, helping traders lock in profits and limit losses by following the trend. When the price moves favorably, the trailing stop loss adjusts accordingly, ensuring that traders can capitalize on market movements while minimizing risk.
Usage and Benefits
- Trend Identification: The color-coded system simplifies the identification of market trends and potential reversals, making it easier for traders to understand market dynamics at a glance.
- Pullback and Reversal Alerts: The blue and yellow candles/bars alert traders to potential pullbacks and reversals, providing crucial information for managing trades and avoiding false signals.
- Distance Measurement: The MAHA bars help traders measure the distance between the current price and the areas of interest, enhancing their ability to assess the risk and potential reward of trades.
- Trailing Stop Loss: The base of the MAHA Bars can be used as a trailing stop loss, providing a dynamic risk management tool that adapts to market conditions.
Overall, the MAHA Luxmi AI Candles trading indicator is a powerful tool for traders looking to leverage the combined strengths of Moving Averages and Heikin-Ashi techniques. The intuitive color-coded system, additional MAHA bars, and the trailing stop loss feature make it an essential component of a trader’s toolkit for identifying trends, managing risk, and identifying trading opportunities.
Intelligent Exponential Moving Average (AI)Introduction
This indicator uses machine learning (Artificial Intelligence) to solve a real human problem.
The Exponential Moving Average (EMA) is one of the most used indicators on the planet, yet no one really knows what pair of exponential moving average lengths works best in combination with each other.
A reason for this is because no two EMA lengths are always going to be the best on every instrument, time-frame, and at any given point in time.
The "Intelligent Exponential Moving Average" solves the moving average problem by adapting the period length to match the most profitable combination of exponential moving averages in real time.
How does the Intelligent Exponential Moving Average work?
The artificial intelligence that operates these moving average lengths was created by an algorithm that tests every single combination across the entire chart history of an instrument for maximum profitability in real-time.
No matter what happens, the combination of these exponential moving averages will be the most profitable.
Can we learn from the Intelligent Moving Average?
There are many lessons to be learned from the Intelligent EMA. Most will come with time as it is still a new concept. Adopting the usefulness of this AI will change how we perceive moving averages to work.
Limitations
Ultimately, there are no limiting factors within the range of combinations that has been programmed. The exponential moving averages will operate normally, but may change lengths in unexpected ways - maybe it knows something we don't?
Thresholds
The range of exponential moving average lengths is between 5 to 40.
Additional coverage resulted in TradingView server errors.
Future Updates!
Soon, I will be publishing tools to test the AI and visualise what moving average combination the AI is currently using.

Intelligent Moving Average (AI)
Introduction
This indicator uses machine learning (Artificial Intelligence) to solve a real human problem.
The Moving Average is the most used indicator on the planet, yet no one really knows what pair of moving average lengths works best in combination with each other.
A reason for this is because no two moving averages are always going to be the best on every instrument, time-frame, and at any given point in time.
The " Intelligent Moving Average " solves the moving average problem by adapting the period length to match the most profitable combination of moving averages in real time.
How does the Intelligent Moving Average work?
The artificial intelligence that operates these moving average lengths was created by an algorithm that tests every single combination across the entire chart history of an instrument for maximum profitability in real-time.
No matter what happens, the combination of these moving averages will be the most profitable.
Can we learn from the Intelligent Moving Average?
There are many lessons to be learned from the Intelligent Moving Average. Most will come with time as it is still a new concept.
Adopting the usefulness of this AI will change how we perceive moving averages to work.
Limitations
Ultimately, there are no limiting factors within the range of combinations that has been programmed. The moving averages will operate normally, but may change lengths in unexpected ways - maybe it knows something we don't?
Thresholds
The range of moving average lengths is between 5 to 40.
Additional coverage resulted in TradingView server errors.
Future Updates!
Soon, I will be publishing tools to test the AI and visualise what moving average combination the AI is currently using.

ULTIMATE AI SYSTEM [PRO MAX 2025 - NEUTRAL FIXED]🚀 Overview
The ULTIMATE AI SYSTEM is a next-generation trading toolkit designed to identify high-probability reversal setups within established trends. This Parallel Edition introduces a dynamic Linear Regression Channel combined with a powerful Multi-Divergence Engine capable of scanning 14 different oscillators simultaneously.
🔥 Key Features
1. Parallel Linear Regression Channel
This is the core of the trend filtering system. Unlike standard regression channels:
• Parallel Bands: The upper and lower bands are perfectly parallel to the baseline, calculated using Standard Deviation (Deviation 2.0 default).
• Dynamic Trend Coloring: The channel automatically changes color based on the slope:
• 🟢 Green: Uptrend (Bullish Bias)
• 🔴 Red: Downtrend (Bearish Bias)
• Mean Reversion Logic: It helps filter out trades that are over-extended (e.g., buying at the top of the channel).
2. AI Multi-Divergence Engine
The script scans 14 Indicators simultaneously across Fibonacci Lookback Periods (5, 8, 13, 21 candles) to find hidden momentum shifts.
• Indicators Scanned: RSI, CCI, MACD, OBV, MFI, MOM, STOCH, CMF, ADX, ATR, WPR, ROC, TSI.
• Algorithm: A signal is only triggered if a user-defined minimum number of indicators (default: 4) show divergence at the same time.
3. Smart Filtering Layer
To reduce false signals, every trade must pass 5 layers of confirmation:
1. Trend Filter: Price must be above/below the EMA 200 (optional).
2. Regression Filter: Buy signals are validated only if price is within the safe zone of the Linear Regression Channel.
3. RSI Guard: Prevents buying in Overbought or selling in Oversold conditions (optimized 75/25 levels).
4. Candle Validation: Buys require a Green candle; Sells require a Red candle.
5. Lookback Confirmation: Uses Fibonacci sequences to validate divergence strength.
4. Pro Dashboard
A real-time table on the chart displays:
• Current value of all oscillators.
• Live Divergence status (▲ for Bullish, ▼ for Bearish).
• Overall Market Sentiment score.
🛠 How It Works
• LONG (BUY) Signal:
1. Market Sentiment is Bullish (Minimum 4 indicators showing bullish divergence).
2. Price is above EMA 200 (Trend Confirmation).
3. Linear Regression Slope is Positive (or price is at the channel bottom).
4. RSI is below 75 (Not Overbought).
5. Candle closes Green.
• SHORT (SELL) Signal:
1. Market Sentiment is Bearish (Minimum 4 indicators showing bearish divergence).
2. Price is below EMA 200 (Trend Confirmation).
3. Linear Regression Slope is Negative (or price is at the channel top).
4. RSI is above 25 (Not Oversold).
5. Candle closes Red.
⚙️ Settings
• Min Confirmations: Number of indicators required to trigger a signal (Default: 4).
• Regression Length: Length for the Linear Regression Channel (Default: 100).
• Channel Deviation: Width of the parallel channel (Default: 2.0).
• EMA Filter: Toggle EMA 200 filtering On/Off.
• Lookback Periods: Customizable Fibonacci sequence for divergence detection.
⚠️ Disclaimer
This script is for educational and analytical purposes only. No indicator guarantees 100% accuracy. Always use proper risk management and combine signals with your own price action analysis.
Code Author:
Version: PRO MAX 2025 - PARALLEL EDITION
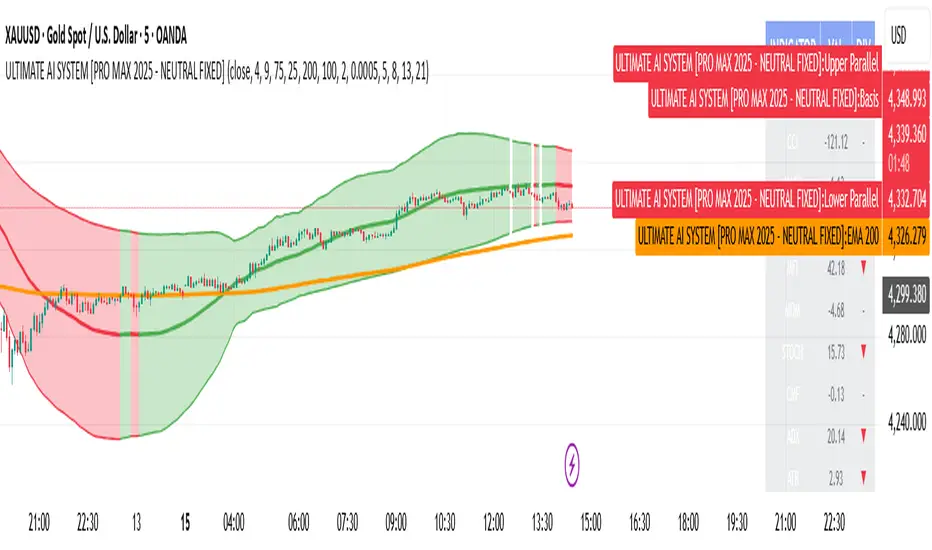
Eagle V 2.0 - AIEagle V 2.0 – AI Edition is a next-generation signal engine designed for traders who want clean entries, consistent performance, and reduced stop-loss hits.
The indicator analyzes trend strength, liquidity behavior, volatility conditions, market structure, and price momentum to generate high-quality buy and sell signals only when the market is aligned.
Instead of flooding the chart with noise, Eagle V 2.0 focuses on precision.
Every signal comes with a calculated stop-loss, three Fibonacci-based take-profit levels, and a confidence score that helps you quickly judge the strength of the setup.
What the Indicator Delivers
Clear Long/Short signals filtered to avoid weak setups
Smart Stop-Loss placement to reduce fake-outs
TP1 / TP2 / TP3 levels automatically calculated based on market movement
AI Confidence Score (0–100) to measure the quality of each opportunity
Real-time Support & Resistance zones that update with market structure
Trend direction and momentum bias across multiple timeframes
Trade history panel showing win rate, total P&L, biggest wins/losses, and your last trades
Dashboard with market conditions, liquidity state, and timeframe bias
Who This Indicator Is For
Scalpers, day traders, and swing traders who want fewer but higher-quality signals, strong risk management, and a tool that adapts to any market—Forex, Crypto, Indices, or Stocks.
Summary
Eagle V 2.0 focuses on the only thing that matters:
Cleaner signals, controlled risk, and stronger results.

One Minute AI scalper keep extended trading hours on# One Minute AI Scalper - Trading Indicator
## Overview
The One Minute AI Scalper is a precision-engineered trading indicator designed specifically for short-term scalping strategies on 1-minute timeframes. This indicator combines multiple technical analysis methods to identify high-probability entry points for both long and short positions, making it ideal for active traders seeking quick, momentum-based opportunities.
## Key Features
### Visual Signals
- **Long Entry Arrows**: Clear green triangle markers appear below price bars when bullish conditions align
- **Short Entry Arrows**: Clear red triangle markers appear above price bars when bearish conditions align
- Clean, uncluttered chart interface focusing on actionable signals
### Advanced Signal Generation
The indicator utilizes a sophisticated multi-factor approach to generate trading signals:
1. **Trend Analysis**: Employs moving average crossover methodology to identify the prevailing market direction
2. **Momentum Confirmation**: Analyzes candlestick patterns and price behavior to confirm momentum strength
3. **Volume Validation**: Incorporates volume analysis to distinguish between high-conviction and standard signals
4. **Reversal Detection**: Identifies potential trend reversals by examining recent price action patterns
5. **Precision Entry Filtering**: Uses specific candlestick characteristics to minimize false signals
### Alert System
Comprehensive alert functionality for all signal types:
- Long Entry alerts
- Short Entry alerts
## How It Works
### Long Position Signals
The indicator generates long entry signals when multiple bullish conditions simultaneously align, including:
- Confirmation of upward momentum through price action
- Specific candlestick structure indicating strong buying pressure
- Price position relative to key moving averages
- Recent price behavior suggesting reversal potential
- Volume characteristics supporting the move
### Short Position Signals
Short entry signals are generated when multiple bearish conditions converge, including:
- Confirmation of downward momentum through price action
- Specific candlestick structure indicating strong selling pressure
- Price position relative to key moving averages
- Recent price behavior suggesting reversal potential
- Volume characteristics supporting the move
### Position Management
The indicator includes intelligent position state tracking to:
- Prevent duplicate signals while in an active position
- Generate exit signals based on opposing price action
- Maintain clear status of whether you're in a long or short position
## Best Practices
### Recommended Usage
- **Timeframe**: Optimized for 1-minute charts
- **Extended Hours**: Keep extended trading hours enabled for full market coverage
- **Markets**: Works on stocks, forex, crypto, and futures
- **Strategy**: Best suited for scalping and day trading strategies
### Risk Management
- Always use proper stop-loss orders
- Consider position sizing based on account risk tolerance
- Pay attention to volume-indicated signals for higher conviction trades
- Avoid trading during low-liquidity periods
- Combine with your own risk management rules
### Trading Tips
- Higher volume signals generally indicate stronger conviction
- Wait for clear arrow signals rather than trying to anticipate them
- Monitor overall market conditions and major support/resistance levels
- Be aware of news events that may cause unusual volatility
- Practice in a paper trading account before using real capital
## Important Notes
### What This Indicator Does
✅ Provides clear visual entry signals for long and short positions
✅ Incorporates multiple technical factors for signal generation
✅ Includes volume analysis for conviction assessment
✅ Offers comprehensive alert options for all signal types
✅ Maintains position state awareness
### What This Indicator Doesn't Do
❌ Does not guarantee profitable trades
❌ Does not provide specific price targets or stop-loss levels
❌ Does not replace the need for proper risk management
❌ Does not account for fundamental analysis or news events
❌ Does not adapt settings automatically to market conditions
## Disclaimer
This indicator is provided for educational and informational purposes only. It is not financial advice, and past performance does not guarantee future results. Trading involves substantial risk of loss, and you should only trade with capital you can afford to lose. Always conduct your own research and consider consulting with a qualified financial advisor before making trading decisions.
## Configuration
This indicator uses fixed, optimized parameters that have been carefully calibrated for 1-minute scalping. No user configuration is required - simply add it to your chart and monitor for signals.
## Support
For questions, suggestions, or feedback about this indicator, please use the comments section or contact the author directly through TradingView.
---
**Version**: 6.0
**Category**: Momentum/Scalping
**Overlay**: Yes
**Timeframe**: 1 minute (optimized)

🎓 Smart Beginner Pro - AI Trading Assistant🎓 Smart Beginner Pro - AI Trading Assistant
Short Description:
Your perfect FIRST trading indicator! Clear BUY/SELL signals with automatic risk management. Learn professional trading while getting 5-star rated entries. Built-in education + Stop Loss/Take Profit included. No experience needed!
🎯 FULL DESCRIPTION
Smart Beginner Pro is the ONLY indicator designed specifically to help complete beginners start trading professionally from day one!
Unlike complicated indicators that overwhelm you with information, Smart Beginner Pro makes trading simple while teaching you professional techniques.
🌟 What Makes This Special?
⭐ 5-Star Quality Rating System
Every signal is rated 1-5 stars based on:
✅ Trend alignment
✅ Major trend confirmation
✅ Volume analysis
✅ RSI health check
✅ Trend strength
You always know EXACTLY how good a setup is before entering!
Example:
⭐⭐⭐⭐⭐ = Perfect setup (all factors aligned)
⭐⭐⭐⭐ = Excellent setup (4/5 factors)
⭐⭐⭐ = Good setup (3/5 factors)
Choose your preferred quality level - Conservative traders only take 5-star signals!
🎓 Built-in Education
Learn WHILE You Trade!
This isn't just an indicator - it's your AI trading teacher!
Beginner Mode Features:
✅ Educational tooltips on every signal
✅ Explains WHY each signal appears
✅ Shows what each factor means
✅ Teaches you professional analysis
✅ Risk management guidance included
After a few weeks, you'll understand:
How trends work
Why volume matters
When to enter trades
How to manage risk
Professional trading concepts
Turn OFF Beginner Mode when ready for cleaner charts!
🛡️ Automatic Risk Management
Never Wonder Where to Place Stops Again!
Every signal comes with:
Entry Zone (Green box)
Exact entry price shown
Small buffer zone for entry
Stop Loss (Red box)
Calculated using ATR (volatility)
Placed at safe distance
Protects your capital
Take Profit 1 (Yellow box)
First profit target (50% of full target)
Partial profit recommended
Take Profit 2 (Green box)
Full profit target (1:3 risk/reward default)
Let winners run!
Risk/Reward Ratio: Always displayed!
Default: 1:3 (Risk $10 to make $30)
Customizable: 1.5 to 5.0
Professional money management built-in
🎯 Crystal Clear Signals
No Confusion. No Guessing.
BUY Signals:
🟢 HUGE green arrow below bar
Text says "BUY"
Star rating above
Can't miss it!
SELL Signals:
🔴 HUGE red arrow above bar
Text says "SELL"
Star rating below
Impossible to miss!
WAIT (No Signal):
⚪ Dashboard shows "WAIT"
Don't trade when no signal
Patience is key!
📊 Live Dashboard
All Information at a Glance:
Everything you need to make a decision - RIGHT THERE!
⚙️ Three Sensitivity Modes
Choose your trading style:
🎯 Conservative (Recommended for Beginners)
✅ Only 5-star signals
✅ 2-3 signals per day
✅ Highest win rate
✅ Best for learning
✅ Perfect for part-time traders
⚖️ Balanced (Default)
✅ 4-5 star signals
✅ 5-8 signals per day
✅ Good win rate
✅ More opportunities
✅ Best for most traders
⚡ Aggressive (For Active Traders)
✅ 3-5 star signals
✅ 10-15 signals per day
✅ More trades
✅ Requires experience
✅ For full-time traders
Start Conservative → Move to Balanced → Then Aggressive as you improve!
🌍 Works on EVERYTHING
✅ All Markets:
Forex (EUR/USD, GBP/USD, etc.)
Crypto (Bitcoin, Ethereum, etc.)
Stocks (Apple, Tesla, etc.)
Indices (S&P 500, NASDAQ, etc.)
Commodities (Gold, Silver, Oil, etc.)
✅ All Timeframes:
M5-M15: Scalping (quick trades)
M15-H1: Day trading (same day)
H4-D1: Swing trading (multi-day)
One indicator for your entire trading career!
🕐 Session Highlighting
Trade at the Right Time!
Background colors show best trading sessions:
🟢 Green = London Session (8 AM - 4 PM GMT)
High liquidity
Best for EUR/GBP pairs
🔵 Blue = New York Session (1 PM - 9 PM GMT)
Maximum liquidity
Best for all USD pairs
No color = Asian Session
Lower liquidity
Beginners: Avoid or trade carefully
Toggle ON/OFF in settings if you don't need it.
📚 How to Use (Step by Step)
For Complete Beginners:
Step 1: Add to Chart
1. Open your favorite pair (Start with EUR/USD)
2. Set timeframe to M15
3. Add "Smart Beginner Pro" indicator
4. Done! Default settings work great!
Step 2: Wait for Signal
1. Watch the dashboard
2. When it says "BUY" or "SELL" → A signal appeared!
3. Check the star rating (aim for 4-5 stars)
4. Look at "Safe to Trade" (should be ✅ YES)
Step 3: Enter Trade
1. Enter at current market price
2. Set Stop Loss at RED box level
3. Set Take Profit at GREEN box level (TP2)
4. Optional: Take partial profit at YELLOW box (TP1)
Step 4: Manage Trade
1. Let the trade run to TP or SL
2. Don't move stops (trust the system)
3. When TP1 hit: Close 50%, let rest run
4. When TP2 hit or SL hit: Close completely
Step 5: Learn & Improve
1. Review what happened
2. Was it a 5-star? How did it perform?
3. Read the tooltips (Beginner Mode)
4. Understand WHY signals work
5. Get better with each trade!
💡 Trading Rules for Success
🟢 DO:
✅ Only trade 4-5 star signals at first
✅ Use proper position sizing (1-2% risk)
✅ Always set Stop Loss (use indicator levels)
✅ Be patient (wait for quality setups)
✅ Trade during good sessions (London/NY)
✅ Learn from each trade
✅ Keep a trading journal
🔴 DON'T:
❌ Trade 1-2 star signals (not shown anyway)
❌ Risk more than 2% per trade
❌ Move stop losses (honor them!)
❌ Trade without a signal
❌ Overtrade (quality > quantity)
❌ Trade when "Safe to Trade" says NO
❌ Trade on emotion
⚙️ Settings Explained
📊 Mode Settings
Beginner Mode (Default: ON)
What it does:
- Shows educational tooltips
- Displays "Why?" explanations
- Extra help text
- Star ratings always visible
Turn OFF when:
- You understand the signals
- Want cleaner charts
- Prefer minimal interface
Signal Sensitivity
Conservative: Only perfect setups (5 stars)
Balanced: Good setups (4-5 stars)
Aggressive: Okay setups (3-5 stars)
Tip: Start Conservative, upgrade as you improve!
📈 Trend Settings
Fast EMA (Default: 9)
Shorter period = More responsive
Longer period = Smoother trend
Recommended: Keep at 9
Slow EMA (Default: 21)
Used with Fast EMA for crossovers
Recommended: Keep at 21
Standard setting works best
Major Trend EMA (Default: 200)
The "big picture" trend
Above = Uptrend | Below = Downtrend
Never trade against this!
Recommended: Keep at 200
Show EMAs (Default: ON)
Toggle if you want cleaner chart
EMAs still calculated even if hidden
Dashboard still shows trend direction
🛡️ Risk Management
Risk/Reward Ratio (Default: 3.0)
How much profit vs risk
3.0 = Risk $10 to make $30
Conservative: 2.0
Balanced: 3.0
Aggressive: 4.0-5.0
Higher = Bigger targets (but fewer hits)
Stop Loss ATR Multiplier (Default: 1.5)
How far stop loss is placed
Based on volatility (ATR)
Tight: 1.0 (more stops hit)
Balanced: 1.5
Loose: 2.0-3.0 (fewer stops, bigger risk)
Show Entry/SL/TP Boxes (Default: ON)
Toggle the colored risk boxes
Keep ON for visual guidance
Turn OFF for minimal charts
🎨 Visual Settings
Highlight Trading Sessions (Default: ON)
Shows London/NY sessions with color
Helps you trade at best times
Turn OFF if you trade 24/7
Show Trend Strength Bar (Default: ON)
Shows trend strength percentage
Useful for filtering weak trends
Turn OFF if not needed
🎓 Educational Value
What You'll Learn:
Week 1-2: Basics
✅ How to read trend direction
✅ When to enter trades
✅ Where to place stop losses
✅ What risk/reward means
✅ Why some signals are better than others
Week 3-4: Intermediate
✅ How EMA crossovers work
✅ Why volume matters
✅ What RSI tells you
✅ Session timing importance
✅ Risk management principles
Month 2-3: Advanced
✅ Market structure understanding
✅ Trend vs range recognition
✅ Quality signal identification
✅ Position sizing strategies
✅ Trading psychology basics
After 3 Months:
🎯 You're no longer a beginner!
🎯 You understand price action
🎯 You can analyze markets yourself
🎯 You make informed decisions
🎯 Ready for advanced indicators
💎 Why Choose Smart Beginner Pro?
vs. Other Beginner Indicators:
Most Beginner Indicators:
❌ Just show arrows (no explanation)
❌ No quality rating
❌ No stop loss help
❌ No education
❌ Too many bad signals
❌ Confusing settings
Smart Beginner Pro:
✅ Explains WHY each signal
✅ 5-star quality system
✅ Automatic SL/TP levels
✅ Built-in education
✅ Quality over quantity
✅ Simple, clear settings
✅ Professional results from day 1
vs. Advanced Indicators:
Advanced Indicators:
❌ Too complicated for beginners
❌ Require trading knowledge
❌ No educational features
❌ Overwhelming settings
❌ Steep learning curve
Smart Beginner Pro:
✅ Simple but powerful
✅ No prior knowledge needed
✅ Teaches while you trade
✅ Easy to understand
✅ Grows with you
🚀 Quick Start Guide
First 24 Hours:
Hour 1: Setup
1. Add indicator to EUR/USD M15
2. Enable all alerts (BUY + SELL)
3. Read dashboard labels
4. Wait for first signal
Hour 2-24: Learn
1. Watch how signals appear
2. Check star ratings
3. Observe trend direction
4. Notice session highlights
5. Don't trade yet - just observe!
Day 2-7: Demo Trading
1. Open demo account
2. Trade ONLY 5-star signals
3. Use exact SL/TP from indicator
4. Risk $100 per trade (demo)
5. Keep journal of results
6. Review each trade (win or loss)
Week 2+: Real Trading
1. Start with SMALL real account ($100-500)
2. Risk only 1% per trade ($1-5)
3. Trade Conservative mode only
4. Build confidence slowly
5. Increase size as you improve
🔔 Alert System
Available Alerts:
1. BUY Signal
Triggers: When 4-5 star BUY appears
Message: "SMART BEGINNER PRO - BUY SIGNAL!"
Action: Check chart, enter if conditions met
2. SELL Signal
Triggers: When 4-5 star SELL appears
Message: "SMART BEGINNER PRO - SELL SIGNAL!"
Action: Check chart, enter if conditions met
3. 5-STAR BUY (Premium Quality)
Triggers: Only perfect 5-star BUY setups
Message: "PERFECT 5-STAR BUY SIGNAL!"
Action: Highest probability - don't miss!
4. 5-STAR SELL (Premium Quality)
Triggers: Only perfect 5-star SELL setups
Message: "PERFECT 5-STAR SELL SIGNAL!"
Action: Highest probability - don't miss!
Alert Setup:
1. Click "Create Alert" on indicator
2. Choose "BUY Signal" and "SELL Signal"
3. Set "Once Per Bar Close"
4. Enable notifications to phone/email
5. Never miss a quality setup!
📊 Best Practices
Daily Routine:
Before Market Open:
1. Check economic calendar
2. Identify trending pairs
3. Set up charts with indicator
4. Enable alerts
During Trading:
1. Wait for signal
2. Check star rating (4-5 only)
3. Verify "Safe to Trade" = YES
4. Enter with proper position size
5. Set SL/TP from boxes
6. Walk away (don't watch tick-by-tick)
After Trading:
1. Review trades in journal
2. What worked? What didn't?
3. Were they 4-5 star signals?
4. Did you follow rules?
5. Plan improvements
Position Sizing:
The 1% Rule:
Account: $1000
Risk per trade: 1% = $10
If SL is 20 pips away:
Position size = $10 / 20 pips = $0.50/pip
Simple! Never risk more than you can afford to lose.
🎯 Success Tips
From Professional Traders:
Tip #1: Quality Over Quantity
"Better to take 3 excellent trades per week
than 20 mediocre trades per day."
→ Focus on 5-star signals at first
Tip #2: Respect the Stop Loss
"The indicator calculated it for a reason.
Moving stops = breaking risk management."
→ Set it and honor it, always
Tip #3: Take Partial Profits
"Bank some profit at TP1, let the rest run to TP2.
This keeps you profitable even if TP2 doesn't hit."
→ Close 50% at TP1 (yellow box)
Tip #4: Trade Best Sessions
"London and New York overlap (1-4 PM GMT)
is the most liquid time of day."
→ Watch for green+blue background
Tip #5: Keep Learning
"Every trade is a lesson.
Winners teach confidence, losers teach discipline."
→ Journal everything, review weekly
⚠️ Important Disclaimers
Realistic Expectations:
This is NOT:
❌ A get-rich-quick scheme
❌ A 100% win rate system
❌ A replacement for education
❌ A guarantee of profits
❌ Financial advice
This IS:
✅ A learning tool
✅ A signal system with good probability
✅ A risk management helper
✅ A starting point for beginners
✅ An educational indicator
Trading Risks:
⚠️ All trading involves risk
⚠️ You can lose money
⚠️ Never trade with money you can't afford to lose
⚠️ Start small, grow slowly
⚠️ Past performance ≠ future results
⚠️ Demo trade first!
🎁 Bonus: Beginner's Checklist
Before Every Trade:
□ Signal appeared (BUY or SELL arrow)
□ Star rating is 4 or 5 stars
□ Dashboard shows "Safe to Trade: ✅ YES"
□ Trend and signal agree (both bullish or bearish)
□ Trading during London/NY session
□ Stop Loss level identified (red box)
□ Take Profit level identified (green box)
□ Position size calculated (1% risk max)
□ Emotionally ready (not revenge trading)
□ Have clear mind (not tired/stressed)
If ALL checked → TRADE
If ANY missing → SKIP
🎯 Final Words
Trading doesn't have to be complicated.
Smart Beginner Pro proves that you can:
Get professional results as a beginner
Learn proper trading techniques
Manage risk automatically
Understand WHY trades work
Build confidence step by step
This is your starting point.
Add it to your chart. Watch it work. Learn from it. Grow with it.
Welcome to professional trading! 🚀
📈 Ready to Start?
1. Click "Add to favorites"
2. Apply to your chart
3. Enable alerts
4. Wait for your first 5-star signal
5. Start your trading journey TODAY!
Questions? Comments? Success stories?
Share below! 👇
Happy Trading! 🎓📊✨
Disclaimer: This indicator is for educational purposes. Trading involves risk. Always use proper risk management and never trade with money you cannot afford to lose. Past performance does not guarantee future results.

MMT AI IndicatorOverview
The MMT AI INDICATOR is an advanced technical indicator used to predict trends in price movements by utilizing a combination of traditional AI techniques, and the Momentum Model.
