Movement Efficiency - [Rider Algo]Movement Efficiency v2 — Rider Algo
Developed by Rider Algo
🔬 WHAT IS THIS INDICATOR?
Movement Efficiency measures how much of the market’s total movement actually translates into net directional progress .
In simple terms:
Is price advancing cleanly toward a destination, or thrashing around going nowhere?
Most oscillators tell you how far or how fast price moved.
This one asks a different question: how efficiently did it move?
A market that travels 1,000 points to advance 800 points net = clean trend .
A market that travels 1,000 points but only advances 100 points net = chop (even if candles look “exciting”).
This distinction is critical for choosing the right strategy at the right time.
---
📐 HOW IT WORKS
The indicator combines two layers of analysis:
Layer 1 — Efficiency Ratio (Kaufman’s ER)
The foundation is a well-known formula from quantitative finance:
ER = |Close − Close | / Σ|Close − Close | over n bars
This produces a value between 0 and 1 :
≈ 1.0 → price moved in a straight line (maximum efficiency).
≈ 0.0 → price moved a lot but ended near where it started (pure noise).
Layer 2 — Wick Absorption Penalty (Microstructure Enhancement)
Classic ER has a blind spot: it only uses closing prices .
Two candles can have identical closes but tell totally different stories:
Strong body + tiny wicks = clean push
Tiny body + massive wicks = absorption / rejection
This indicator:
Computes a wick-to-body ratio per bar
Averages it over the lookback
Applies a soft penalty (square root to avoid over-punishment)
Outputs an adjusted efficiency score that detects “dirty” advances classic ER misses
---
🎯 THREE MARKET REGIMES
The indicator classifies the market into three zones :
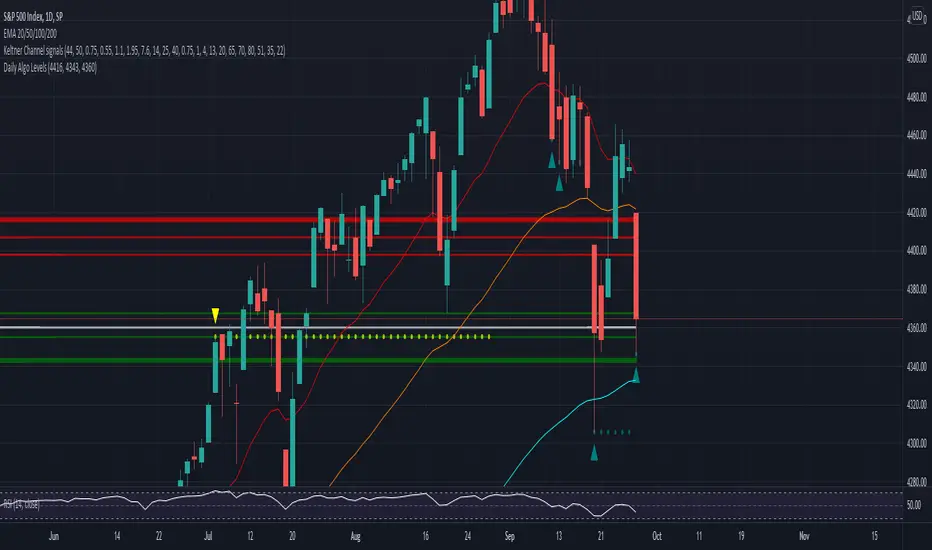
🟢 TREND ZONE (green background)
Efficiency is above the trend threshold → price is advancing cleanly with minimal noise.
Best environment for trend-following (breakouts, MA crosses, momentum).
Directional triangle signals:
▲ Green triangle = Bullish trend detected (upward efficient advance)
▼ Red triangle = Bearish trend detected (downward efficient decline)
🔴 CHOP ZONE (red background)
Efficiency is below the chop threshold → lots of movement, no progress.
Danger zone for trend-followers (whipsaws, failed breakouts, stop hunts).
▼ Orange triangle = Market entering chop regime
🟡 TRANSITION ZONE (no background)
Efficiency is between thresholds → market is shifting.
Watch for the next triangle to confirm direction.
---
⚙️ ASSET PROFILES (Pre-Tuned Thresholds)
Different assets have different “normal” efficiency. The indicator includes four profiles:
Crypto / High Volatility — relaxed thresholds
Trend: 0.40 | Chop: 0.18
Designed for assets where large wicks and volatility are normal.
Stocks / Medium Volatility — balanced thresholds
Trend: 0.48 | Chop: 0.22
Forex / Low Volatility — stricter thresholds
Trend: 0.55 | Chop: 0.28
Forex tends to print cleaner candles → higher bar for “trend”.
Custom — set your own thresholds for any instrument/timeframe.
---
📊 INFORMATION PANEL
The top-right dashboard shows:
Efficiency — current adjusted efficiency score (0 to 1)
Regime — TREND ▲ (bull), TREND ▼ (bear), CHOP ✗ , or TRANSITION ~
Percentile — where current reading sits vs last 200 bars
Example: 85% = higher efficiency than 85% of recent history
Wick Noise — average wick-to-body ratio (higher = more absorption/rejection)
Profile — active asset profile
---
🔧 KEY SETTINGS
Efficiency Period (default: 10 ) — lookback window
Lower = more reactive | Higher = smoother
10 works well for weekly charts, 14 for daily.
Smoothing Length (default: 3 ) — EMA applied to final output
Reduces noise without significant lag.
Wick Penalty Weight (default: 0.25 ) — how aggressively wicks reduce efficiency
0 = classic ER only | toward 1.0 = stricter microstructure filtering
Color Mode — Gradient (continuous red→green) or Zones (discrete + directional bias)
Show Raw ER — overlay classic ER (no wick penalty) for comparison
---
💡 PRACTICAL APPLICATIONS
1) Strategy Selection Filter
Use as a meta-filter above your main strategy:
Only take trend-following setups in TREND (green)
Only take mean-reversion setups in CHOP (red)
This can dramatically reduce false signals.
2) Regime Change Early Warning
Watch for transitions:
CHOP entry (orange triangle)
Then a trend triangle (green/red)
These often precede strong moves (consolidation → expansion).
3) Trend Quality Assessment
Not all trends are equal:
0.65 + low wick noise = higher reliability
0.42 + high wick noise = “dirty” trend / less trustworthy
Use Percentile to contextualize.
4) Risk Management
If efficiency drops from TREND into TRANSITION , consider:
Reducing position size
Tightening stops
Avoiding aggressive breakout chasing
---
⚠️ IMPORTANT NOTES
This indicator does NOT repaint. Uses confirmed bar data + current bar → safe for backtesting and live trading.
Not a buy/sell signal generator. It identifies the market regime so you can choose the right approach.
Defaults are calibrated for crypto on weekly timeframes. For other assets/timeframes, start with the correct Asset Profile .
No single indicator is a complete trading system. Always use risk management + confirmation.
Pine Script® indicator