ICT Macro Tracker - Study Version (Original by toodegrees)This indicator is a modified study version of the ICT Algorithmic Macro Tracker by toodegrees, based on the original open-source script available at The original indicator plots ICT Macro windows on the chart, corresponding to specific time [ periods when the Interbank Price Delivery Algorithm undergoes checks/instructions (aka "macros") for the price engine to reprice to an area of liquidity or inefficiency.
This study version adds functionality to hide bars outside macro periods. When enabled, the indicator draws boxes that cover the full chart height during non-macro periods, obscuring those bars so only macro periods are visible. This helps focus on macro-only price action. The feature is configurable, allowing users to enable or disable it and customize the box color. All original functionality remains intact.
Search in scripts for "algo"

RiskyInvesting Algo v1.0.0 FREEA multi‑layer trend‑following and momentum‑confirmation system designed around dual adaptive baselines, Heikin‑Ashi structure, and smart candle‑strength filtering. This strategy blends volatility‑based trailing logic with macro trend bias tools (EMA + SMMA) to identify clean directional flips and filter out weak signals.
This model uses 5 parameters, while the Pro uses 9 parameters. For more info, follow me on Twitter/X
Disclaimer:
- You must use the Heikin-Ashi candle type for this indicator.
- Please use this in conjunction with your trading system. Labels are not meant to be used as financial advice.
Core features include:
- Heikin‑Ashi Transformation: Smooths price action for more reliable trend identification.
- Two Adaptive Trailing Baselines: ATR‑adjusted equations (Parameter 1 & 2) that flip direction based on baseline breaks.
- Directional Shift Detection: Buy signals on bullish dual‑baseline flip; sell signals on bearish dual‑baseline flip.
- Trend Bias Filtering: Uses EMA vs SMMA relationship to color signals and provide market bias context.
- Candle Strength Filter: Ensures signals only trigger on meaningful momentum candles relative to ATR.
- Clean Visual Display: Auto‑coloring buy/sell labels, baseline plots, and signal triangles.
🟩 = Full Position
🟦 = Half Position
🟥 = Full Position
🟧 = Half Position
Built for traders who want a structured trend‑flip system that avoids noise, highlights strong directional moments, and maintains visual clarity even on volatile intraday charts.

Sigma-X Algo [Main] - SMC & Volume Heatmap
**简介 / Short Description:**
A professional institutional trading system combining Statistical Mean Reversion (Sigma), Smart Money Concepts (SMC), and Volume Analysis. Designed for XAUUSD and BTC M5 scalping.
一套结合了统计学均值回归、SMC机构订单流以及量能热力图的专业交易系统。专为黄金(XAUUSD)和比特币(BTC)的M5短线交易设计。
**详细描述 / Description:**
---
### ** 中文说明**
**Sigma-X Algo** 是一套为高波动市场(如黄金、比特币)量身定制的狙击型交易系统。它不预测行情,而是通过捕捉价格的**“统计学极值”**与**“机构订单痕迹”**,寻找高胜率的反转机会。
#### **核心功能 (Core Features)**
1. **📊 统计学均值回归 (Sigma Extremes):**
* 基于 **TRIMA** 算法计算价格偏离度。
* 当价格触及 **3.0σ** 极值时,图表会出现 **钻石信号**。
* **S+ (彩色钻石):** 顺势极值,胜率加成。
* **Risk (灰色钻石):** 逆势极值,提示风险。
2. **🏛️ 多周期 SMC 订单块 (MTF Order Blocks):**
* **4H OB (绿色/橙色):** 大级别“城墙”,也是核心反转区。
* **1H OB (蓝色/红色):** 短线“战术掩体”,用于日内观察。
* **逻辑:** 采用“穿透即删除”逻辑,只保留未被截取 (Unmitigated) 的有效结构。
3. **🔥 量能热力图 (Volume Heatmap):**
* 通过 K 线染色识别主力行为。
* **亮紫色/亮黄色 K 线:** 代表成交量超过平均值的 **2.0倍**。这是机构入场护盘或出货的关键信号。
4. **🌊 趋势过滤器 (Trend Filter):**
* 内置 **EMA 50/144** 斐波那契均线组,自动判定当前是顺势还是逆势。
#### **实战策略 (How to Trade)**
* **做多狙击 (Long Setup):**
1. 价格回踩 **4H 看涨 OB (绿色框)**。
2. 主图出现 **绿色 S+ 钻石** 信号。
3. **K 线变色 (亮紫)**,确认主力爆量承接。
* **做空狙击 (Short Setup):**
1. 价格反抽 **4H 看跌 OB (橙色框)**。
2. 主图出现 **红色 S+ 钻石** 信号。
3. **K 线变色 (亮黄)**,确认主力出货。
---
### ** English Description**
**Sigma-X Algo** is a sniper-style trading system tailored for high-volatility assets like Gold (XAUUSD) and Bitcoin (BTC). Instead of predicting, it identifies high-probability reversals by combining **Statistical Extremes** with **Institutional Footprints**.
#### **Key Features**
1. **📊 Statistical Mean Reversion (Sigma Extremes):**
* Calculates price deviation based on the **TRIMA** algorithm.
* **Diamond Signals** appear when price hits the **3.0σ** extreme.
* **S+ (Colored Diamond):** Trend-following signals (High Probability).
* **Risk (Gray Diamond):** Counter-trend signals (Caution required).
2. **🏛️ MTF Smart Money Concepts (SMC):**
* **4H Order Blocks (Green/Orange):** The "HTF Wall". Primary reversal zones.
* **1H Order Blocks (Blue/Red):** Intraday tactical zones.
* **Logic:** Uses "Delete on Break" logic to keep the chart clean, showing only unmitigated zones.
3. **🔥 Volume Heatmap:**
* Highlights institutional activity by coloring candles.
* **Bright Purple/Yellow Candles:** Indicate volume is **2.0x** greater than average. This confirms "Stopping Volume" or "Climax" behavior.
4. **🌊 Trend Filter:**
* Built-in **EMA 50/144** Fibonacci ribbon to filter noise and identify the dominant trend.
#### **Trading Strategy**
* **Long Setup:**
1. Price dips into a **4H Bullish OB (Green Box)**.
2. A **Green S+ Diamond** appears.
3. **Highlighter Candle (Purple)** appears, confirming institutional absorption.
* **Short Setup:**
1. Price rallies into a **4H Bearish OB (Orange Box)**.
2. A **Red S+ Diamond** appears.
3. **Highlighter Candle (Yellow)** appears, confirming institutional distribution.
---
**Disclaimer:**
Trading involves high risk. This indicator is a tool for analysis, not financial advice. Always use stop losses.
---
# 2. 副图指标说明书 (Sub Indicator)
**标题 / Title:**
**Sigma-X Algo - Divergence & Momentum**
**简介 / Short Description:**
The companion oscillator for the Sigma-X system. Features absolute momentum (TRIMA), structural trend filtering, and automatic divergence detection.
Sigma-X 系统的配套副图指标。包含绝对动能算法、趋势结构过滤以及自动背离检测功能。
**详细描述 / Description:**
---
### ** 中文说明**
这是 **Sigma-X Algo** 系统的专用副图震荡指标,用于辅助主图进行动能确认和背离识别。
#### **核心功能**
1. **动能柱 (Momentum Histogram):**
* 基于价格与 TRIMA 均线的偏离度绘制。
* **实心柱:** 动能增强。
* **空心/浅色柱:** 动能衰竭(这是进场的重要参考)。
2. **👀 自动背离检测 (Auto Divergence):**
* 自动识别价格与动能之间的 **底背离 (Bullish)** 和 **顶背离 (Bearish)**。
* **绿线:** 底背离,提示潜在上涨。
* **红线:** 顶背离,提示潜在下跌。
3. **🦅 鹰眼预警 (Warning Zones):**
* 当动能突破 **1.8σ** 警戒线时,背景会变色,提示即将进入变盘区。
#### **如何配合主图使用**
当主图出现 **S+ 信号** 时,观察副图:
* 如果副图同时出现 **绿线 (底背离)**,胜率极高。
* 如果副图动能柱颜色变浅 (衰竭),确认反转即将发生。
---
### ** English Description**
This is the companion oscillator for the **Sigma-X Algo** system, designed to confirm momentum and identify divergences.
#### **Key Features**
1. **Momentum Histogram:**
* Calculated based on the deviation between Price and TRIMA.
* **Solid Colors:** Momentum is increasing.
* **Pale Colors:** Momentum is exhausting (A key trigger for entry).
2. **👀 Auto Divergence Detection:**
* Automatically plots **Regular Bullish (Green Line)** and **Regular Bearish (Red Line)** divergences between Price and Oscillator.
3. **🦅 Warning Zones:**
* Background changes color when momentum breaches the **1.8σ** warning threshold, signaling potential volatility.
#### **How to Use with Main Chart**
When a **S+ Signal** appears on the Main Chart:
* Look for a **Green Line (Bullish Divergence)** on this oscillator for high-probability confirmation.
* Wait for the histogram bars to fade (exhaustion) before pulling the trigger.
---

Swift Algo X🧠 Swift Algo X - Adaptive Volume-Drift & Optimization System
Swift Algo X is a sophisticated quantitative trading system designed to solve a big failure point in technical analysis: Parameter Inefficiency.
While most indicators rely on static input settings that fail when market volatility shifts, Swift Algo X solves this by combining a Volume-Drift Model with an integrated Brute-Force Optimization Engine.
The system does not just guess the trend or entry signals, it runs 24 parallel historical simulations in the background to mathematically identify the optimal settings for the asset you are currently trading.
🔍 How It Works
The algorithm operates on a "Dual-Core" architecture: The Signal Engine generates possible trade setups, while the Optimization Engine validates and ranks them in real-time.
1. The Signal Engine: Volume-Drift Calculation Unlike standard indicators that rely on lagging price averages, Swift Algo X calculates the underlying "Volume Force".
It applies a Z-Score Normalization to measure how far the current volume flow has drifted from its statistical mean.
This creates a "Fair Value Estimate" derived purely from volume pressure rather than just price action.
Signals are generated when price breaks out of the volatility bands surrounding this estimate.
2. The Macro Anchor To filter out lower-timeframe noise: The system anchors all logic to a dynamic Macro Baseline.
Bullish Setups: Valid only when the Volume Estimate is sustaining above the Macro Baseline.
Bearish Setups: Valid only when the Volume Estimate is sustaining below the Macro Baseline.
3. The Optimization Engine (The Core Innovation) This is the distinguishing feature of Swift Algo X. On every bar update, the script utilizes Pine Script to:
- Simulate 24 different permutation sets of Volatility Factors and Periods.
- Backtest every permutation against historical price action in real-time.
- Rank them by Win Rate and display the most profitable mathematical fit on the dashboard.
⚙ Key Features
🚀 Live Strategy Tester: A built-in dashboard displays the Win Rate for your current settings vs. the calculated "Best Settings."
🧠 Self-Optimizing Logic: The system recommends the exact "Multiplier" and "Period" that have historically yielded the highest probability for the specific ticker.
✅ Volume-Weighted Signals: Entries are based on volume accumulation, offering a distinct advantage over price-only indicators.
🎯 Adaptive Bands: The volatility bands expand and contract based on the Z-Score drift, naturally filtering out chop during low-volume consolidation.
📘 How to Use
1) Apply to Chart: Load Swift Algo X on your preferred timeframe (e.g., 15m, 1H, 4H).
2) Consult the Dashboard: Look at the "Backtesting" table in the top right corner.
Row 1 (Current): Shows how your current inputs are performing.
Row 2 (Backtest): Shows the theoretical performance of the optimal settings found by the engine.
3) Align Parameters: If the "Backtest Setting" shows a significantly higher Win %, adjust your Multiplier and Period inputs to match the dashboard's recommendation.
4) Wait for BUY / SELL Labels to appear. Use these as confirmation or as tools within your own strategy.
5) Always complement signals with independent risk management and your own analysis.
💡 Originality & Concept
Swift Algo X innovates by transforming the chart from a passive display into an active Simulation Environment.
While the underlying concept of Trailing Stops is a familiar tool, Swift Algo X’s originality lies in its Permutation Engine. By leveraging complex array sorting and loop structures, the script performs a Historical Analysis inside the indicator itself.
This effectively turns a standard script into a dynamic "Strategy Analyzer," allowing traders to adapt the Volume-Drift model to the specific volatility profile of any asset class (Crypto, Forex, or Indices) instantly without leaving the chart.
⚠ Disclaimer
Swift Algo X is a quantitative analysis tool designed for educational purposes. The "Best Settings" are derived from historical data and do not guarantee future performance. Traders should always apply independent risk management.

PriceLevels GBGoldbach Price Levels – Identify Algorithmic Key Zones
This open-source indicator is designed to help traders identify potential algorithmic key zones by highlighting price levels ending with specific numbers such as 03, 11, 29, 35, 65, and 71. These levels may act as inflection points or hesitation areas based on observed behavioral patterns in price movement.
What It Does:
📌 Scans and plots horizontal price levels where the price ends with one of the selected number combinations
🎯 Toggle on/off visibility for each number ending
🎨 Customize color and thickness for each level
🏷️ Shows price labels at the end of each line
🌗 Label styles (color/transparency) are adjustable for both dark and light chart themes
🧠 Why Use It:
This tool is ideal for discretionary traders who study market structure through static price anchors. It provides a visual reference for recurring numerical levels that may be used in algorithmic trading models or serve as psychological price zones.
⚠️ Disclaimer:
This script is open-source and intended for educational and analytical purposes only. No trading signals or performance guarantees are provided. Please use your own judgment when applying this tool in a trading context.

Dynamic Zone Risk Manager [Algo Seeker]Introduction
The Algo Seeker: Dynamic Zone Risk Manager excels in both ranging and trending market conditions. It merges two critical trading components: a zone identification system that allows traders to anticipate price movement within structured ranges and a dynamic risk assessment table that optimizes position sizing based on account parameters and zone-specific characteristics, while also calculating trade-specific risk and reward.
For traders struggling with consistent risk management and identifying high-probability zones, particularly in challenging ranging market conditions, this tool provides a structured framework that enhances precision in trading decisions and capital allocation — addressing two of the most common challenges in trading.
🟠 Unique Features & Trading Benefits
Advanced Zone Structuring:
🟢 The indicator adapts to different trading styles through Scalp, Swing, and Investor modes. Scalp mode generates tight, precise zones optimized for intraday price movements and quick trades completed within minutes or hours. Swing mode creates intermediate zones calibrated for positions held for the entire day or a few weeks, providing optimal zone structures for medium-term trading approaches. Investor mode establishes broader zones designed specifically for positions spanning a few weeks to a few months, identifying major support and resistance levels for extended holding periods.
🟢 These zones are particularly useful during ranging markets. They define clear price ranges within which movement may oscillate based on the selected trading horizon. Such clarity helps traders anticipate potential bounce areas and manage trades more effectively, even when the market lacks a clear directional trend.
🟢 The system transforms static price levels into comprehensive trading zones with clearly defined boundaries. The multi-dimensional architecture creates actionable entry, exit, and management levels that remain relevant across different market conditions.
Unique Risk Management:
🟢 A dynamic risk table that calculates position sizing based on the trader's actual account size. When traders select Scalp, Swing, or Investor mode, the table automatically computes the optimal capital allocation specifically for that mode and the current zone.
🟢 The table provides exact dollar amounts for both risk and potential reward based on current price position within the zone. If price is already moving through a zone, the table dynamically updates to show how much of the potential reward remains available.
🟢 This precise risk management system gives traders a clear, quantified understanding of exactly how much capital to allocate per trade, the specific dollar amount at risk, and the remaining profit potential—all updating in real-time as price moves through the zones.
Dynamic Cost Basis Analysis:
🟢 Continuously calculates optimal midpoints within each zone, creating additional precision pivot points that traditional tools can lack. These dynamic reference points enhance trade accuracy in ranging markets while providing essential data points for the integrated risk management calculations.
🟠 The Power of Integration: Zones Meet Risk Management
The true power of the Algo Seeker: Dynamic Zone Risk Manager emerges when these components work together as a unified system. The trader-selected strategy zones and dynamic risk table create a complete trading ecosystem that addresses the three critical elements of successful trading:
1. Precision Entry Points: Zone boundaries provide clear entry thresholds optimized for your selected trading mode (Scalp, Swing, or Investor), eliminating guesswork around optimal trade initiation points.
2. Disciplined Risk Control: The risk table's exact dollar calculations remove emotional decision-making from position sizing and stop placement, creating a consistent risk approach regardless of market volatility.
3. Strategic Exit Management: As price moves through zones, both visual cues and quantified metrics guide intelligent profit-taking decisions, preventing the common mistake of exiting too early or holding too long.
This synchronized framework transforms theoretical analysis into practical execution, giving traders a complete toolset for managing the entire lifecycle of each trade with precision and confidence.
🟠 Additional Algo Benefits
Psychological Trading Edge:
The Algo Seeker: Dynamic Zone Risk Manager addresses the most challenging aspect of trading—emotional decision-making. By transforming complex risk/reward calculations into clear, quantified metrics, the system eliminates decision paralysis and reactionary trading. Traders gain immediate clarity during volatile conditions through the visual integration of precise zones and risk parameters. This psychological framework cultivates discipline and confidence when market noise typically triggers impulsive decisions, allowing for consistent execution even during challenging market environments.
Efficiency and Time Value:
The system delivers exceptional time efficiency by eliminating the need for manual risk calculations, zone identification, and position sizing. What typically requires multiple tools and extensive spreadsheet calculations is seamlessly integrated into a unified interface. Traders receive immediate, actionable insights without the cognitive burden of juggling separate indicators. This allows professionals to focus on strategic decisions rather than technical calculations.
Advanced User Customization:
Unlike one-size-fits-all indicators, the Algo Seeker: Dynamic Zone Risk Manager adapts to individual trading methodologies. The system accommodates personalized account parameters and allocates capital differently based on three distinct trading modes—scalping, swing trading, and investing. This flexibility allows professional traders to implement their unique strategy while maintaining precise risk control across different positions and time horizons. The customizable table positioning and color schemes further enhance workflow integration for diverse trading environments.
🟠 How to Use
Initial Setup
1. Lookback Parameter: The Lookback Period determines which candle data the Dynamic Zone Risk Manager uses to establish trading zones:
🟢Lookback = 1 (Default): Uses the most recent closed candle to calculate zones. This provides stable analysis based on completed price action and is recommended for most trading scenarios.
🟢Lookback = 0: Uses the current, still-forming candle. This offers more immediate responsiveness, but zones may change as the candle develops. For consistent zone analysis, Lookback = 1 typically offers a better foundation.
2. Configure Account Parameters: Input your total trading capital in the settings panel to customize risk calculations specific to your account size.
3. Select Trading Mode: Choose between Scalp, Swing, or Investor modes based on your preferred trade style:
🟢Scalp: For intraday movements (minutes to hours)
🟢Swing: For medium-term positions (days to weeks)
🟢 Investor: For longer-term positions (weeks to months)
4. Account Parameters Setup: The risk management component requires your account size to provide accurate position sizing calculations.
🟢Total Account Size: Enter your total trading capital in the "Total Account Size ($)" input. All risk calculations are based on this value.
🟢Trading Allocation Percentages: The system allows you to divide your capital across three trading modes.
1. Scalp Allocation (%): Percentage of capital reserved for short-term trades
2. Swing Allocation (%): Percentage of capital for medium-term positions
3. Invest Allocation (%): Percentage of capital for longer-term investments
These percentages can be customized to match your personal trading strategy and risk tolerance.
Margin Multiplier: Adjust the margin multiplier value based on your broker's requirements and your preferred leverage.
The system uses these parameters to calculate appropriate position sizes for each trading mode, ensuring your risk exposure remains aligned with your capital management plan.
5.Visual Customization: Adjust color schemes and table positions to optimize for your workspace layout and visual preferences.
🟠 Risk Table Explanation
The dynamic risk tables provide real-time position sizing and risk metrics as price moves through different zones:
1. Zone Column: Displays the current zone where price is located.
2. Zone Size: Shows the total price range of the current zone.
3. Trade Type: Indicates the trading style (Scalp, Swing, or Invest).
4. Shares: Displays the calculated position size (number of shares) based on your account parameters and the current zone.
5. Risk($): Shows the approximate dollar amount at risk if the trade moves against you within the zone.
6. Reward($): Displays the potential dollar return if price moves completely through the zone in your favor.
7. Left: Indicates how much potential movement remains within the current zone based on the latest price.
The table updates dynamically as price moves, giving you real-time risk/reward information. Each trading style is displayed separately, allowing you to compare potential position sizes across different trade modes while maintaining consistent risk management.
🟠 Strategic Execution
Strategy Usage Example
The Algo Seeker: Dynamic Zone Risk Manager provides a complete framework for precise trading decisions. Here's how you might leverage its power:
1. Zone-Based Trading: The indicator identifies key zones and levels that serve as powerful pivot points. These are not arbitrary levels but mathematically derived zones where price is likely to react. Use these zones directly for your trading decisions.
2. Precision Entries: For long positions, enter near the lower boundary of a zone with targets at the upper boundary. For shorts, enter near the upper boundary with targets at the lower boundary. These levels identify potential entry points based on the underlying market structure.
3. Risk Management: The zone, level, or cost basis below your entry (for longs) or above your entry (for shorts) can serve as logical places to set stop losses, helping you define your risk on each trade.
4. Position Sizing Precision: Use the exact share/contract quantities displayed in the risk table. This eliminates guesswork in position sizing and provides both risk and profit calculations that align perfectly with your capital management strategy.
5. Strategic Exits: Take profits at the target zone boundaries identified by the indicator. These levels represent mathematical points where price may encounter resistance or support, providing potential exit opportunities.
6. Advanced Strategy Options:
🟢Consider taking partial profits at cost basis (midpoint) levels
🟢Trade from zone to zone using the defined boundaries
🟢Scale in or out at specific zone transitions
🟢Set trailing stops at subsequent zone boundaries as price progresses
The strength of this indicator lies in its ability to provide all the critical decision points needed for a complete trade - from entry to exit, with precise position sizing - all derived from its sophisticated algorithmic analysis rather than subjective interpretation.
🟠 Alert Configuration
1. Zone Crossovers: Set alerts for when price transitions between key zones.
2. Cost Basis Interactions: Configure notifications for when price approaches optimal entry points.
The Algo Seeker Wizard Ultra Risk represents years of development and refinement in professional trading environments. Its integration of sophisticated zone identification with precise risk management creates a comprehensive framework that transforms theoretical market analysis into actionable trading decisions with quantified risk parameters.

tabbys star [Algo Seeker]Tabbys Star Mission:
Identifying key supply and demand areas for entries, identifying trends for holding positions, and locating potential re-entry or exit points is incredibly useful for traders and investors. This algorithm is designed to simplify these critical processes by providing actionable and intuitive tools directly on the chart.
🟢 Supply & Demand Zones (S&D)
The algorithm identifies key entry points by creating supply and demand blocks that automatically expand across the chart. These blocks remain active until invalidated, helping traders maintain awareness of significant price levels. When a new pivot point is identified, the algorithm generates a new supply or demand block that starts expanding from that pivot. This functionality enables traders to monitor evolving zones while referencing older ones, which might still act as weaker pivot points. These areas are incredibly unique and useful for traders, as they dynamically adapt to price action and provide clear visual cues for decision-making.
🟢 Continuation and Exit Signals
The algorithm also highlights areas for potential re-entries or exits. When the price moves beyond a supply or demand block, arrows are displayed to signal that this area may now be optimal for re-entering a trade or exiting a position.
Separating this logic from supply and demand zones offers significant flexibility for traders. For example, those who wish to hold positions initiated at an order block can confidently wait for these signals before taking profits. Similarly, traders who missed the initial opportunity at an order block can use these signals to evaluate new trade opportunities. This feature is incredibly useful for adapting to evolving market conditions.
🟩 Important Note
Arrow/triangle signals are not definitive indicators of upward or downward movement; they serve as calls to attention. These signals should be analyzed in conjunction with supply and demand zones.
For example, if a signal suggests bullish movement but the price falls below the current supply or demand zone, the signal was merely a call to attention. In such cases, it may indicate the need to set a stop loss or even consider a bearish trade below the zone.
Signals should be viewed as one of several factors to consider and should never be traded on in isolation.
🟢 Trendlines for Additional Confluence
In addition to supply and demand zones, the algorithm generates trendlines to help traders better visualize market trends. These trend lines are drawn from pivot points within the supply and demand blocks, providing an additional layer of confluence. For traders who rely on trendline breaks to make decisions, this feature enhances the overall analysis and adds value to the trading strategy.
🟢 Candle Color Coding
To further enhance clarity, the algorithm color-codes candles based on their position relative to the most recent order block:
Bullish: When the price is above the most recent order block.
Neutral: When the price is within the order block.
Bearish: When the price is below the order block.
This color-coding offers a unique and useful visual representation of the current market sentiment, allowing traders to assess price action at a glance.
Settings Overview
🟢Calculation Strength
This setting allows the user to choose how strict the algorithm should be when calculating data. The Standard option generates more entry and exit signals because the calculations are more lenient.. The Restrictive option uses stricter calculations, resulting in fewer signals for entries and exits.
🟢Use Current Bar:
If checked, the conditions will act on the current bar (real-time updates). If unchecked, the conditions will act after the bar closes. For a non-repainting indicator, leave this unchecked.
🟢Session Type:
Both:
Includes market and after-market hours.
RTH:
Regular trading hours only.
🟢Max Trend Lines:
"1": No trend lines will be shown.
"2" or higher: Displays trend lines based on pivot points.
🟢Bar Color:
Allows selection of candle colors based on the parameters discussed above.
🟢Signal Colors:
As described earlier.
🟢Alerts
For when a signal is created.
Conclusion
This tool is designed to hopefully assist investors and traders by:
Identifying key supply and demand areas for entries.
Highlighting trends for holding positions.
Pinpointing potential re-entry or exit points.

Market Structure AlgoThe "Market Structure Algo" (MS Algo) is a comprehensive tool developed by OmegaTools. This advanced indicator is designed to analyze the market's structure through a combination of pivot highs and lows, creating a nuanced understanding of potential market movements.
Core Functionality:
- Internal and External Market Structure (MS): The MS Algo differentiates between internal and external market structures by analyzing pivot points over different periods. This dual analysis allows for a deeper understanding of short-term and long-term market trends.
- Zone Distance and Visualization: The indicator introduces a novel approach to visualizing potential areas of interest or 'zones' around pivot points, adjustable through the 'Zone Distance' setting. This feature enhances the visual representation of zone created on the chart that can be used as a support and resistance area.
- Dynamic Signal Generation: Utilizing a comprehensive algorithm, the MS Algo identifies potential signals for entering and exiting trades based on the internal market structure. These signals are visually represented on the chart, aiding in decision-making. These signals are based on the acceptance and confirmed breakout or the refusal of the pivot points by the price.
Operational Mechanism:
- The MS Algo calculates pivot highs and lows over specified periods (input by the user) to determine the market's current structure. It then evaluates the market's position relative to these pivot points to assign a market structure score, which can range from bullish to bearish extremes.
- Signals for long and short positions, as well as exits, are generated based on the interaction between the close price and these pivot points.
- Additionally, the indicator plots zones around the moving average, adjusted for the ATR and the specified 'Zone Distance,' providing a visual guide to areas where the market might find support or resistance.
Usage Guidelines:
- To apply the MS Algo to your TradingView charts, adjust the 'Internal MS' and 'External MS' settings to align with your analysis preferences. The 'Zone Distance' input allows for customization of the zone visualization feature.
- The color-coded signals and zone fillings serve as guides to understanding the current market structure and potential areas of interest. These should be interpreted within the context of a broader trading strategy and risk management framework.
Understanding the Indicator's Originality:
The MS Algo stands out due to its unique blend of pivot analysis and zone visualization, providing traders with a detailed view of the market's structure that goes beyond traditional indicators. Its originality lies in the methodological integration of these components to offer a tool that enhances market analysis.
Responsible Use Disclaimer:
The financial markets are unpredictable, and the MS Algo is designed to serve as an analytical tool within a trader's arsenal, not a standalone solution for trading decisions. Traders should use this tool judiciously, alongside comprehensive market analysis and sound risk management practices. It's important to understand that the MS Algo does not guarantee trading success nor does it claim to predict specific price movements. Trading involves risks, including the potential loss of capital.

Heiken Ashi Algo v6The Heiken Ashi Algo Oscillator v6, introduces a refined approach to technical analysis applicable across various markets. Central to this algorithm is the integration of the Relative Strength Index #RSI, a staple indicator renowned for its effectiveness in measuring momentum.
The RSI - Tried and True:
By incorporating the #RSI, traders gain valuable insights into the speed and strength of price movements, aiding in the identification of potential #trend #reversals and #continuations.
Why Heiken Ashi Candles:
Additionally, the utilization of #Heiken Ashi candles within this algorithm offers a smoother representation of price action, reducing noise and enhancing clarity in trend analysis. This feature is particularly advantageous in volatile markets, where traditional candlestick patterns may produce false signals. By employing Heiken #Ashi candles, traders can more accurately identify underlying trends and make informed decisions based on reliable price data.
Combining RSI and Heiken Ashi:
The synergy between the RSI and Heiken Ashi candles in the Heiken Ashi Algo Oscillator v6 provides traders with a comprehensive perspective on both momentum and trend direction. This combination allows for a nuanced analysis of market dynamics, enabling traders to navigate various market conditions with greater confidence.
Heiken Ashi Candle Sizes:
The size of the Heiken Ashi candles serves as a visual indicator of the distance the RSI has moved between closing prices, offering additional insights into momentum shifts.
Not your average Heiken Ashi Candles:
Ive taken the time to do some serious custom coding for these particular Heiken Ashi Candles.
They do NOT color as the normal ones do. There is a setting in the inputs tab of the indicator that allows you to color them according to my secret code where its looking for Breaks of Structure on lower timeframes based on Heiken Ashi Candle calculations.
Turning on this feature gives you a more promising array of candle colors telling you about false or positive breakouts and trends.
Why choose this tool:
CoffeeShopCrypto's Heiken Ashi Algo Oscillator v6 offers a balanced and effective tool for traders across different markets. By leveraging the power of the RSI and Heiken Ashi candles, traders can enhance their decision-making process, identify trading opportunities with greater precision, and ultimately improve their overall trading performance.
------------------------------------------HOW TO USE IT------------------------------------------
Inflow / Outflow (accumulation and distribution) Ribbon
In trading we know liquidity means volume and volume is orders. This ribbon shows you when orders are entering, exiting, filling or flat in the market.
The Liquidity Ribbon is a visual representation of whats happening with accumulation and distribution in the market.
It acts as a dynamic area of support and resistance for the RSI (momentum).
Once the RSI breaks above or below the full area of the ribbon, you have an overturned short term market.
Breaking this area isn't easy because of the one sided thick line known as the PoC line or Point of Control Line.
This line changes between a rising and falling color to tell you what side of the market has the most resistance or support.
Custom HA candles
The common way for HA candles to be colors is green for bullish and red for bearish.
These candles color differently according to market dynamics vs how the current candle closes.
This is helpful to keep you from taking longs or shorts when the momentum just doesn't have the move.
How it all works together: Taking entries and failed breakouts.
In the image below (left to right) you can see the following take place:
Short Entry:
HA Candles push down through the ribbon breaking below its low side (Support Ribbon Broken)
Following this the RSI RANGE is broken to the down side.
This is a good setup for a short breakout
Retrace to false breakout:
After this price retraces and so does momentum.
HA Candles attempt to but fail to break through the top of the ribbon and push back down . This is a false breakout.
Bullish Divergence to Long Entry:
The Heiken Ashi Algo forms a bullish divergence and HA candles push back up into the ribbon. Without a change in candle structure the RSI breaks the top of the ribbon where the control line sits as well as breaking through the top of the RANGE area and
This is a promising setup for a long trade.
Rally Base Rally: (into secondary long trade)
As price is rising, it retraces until HA candles are within the RANGE. No candle closes or has a low below the RSI midline.
HA Candles are forming a consolidation. After consolidation the RSI breaks out the top of the ribbon and the top of the RANGE allowing a secondary long entry.
-----------------------------------------------------------------------------------------
Im not gonna lie. Ive written a lot of tutorials but this one was probably the most exciting to describe.
If you have any questions please do ask below.

YinYang RSIYinYang RSI is a Momentum Oscillator. It is loosely based on the standard RSI but uses our Custom True Value Zone Algorithm. Essentially it is a stronger, more accurate RSI that isn't manipulated by consolidation. YinYang RSI moves slightly slower than the standard RSI but when it does move it is much more accurate.
Why do we deem YinYang RSI to be a more accurate RSI? Well, let's discuss some of the underlying logic behind it. YinYang RSI is derived from the High and Low data from multiple Security Requests, we send that data into a modified Donchian Channel to calculate its Basis. That basis is then taken and averaged between multiple different VWMA calculations to ‘Smooth’ it out before we send it into an RSI calculation and display the final results.
This may sound a little confusing and you may be wondering, why bother doing this? The main reason we created the YinYang RSI is to remove the fact that consolidation causes Regular RSI to go down in index value. In our opinion RSI shouldn’t go down due to consolidation. By removing consolidation from RSI it innately made the RSI more smooth and since it became more smooth there were less times it crossed the RSI Moving Average (MA). In turn, since it crosses the RSI MA less, it means when it does cross the RSI MA, it is a much stronger more accurate signal; but don’t just take our word for it! Let’s get into some examples to show you exactly how it works:
Our RSI is very smooth, because of the way we apply VWMA to it, it keeps it from being a jagged line like the regular RSI is:
Our Indicator features 3 RSI’s in it: YinYangRSI, Regular RSI and YinYang Stoch RSI. The reason there are 3 is not only for the Information Tables (we will talk about this later), but also for the fact that you can overlay them on top of each other.
Here is the same dates but with Regular RSI:
Hopefully you can see how different they are and how smooth ours is, but if not, lets overlay them so you get a better idea:
When the YinYang RSI and Regular RSI are overlaid on top of each other, the Regular RSI’s colors change for easier readability. The Regular RSI turns Pink and the Regular RSI MA turns Orange. As you can see here, they function much differently and it is quite clear that the YinYang RSI holds itself during consolidation and is more smooth.
You may be asking yourself, this is great and all, but how does it help me trade?
Well, now that you understand the difference between YinYang and Regular RSI let's discuss exactly that!
So as you can see in the image above, when the RSI crosses the RSI MA it represents a strong movement in price is likely about to occur. When the RSI is very low (20 or less) and it crosses ABOVE the RSI MA, this represents a BUY/LONG signal. When the RSI is very high (80 or above) and it crosses BELOW the RSI MA, this represents a SELL/SHORT signal.
There are times where it is a good time to buy or sell, but the RSI may not be in the right place. This is rare but it does happen. We marked a location that did exactly that with an Orange circle in the picture above. These things happen, however we don’t recommend you act on them. The main reason is that they are much more risky. Nothing will ever be 100% accurate, but the key is making decisions that are more in your favor than not. When the RSI and RSI MA cross and the RSI is near 50, it's much less accurate, however, not impossible for it to be a good signal.
Now you may be wondering, how come I see 2 SELL or 2 BUY signals before the RSI moves a lot? This is quite normal. Based on the picture above, all of the BUY and SELL signals are accurate, but not all of them have insane price movements. However, they all did feature SOME price movements. Just because a BUY or SELL (RSI and RSI MA crossing) happens, doesn’t mean the RSI is going to move all the way from 80 to 20, sometimes the price only moves a bit and then corrects back. This is completely normal.
The part that is up to you is knowing when to exit these trades. You can use the YinYang RSI to see entry locations for Long/Short, but it can be risky to assume that you can go from a BUY right to a SELL and vice versa.
Don’t fret, there is a reason we have our YinYang Stoch RSI within this indicator and its not just because we felt like it! When you overlay the YinYang RSI and YinYang Stoch RSI on top of each other, you can get a very good idea of when a signal may be over and likely it’s a good time to get out. However, first, just so you understand what our YinYang Stoch RSI does, let's take a quick look at it.
At first glance, the YinYang Stoch RSI can look pretty strange and even overwhelming, this is completely normal. It features drastic movements, but only when there is good reason to! When the blue line (K) crosses the orange line (D) it represents momentum in price. So when the blue line crosses above the orange line it means BUY and when the blue line crosses below the orange line it means SELL.
How it works with the YinYang RSI is simple, lets toggle the two of them on together in the settings:
It may look a little confusing at first, and we don’t necessarily recommend you do it for your entry as it can be a little too much and sometimes confusing, but it can be very helpful for understanding your exit and if the momentum has changed/died down. Here's an example based on our initial BUY/SELL image above:
So since we’re talking about the double SELL signal and how to know if its momentum is ending we’ve zoomed in on this example. Here we can see where the pink circle is, that the YinYang Stoch RSI has gained buy momentum and the sell momentum has likely ended here. This is canceled out however, by the fact that shortly after we see another SELL signal combined with the Stoch RSI crossing under and also showing SELL momentum. The blue Vertical lines are to show visually where the stoch crossed over/under as they can be a little hard to see visually. Also, based on this example, you can see where the orange circle is that was clearly a very good buy location and also has the stoch crossover in that location too. So even though the RSI isn’t very low, there is still a decent amount of bullish momentum in that location. Is this enough for you to make a purchase on? In our opinion, it’s still a little too risky, but maybe it fits your trading style, or maybe you decide its a good time to Dollar Cost Average / purchase just a small amount.
Now, you may be wondering, as we mentioned it early, what are those Information Tables that have been sitting on the right of every example?
These Information Tables are there to display very important Time Frame data for you. Not only can you see 6 Different Time Frames, which you can customize within your Settings. You also get to see the level of RSI and RSI MA for YinYang, Regular and YinYang Stoch RSI. Being able to see this data on multiple different Time Frames without having to change the Time Frame you are on can be very helpful, especially if you’re trading on a lower Time Frame like 15 minutes. The color of the box is based on if the RSI has crossed the MA or not. When the box is Green, the RSI is greater than the MA (Bullish). When the box is Red, the RSI is less than the MA (Bearish).
This concludes our Tutorial on how to use YinYang RSI, below you will see all of our current Settings, what they all mean and how you can customize them.
Settings:
1. Show Signals:
Signals are when the RSI crosses the RSI MA (for any RSI TYPE active). When these crosses happen, it will make a plot on the chart that represents Buy and Sell Signals. These signals have alerts that correspond with them, but you will manually need to set up these alerts yourself through the indicator. Please refer to TradingView for how to set up alerts.
2. RSI Type:
We have 3 types of RSI’s within this Indicator:
YinYang RSI
Regular RSI
YinYang Stoch RSI
These RSI’s can be used individually or overlaid on top of each other for easier comparison. It can be useful to go back and forth between indicators or have them overlaid to get a better understanding of what's going on.
2.1. YinYang RSI:
Our YinYang RSI is our custom RSI that is based on our True Value Zone Algorithm. It is the main purpose of this Indicator but can be used in conjunction with Regular RSI and YinYang Stoch RSI. YinYang RSI is a much more smooth, slow moving form of RSI that doesn’t go down from consolidation and therefore makes the RSI and RSI MA crosses much more accurate.
2.2. Regular RSI:
This is a regular RSI that is within our indicator so you can make comparisons and also overlay on top of our YinYang RSI and/or YinYang Stoch.
2.3. YinYang Stoch RSI:
This is a Stoch RSI that is calculated with our YinYang RSI’s values to create a very unique Stoch RSI. Our YinYang Stoch RSI moves very drastically and quickly when there is true momentum swings but it never really hovers in the middle. It makes its way from 0-100 and 100-0 within 2-3 candles usually and if it makes it all the way, you know there is momentum backing this price movement.
3. Information Tables:
3.1. Show Information Tables:
Our Information tables display 6 different Time Frame resolutions to give you the data of YinYang RSI/MA, Regular RSI/MA and Stoch RSI/MA over multiple different Time Frames so you don’t constantly have to keep changing yours and can focus on the trade at hand.
You can choose to display:
‘All’,
‘None’,
‘YinYang RSI’,
‘Regular RSI’,
‘YinYang Stoch RSI’
and/or any combination of the three so you can see all the data you want to your liking.
3.2. Display Tables Direction:
Since there are 6 different Time Frames shown, and you have the ability to display all 3 RSI and MA values, this table can get pretty big. If you have a large monitor and not too many indicators active it's no big deal and a vertical display is likely what you’ll want. However, if you have a smaller monitor or many Indicators active, it will scrunch this Indicator and make it difficult to see all of your Time Frames in the tables. For this reason, we have the option to display them ‘Horizontally’.
3.3. Res1 / Res2/ Res3 / Res4 / Res5 / Res6:
These represent the different resolutions (Time Frames) being used in your information tables and can be modified to display whatever resolution works best for your trading style. By default they are:
Res1: Current Timeframe
Res2: 15 Minute
Res3: 1 Hour
Res4: 4 Hour
Res5: 1 Day
Res6: 1 Week
Backup Res (not changeable): 5 Minute (this is only used if your Current Timeframe in Res1 is a duplicate of one of the other resolutions)
Alerts are available and customizable within the Indicator. You can set up an alert for any of the RSI crossing Signals.
If you have any Questions or Concerns, don’t hesitate to contact us.
HAPPY TRADING!

Trend Precognition - Mtrl_ScientistHi everyone,
This is an updated version of my base algorithm "BTC Precognition". I've managed to remove some lag, while at the same time smoothing the curve (blue).
All you need to know about it is on the chart's legend. The arrows just correspond to the bottoms/tops of the blue signal curve (marked with green/red circles). However, predicting turning points is difficult and I'm still working on that. So for now, the signals are offset by 1 candle into the past. This means that all of your trades will be 1 candle late, unless you trade intrabar using your own intuition. As a help, I've also included the first derivative (black curve) that will tell you the slope of the blue curve. Remember, when the curve is about to turn, the slope becomes zero. However, you can anticipate this by looking at the slope's direction and guessing when it will cross the zero line.
This is still all work in progress, so invite-only.

Trendilo + Adaptive Volatility Prediction AlgorithmTrendilo + Adaptive Volatility Prediction Algorithm
Credit: Original Trendilo created by dudeowns. This version keeps the original trend logic and adds an algorithmic based volatility predictive method used in other proprietary, high end indicators I had created in the past.
Timeframe and Usage:
Designed for use on the 15m timeframe but can be used on any timeframe. Settings are available for tweaking and fine tuning based on your trading strategy and preferences.
Note: In my testing I've found the 3D to be HIGHLY effective as determining major volatile breakouts after periods of consolidation.
3 Day chart example
What this indicator shows:
• 📈 Trend Line: A simple line plot showing the general direction of price (up, down, or neutral).
• 🎨 Volatility Band: A colored visual layer that shows how tight or loose the market currently is.
Volatility Color Meanings:
• Transparent / Wide = Expanded (normal market movement)
• 🔵 Blue = Normal volatility
• 🟣 Purple = Compressed (price is tightening)
• 🔴 Red = Highly Compressed (strong pressure build-up)
• 💛 Yellow = Extremely Compressed (market is tightly coiled at a rare level)
How to interpret / use this indicator
This indicator does not predict direction. It shows how much volatile energy is building in the market for an upcoming move.
The stronger the compression (Purple > Red > Yellow), the bigger the volatility release tends to be relative to recent price action.
The yellow state is the most significant. It indicates the market is at extremely compressed levels and has enough energy stored for substantial and volatile movement.
Display Panel:
A small panel on the chart shows the current volatility condition in plain text for fast recognition.

Edge Algo
EDGE ALGO is a trend-following and momentum-based algorithm designed to deliver precise Buy and Sell signals with built-in risk management through dynamic Take Profit and Stop Loss levels.
This invite-only tool was created to assist traders in identifying high-probability trade setups while filtering out market noise and avoiding choppy price action.
🧠 How It Works
Edge Algo combines multiple layers of logic to increase the quality of trade signals:
1. Trend Detection
* A dynamic ATR-based channel determines when the price breaks out in a new direction.
* The trend flips to Bullish or Bearish when price action crosses the adaptive channel, avoiding late entries.
2. Momentum Confirmation
* Custom logic involving RSI (Relative Strength Index) and CMO (Chande Momentum Oscillator) helps filter fake signals.
* Buy conditions require RSI to be under 25 and CMO to confirm upward momentum.
* Sell conditions require RSI to be over 75 and CMO to confirm downward momentum.
3. Support/Resistance Pivot Zones
* Recent highs/lows are used as confirmation points to strengthen entries around key price levels.
4. Entry Logic
* When trend change + momentum filter + pivot confirmation align, the script generates a Buy or Sell signal.
* Each signal is clearly displayed on the chart with custom labels.
🎯 Risk Management (SL/TP Logic)
For every valid entry, the script automatically calculates:
✅ Stop Loss (SL) based on a user-defined percentage
✅Take Profit 1 (TP1) at 1R
✅ Take Profit 2 (TP2) at 2R
✅ Take Profit 3 (TP3) at 3R
This allows traders to follow a consistent risk-to-reward ratio and manage trades using partial exits or full closes at target levels.
📊 Visualization Features
* Optional Cloud Moving Average to visually represent market direction
*Buy/Sell labels on chart with clean styling
* Clearly marked Entry, TP1, TP2, TP3, SL levels
* Real-time alerts for Buy and Sell signals
* Fully customizable styling (colors, cloud, labels, etc.)
⚙️ Best Use Cases
* Timeframes: optimized for 15min to 4H charts
* Pairs: works with Forex, Crypto, Indices, Commodities, and Stocks
* Styles: suitable for scalping, intraday trading, and swing trading
🔒 Why Invite-Only?
Edge Algo PRO contains proprietary logic developed specifically for real-time application with an edge in volatile markets.
To protect the intellectual property and ensure quality use, access is granted only upon request.

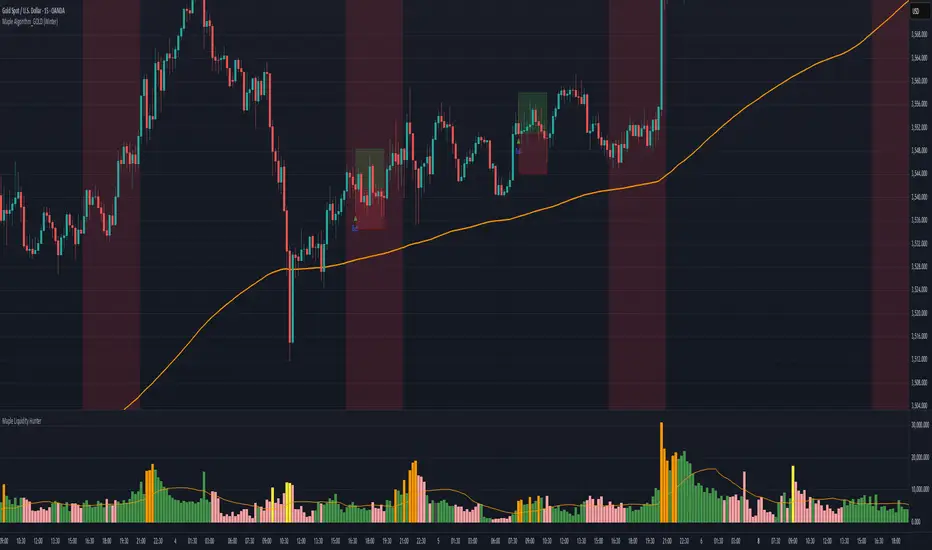
Maple Algorithm_GOLDMaple Algorithm – AI-Powered Gold Indicator
Maple Algorithm is an AI-inspired indicator designed specifically around the price behavior of Gold (XAUUSD).
It automatically calculates and plots take-profit (TP) and stop-loss (SL) levels based on dynamic market conditions, allowing traders to capture precise entries and exits.
✨ Key Features
AI-driven adaptive model trained on Gold’s market structure
Auto-generated TP/SL zones for precision trading
Compatible with your own strategies — scale from 1:2 RRR up to even higher setups
Optimized for scalping and short-term momentum bursts
⚠️ Disclaimer:
This indicator is for educational and research purposes only. It does not guarantee future results. Always test thoroughly before applying to live trading.
Apex Edge – Wolfe Wave HunterApex Edge – Wolfe Wave Hunter
The modern Wolfe Wave, rebuilt for the algo era
This isn’t just another Wolfe Wave indicator. Classic Wolfe detection is rigid, outdated, and rarely tradable. Apex Edge – Wolfe Wave Hunter re-engineers the pattern into a modern, SMC-driven model that adapts to today’s liquidity-dominated markets. It’s not about drawing pretty shapes – it’s about extracting precision entries with asymmetric risk-to-reward potential.
🔎 What it does
Automatic Wolfe Wave Detection
Identifies bullish and bearish Wolfe Wave structures using pivot-based logic, symmetry filters, and slope tolerances.
Channel Glow Zones
Highlights the Wolfe channel and projects it forward into the future (bars are user-defined). This allows you to see the full potential of the trade before price even begins its move.
Stop Loss (SL) & Entry Arrow
At the completion of Wave 5, the algo prints a Stop Loss line and a tiny entry arrow (green for bullish, red for bearish). but the colours can be changed in user settings. This is the “execution point” — where the Wolfe setup becomes tradable.
Target Projection Lines
TP1 (EPA): Derived from the traditional 1–4 line projection.
TP2 (1.272 Fib): Optional secondary profit target.
TP3 (1.618 Fib): Optional extended target for large runners.
All TP lines extend into the future, so you can track them as price evolves.
Volume Confirmation (optional)
A relative volume filter ensures Wave 5 is formed with meaningful market participation before a setup is confirmed.
Alerts (ready out of the box)
Custom alerts can be fired whenever a bullish or bearish Wolfe Wave is confirmed. No need to babysit the charts — let the script notify you.
⚙️ Customisation & User Control
Every trader’s market and style is different. That’s why Wolfe Wave Hunter is fully customisable:
Arrow Colours & Size
Works on both light and dark charts. Choose your own bullish/bearish entry arrow colours for maximum visibility.
Tolerance Levels
Adjust symmetry and slope tolerance to refine how strict the channel rules are.
Tighter settings = fewer but cleaner zones.
Looser settings = more frequent setups, but with slightly lower structural quality.
Channel Glow Projection
Define how many bars forward the channel is drawn. This controls how far into the future your Wolfe zones are extended.
Stop Loss Line Length
Keep the SL visible without it extending infinitely across your chart.
Take Profit Line Colors
Each TP projection can be styled to your preference, allowing you to clearly separate TP1, TP2, and TP3.
This isn’t a one-size-fits-all tool. You can shape Wolfe detection logic to match the pairs, timeframes, and market conditions you trade most.
🚀 Why it’s different
Classic Wolfe waves are rare — this script adapts the model into something practical and tradeable in modern markets.
Liquidity-aligned — many setups align with structural sweeps of Wave 3 liquidity before driving into profit.
Entry built-in — most Wolfe scripts only draw the structure. Wolfe Wave Hunter gives you a precise entry point, SL, and projected TPs.
Backtest-friendly — you’ll quickly discover which assets respect Wolfe waves and which don’t, creating your own high-probability Wolfe watchlist.
⚠️ Limitations & Disclaimer
Not all markets respect Wolfe Waves. Some FX pairs, metals, and indices respect the structure beautifully; others do not. Backtest and create your own shortlist.
No guaranteed sweeps. Many entries occur after a liquidity sweep of Wave 3, but not all. The algo is designed to detect Wolfe completion, not enforce textbook liquidity rules.
Probabilistic, not predictive. Wolfe setups don’t win every time. Always use risk management.
High-RR focus. This is not a high-frequency tool. It’s designed for precision, asymmetric setups where risk is small and reward potential is large.
✅ The Bottom Line
Apex Edge – Wolfe Wave Hunter is a modern reimagination of the Wolfe Wave. It blends structural geometry, liquidity dynamics, and algo-driven execution into a single tool that:
Detects the pattern automatically
Provides SL, entry, and TP levels
Offers alerts for hands-off trading
Allows deep customisation for different markets
When it hits, it delivers outstanding risk-to-reward. Backtest, refine your tolerances, and build your watchlist of assets where Wolfe structures consistently pay.
This isn’t just Wolfe detection — it’s Wolfe trading, rebuilt for the modern trader.
Developer Notes - As always with the Apex Edge Brand, user feedback and recommendations will always be respected. Simply drop us a message with your comments and we will endeavour to address your needs in future version updates.

Swing Z – Crypto Trading Algorithm | Zillennial Technologies IncSwing Z by Zillennial Technologies Inc. is an advanced algorithmic framework built specifically for cryptocurrency markets. It integrates multiple layers of technical analysis into a single decision-support tool, generating buy and sell signals only when several independent confirmations align.
Core Concept
Swing Z fuses trend structure, momentum oscillators, volatility signals, and price action tools to capture high-probability trading opportunities in volatile crypto environments.
Trend Structure (EMA 9, 21, 50, 200)
Short-term EMAs (9 & 21) detect immediate momentum shifts.
Longer-term EMAs (50 & 200) define the broader trend and dynamic support/resistance.
Momentum & Confirmation Layer
RSI measures relative strength and market conditions.
MACD crossovers confirm momentum shifts and trend continuations.
Volatility & Market Pressure
TTM Squeeze highlights compression zones likely to precede breakouts.
Volume analysis confirms conviction behind directional moves.
VWAP (Volume Weighted Average Price) establishes intraday value zones and institutional benchmarks.
Price Action Filters
Fibonacci retracements are integrated to identify key reversal and continuation levels.
Signals are produced only when multiple conditions agree, reducing noise and improving reliability in fast-moving crypto markets.
Features
Tailored for cryptocurrency trading across major pairs (BTC, ETH, and altcoins).
Works effectively on swing and trend-based timeframes (1H–1D).
Combines trend, momentum, volatility, and price action into a single framework.
Generates clear Buy/Sell markers and integrates with TradingView alerts.
How to Use
Apply to a clean chart for the clearest visualization.
Use Swing Z as a swing trading tool, aligning entries with both trend structure and momentum confirmation.
Combine with your own stop-loss, take-profit, and position sizing rules.
Avoid application on non-standard chart types such as Renko, Heikin Ashi, or Point & Figure, which may distort results.
Disclaimer
Swing Z is designed as a decision-support tool, not financial advice.
All backtesting should use realistic risk, commission, and slippage assumptions.
Past results do not guarantee future performance.
Signals do not repaint but may adjust as new data develops in real-time.
Why Swing Z is original & useful:
Swing Z unifies EMA trend structure, RSI, MACD, TTM Squeeze, VWAP, Fibonacci retracements, and volume analysis into a single algorithmic framework. This multi-confirmation approach improves accuracy by requiring consensus across trend, momentum, volatility, and price action — a design made specifically for the challenges and volatility of cryptocurrency markets.

Pivot Points [SMRT Algo]Pivot Points is a free, innovative indicator designed to automatically detect and highlight key turning points on your TradingView charts through advanced candlestick pattern analysis. This indicator is perfect for traders seeking clear visual signals for potential trend reversals.
How It Works:
Candlestick Pattern Analysis: The indicator continuously scans for specific candlestick formations. It identifies a potential high pivot when a bullish candle (where the close is higher than the open) is immediately followed by a bearish candle (where the close is lower than the open). Conversely, a potential low pivot is detected when a bearish candle is followed by a bullish candle.
Boxing the Price Range: Once a potential pivot is identified, the algorithm draws a box around the corresponding price range. This box captures the area where the price action is concentrated, serving as a zone of interest for the pivot.
Confirmation of Major Pivots: The initial detection marks what we call a "minor pivot" with a temporary yellow box. The indicator then waits for subsequent price action. If the price fails to break out of this box—meaning it remains confined within the defined boundaries—the pivot is confirmed as a major pivot. At this stage, the yellow box changes color to green (or red, depending on whether it’s a high or low pivot), clearly marking the confirmed turning point.
Pivot Sequence: The progression follows a clear sequence: Minor Pivot ➔ Yellow Box ➔ Major Pivot. This step-by-step visual guide helps traders quickly interpret the strength and significance of the pivot.
Inputs:
Show Labels: An input option allows you to toggle pivot labels on or off, so you can choose whether to display descriptive labels directly on your chart.
Adjustable Colors: The colors of the pivot points—including the green and red boxes—are fully customizable via the input settings. This ensures that you can tailor the visual appearance of the indicator to match your personal charting style or trading strategy.
Enhancing Entry and Exit Strategies
Entry Points: Look to enter a trade when the indicator confirms a pivot (after the box changes color). A confirmed pivot could indicate that a reversal is underway, giving you a potential entry signal.
Exit Points & Stop Losses: Use the boundaries of the pivot box to set stop losses. For example, if you’re in a long trade and the price approaches a confirmed resistance pivot, consider this a signal to tighten stops or exit, as the trend may reverse.
Confluence with Other Indicators: Combine the pivot point signals with other tools like RSI, MACD, or volume indicators. If multiple signals point to a reversal at the same pivot, it strengthens your confidence in the trade decision.
Trading Strategy Applications
Reversal Trading: Use confirmed pivot points as indicators for potential reversals. Enter trades when the price action validates the pivot point, anticipating that the market is turning.
Range Trading: When the price oscillates within a defined pivot box, you can use the top and bottom of the box as potential boundaries for a range-trading strategy.
Breakout Trading: Conversely, if the price breaks out of a pivot box, this may signal the start of a new trend. You can use this breakout as a trigger for entering a position in the direction of the breakout.
The indicator highlights potential reversal zones with clearly marked boxes and labels, making it easier to spot key turning points and manage trades effectively.
Pivot Points removes the guesswork by automatically scanning for and confirming pivot points based on rigorous candlestick analysis.
Whether you're a day trader or a swing trader, Pivot Points provides actionable insights into market dynamics, helping you to better time entries and exits.

Ichimoku Score Indicator [tanayroy]The Ichimoku Cloud is a comprehensive indicator that provides a clear view of market states through five key components. By analyzing the interaction between these components and the asset's price, traders can gain insights into trend direction, momentum, and potential reversals.
Introducing the Ichimoku Score System
I have developed a scoring system that quantifies these interactions, offering an objective method to evaluate market conditions. The score is calculated based on the relative positioning of Ichimoku components, with adjustable weightings via user input.
Scoring Criteria
Each component contributes to the overall score as follows:
Price vs. Cloud (Kumo) & Other Components
Price vs. Kumo → 2 Points
Price vs. Kumo Shadow → 0.5 Points
Tenkan vs. Kijun
Tenkan vs. Kijun → 2 Points
Tenkan vs. Kumo → 0.5 Points
Kijun vs. Kumo → 0.5 Points
Tenkan Slope → 0.5 Points
Kijun Slope → 0.5 Points
Chikou Span Interactions
Price vs. Chikou → 2 Points
Chikou vs. Kumo → 0.5 Points
Chikou Consolidation → 0.5 Points
Senkou Span Analysis
Senkou A vs. Senkou B → 2 Points
Senkou Slope → 0.5 Points
Price vs. Key Levels
Price vs. Tenkan → 2 Points
Price vs. Kijun → 2 Points
Interpreting the Score
The aggregate score functions as an oscillator, fluctuating between a range of ±16.0.
A higher score indicates strong bullish momentum.
A lower score suggests bearish market conditions.
To enhance readability and smooth fluctuations, a 9-period SMA is applied to the score.
Application in Algorithmic Trading
This scoring system helps integrate Ichimoku Cloud principles into algorithmic trading strategies by providing a structured and quantifiable method for assessing market conditions.
Would love to hear your feedback! 🚀 Let me know how this system works for you.

ICT Algorithmic Macro Tracker° (Open-Source) by toodegreesDescription:
The ICT Algorithmic Macro Tracker° Indicator is a powerful tool designed to enhance your trading experience by clearly and efficiently plotting the known ICT Macro Times on your chart.
Based on the teachings of the Inner Circle Trader , these Time windows correspond to periods when the Interbank Price Delivery Algorithm undergoes a series of checks ( Macros ) and is probable to move towards Liquidity.
The indicator allows traders to visualize and analyze these crucial moments in NY Time:
- 2:33-3:00
- 4:03-4:30
- 8:50-9:10
- 9:50-10:10
- 10:50-11:10
- 11:50-12:10
- 13:10-13:50
- 15:15-15:45
By providing a clean and clutter-free representation of ICT Macros, this indicator empowers traders to make more informed decisions, optimize and build their strategies based on Time.
Massive shoutout to @reastruth for his ICT Macros Indicator , and for allowing to create one of my own, go check him out!
Indicator Features:
– Track ongoing ICT Macros to aid your Live analysis.
- Gain valuable insights by hovering over the plotted ICT Macros to reveal tooltips with interval information.
– Plot the ICT Macros in one of two ways:
"On Chart": visualize ICT Macro timeframes directly on your chart, with automatic adjustments as Price moves.
Pro Tip: toggle Projections to see exactly where Macros begin and end without difficulty.
"New Pane": move the indicator two a New Pane to see both Live and Upcoming Macro events with ease in a dedicated section
Pro Tip: this section can be collapsed by double-clicking on the main chart, allowing for seamless trading preparation.
This indicator is available only on the TradingView platform.
⚠️ Open Source ⚠️
Coders and TV users are authorized to copy this code base, but a paid distribution is prohibited. A mention to the original author is expected, and appreciated.
⚠️ Terms and Conditions ⚠️
This financial tool is for educational purposes only and not financial advice. Users assume responsibility for decisions made based on the tool's information. Past performance doesn't guarantee future results. By using this tool, users agree to these terms.

Level 1 - Learn to code simply - PineScriptThe goal of this script is honestly to help everyone learn about trading with bots and algos.
At least, to get started.
Level 1:
10 lines of code.
learn to plot 2 moving averages on your chart.
learn to create a signal from a crossover.
learn the very basics of Pine Script algo.

RockIt Algo Profit Track X (Add-on to RockIT Algo)The RockIT Algo Profit / Loss Tracker is an add-on for the RockIT Algo Indicator. It provides the profit / loss realized for each buy or sell signal. This way you can visually view the performance and make profitable decisions.
The RockIT Algo Indicator is designed to generate buy (Long) / sell (Short) signals & is developed using statistical analysis & forecasting techniques. The algorithm takes into consideration different dynamic variables of short, medium and long term price actions and high probability patterns to project future direction. It is suited for all types of trading and can be used for any stocks, forex pairs and crypto.
Disclaimer
TheStreetATM is not registered as financial or investment advisors. You take the responsibility of making the final decision based on the tools, education and information we provide. Trading stocks can lead to very large losses, and we strongly recommend to consult any registered financial advisor before making any decision based on information provided by “RockIT” Algo®. Thank you. We strongly advice to paper trade before making real trading decisions.

RockIT Algo XThe RockIT Algo Indicator is designed to generate buy (Long) / sell (Short) signals & is developed using statistical analysis & forecasting techniques. The algorithm takes into consideration different dynamic variables of short, medium and long term price actions and high probability patterns to project future direction. It is suited for all types of trading and can be used for any stocks, forex pairs and crypto.
Disclaimer
TheStreetATM is not registered as financial or investment advisors. You take the responsibility of making the final decision based on the tools, education and information we provide. Trading stocks can lead to very large losses, and we strongly recommend to consult any registered financial advisor before making any decision based on information provided by “RockIT” Algo®. Thank you. We strongly advice to paper trade before making real trading decisions.

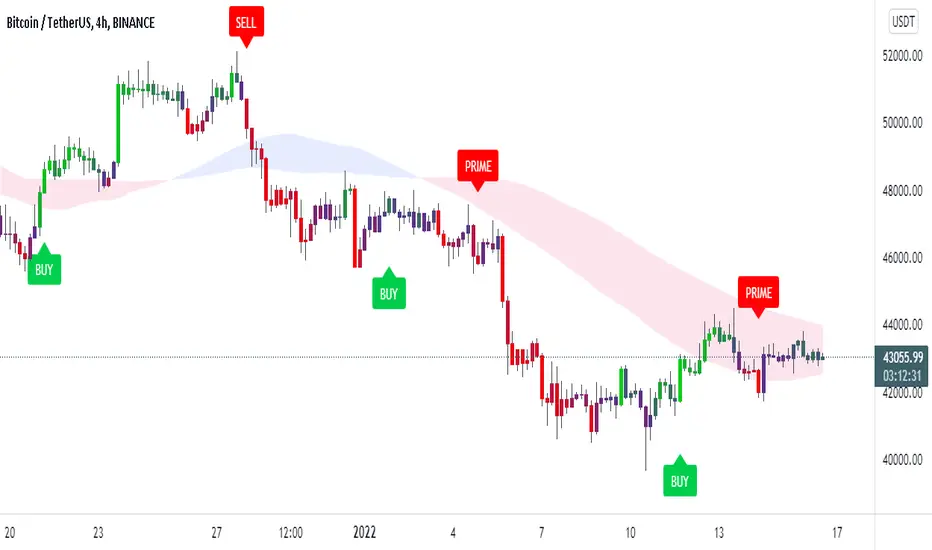
Trendorithm PrimeTrendorithm Prime is a toolkit made up of several different innovative indicators, designed by our team of developers. Get access now and create your own, unique trading strategies using our - all in one algorithm.
Our algorithm works in any market and focuses on finding the direction of the trends and remove noise from the price, for smooth understanding of the market.
Extra Confirmation
Using binomial distribution, the past values are processed to interpret the direction of trend.
After that, the signals are triggered based the volatility of the market,which is derived from the averages of candle size. All of these signals were optimised for each timeframe using timeframe multiplier.
Setting a lesser value on quotient adjusts the lookback length and volatility conditions, thus producing more number of signals that supports scalping trades. Higher the number in quotient, the frequency of trades reduce which helps the trader to hold trades for longer time.
Our Confirmation Signals helps to analyze the direction of trends for all markets and all timeframes, it boosts Trader’s confidence prior taking trades.
We made our Confirmation Signals flexible in order to suit any kind of trading style.
By adjusting the Quotient value in the settings, Traders can control the frequency of signals generated easily.
The Confirmation Signals includes a special type of signal called "Prime" which includes candle coloring to see the strength of the trend.
Our Candle-system is designed in 3 different colorings.
Green ( Bullish )
Red ( Bearish )
Purple (possible reversal or the possible formation of a new trend)
Trendo Cloud
The power of moving averages is always ultimate. This cloud made up of multiple moving averages acts as a dynamic support and resistance. The color and width of the cloud is used to find potential entry and exit points for trades.
Trend Catcher and Trend Chaser
The trend catcher is a trend-following indicator moves close to the price that aims to estimate the recent trend of price. It indicates green in uptrend and red in case of a downtrend.
The trend chaser is similar to the previous Trend Catcher, but it aims to chase long-term trends.
They are specially calculated from the highs and lows of price. Acts as a filter for confirmation signals and provides clarity for the direction of trend.
All of these functionalities tend to help users understand the market conditions as trending or ranging.
If you are using this script, you acknowledge that past performances are not indicative of future results and that there are a lot of factors required that go into being a profitable trader.
You can see the Author’s instructions below to get access to this prime indicator.