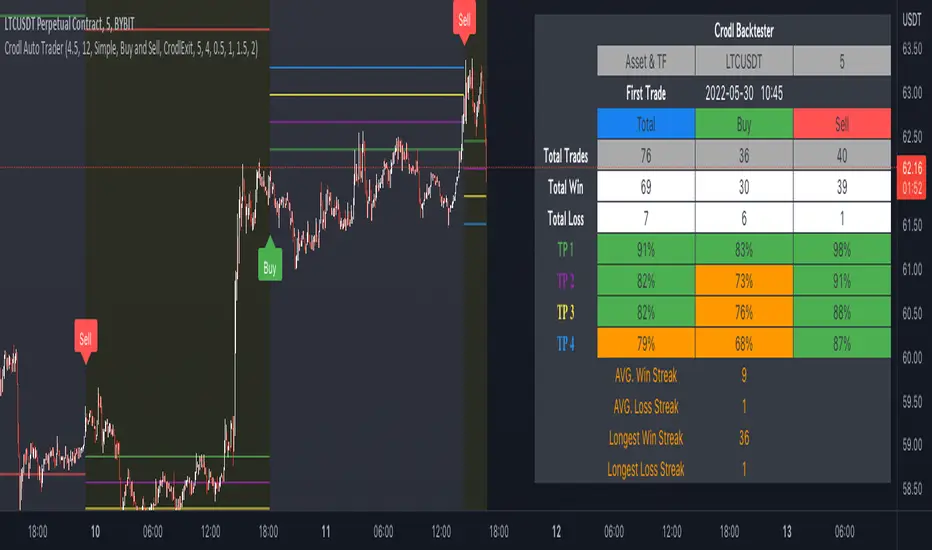
Crodl Auto TraderI've added Buy & Sell Flags - They will be used to add Longs and Shorts Flags as well as the ability to add alerts on them.
What triggers the Buy signal?
Buy signal = This indicator make use of the rsi (Relative Strength Index) to look at specific overbought and oversold levels as confirmation if it is an uptrend and not overbought yet. This will indicate that a long opportunity will be possible.
The SMA (slow moving average) is being used to calculate where to entry as it uses Crossed SMA's for entries.
SMA and EMA Crosses with the RSI (not overbought) will give as a buy signal if the SMA cross the EMA.
Sell signal = When the Rsi is not oversold this will give a good confirmation that the market still has downwards potential and it will wait for a cross on the SMA and EMA when crossed over for a sell signal. If we get a cross but the RSI is oversold that will be seen as a bad signal and it will be avoided.
Take Profit - Currently there are 4 Hardcoded Targets and on the backtester you will see the results for all 4 separately on the Info Panel.
The 4 green lines (TP)
1st line is at 0.5% market move, 2nd line is at 1% market move ,3rd one is at 1.5% market move and the last and 4th line is at 2%.
This will be where it will take profit unless you set the Exit Strategy to Opposite then it will use the opposite flags to exit.
So when it is set to Opposite and the previous flag was a long then it will exit on the next short flag and when the previous flag was a short flag then it will exit on the next long flag.
if the exit strategy is set to CrodlExit it will use an ATR based exit. so if the previous flag was a short it will wait for price to cross an ATR level then it will close the short and the same if the last flag was a long it will only be closed if a TP (green line) level has been reached or the ATR level for an exit.
if the Exit Strategy has been set to Fixed SL then you can set the sl at a specific %. if you set the Fixed SL at 2% that means if the last flag was a buy signal then if the TP targets was not reached first and the market moves downwards by 2% it will exit and wait for the next flag, if you are in a short and the TP level was not reached if the market moves 2% upwards it will close your short.
Backtest Data has 3 options. You can choose for it to show both Long(Buy) and short(sell) or just Buy or just Sell data.
Statistics Type will show you the info panel on the right. if you set it on Simple you will see the following data
Asset that you are currently on as well as the timeframe.
and the date it starts reading data to plot entries from. this will change depending on the timeframe that you are on. since higher timeframes will show you candles from longer time back as lower time frames.
Total = The amount of buy and sell flags since the first trade data and buy will give you the buy amount flags shown since that date and sell will show you the amount of sell flags since the start date.
Total win = this will tell you how many trades reached the TP (green lines) before a exit condition was met.
Total loss = this will show you how many of the flags exited based on the exit type selected before a TP target was reached.
TP1= how many time we reached the first target level at 0.5%
TP2= how many time we reached the second target level at 1.0%
TP3= how many time we reached the third target level at 1.5%
TP4= how many time we reached the fourth target level at 2.0%
the % are calculated from the total wins and total losses and it will give you the % difference.
If the % is bigger than 80 it will have a green background and if its less than 80% but more than 50% then it will be orange, if it is less than 50% it will be red.
win streak is the average of how many times we reached the profit target in a row before we reached an exit target based on the exit strategy
Loss streak is the average of how Many losses we had in a row before we reached the TP1 level
Longest Winning streak is how many times after one win we had another wining trade meaning TP reached before a stop level based on the exit strategy
Longest losing streak is the amount of times we reached the SL level based on the exit strategy before reaching a TP level or the opposite flag depending on the setting based on exit strategy.
to hide the info panel you can set the statistics to Coming soon.
Alerts can be set on all the TP targets and Entries(Buy and Sell flag) as well as all the exit strategies.
Search in scripts for "backtest"
TWAP + MA crossover Study [Dynamic Signal Lab]Dear TV'ers,
Hereby the study for the TWAP/moving average crossover, with taking profit options.
moving averages include: EMA , WMA , DEMA , TEMA , VAR, WWMA, ZLEMA , TSF , HULL, TILL
It is also possible to gradually take profit, using:
* minimum consecutive green/red candles
* minimum amount of green/red candles in the last 2-8 candles
* both of the above criteria
The slightly transparent green fill shows how much you are in profit from your entry point
The current default properties should be modified to make this strategy cost-effective, but typically 15 minutes and higher timeframes (up to 6hr) seem to work well for larger (top10 cap) crypto projects. Don't use this script for small-caps as it will get you rekt, due to wild volatility.
Additionally, you'll also be able to continuously take profit, making sure you lock in all those sweet profits. For backtesting: use the strategy version of this script

Trading Sessions - SonarlabThe Trading Sessions indicator shows the most significant trading sessions for the Forex market, such as London, New York and Asian.
The sessions are presented as colored boxes on the chart, thereby clearly indicating open and close times of a particular session, as well as its trading range.
How is this Forex market session indicator used?
Traders normally use trading sessions to determine the volatile hours throughout the day, since the trading activities vary from one stock exchange to another.
London and New York market trading sessions are considered to be the most volatile, especially during the 4-hour overlap.
There are also strategies aiming only at the opening of the London session or those that allow trading only during the Asian session.
Backtesting
When testing out your strategy this Indicator can be handy to use while backtesting in Tradingviews replay mode. Only backtest the sessions you will normally trade.
Settings:
For each session:
Time beginning - end
Show session range or only beginning
Colors
Overlay type: BOX/ Background/ High - Low
Display settings statistics
ADR
Mid line (50%)
Range

Argo I (alerts for 3commas single bots)This script lets users create BUY/SELL alerts for 3commas single bots in a simple way, based on a built in set of indicators that can be tweaked to work together or separately through the study settings. Indicators include Bollinger Bands, Williams %R, RSI, EMA, SMA , Market Cipher, Inverse Fisher Transform.
If the user choses to create both BUY and SELL signals from the study settings, the alert created will send both BUY and SELL signals for the selected pair. Note the script will only send alerts for the pair selected in the study settings, not for the current chart (if different).
How to use:
- Add the script to the current chart
- Open the study settings , insert bot details. Pairs MUST be in capital letters or 3commas will not recognize them.
- Still in the study settings, tweak the deal start/close conditions from various indicators until happy. The study will plot the entry / exit points below the current chart (1 = buy, 2 = sell)
- Ideally, test the settings with a backtesting script. The present script is compatible with the Trading Parrot's backtester.
- When happy, right click on the "..." next to the study name, then "Add alert'".
- Under "Condition", on the second line, chose "Any alert () function call". Add the webhook from 3commas, give it a name, and "create".
Happy tweaking!

"The Arty" - The Moving Average Official Indicator█ OVERVIEW
This indicator was inspired by Arty. I've taken what he teaches and have applied the tools that he uses into one useful indicator.
█ COMPONENTS
Here is a brief overview of the indicator:
Smoothed Moving Averages
Arty uses three main smoothed moving averages and on occasion a fourth. All of the moving averages are customizable by color, length, and timeframe.
1 — 21 SMMA - this is the white moving average closest to price and is the first part of our small cloud.
2 — 50 SMMA - this is the green moving average and is the second part of or small cloud.
3 — 100 SMMA - this is the optional moving average and is only used occasionally in Arty's teachings.
4 — 200 SMMA - this is our final moving average and is part of our larger cloud. It also have a dynamic color feature that will show, on a micro level, who is currently in control of the market short term.
Moving Average Clouds
You have a few options when it comes to the moving average clouds.
1 — Small cloud solid color - this is a simple cloud to help visualize the current trend.
2 — Small dynamic - this cloud helps you see who is currently in control of the market and helps you make timely trade entry and exit decisions based on other confluences.
3 — Large solid cloud - this cloud spans from the 200 moving average all the way to price action. This is to help quickly gauge market direction.
Candlestick Patterns
Currently there are two candlestick patterns that are monitored and set alerts for. Alerts can be set for bullish or bearish as well as an alert when these patterns are combined.
1 — "Big Ass Candles" aka Engulfing Candles - You can select bullish , bearish , both, or hide them.
2 — 3 Line Strike - This is a reversal pattern that you can again select bullish , bearish , both, or hide them.
Trade Management
This is a tool to help with setting your stop loss, break even, and target levels. Currently you can set these based on the current ATR. In next update, you will also have the option to use pips/points.
Backtesting
This allows you to plot your trading sessions on the chart so while backtesting, you are only testing the sessions that you actually trade. It makes no sense to backtest a trading session that you do not regularly trade.
888 BOT #alerts█ 888 BOT #alerts
This is an Expert Advisor 'EA' or Automated trading script for ‘longs’ and ‘shorts’, which uses only a Take Profit or, in the worst case, a Stop Loss to close the trade.
It's a much improved version of the previous ‘Repanocha’. It doesn`t use 'Trailing Stop' or 'security ()' functions (although using a security function doesn`t mean that the script repaints) and all signals are confirmed, therefore the script doesn`t repaint in alert mode and is accurate in backtest mode.
Apart from the previous indicators, some more and other functions have been added for Stop-Loss, re-entry and leverage.
It uses 8 indicators, (many of you already know what they are, but in case there is someone new), these are the following:
1. Jurik Moving Average
It's a moving average created by Mark Jurik for professionals which eliminates the 'lag' or delay of the signal. It's better than other moving averages like EMA, DEMA, AMA or T3.
There are two ways to decrease noise using JMA. Increasing the 'LENGTH' parameter will cause JMA to move more slowly and therefore reduce noise at the expense of adding 'lag'
The 'JMA LENGTH', 'PHASE' and 'POWER' parameters offer a way to select the optimal balance between 'lag' and over boost.
Green: Bullish, Red: Bearish.
2. Range filter
Created by Donovan Wall, its function is to filter or eliminate noise and to better determine the price trend in the short term.
First, a uniform average price range 'SAMPLING PERIOD' is calculated for the filter base and multiplied by a specific quantity 'RANGE MULTIPLIER'.
The filter is then calculated by adjusting price movements that do not exceed the specified range.
Finally, the target ranges are plotted to show the prices that will trigger the filter movement.
Green: Bullish, Red: Bearish.
3. Average Directional Index (ADX Classic) and (ADX Masanakamura)
It's an indicator designed by Welles Wilder to measure the strength and direction of the market trend. The price movement is strong when the ADX has a positive slope and is above a certain minimum level 'ADX THRESHOLD' and for a given period 'ADX LENGTH'.
The green color of the bars indicates that the trend is bullish and that the ADX is above the level established by the threshold.
The red color of the bars indicates that the trend is down and that the ADX is above the threshold level.
The orange color of the bars indicates that the price is not strong and will surely lateralize.
You can choose between the classic option and the one created by a certain 'Masanakamura'. The main difference between the two is that in the first it uses RMA () and in the second SMA () in its calculation.
4. Parabolic SAR
This indicator, also created by Welles Wilder, places points that help define a trend. The Parabolic SAR can follow the price above or below, the peculiarity that it offers is that when the price touches the indicator, it jumps to the other side of the price (if the Parabolic SAR was below the price it jumps up and vice versa) to a distance predetermined by the indicator. At this time the indicator continues to follow the price, reducing the distance with each candle until it is finally touched again by the price and the process starts again. This procedure explains the name of the indicator: the Parabolic SAR follows the price generating a characteristic parabolic shape, when the price touches it, stops and turns (SAR is the acronym for 'stop and reverse'), giving rise to a new cycle. When the points are below the price, the trend is up, while the points above the price indicate a downward trend.
5. RSI with Volume
This indicator was created by LazyBear from the popular RSI.
The RSI is an oscillator-type indicator used in technical analysis and also created by Welles Wilder that shows the strength of the price by comparing individual movements up or down in successive closing prices.
LazyBear added a volume parameter that makes it more accurate to the market movement.
A good way to use RSI is by considering the 50 'RSI CENTER LINE' centerline. When the oscillator is above, the trend is bullish and when it is below, the trend is bearish.
6. Moving Average Convergence Divergence (MACD) and (MAC-Z)
It was created by Gerald Appel. Subsequently, the histogram was added to anticipate the crossing of MA. Broadly speaking, we can say that the MACD is an oscillator consisting of two moving averages that rotate around the zero line. The MACD line is the difference between a short moving average 'MACD FAST MA LENGTH' and a long moving average 'MACD SLOW MA LENGTH'. It's an indicator that allows us to have a reference on the trend of the asset on which it is operating, thus generating market entry and exit signals.
We can talk about a bull market when the MACD histogram is above the zero line, along with the signal line, while we are talking about a bear market when the MACD histogram is below the zero line.
There is the option of using the MAC-Z indicator created by LazyBear, which according to its author is more effective, by using the parameter VWAP (volume weighted average price) 'Z-VWAP LENGTH' together with a standard deviation 'STDEV LENGTH' in its calculation.
7. Volume Condition
Volume indicates the number of participants in this war between bulls and bears, the more volume the more likely the price will move in favor of the trend. A low trading volume indicates a lower number of participants and interest in the instrument in question. Low volumes may reveal weakness behind a price movement.
With this condition, those signals whose volume is less than the volume SMA for a period 'SMA VOLUME LENGTH' multiplied by a factor 'VOLUME FACTOR' are filtered. In addition, it determines the leverage used, the more volume, the more participants, the more probability that the price will move in our favor, that is, we can use more leverage. The leverage in this script is determined by how many times the volume is above the SMA line.
The maximum leverage is 8.
8. Bollinger Bands
This indicator was created by John Bollinger and consists of three bands that are drawn superimposed on the price evolution graph.
The central band is a moving average, normally a simple moving average calculated with 20 periods is used. ('BB LENGTH' Number of periods of the moving average)
The upper band is calculated by adding the value of the simple moving average X times the standard deviation of the moving average. ('BB MULTIPLIER' Number of times the standard deviation of the moving average)
The lower band is calculated by subtracting the simple moving average X times the standard deviation of the moving average.
the band between the upper and lower bands contains, statistically, almost 90% of the possible price variations, which means that any movement of the price outside the bands has special relevance.
In practical terms, Bollinger bands behave as if they were an elastic band so that, if the price touches them, it has a high probability of bouncing.
Sometimes, after the entry order is filled, the price is returned to the opposite side. If price touch the Bollinger band in the same previous conditions, another order is filled in the same direction of the position to improve the average entry price, (% MINIMUM BETTER PRICE ': Minimum price for the re-entry to be executed and that is better than the price of the previous position in a given %) in this way we give the trade a chance that the Take Profit is executed before. The downside is that the position is doubled in size. 'ACTIVATE DIVIDE TP': Divide the size of the TP in half. More probability of the trade closing but less profit.
█ STOP LOSS and RISK MANAGEMENT.
A good risk management is what can make your equity go up or be liquidated.
The % risk is the percentage of our capital that we are willing to lose by operation. This is recommended to be between 1-5%.
% Risk: (% Stop Loss x % Equity per trade x Leverage) / 100
First the strategy is calculated with Stop Loss, then the risk per operation is determined and from there, the amount per operation is calculated and not vice versa.
In this script you can use a normal Stop Loss or one according to the ATR. Also activate the option to trigger it earlier if the risk percentage is reached. '% RISK ALLOWED' wich is calculated according with: '%EQUITY ON EACH ENTRY'. Only works with Stop Loss on 'NORMAL' or 'BOTH' mode.
'STOP LOSS CONFIRMED': The Stop Loss is only activated if the closing of the previous bar is in the loss limit condition. It's useful to prevent the SL from triggering when they do a ‘pump’ to sweep Stops and then return the price to the previous state.
█ ALERTS
There is an alert for each leverage, therefore a maximum of 8 alerts can be set for 'long' and 8 for 'short', plus an alert to close the trade with Take Profit or Stop Loss in market mode. You can also place Take Profit limit and Stop Loss limit orders a few seconds after filling the position entry order.
- 'MAXIMUM LEVERAGE': It is the maximum allowed multiplier of the % quantity entered on each entry for 1X according to the volume condition.
- 'ADVANCE ALERTS': There is always a time delay from when the alert is triggered until it reaches the exchange and can be between 1-15 seconds. With this parameter, you can advance the alert by the necessary seconds to activate it earlier. In this way it can be synchronized with the exchange so that the execution time of the entry order to the position coincides with the opening of the bar.
The settings are for Bitcoin at Binance Futures (BTC: USDTPERP) in 30 minutes.
For other pairs and other timeframes, the settings have to be adjusted again. And within a month, the settings will be different because we all know the market and the trend are changing.
█ 888 BOT (SPANISH)
Este es un Expert Advisor 'EA' o script de trading automatizado para ‘longs’ y ‘shorts’, el cual, utiliza solo un Take Profit o, en el peor de los casos, un Stop Loss para cerrar el trade.
Es una versión muy mejorada del anterior ‘Repanocha’. No utiliza ‘Trailing Stop’, ni funciones ‘security()’ (aunque usar una función security no significa que el script repinte) y todas las señales son confirmadas, por consiguiente, el script no repinta en modo alertas y es preciso en en el modo backtest.
Aparte de los anteriores indicadores se han añadido algunos más y otras funciones para Stop-Loss, de re-entrada y apalancamiento.
Utiliza 8 indicadores, (muchos ya sabéis sobradamente lo que son, pero por si hay alguien nuevo), son los siguientes:
1. Jurik Moving Average
Es una media móvil creada por Mark Jurik para profesionales la cual elimina el ‘lag’ o retardo de la señal. Es mejor que otras medias móviles como la EMA, DEMA, AMA o T3.
Hay dos formas de disminuir el ruido utilizando JMA. El aumento del parámetro 'LENGTH' hará que JMA se mueva más lentamente y, por lo tanto, reducirá el ruido a expensas de añadir ‘lag’
Los parámetros 'JMA LENGTH', 'PHASE' y 'POWER' ofrecen una forma de seleccionar el equilibrio óptimo entre ‘lag’ y sobre impulso.
Verde : Alcista, Rojo: Bajista.
2. Range filter
Creado por Donovan Wall, su función es la de filtrar o eliminar el ruido y poder determinar mejor la tendencia del precio a corto plazo.
Primero, se calcula un rango de precio promedio uniforme 'SAMPLING PERIOD' para la base del filtro y se multiplica por una cantidad específica 'RANGE MULTIPLIER'.
A continuación, el filtro se calcula ajustando los movimientos de precios que no exceden el rango especificado.
Por último, los rangos objetivo se trazan para mostrar los precios que activarán el movimiento del filtro.
Verde : Alcista, Rojo: Bajista.
3. Average Directional Index (ADX Classic) y (ADX Masanakamura)
Es un indicador diseñado por Welles Wilder para medir la fuerza y dirección de la tendencia del mercado. El movimiento del precio tiene fuerza cuando el ADX tiene pendiente positiva y está por encima de cierto nivel mínimo 'ADX THRESHOLD' y para un periodo dado 'ADX LENGTH'.
El color verde de las barras indica que la tendencia es alcista y que el ADX está por encima del nivel establecido por el threshold.
El color Rojo de las barras indica que la tendencia es bajista y que el ADX está por encima del nivel de threshold.
El color naranja de las barras indica que el precio no tiene fuerza y seguramente lateralizará.
Se puede elegir entre la opción clásica y la creada por un tal 'Masanakamura'. La diferencia principal entre los dos es que en el primero utiliza RMA() y en el segundo SMA() en su cálculo.
4. Parabolic SAR
Este indicador, creado también por Welles Wilder, coloca puntos que ayudan a definir una tendencia. El Parabolic SAR puede seguir al precio por encima o por debajo, la particularidad que ofrece es que cuando el precio toca al indicador, este salta al otro lado del precio (si el Parabolic SAR estaba por debajo del precio salta arriba y viceversa) a una distancia predeterminada por el indicador. En este momento el indicador vuelve a seguir al precio, reduciendo la distancia con cada vela hasta que finalmente es tocado otra vez por el precio y se vuelve a iniciar el proceso. Este procedimiento explica el nombre del indicador: el Parabolic SAR va siguiendo al precio generando una característica forma parabólica, cuando el precio lo toca, se para y da la vuelta (SAR son las siglas en inglés de ‘stop and reverse’), dando lugar a un nuevo ciclo. Cuando los puntos están por debajo del precio, la tendencia es alcista, mientras que los puntos por encima del precio indica una tendencia bajista.
5. RSI with Volume
Este indicador lo creo un tal LazyBear de TV a partir del popular RSI.
El RSI es un indicador tipo oscilador utilizado en análisis técnico y creado también por Welles Wilder que muestra la fuerza del precio mediante la comparación de los movimientos individuales al alza o a la baja de los sucesivos precios de cierre.
LazyBear le añadió un parámetro de volumen que lo hace más preciso al movimiento del mercado.
Una buena forma de usar el RSI es teniendo en cuenta la línea central de 50 'RSI CENTER LINE'. Cuando el oscilador está por encima, la tendencia es alcista y cuando está por debajo la tendencia es bajista.
6. Moving Average Convergence Divergence (MACD) y (MAC-Z)
Fue creado por Gerald Appel. Posteriormente se añadió el histograma para anticipar el cruce de medias. A grandes rasgos podemos decir que el MACD es un oscilador consistente en dos medias móviles que van girando en torno a la línea de cero. La línea del MACD no es más que la diferencia entre una media móvil corta 'MACD FAST MA LENGTH' y una media móvil larga 'MACD SLOW MA LENGTH'. Es un indicador que nos permite tener una referencia sobre la tendencia del activo sobre el cual se está operando, generando de este modo señales de entrada y salida del mercado.
Podemos hablar de mercado alcista cuando el histograma del MACD se sitúe por encima de la línea cero, junto con la línea de señal, mientras que hablaremos de mercado bajista cuando el histograma MACD se situará por debajo de la línea cero.
Está la opción de utilizar el indicador MAC-Z creado por LazyBear que según su autor es más eficaz, por utilizar el parámetro VWAP (precio medio ponderado por volumen) 'Z-VWAP LENGTH' junto con una desviación standard 'STDEV LENGTH' en su cálculo.
7. Volume Condition
El volumen indica el número de participantes en esta guerra entre toros y osos, cuanto más volumen más probabilidad de que se mueva el precio a favor de la tendencia. Un volumen bajo de negociación indica un menor número de participantes e interés por el instrumento en cuestión. Los bajos volúmenes pueden revelar debilidad detrás de un movimiento de precios.
Con esta condición se filtran aquellas señales cuyo volumen es inferior a la SMA de volumen para un periodo 'SMA VOLUME LENGTH' multiplicado por un factor 'VOLUME FACTOR'. Además, determina el apalancamiento utilizado, a más volumen, más participantes, más probabilidad de que se mueva el precio a nuestro favor, es decir, podemos utilizar más apalancamiento. El apalancamiento en este script lo determina las veces que está el volumen por encima de la línea de la SMA.
El apalancamiento máximo es de 8.
8. Bollinger Bands
Este indicador fue creado por John Bollinger y consiste en tres bandas que se dibujan superpuestas al gráfico de evolución del precio.
La banda central es una media móvil, normalmente se emplea una media móvil simple calculada con 20 períodos. ('BB LENGTH' Número de periodos de la media móvil)
La banda superior se calcula sumando al valor de la media móvil simple X veces la desviación típica de la media móvil. ('BB MULTIPLIER' Número de veces la desviación típica de la media móvil)
La banda inferior de calcula restando a la media móvil simple X veces la desviación típica de la media móvil.
la franja comprendida entre las bandas superior e inferior contiene, estadísticamente, casi un 90% de las posibles variaciones del precio, lo que significa que cualquier movimiento del precio fuera de las bandas tiene especial relevancia.
En términos prácticos, las bandas de Bollinguer se comporta como si de una banda elástica se tratara de manera que, si el precio las toca, éste tiene mucha probabilidad de rebotar.
En ocasiones, después de rellenarse la orden de entrada, el precio se devuelve hacia el lado contrario. Si toca la banda de Bollinger se rellena otra orden en la misma dirección de la posición para mejorar el precio medio de entrada, (% MINIMUM BETTER PRICE': Precio mínimo para que se ejecute la re-entrada y que sea mejor que el precio de la posición anterior en un % dado) de esta manera damos una oportunidad al trade de que el Take Profit se ejecute antes. La desventaja es que se dobla el tamaño de la posición. 'ACTIVATE DIVIDE TP': Divide el tamaño del TP a la mitad. Más probabilidad de que se cierre el trade pero menos ganancias.
█ STOP LOSS y RISK MANAGEMENT.
Una buena gestión de las pérdidas o gestión del riesgo es lo que puede hacer que tu cuenta suba o se liquide en poco tiempo.
El % de riesgo es el porcentaje de nuestro capital que estamos dispuestos a perder por operación. Este se aconseja que debe estar comprendido entre un 1-5%.
% Risk = (% Stop Loss x % Equity per trade x Leverage) / 100
Primero se calcula la estrategia con Stop Loss, después se determina el riesgo por operación y a partir de ahí se calcula el monto por operación y no al revés.
En este script puedes usar un Stop Loss normal o uno según el ATR. También activar la opción de que salte antes si se alcanza el porcentaje de riesgo. '% RISK ALLOWED' que se calcula según el porcentaje de tu capital para 1X '% EQUITY ON EACH ENTRY'.
'STOP LOSS CONFIRMED': Solamente se activa el Stop Loss si el cierre de la barra anterior se encuentra en la condición de límite de pérdidas. Es útil para evitar que se dispare el SL cuando hacen un ‘pump’ para barrer Stops y luego se devuelve el precio a la normalidad.
█ ALERTAS
Hay una alerta por cada apalancamiento por consiguiente como máximo se pueden poner 8 alertas para 'long' y 8 para 'short', más una alerta para cerrar el trade con Take Profit o Stop Loss en modo market. Tambien puedes colocar las ordenes Take Profit limit y Stop Loss limit unos segundos despues de rellenar la orden de entrada de la posición.
- 'MAXIMUM LEVERAGE': Es el máximo multiplicador permitido de la cantidad introducida para 1X según la condición de volumen.
- 'ADVANCE ALERTS': Siempre existe un retardo de tiempo desde que se activa la alerta hasta que llega al exchange y que puede ser de entre 1-15 segundos. Con este párametro se puede adelantar la alerta los segundos necesarios para que se active antes. De este modo se puede sincronizar con el exchange para que el tiempo de ejecución de la orden de entrada a la posición coincida con la de apertura de la barra.
Los settings son para Bitcoin en Binance Futures (BTC:USDTPERP) en 30 minutos.
Para otro pares y otras temporalidades se tienen que ajustar las opciones de nuevo. Además para dentro de un mes, los ajustes serán otros distintos ya que el mercado y la tendencia es cambiante.

[ALERTS] CMYK-RMI-SMA
▼ This is the study version of the script, For usage with Autoview
◊ Introduction
This script makes use of three RMI's and SMA's, that indicate Overbought/Oversold on different Periods that correspond with Frequency’s that move the market.
◊ Origin
This is an update on █▓▒░ CMYK ♦ RMI ♦ TRIPLE ░▒▓█
◊ Usage
This script is intended for Automated Trading on the 1-5 minute chart.
◊ Features Summary
Two Part Indicator
Strategy Type Selection
Three RMI's SMA's
Trend adjustment
Pump/Dump Entry Delay
Pyramiding
Ignore first entries
Take Profit
Interval between Entries
Multiring Fix
Alert signal Seperation
◊ Community
Wanna try this script out ? need help resolving a problem ?
CMYK :: discord.gg
AUTOVIEW :: discordapp.com
TRADINGVIEW UNOFFICIAL :: discord.gg
◊ Setting up Autoview Alerts
Use the study version of this script, To set up The Alerts Autoview Picks up on.
Goto the CMYK Discord for support and Settings.
◊ Backtesting
Use the strategy version of this script for backtesting.
◊ Contact
Wanna try this script out ? need help resolving a problem ?
CMYK :: discord.gg
HAPPY TRADES!!!

CMYK RMI SMA Study For Autoview▼ This is the study version of the script, For usage with Autoview
◊ Introduction
This script makes use of three RMI's and SMA's, that indicate Overbought/Oversold on different Periods that correspond with Frequency’s that move the market.
◊ Origin
This is an update on █▓▒░ CMYK ♦ RMI ♦ TRIPLE ░▒▓█
◊ Usage
This script is intended for Automated Trading on the 1-5 minute chart.
◊ Features Summary
Two Part Indicator
Strategy Type Selection
Three RMI's SMA's
Trend adjustment
Pump/Dump Entry Delay
Pyramiding
Ignore first entries
Take Profit
Stop Loss
Interval between Entries
Multiring Fix
Alert signal Seperation
◊ Community
Wanna try this script out ? need help resolving a problem ?
CMYK :: discord.gg
AUTOVIEW :: discordapp.com
TRADINGVIEW UNOFFICIAL :: discord.gg
◊ Setting up Autoview Alerts
Use the study version of this script, To set up The Alerts Autoview Picks up on.
Goto the CMYK Discord for support and Settings.
◊ Backtesting
Use the strategy version of this script for backtesting.
◊ Contact
Wanna try this script out ? need help resolving a problem ?
CMYK :: discord.gg
CMYK RMI TRIPLE Automated study for Autoview▼ This is the study version of the script, For usage with Autoview
◊ Introduction
This script makes use of three RMI 's, that indicate Overbought/Oversold on different timescales that correspond with Frequency’s that move the market.
◊ Origin
The Relative Momentum Index was developed by Roger Altman and was introduced in his article in the February, 1993 issue of Technical Analysis of Stocks & Commodities magazine.
While RSI counts up and down ticks from close to close, the Relative Momentum Index counts up and down ticks from the close relative to a close x number of days ago.
This results in an RSI that is smoother, and has another setting for fine tuning results.
This bot originated out of Project XIAM , an investigative script that outlined my approach towards Automated Trading Strategies.
Are you interested in writing bots yourself ? check out the beta version of this script.
It has many bugs, but also most of the Skeleton.
◊ Usage
This script is intended for Automated Trading with AUTOVIEW or TVAUTOTRADER , on the 1 minute chart.
◊ Features Summary
Overlay Mode
Indicator Mode
Three RMI's
Trend adjustment
Pyramiding
Ignore first entries
Take Profit
Stop Loss
Interval between Entries
Multiring Fix
Alert signal Seperation
◊ Community
Wanna try this script out ? need help resolving a problem ?
CMYK :: discord.gg
AUTOVIEW :: discordapp.com
TRADINGVIEW UNOFFICIAL :: discord.gg
◊ Setting up Autoview Alerts
Use the study version of this script, To set up The Alerts Autoview Picks up on.
The Signals to work with are :
Open 1 Long
Use this to open one Long Position.
With quantity being : /
Once per bar
Being larger than 0
Comment example : e=exchange b=long q=amount t=market
Open 1 Short
Use this to open one Short Position.
With quantity being : /
Once per bar
Being larger than 0
Comment example : e=exchange b=short q=amount t=market
Close1 Position
Use this to Close The amount of one Open Position.
With quantity* being : /
Once per bar
Being larger than 0
Comment example : e=exchange c=position q=amount t=market
*Beware when using a percental % quantity, instead of an absolute quantity.
Percental Quantities are based on the , Not
And will change in absolute value relative to the amount of open trades.
Close All positions
Use this to Close All Open Positions.
With quantity being :
Once per bar
Being larger than 0
Comment example : e=exchange c=position t=market
For the specific Syntax used in the comment of the alert, visit Autoview .
◊ Setting up TVAutotrader
Use the strategy version of this script, And load it into TVAT .
◊ Backtesting
Use the strategy version of this script for backtesting.
◊ Contact
Wanna try this script out ? need help resolving a problem ?
CMYK :: discord.gg
Crypto Money Trader - Indicator for Buy and Sell SignalsThis is it... the one that many have been waiting for.
We have taken everything we have learned from the Crypto Money Index and Crypto Money Bot and combined it into the best indicator possible for trading crypto currencies. This version also includes logic for shorts (sell) and another criteria for longs (buys).
The code is cleaner as well so there is less signal noise and more precise entries.
Before we released this script, we did backtesting on all the current supported USD pairs for optimal results.
Here is one set of results for BTC on 2 hour chats using $5,000 starting balance, 1 trade at once maximum, and 1 contract size:
www.cryptosignalsbot.com
Net Profit: $25,582, 511.64%
Total Trades: 17
Percent Profitable: 70.59%
Profit Factor: 4.304
Maximum Downdraw: $6,629
AvgTrade: $1,504.82, 30.1%
These results get even crazier when you get into settings where you can have 4 trades at once - beyond 700% return... crazy...
The indicator also includes alerts that you can setup so you are aware when a Buy or Sell signal is triggered. Just set an indicator alert for the Trigger Buy or Trigger Sell greater then a value of 0 and you will always know when it is time to look at the charts.
--== STRATEGY ==--
You can combine this indicator with other indicators in your strategy. Many of our most successful users of our previous scripts do just that as it helps them tune a perfect time for an entry.
Personally, we use the indicator and simple trendline entries. When a Buy or Sell triggers, draw a trendline and support / resistance lines and enter on a breakout. That's it.
Please note: this is not a "buy it or sell it now" kind of indicator. Sometimes it will signal a few hours early before a move.
--== SUPPORTED PAIRS ==--
We are always adding pairs, but as of February, 2018 this is our supported USD based pairs: BTC, ETH, LTC, XRP, NEO, BCH, IOT, EOS, BTG, ETC, ETP, OMG, EDO, ZEC, XMR, TRX, SAN, DSH, SNG
--== TELEGRAM CHANNEL ==--
All subscribers to this indicator will get access to our Exclusive Telegram Group where all the signals are analyzed and posted for you to see how we are playing the calls. You can either use this to learn how we use the indicator, or to trade from (at your own risk of course).
The alerts are all posted in this channel automatically and only the timeframes with the highest returns from extensive backtests are posted here automatically. However, we will sometimes post analysis on other timeframes as well.
--== BONUS ==--
As a subscriber, not only do you get this amazing indicator, but as a subscriber you will get access to our Crypto Money Index and the Crypto Money Bot
--== ACCESS ==--
Access is simple, go to our new website and register: Crypto Signals Bot
We will work to get you access to everything as quickly as possible. If you have any issues or questions, use the contact form on the website.
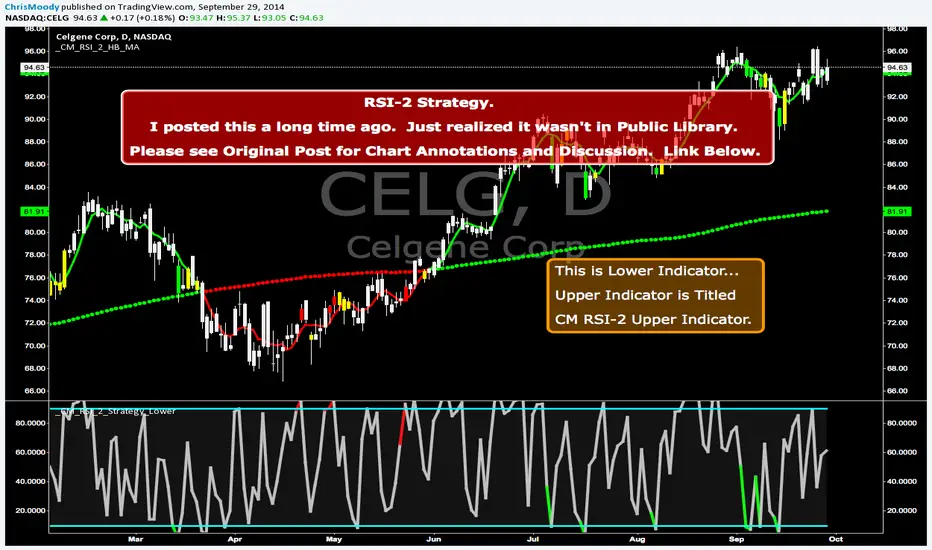
CM RSI-2 Strategy Lower IndicatorRSI-2 Strategy
***At the bottom of the page is a link where you can download the PDF of the Backtesting Results.
This year I am focusing on learning from two of the best mentors in the Industry with outstanding track records for Creating Systems, and learning the what methods actually work as far as back testing.
I came across the RSI-2 system that Larry Connors developed. Larry has become famous for his technical indicators, but his RSI-2 system is what actually put him “On The Map” per se. At first glance I didn’t think it would work well, but I decided to code it and ran backtests on the S&P 100 In Down Trending Markets, Up Trending Markets, and both combined. I was shocked by the results. So I thought I would provide them for you. I also ran a test on the Major forex Pairs (12) for the last 5 years, and All Forex Pairs (80) from 11/28/2007 - 6/09/2014, impressive results also.
The RSI-2 Strategy is designed to use on Daily Bars, however it is a short term trading strategy. The average length of time in a trade is just over 2 days. But the results CRUSH the general market averages.
Detailed Description of Indicators, Rules Below:
Link For PDF of Detailed Trade Results
d.pr
Original Post
CM RSI-2 Strategy - Upper Indicators.RSI-2 Strategy
***At the bottom of the page is a link where you can download the PDF of the Backtesting Results.
This year I am focusing on learning from two of the best mentors in the Industry with outstanding track records for Creating Systems, and learning the what methods actually work as far as back testing.
I came across the RSI-2 system that Larry Connors developed. Larry has become famous for his technical indicators, but his RSI-2 system is what actually put him “On The Map” per se. At first glance I didn’t think it would work well, but I decided to code it and ran backtests on the S&P 100 In Down Trending Markets, Up Trending Markets, and both combined. I was shocked by the results. So I thought I would provide them for you. I also ran a test on the Major forex Pairs (12) for the last 5 years, and All Forex Pairs (80) from 11/28/2007 - 6/09/2014, impressive results also.
The RSI-2 Strategy is designed to use on Daily Bars, however it is a short term trading strategy. The average length of time in a trade is just over 2 days. But the results CRUSH the general market averages.
Detailed Description of Indicators, Rules Below:
Link For PDF of Detailed Trade Results
d.pr
Original Post

MACD ultimate with EMA overrideOverview
This Pine Script v5 indicator combines MACD zero-cross signals, SuperTrend trend validation, an EMA(50/200) trend filter and an EMA-crossover override to produce clean, session-constrained entry signals and robust exit logic. It draws labels and lines on the chart (entries, exits, SL lines) and supports alerts. Stop-losses use percentage-based sizing and are evaluated on bar close only to avoid intrabar noise.
Key features
Primary entry rule (MACD zero-cross):
Buy when MACD line crosses above zero (current bar MACD > 0 and previous bar MACD < 0).
Sell when MACD line crosses below zero (current bar MACD < 0 and previous bar MACD > 0).
Session-only entries: Entries are generated only inside a user-defined session (e.g., 09:30-11:30). Exits are evaluated at all times.
SuperTrend validation: Optional SuperTrend filter for entries and exits. Can be configured so exits require both MACD exit and SuperTrend flip (AND mode) or use OR mode.
EMA trend filter for entries: Optional EMA(50) vs EMA(200) filter — when enabled the indicator will only open buys in EMA-up trend and sells in EMA-down trend.
EMA crossover override (priority rule): If EMA fast crosses the slow:
EMA50 crosses above EMA200 → forced BUY override (bypasses session, SuperTrend, MACD). Exits any active short and opens long.
EMA50 crosses below EMA200 → forced SELL override (bypasses other validations). Exits any active long and opens short.
Overrides respect same-direction protection (won’t reopen an existing same-side position).
Opposite-entry immediate exit: When an opposite-direction raw entry (MACD zero-cross) occurs, any active opposite trade is exited immediately (then the script may open the opposite entry subject to entry validation). Same-direction repeated signals do not force an exit.
Stop-Loss (percentage): Parameterized SL (%) applied at entry; SL is checked and triggered only on bar close (e.g., long SL triggers if barstate.isconfirmed and close <= SL).
Labels & SL lines: Single-line, non-repainting labels for entries/exits; SL horizontal line drawn on open positions and greys out after closing.
Plots & visuals:
MACD panel (histogram, MACD, signal) optional.
SuperTrend plotted as a single color-coded line: green for bullish, red for bearish (no dots).
Optional EMA( fast / slow ) plots.
Entry markers (triangles) shown only for session-filtered entries.
Alerts: Entry and exit alerts are included and can be toggled on/off.
Inputs (high level)
MACD: fast, slow, signal lengths.
SL (%) and toggle to enable/disable SL.
SuperTrend: ATR length, multiplier; toggles: require for entry, allow/require for exit, show/hide.
EMA trend: enable/disable filter; fast/slow lengths; show/hide EMAs.
EMA override (built-in) — crossover detection triggers forced entry/exit.
Session: time range (HHMM-HHMM) — applies to entry generation only.
Misc: allow multiple entries flag, enable alerts, show/hide MACD panel.
Behavioral notes & caveats
The indicator is an overlay indicator (not a strategy()), so it draws visual signals and alerts but does not place real trades — use strategy() conversion to backtest trade P&L.
EMA override bypasses all validations by design — it forcibly exits the opposite side and opens the override side immediately (on the same bar). This is intentional to capture major trend flips.
SL is checked on bar close only. That reduces false SL triggers from intrabar spikes but means realized fills can differ in live trading depending on execution and slippage.
Opposite-entry exits are immediate (no SuperTrend/MACD requirement) except when a crossover override is the cause — the script guards so EMA overrides take precedence.
Pine Script runs on bar close for most accurate signals; intrabar behavior depends on your chart settings (realtime vs historical) — expect small differences between indicator labels and broker fills.
Plot/label density: many labels and SL lines can clutter the chart on lower timeframes. Consider hiding SL lines after N bars (optional enhancement) or use higher timeframe charts for less clutter.
Suggested default settings
MACD: 12, 26, 9
SL: 1.0 (%) with Use SL = on
SuperTrend: ATR 10, Multiplier 3.0, require for entry = true, require for exit = true (AND mode)
EMA trend filter: enabled (50/200)
Session: 0930-1130 (adjust to your exchange/timezone)
Alerts: on
How to use
Paste the full Pine v5 script into TradingView’s Pine Editor and add to chart.
Set the trade_session to the market hours you want entries in (chart timezone should match your intended exchange).
Toggle Use EMA trend / Require SuperTrend / Require ST for exit depending on how tight you want validation.
Use strategy() conversion before backtesting to verify the rules produce acceptable historical returns (indicator-only won’t generate P&L).
Recommended next steps
Convert to a strategy() script to backtest and measure win rate, drawdown, profit factor, and to validate the SL-on-close logic with realistic fills.
Add an input to auto-hide SL lines after N bars or compress labels to a compact trade status box.
Consider adding ATR- or volatility-based SL as an alternative to percentage SL.

Institutional Dominance/Trapped Trader Profile @MaxMaserati 3.0📊 Institutional Dominance & Trapped Trader Delta Profile
@MaxMaserati 3.0
═════════════════════════════════════════════════════════════
🎯 OVERVIEW
The IDT Auction Profile is a professional-grade volume order flow analysis tool that reveals where institutional traders hold Positional Advantage and where retail participants are Trapped. Unlike traditional Volume Profile indicators, the IDT Profile integrates Volume Point Delta (VPD) analysis with advanced pattern recognition to identify the exact price levels where profitable institutional positions create support/resistance, and where losing positions are forced to exit.
This indicator answers the critical questions: Who is in profit? Who is trapped? And where will they defend or exit their positions?
═════════════════════════════════════════════════════════════
✨ FEATURES
═════════════════════════════════════════════════════════════
⚡ Quick Presets - One-click configuration for:
• Scalper (1m-5m): 75 bars, 50 rows, ★3 confluence
• Day Trader (15m-1h): 150 bars, 60 rows, ★3 confluence
• Swing Trader (4h-D): 300 bars, 80 rows, ★4 confluence
🔔 Price Alerts - Get notified when price touches:
• VAH (Value Area High) - Resistance zone
• VAL (Value Area Low) - Support zone
• Adjustable sensitivity (0.05% - 1.0%)
📏 POC Line Extensions - Historical context lines extending left from key institutional levels
👻 Previous Session POCs - Dotted reference lines showing prior period levels (carry-over zones)
📊 Real-Time Statistics Panel:
• Total Volume
• Net Delta
• Buy/Sell Pressure %
🎨 Visual Enhancements:
• Column dividers for clarity
• Transparency controls
• Profile auto-hide when price moves away
• Cached color schemes for 30% performance boost
═════════════════════════════════════════════════════════════
🧠 CORE CONCEPT: DOMINANCE VS TRAPPED POSITIONING
═════════════════════════════════════════════════════════════
The indicator categorizes all market participants into two strategic positions based on their entry price relative to current market price:
📍 ABOVE CURRENT PRICE (Resistance Zones)
🔴 Aggressive Sellers in Profit - Sold higher, currently winning. Will defend positions or add to winners.
🟥 Trapped Buyers at Loss - Bought higher, currently losing. Must exit at breakeven, creating resistance.
📍 BELOW CURRENT PRICE (Support Zones)
🟢 Aggressive Buyers in Profit - Bought lower, currently winning. Will defend positions or add to winners.
🟩 Trapped Sellers at Loss - Sold lower, currently losing. Must cover at breakeven, creating support.
⚡ MAXIMUM CONFLUENCE ZONES
When Dominant (Profitable) and Trapped (Loss) positions align at the same level, you get the strongest support/resistance zones:
🟧 Orange Boxes (Above Price) = Aggressive Sellers + Trapped Buyers = STRONGEST RESISTANCE
🟨 Yellow Boxes (Below Price) = Aggressive Buyers + Trapped Sellers = STRONGEST SUPPORT
═════════════════════════════════════════════════════════════
📊 VOLUME ANALYSIS COLUMNS
═════════════════════════════════════════════════════════════
1️⃣ VPD Column (Volume Point Delta)
Net aggressive pressure at each price level (Buying Volume - Selling Volume)
- Bullish Delta (Green): Buyers dominated the auction at this level
- Bearish Delta (Red): Sellers dominated the auction at this level
- Smart Coloring: Automatically highlights institutional patterns
2️⃣ VPS Column (Volume Point of Sell - ASK Volume)
Aggressive buying volume that "lifted the offer" by hitting ask prices
- Represents participants who paid the ask price to enter long
- When price is below this level = These buyers are in profit
- When price is above this level = These sellers who got hit are in profit
- Shows institutional bid volume absorption
3️⃣ VPB Column (Volume Point of Buy - BID Volume)
Aggressive selling volume that "hit the bid" by taking bid prices
- Represents participants who sold at bid price to enter short
- When price is above this level = These sellers are in profit
- When price is below this level = These buyers who got hit are in profit
- Shows institutional ask volume absorption
4️⃣ SVP Column (Optional - Session Volume Profile)
Traditional combined volume profile without bid/ask separation
═════════════════════════════════════════════════════════════
🔍 ADVANCED INSTITUTIONAL PATTERNS DETECTION
═════════════════════════════════════════════════════════════
The indicator uses statistical analysis (standard deviation, moving averages, hit counting) to identify institutional footprints:
⚡ Failed Auctions - "BUYERS TRAPPED" or "SELLERS TRAPPED" labels
• High volume entered, but price immediately reversed
• Creates extreme concentrations of losing positions
• Trading Implication: High-probability reversal zones where trapped participants must exit
📈 Volume Spikes - Bright green/red bars in VPD column
• Volume exceeds average by 2+ standard deviations
• Represents aggressive institutional entry
• Trading Implication: Potential trend continuation or setup for failed auction
🛡️ Absorption Zones - Yellow/Orange colored bars
• Large passive orders absorbing aggressive volume without price movement
• Indicates accumulation (bullish) or distribution (bearish)
• Trading Implication: Institutional positioning before major moves
🧊 Iceberg Orders - Cyan colored bars with high hit counts
• Same price level shows repeated volume without clearing
• Reveals hidden institutional limit orders split into small pieces
• Trading Implication: Strong liquidity magnets, price often returns here
💜 Volume Exhaustion - Purple colored bars
• Sharp volume drop (50%+) after spike
• Momentum exhausted, participants depleted
• Trading Implication: Potential reversal or consolidation ahead
═════════════════════════════════════════════════════════════
🎨 SMART INSTITUTIONAL COLORING
═════════════════════════════════════════════════════════════
Colors bars based on detected patterns vs simple red/green:
🟨 Yellow = Bullish battles won (buyers + trapped sellers)
🟧 Orange = Bearish battles won (sellers + trapped buyers)
🔵 Cyan = Iceberg orders (hidden liquidity)
🟣 Purple = Large passive orders
🟢 Bright Green = Buying spikes (institutional aggression)
🔴 Bright Red = Selling spikes (institutional aggression)
═════════════════════════════════════════════════════════════
⭐ CONFLUENCE SCORING SYSTEM
═════════════════════════════════════════════════════════════
Each price level receives 1-5 stars based on:
★★ Volume spike presence (+2 stars)
★ Absorption pattern (+1 star)
★ Large passive orders (+1 star)
★ Proximity to Value Area (+1 star)
★★ Iceberg detection (+2 stars)
★★ Failed auction (+2 stars)
Minimum Signal Strength filter lets you show only levels with ★3+ confluence for highest-quality signals.
═════════════════════════════════════════════════════════════
🎯 VALUE AREA ANALYSIS
═════════════════════════════════════════════════════════════
VAH (Value Area High) - Blue Line
- Top of the 70% volume acceptance zone
- Price at VAH often rejects downward (resistance)
- Alert triggers when price approaches
VAL (Value Area Low) - Red Line
- Bottom of the 70% volume acceptance zone
- Price at VAL often bounces upward (support)
- Alert triggers when price approaches
Trading Applications:
- Price outside Value Area → Mean reversion opportunity
- Price breaks VA with volume → Trend continuation
- Price oscillates within VA → Range-bound, fade extremes
- Previous session VA lines show carryover levels
═════════════════════════════════════════════════════════════
📋 EXPECTED PRICE BEHAVIOR AT KEY LEVELS
═════════════════════════════════════════════════════════════
⚠️ IMPORTANT: These are observed behavioral patterns for educational purposes and backtesting research. Always validate with 250-500+ backtest trades before risking capital.
1️⃣ POC BOX ZONES (Highest Statistical Relevance)
🟨 Yellow Boxes (Below Current Price - SUPPORT)
Expected Behavior:
- Price approaching from above typically encounters buying pressure
- Both profitable institutional buyers and trapped short sellers create demand
- Common reaction: Price slows, consolidates, or bounces
- Failed bounces often lead to rapid breakdown (trapped buyers capitulate)
What Often Happens:
- Initial dip into zone → Weak bounce attempt
- Second test → Stronger bounce (trapped sellers covering + buyers defending)
- Break below → Quick acceleration as both groups exit
🟧 Orange Boxes (Above Current Price - RESISTANCE)
Expected Behavior:
- Price rallying into zone typically encounters selling pressure
- Both profitable institutional sellers and trapped long buyers create supply
- Common reaction: Price stalls, consolidates, or rejects
What Often Happens:
- Initial push into zone → Weak rejection
- Second test → Stronger rejection (trapped buyers exiting + sellers defending)
- Break above → Quick acceleration as resistance becomes support
2️⃣ FAILED AUCTION ZONES
"SELLERS TRAPPED" Labels (Below Price):
- High-volume selling that immediately reversed = maximum trapped shorts
- When price returns, trapped sellers face pressure to cover
- Typical pattern: Price approaches → Initial hesitation → Sharp bounce
"BUYERS TRAPPED" Labels (Above Price):
- High-volume buying that immediately failed = maximum trapped longs
- Price returning forces trapped buyers to exit at breakeven
- Typical pattern: Price approaches → Distribution → Rejection
3️⃣ VALUE AREA DYNAMICS
Price Outside Value Area (VAH/VAL):
- Price beyond 70% volume zone = statistical outlier
- Two outcomes: Mean reversion OR trend continuation
- Key differentiator: Presence of confluence zones
Mean Reversion Pattern (No Strong Confluence):
- Price extends 1-2% beyond VA → Typically reverts toward POC
- Weak volume on extension → Higher probability of reversal
Breakout Pattern (With ★4+ Confluence):
- Price breaks VA with institutional patterns → Often continues
- Strong volume + confluence = New value area forming
4️⃣ ICEBERG ORDER BEHAVIOR
Cyan Bars with High Hit Counts:
- Repeated volume at same level = Large hidden order absorbing
- Price typically "tests" iceberg multiple times before resolution
- Two outcomes: Absorption complete (break) OR rejection (bounce)
5️⃣ VOLUME SPIKE PATTERNS
Bright Green/Red Bars (Institutional Aggression):
- Extreme delta spikes indicate institutional entry
- Trend Continuation Spikes: Spike aligned with trend = Often continues
- Exhaustion Spikes: Spike against trend = Failed auction forming
═════════════════════════════════════════════════════════════
⚙️ CONFIGURATION GUIDE
═════════════════════════════════════════════════════════════
🎯 QUICK START
1. Select your trading style preset (Scalper/Day/Swing)
2. Enable VAH/VAL alerts in settings
3. Adjust alert sensitivity (0.1% recommended)
4. Add alert condition to TradingView alert system
📊 CORE SETTINGS
- Lookback Period: How many bars to analyze
- Scalping: 50-100 bars
- Day Trading: 100-200 bars
- Swing Trading: 200-500 bars
- Price Row Granularity: How finely to divide price
- 40-50 rows = Fast markets
- 60-80 rows = Balanced (RECOMMENDED)
- 100+ rows = Maximum precision
- Minimum Signal Strength: Filter weak signals
- ★3 = Balanced quality/quantity (RECOMMENDED)
- ★4-5 = Highest quality, fewer opportunities
🎨 VISUAL SETTINGS
- Color Theme: Classic/Institutional/Monochrome/Bold/Minimal/Custom
- Smart Coloring: ON (recommended) - Shows institutional patterns
- Transparency: Adjust profile opacity
- Column Dividers: Visual separators between columns
- POC Extensions: Show historical level significance
📈 ADVANCED FEATURES
- Auto-Hide Distance: Hide profile when price moves X% away
- Statistics Panel: Real-time metrics display
- Previous POCs: Show prior session levels
- Alert Sensitivity: How close price must be to trigger alerts
═════════════════════════════════════════════════════════════
💡 BEST PRACTICES
═════════════════════════════════════════════════════════════
✅ Start with defaults (200 lookback, 60 rows, ★3 confluence, Smart Coloring ON)
✅ Focus on POC boxes first - These are your highest-probability zones
✅ Combine with price action - Use the profile to explain WHY support/resistance exists
✅ Watch for alignment - Yellow/Orange boxes = strongest levels
✅ Respect failed auctions - "TRAPPED" labels are extreme reversal setups
✅ Use Value Area for context - Price outside VA = mean reversion opportunity
✅ Trust confluence scores - ★4-5 signals are institutional-grade setups
✅ Set up alerts for VAH/VAL touches - Don't miss key levels
✅ Check previous session POCs - Institutions defend same zones across sessions
✅ Monitor statistics panel - Understand market conviction in real-time
═════════════════════════════════════════════════════════════
🔧 TECHNICAL SPECIFICATIONS
═════════════════════════════════════════════════════════════
Calculation Method: Enhanced delta using OHLC and volume with wick ratio analysis
Update Frequency: Real-time on every bar close
Performance: Optimized with color caching and pre-calculated values (~30% faster)
Max Capacity: Supports up to 1500 bars lookback and 250 price rows
Compatibility: Works on all symbols and timeframes
Memory Usage: Efficient array management with proper initialization
Alert System: Built-in VAH/VAL touch detection with visual markers
═════════════════════════════════════════════════════════════
🎯 UNIQUE VALUE PROPOSITION
═════════════════════════════════════════════════════════════
Unlike standard Volume Profile indicators that only show where volume occurred, the IDT Auction Profile:
✅ Separates bid vs ask volume to reveal true order flow
✅ Identifies who is profitable vs who is trapped at each level
✅ Detects institutional patterns (icebergs, absorption, failed auctions)
✅ Calculates confluence scores combining multiple factors
✅ Provides clear POC boxes showing exact institutional positioning
✅ Maps positional advantage rather than just volume density
✅ Alerts you to key level touches in real-time
✅ Shows historical context with POC extensions
✅ Displays live statistics for market conviction
This transforms Volume Profile from a historical volume chart into a strategic positioning map showing institutional dominance and trapped participants.
═════════════════════════════════════════════════════════════
📖 HOW TO INTEGRATE WITH YOUR STRATEGY
═════════════════════════════════════════════════════════════
✅ PROPER USES:
- Entry refinement within your existing setups
- Intelligent stop placement beyond institutional levels
- Objective profit targets at next confluence zones
- Trade filtering (only take setups at ★4+ zones)
- Understanding market positioning before entry
- Alert-based monitoring of key support/resistance levels
❌ WHAT IT CANNOT DO:
- Predict direction with certainty
- Replace risk management
- Account for news/external events
- Guarantee profitability
- Work in all market conditions
═════════════════════════════════════════════════════════════
📚 DEVELOPMENT PATH (12-16 Weeks)
═════════════════════════════════════════════════════════════
Weeks 1-2: Observation Only
- Watch price behavior at key levels
- Document patterns without trading
- Set up alerts and observe responses
Weeks 3-8: Paper Trading
- Simulate trades, track all metrics
- Minimum 100 paper trades
- Test different confluence thresholds
Weeks 9-16: Small Size Testing
- Minimal capital, real market conditions
- Continue tracking, refine rules
- Adjust alert sensitivity based on results
After Proven Edge you could potentially include it in your set-up
═════════════════════════════════════════════════════════════
⚠️ CRITICAL DISCLAIMERS
═════════════════════════════════════════════════════════════
⚠️ Past volume ≠ Future price action
⚠️ Institutional positions change rapidly - these are static snapshots
⚠️ No indicator works 100% - risk management is mandatory
⚠️ Market conditions change - adapt your approach
⚠️ Backtest with YOUR style, YOUR timeframe, YOUR risk tolerance
⚠️ Alerts are notifications, not trade signals - you decide the action
The indicator reveals WHERE institutions are positioned and HOW they might behave. YOU decide IF, WHEN, and HOW to trade that information.
═════════════════════════════════════════════════════════════
📞 SUPPORT & UPDATES
═════════════════════════════════════════════════════════════
For questions, suggestions, or bug reports:
- Comment below the indicator
- Follow for updates and new features
- Check documentation for detailed examples
═════════════════════════════════════════════════════════════
Not financial advice. For educational and research purposes only.

XAUMO MegaBar VSA by Mohamed Mahmoud XAUMO MegaBar VSA — Smart Money Breakout & Reversal Engine for XAUUSD
(Educational Use Only)
1) WHAT THIS INDICATOR DOES
XAUMO MegaBar VSA is an institutional-style smart money engine for XAUUSD designed to show you what professional money is doing, not just where price is moving.
It combines:
- MegaBar detection on 1H and 15m
- VSA (Volume Spread Analysis) events
- VPOC / WVPOC and volume clusters
- Liquidity sweeps, CHoCH, order blocks, FVGs
- Full Fibonacci leg mapping (retracements + extensions)
- Pre-built execution ladders (Entry, SL, TP1–TP4, Reverse Fib trades)
All in one dashboard with:
- Color-coded candles
- Clean, ATR-offset labels
- Optional tables and debug panels
So traders can quickly decide:
“Is this move driven by smart money, or is it just noise?”
2) CORE MODULES & FEATURES
A) SESSION + ACCUMULATION / DISTRIBUTION CONTEXT
- Session filter: London, New York, Overlap, or custom.
- Accumulation / distribution zones shaded on chart with adjustable colors/opacity.
- Quick legend so you always know if the market is in “smart money accumulation” or “distribution”.
HOW TRADERS USE IT:
Focus only on your trading session and instantly see if volume is building (accumulation), unloading (distribution), or flat. This helps you avoid trading in dead liquidity.
--------------------------------------------------
B) MEGABAR ENGINE + FIB MAP
- Automatically detects “MegaBars” (institutional candles) on 15m and 1H.
- Uses body size, range, and volume to pick only meaningful bars.
- Builds a full Fibonacci map from each active MegaBar:
• Retracements: 0, 13, 23.6, 38.2, 50, 61.8, 78.6, 86.2, 100, and -33.
• Extensions: 125% up to 600%+ (configurable ladder).
- Per-level style controls:
• Color, width, line style (solid/dotted/dashed).
• Optional price labels with ATR-based offsets.
- Main Fib legend that explains shallow / normal / deep reload zones.
HOW TRADERS USE IT:
You stop guessing where to buy or sell. You trade around the institutional leg:
- Buy dips into defined reload zones after bullish MegaBars.
- Sell rallies into extension zones after bearish MegaBars.
- Use clean, pre-mapped structure for both scalps and swings.
--------------------------------------------------
C) VSA ENGINE + CANDLE LABELING
- Detects a full set of VSA events such as:
• No Demand / No Supply
• Stopping Volume
• Absorption
• Springs / Upthrusts
• Buying Climax / Selling Climax
• Bullish / Bearish EVR
• Tests and confirmed VSA signals at S/R
- Enhances with:
• Body vs total range analysis
• Wick dominance for exhaustion vs aggression
• Momentum and volume confirmation filters
HOW TRADERS USE IT:
Each label becomes a “comment” from smart money on the chart:
- “No Demand” near resistance + weak RVOL = skip long entries.
- “Stopping Volume” + spring at Fib reload zone + VPOC cluster = potential high-quality long.
- Combine VSA with the MegaBar Fib map and volume profile for structured decisions.
--------------------------------------------------
D) SUPERSONIC BREAKOUT ENGINE
- Calculates a breakout strength score using:
• RVOL and volume expansion
• Spread expansion vs recent bars
• Body quality (body vs range)
• Bar progress (how much of the candle’s time has elapsed)
- Differentiates:
• Potential vs confirmed breakouts
• Strong, volume-backed moves vs weak spikes
- Optional debug label explaining:
• Momentum score
• Volume ratio and RVOL
• Spread behaviour
• Body quality
• Bar elapsed %
HOW TRADERS USE IT:
You avoid chasing every big candle.
You only act when:
- Breakout strength is high,
- Volume confirms the move,
- Structure (Fib / VPOC / CHoCH) is aligned.
--------------------------------------------------
E) VPOC / WVPOC CLUSTERS & DYNAMIC ZONES
- Tracks real-time VPOC and WVPOC.
- Identifies VPOC/WVPOC clusters as powerful S/R zones.
- Confirms bullish or bearish breaks when price clears these levels with volume.
- Provides dynamic SL and TP logic:
• SL near/behind VPOC with ATR buffer.
• TP ladders aligned with volume structure.
HOW TRADERS USE IT:
You anchor your risk to where the most volume traded, not random price points:
- Use VPOC as a rational stop placement.
- Treat VPOC/WVPOC clusters as “coiled springs” – zones where large moves often start.
--------------------------------------------------
F) SMART MONEY ENTRY ENGINE (1H + 15M MEGABARS)
- Uses MTF `request.security` logic to bring 1H MegaBars into lower timeframes.
- Identifies:
• 1H + 15m confluence entries (A-grade setups).
• Single-TF entries (B-grade setups).
- Pre-calculates for each scenario:
• Entry level (Fib-based within the MegaBar range).
• Stop loss (beyond range or leg-based).
• TP1–TP4 along Fib extensions / structure.
- Labels show:
• “Entry = …”
• “SL = …”
• “TP1 = … / TP2 = … / TP3 = … / TP4 = …”
with adjustable font size and ATR-based offsets.
- Optional “show only latest” mode to keep your chart clean.
- Alert-ready so you can receive notifications when conditions are met.
HOW TRADERS USE IT:
You get a fully defined execution ladder:
- The engine tells you where a logical entry is,
- Where a logical SL should be,
- And how to scale out with multiple targets.
You can use:
- Confluence setups for main trades,
- Single-TF setups for more frequent but lower conviction trades.
--------------------------------------------------
G) REVERSE FIB TRADING MODULE
- Triggers after extended moves when key TPs are hit.
- Looks for:
• Rejection candles at or beyond major extensions.
• Exhaustion + VSA confirmation.
- Builds a reverse (counter-trend) Fib plan:
• Counter-trend entry from extension extremes.
• TP ladder based on 0.618, 0.786, 1.236, 1.382, 1.5, 1.618, 2.0, etc.
• SL and TSL based on ATR and Fib distance.
- ATR timeframe adapts to chart timeframe.
HOW TRADERS USE IT:
You can fade overextended moves once structure and P/A agree:
- Trend traders can use it to tighten or exit.
- Counter-trend traders can structure “fade” setups with defined risk.
--------------------------------------------------
H) LIQUIDITY SWEEPS, CHoCH, ORDER BLOCKS, FVGs
- Detects sweeps above highs and below lows (liquidity grabs).
- Marks CHoCH (Change of Character) when structure flips with volume.
- Basic smart money order block detection (bullish / bearish).
- FVGs (Fair Value Gaps) shaded on chart, removed when filled.
HOW TRADERS USE IT:
Combine sweeps + CHoCH + MegaBar + VSA + VPOC:
- Join clean, volume-backed continuations.
- Fade obvious stop hunts when they reject into strong zones.
--------------------------------------------------
I) VSA + BREAKOUT DASHBOARD TABLE (OPTIONAL)
- Compact table with:
• VSA context
• Breakout score
• RVOL / volume status
• Spread and candle quality
• ATR regime
• Close position within the bar
• VPOC and elapsed bar percentage
HOW TRADERS USE IT:
Before pressing the button, glance at the table:
- Is volatility supportive?
- Is volume confirming?
- Is this a clean breakout or a tired move?
This pushes you toward rule-based execution and away from impulse.
--------------------------------------------------
3) TYPICAL TRADING WORKFLOW WITH XAUMO MEGABAR VSA
A) Pick timeframe and session
- Use 15m or 1H on XAUUSD.
- Align the indicator’s session inputs with your actual trading hours.
B) Read context first
- Check accumulation / distribution zones.
- Look at VSA events and the breakout engine.
- Note where VPOC / WVPOC are relative to price.
C) Find the active MegaBar and its Fib structure
- Identify the most recent bull/bear MegaBar.
- See if price is:
• Pulling back into reload zones,
• Breaking out of them,
• Or extending into high-risk zones.
D) Wait for smart money confirmation
- Look for:
• Confluence setups (1H + 15m MegaBars),
• Strong breakout score,
• Valid VSA signals,
• Helpful structure: CHoCH, FVG, sweeps.
E) Execute using the printed ladders
- Use the on-chart Entry / SL / TP labels as your execution framework.
- Adjust lot size and risk % according to your own plan.
F) Manage and exit
- Use ATR / VPOC logic to trail or lock profits.
- Rotate to reverse Fib setups if extensions look exhausted.
4) WHO THIS INDICATOR IS FOR
- Gold traders (XAUUSD CFD or spot) on 15m and 1H.
- Traders who prefer institutional structure (volume, VPOC, SMC, Fib) over simple indicators.
- Traders who want pre-structured entries, SL, and TP ladders without losing flexibility.
- Advanced students of VSA and smart money concepts who want everything in one tool.
5) FULL EDUCATIONAL DISCLAIMER (READ CAREFULLY)
- This indicator and all descriptions are for EDUCATIONAL PURPOSES ONLY.
- NOTHING in this script, its labels, tables, alerts, outputs, or documentation is:
• Investment advice
• Trading advice
• A recommendation to buy or sell any asset
• A signal service or portfolio management tool
- Markets are risky. Trading leveraged instruments such as CFDs, futures, or margin products involves a HIGH RISK of loss, including the possible loss of ALL invested capital.
- Past performance, backtests, or hypothetical examples DO NOT guarantee future results.
- Any probabilities, scores, or “quality levels” shown by the indicator are purely algorithmic and DO NOT represent guarantees or promises of profit.
- You are solely responsible for:
• Your position sizing
• Your leverage
• Your entries, exits, and risk management
• Compliance with local regulations and tax rules
- Before trading live with real money, you should:
• Thoroughly backtest and forward-test the indicator.
• Use a demo account to understand how signals behave in real time.
• Consult a licensed financial professional if you need personalised investment or trading advice.
- By using this indicator:
• You accept that the author and any associated entities or brands (including XAUMO, XAUMO indicators, and any promotional text) bear NO LIABILITY for any financial losses, missed gains, or decisions you make based on this tool.
• You agree that you are acting entirely at your own risk and that all outputs are informational and educational, not prescriptive trading instructions.
In short:
Use XAUMO MegaBar VSA as a powerful educational and analytical companion,
NOT as a substitute for your own independent judgment, testing, and risk control.
=====================================================
XAUMO MegaBar VSA — محرّك البريك آوت و الريفرسال بتاع السمارت ماني للدهب
( استخدام تعليمي بس)
1) المؤشّر ده بيعمل إيه؟
XAUMO MegaBar VSA معمول مخصوص للـ XAUUSD عشان يورّيك "الفلوس الكبيرة" بتتحرك إزاي،
مش بس السِعر رايح فين.
بيجمع في حتّة واحدة:
- رصد MegaBar على الساعة والربع ساعة
- VSA (Volume Spread Analysis) – سلوك الفوليوم جوّه الشمعة
- VPOC / WVPOC و تجمّعات الفوليوم المهمّة
- سويپس لليكويديتي + CHoCH + Order Blocks + FVGs
- خريطة فيبوناتشي كاملة (Retrace + Extensions)
- سلالم تنفيذ جاهزة (Entry, SL, TP1–TP4 + صفقات Reverse Fib)
وكل ده:
- بألوان واضحة على الشموع
- لِيبلات متظبّطة بـ ATR Offset
- Tables و Panels اختيارية
عشان المتداول يسأل نفسه:
"الحركة دي بتاعة سمارت ماني؟ ولا مجرد دوشة ملوش لازمة؟"
2) أهم الموديولات اللي جوّه المؤشّر
A) الكونتكست بتاع السيشن + تجميع/توزيع
- فلتر جلسات: لندن – نيو يورك – overlap – أو وقت تحطّه انت.
- مناطق Accumulation / Distribution متظلّلة بألوان أنت بتختارها.
- لچند بسيط يوضّح لك السوق دلوقتي: تجميع؟ توزيع؟ ولا نايم.
المتداول يستخدمه إزاي؟
تركّز بس في الجلسة اللي انت شغّال فيها، وتشوف فورًا:
فيه بناء مراكز؟ فيه تصريف؟ ولا مفيش فوليوم أصلاً؟
ده يقلّل دخولك في أوقات السوق فيها “ميت”.
--------------------------------------------
B) محرّك الـ MegaBar + خريطة الفيبوناتشي
- المؤشّر يلقط لوحده الـ MegaBars (شموع مؤسّسات) على 15m و 1h.
- بيعتمد على: حجم الجسم، مدى الشمعة، الفوليوم.
- يرسم خريطة فيبوناتشي كاملة من الرجل الأساسية:
• Retrace: 0, 13, 23.6, 38.2, 50, 61.8, 78.6, 86.2, 100, -33
• Extensions: من 125% لحد 600%+ (سلم قابل للتعديل)
- لكل مستوى:
• لون / سماكة / ستايل (سوليد – دوتيد – داشد)
• ليبل سِعر مع Offset بـ ATR
- لچند يشرح لك Reload Zones: ضحلة / عادية / عميقة.
المتداول يستخدمه إزاي؟
بدل ما “تخمّن” فين تشتري وتبيع:
- تشتري الدِپ جوّه مناطق Reload بعد MegaBar صاعد.
- تبيع الريبوند جوّه Extensions بعد MegaBar هابط.
- عندك هيكل واضح للسوينج والسكالب من غير فوضى.
--------------------------------------------
C) VSA + لِيبلات على الشموع
- يكتشف أحداث VSA زي:
• No Demand / No Supply
• Stopping Volume
• Absorption
• Spring / Upthrust
• Buying / Selling Climax
• EVR (شموع مجنونة فوليومًا)
• Tests و Confirmed Signals عند الدعوم/المقاومات
- مع تحسينات:
• تحليل Body vs Range
• مين اللي غالب؟ جسم الشمعة ولا الذيول؟
• فلتر Momentum + Volume
المتداول يستخدمه إزاي؟
كل ليبل على الشمعة = كومنت من السمارت ماني:
- No Demand عند مقاومة + RVOL ضعيف → بلاش تشتري.
- Stopping Volume + Spring جوّه Reload Zone + VPOC → فرصة قوية للشراء.
- توصل بين VSA + Fib + VPOC فتفهم “مين بيكسب المعركة”.
--------------------------------------------
D) محرّك البريك آوت Supersonic
- بيحسب Score للقوة بتاعة البريك آوت من:
• RVOL + Volume Expansion
• توسّع السبريد مقارنة بالشموع السابقة
• جودة جسم الشمعة (جسم ولا ذيل)
• نسبة الوقت اللي عدّى من الشمعة الحالية
- يفرّق بين:
• بريك آوت محتمل vs مؤكد
• حركة قوية مدعومة بفوليوم vs “شمعة شو”
- يقدر يطلع ليبل Debug يشرح:
• Momentum Score
• Volume Ratio / RVOL
• Spread Behaviour
• Body Quality
• % الوقت اللي فات من عمر الشمعة
المتداول يستخدمه إزاي؟
ماتجريش ورا كل شمعة كبيرة:
- استنَى لما يكون الـ Score عالي،
- والفوليوم مصدّق الحركة،
- والهيكل (Fib / VPOC / CHoCH) موافق.
ساعتها بس البريك آوت يستاهل المخاطرة.
--------------------------------------------
E) VPOC / WVPOC + مناطق الفوليوم
- يرقب VPOC و WVPOC في الوقت الحقيقي.
- يحدّد Clusters مهمة تتحوّل لـ Support / Resistance محترم.
- يراقب كسر المناطق دي بفوليوم واضح (بداية موجة جديدة).
- SL و TP ديناميك:
• SL حوالين VPOC مع Buffer من ATR.
• TP متوزع على مستويات فيبوناتشي و زونات فوليوم.
المتداول يستخدمه إزاي؟
بتربط مخاطرتك بأين اشتغل الفوليوم التقيل:
- VPOC = منطق منطقي للستوب.
- Clusters = زون ضغط ينفع يبدأ منها ترند قوي.
--------------------------------------------
F) محرّك الدخول بتاع السمارت ماني (1h + 15m MegaBars)
- يجيب MegaBars بتاعة الساعة جوّه فريمات أقل بالـ `request.security`.
- يميّز:
• Confluence بين MegaBar الساعة + MegaBar الربع ساعة (صفقة A-Grade).
• MegaBar على فريم واحد بس (B-Grade).
- يجهّز تلقائيًا:
• Entry
• SL
• TP1–TP4 على Extensions و مستويات هيكلية.
- اللّيبلات تكتب:
• Entry = …
• SL = …
• TP1 = … / TP2 = … / TP3 = … / TP4 = …
مع تحكّم في حجم الخط و ATR Offset.
- فيه اختيار “أظهر آخر سيناريو بس” عشان الشارت يفضل نضيف.
- جاهز للـ Alerts لما الشروط تكمّل.
المتداول يستخدمه إزاي؟
يبقى عندك Execution Ladder كامل:
- فين تدخل،
- فين تحط الستوب،
- إزاي تقسم الخروج على أكتر من هدف.
--------------------------------------------
G) موديل الـ Reverse Fib (صفقات عكس الاتجاه)
- بيشتغل بعد ما السعر يبالغ في الحركة و يوصل Extensions معيّنة.
- يدور على:
• شموع رفض عند/بعد Extensions.
• Exhaustion + إشارة VSA.
- يرسم خطة عكسية:
• Entry عكسي من Extension Extreme.
• TP سلم مبني على 0.618, 0.786, 1.236, 1.382, 1.5, 1.618, 2.0, … إلخ
• SL و TSL مبنيين على ATR و مسافة الفيبوناتشي.
المتداول يستخدمه إزاي؟
لو انت ترند تريدر:
- تستخدمه عشان تقفل/تخفف عند تمدّد مبالغ فيه.
لو انت Counter-Trend:
- يديك سيناريو “فِيد” منطقي بمخاطرة محسوبة.
--------------------------------------------
H) سويپس لليكويديتي + CHoCH + Order Blocks + FVGs
- يوسم مناطق ضرب الستوبات فوق الهاي وتحت اللو (Liquidity Grabs).
- يحدد CHoCH لما الاتجاه يغيّر شخصيته مع فوليوم.
- يرصد Order Blocks أساسية (Bullish / Bearish).
- يظلّل الـ FVGs و يشيلها لما تتعبّى.
المتداول يستخدمه إزاي؟
تجمع بين:
MegaBar + VSA + Fib + VPOC + Liquidity:
- يا إمّا تلحق موجة نظيفة،
- يا إمّا تفِيد Stop Hunt غبي اتكشف على الشارت.
--------------------------------------------
I) داشبورد VSA + Breakout (Table اختياري)
- Table صغيرة فيها:
• حالة VSA
• قوة البريك آوت
• RVOL / Volume
• Spread & Candle Quality
• حالة ATR
• مكان الإغلاق جوّه الشمعة
• وضع VPOC
• نسبة الوقت اللي عدّى من الشمعة
المتداول يستخدمه إزاي؟
قبل ما تدوس Buy / Sell:
- تبص على التابل ثانيتين:
الدنيا شغّالة ولا لأ؟
فيه فوليوم؟ فيه ترند؟ ولا حركة ميتة؟
ده يقلل قرارات “من غير plan”.
3) سيناريو شغل متداول على XAUMO MegaBar VSA
1) اختار الفريم + الجلسة
- 15m أو 1h على XAUUSD.
- ظبّط سيشن لندن/نيويورك زي وقت شغلك الحقيقي.
2) اقرأ الكونتكست
- السوق بيبنِي مراكز؟ بيصفّي؟ ولا نايم؟
- إيه إشارات الـ VSA و Score البريك آوت؟
- فين VPOC / WVPOC من السعر؟
3) دور على MegaBar النشط و خريطة الفيبوناتشي بتاعته
- السعر:
• بيرجّع جوّه Reload Zone؟
• بيكسر البرنچ؟
• ولا داخل على Overextension؟
4) استنَى تأكيد السمارت ماني
- Confluence بين MegaBar الساعة والربع ساعة.
- Breakout Score محترم.
- VSA منطقي (No Demand, Stopping Volume, Spring, …).
- Structure: CHoCH / FVG / Liquidity Sweep في اتجاه الصفقة.
5) نفّذ باستخدام السلم المطبوع على الشارت
- استخدم Entry / SL / TP1–TP4 كـ هيكل أساسي.
- عدّل اللوت / الريسك حسب خطتك انت.
6) الإدارة والخروج
- استعمل ATR + VPOC في Trailing/Lock.
- لما Extensions تبان مبالغ فيها → ركّز على Reverse Fib.
4) المؤشّر ده مناسب لمين؟
- اللي بيتاجر دهب XAUUSD (CFD أو Spot) على 15m و 1h.
- اللي بيحب شغل مؤسّسات: Volume, VPOC, SMC, Fib مش مؤشرات بسيطة.
- اللي عايز Execution Plan جاهز (Entry/SL/TP) بس لسه عنده حريّة تعديل.
- اللي عايز يتعلّم VSA و Smart Money Concepts بشكل تطبيقي على شارت واحد.
5) إخلاء مسؤولية كامل (مهم تقراه)
- المؤشّر ده وكل الكلام اللي حواليه للتعليم بس.
- مش:
• نصيحة استثمارية،
• ولا توصية شراء/بيع،
• ولا خدمة إدارة محافظ،
• ولا سيجنال سيرڤس.
- التداول في الأسواق (خصوصًا المشتقات، الـ CFD، الفيوتشر) فيه مخاطرة عالية جدًا،
وممكن تخسر جزء كبير أو كل رأس مالك.
- أي أداء سابق، باك تست، أو مثال افتراضي → مش ضمان لنتيجة مستقبلية.
- أي نسبة احتمالات، Scores، أو “Quality” بيطلعها المؤشّر:
• دي حسابات كود، مش ضمان ربح،
• مش وعد ولا تعهّد بأي نتيجة.
- انت المسؤول 100% عن:
• حجم العقود اللي بتدخلها،
• الرافعة اللي بتستخدمها،
• أماكن الدخول والخروج،
• وإدارة المخاطرة بتاعتك،
• والتزامك بالقوانين والضرائب في بلدك.
- قبل ما تستخدم المؤشّر على حساب حقيقي:
• جرّب كويس على باك تست و فورورد تست،
• اشتغل فترة على Demo،
• لو محتاج نصيحة مالية شخصية → ارجع لمستشار مالي مرخَّص.
باختصار:
XAUMO MegaBar VSA ده أداة تعليمية وتحليلية قوية تساعدك تفهم حركة الذهب،
مش زرار “اطبع فلوس”.
انت صاحب القرار، وانت صاحب المسؤولية، وانت اللي بتتحمّل أي ربح أو خسارة.

Yong Fin Growth on ChartBridge the gap between Fundamental Analysis and Technical Price Action.
Yong Fin Growth on Chart is the ultimate tool for "Hybrid Traders" and investors who need to visualize financial performance directly alongside price movements. Stop switching tabs between news sites and your charts—get the full context of why a stock is moving, right where it happens.
This indicator overlays key financial metrics onto your chart, triggered precisely by Earnings Announcements. It allows you to instantly correlate price reactions with fundamental catalysts like Revenue Growth, Margin Expansion, or EPS surprises.
Key Features:
🔹 1. Smart Earnings Trigger The indicator automatically detects Earnings Announcement dates and plots a data label on the exact bar.
Stocks: Aligns with the specific earnings release date to show immediate price reaction.
Funds/ETFs: Supports Fiscal Period End dates for broader instrument analysis.
Includes a vertical line option to visually separate fiscal periods for easy backtesting.
🔹 2. 5 Fully Customizable Data Slots Configure up to 5 independent slots to track the metrics that matter to your strategy. Choose from a comprehensive list including:
Growth: Revenue, Net Income, EBITDA, EPS.
Efficiency: Gross Margin (GPM), Net Margin (NPM), ROE, ROA.
Valuation: P/E, P/S, P/BV, EV/EBITDA, and Implied P/E.
Health: Cash, Debt, Net Debt, Free Cash Flow (FCF).
🔹 3. Dynamic Growth Coloring & Thresholds Instantly identify trend changes with intelligent color coding.
Comparison Modes: Toggle between YoY (Year-over-Year) or QoQ (Quarter-over-Quarter) growth logic.
Custom Thresholds: Define your own standards. For example, set the label to turn Green only if growth exceeds +15%, or Red if it falls below -5%. This helps filter out noise and highlights significant fundamental shifts.
🔹 4. Flexible Period Selection Analyze data across different timeframes to suit your trading style:
FQ: Fiscal Quarter (Short-term momentum)
FY: Fiscal Year (Long-term trend)
TTM: Trailing Twelve Months (Ideal for smooth Valuation ratios)
FH: Fiscal Half (For securities reporting semi-annually)
How to Use:
Add to Chart: Apply the indicator to any stock symbol.
Configure Slots: Go to settings and select the 5 metrics you want to monitor (e.g., Rev, Net Profit, GPM, NPM, P/E).
Set Color Logic: Choose whether you want to color-code based on YoY or QoQ growth.
Analyze: Look for the labels.
Are margins expanding while price is consolidating?
Did the price drop despite a "Green" label? (Market expectations vs. Reality)
Use the vertical lines to see how the trend changed after previous earnings reports.
"Stop guessing. Let the fundamentals guide your technical entries."
Disclaimer: This tool is for educational and analytical purposes only. Past performance does not guarantee future results. Please conduct your own due diligence.
---------------------------------
เชื่อมช่องว่างระหว่างการวิเคราะห์ปัจจัยพื้นฐาน (Fundamental) และกราฟราคาทางเทคนิค (Technical Price Action)
Yong Fin Growth on Chart คือเครื่องมือที่ดีที่สุดสำหรับ "นักลงทุนสายผสม (Hybrid Traders)" และนักลงทุนที่ต้องการเห็นผลประกอบการทางการเงินซ้อนทับไปกับการเคลื่อนไหวของราคาโดยตรง หยุดเสียเวลาสลับหน้าจอไปมาระหว่างเว็บข่าวและกราฟของคุณ—รับรู้บริบททั้งหมดว่าทำไมหุ้นถึงวิ่ง ได้ทันทีบนหน้าจอนี้
อินดิเคเตอร์นี้จะวางค่าทางการเงินที่สำคัญลงบนกราฟ โดยถูกกระตุ้น (Trigger) อย่างแม่นยำด้วย วันประกาศงบ (Earnings Announcements) ช่วยให้คุณเชื่อมโยงปฏิกิริยาของราคา เข้ากับปัจจัยพื้นฐานที่เป็นตัวขับเคลื่อนได้ทันที เช่น การเติบโตของรายได้, การขยายตัวของอัตรากำไร (Margin), หรือกำไรต่อหุ้น (EPS) ที่เซอร์ไพรส์ตลาด
ฟีเจอร์หลัก:
🔹 1. Smart Earnings Trigger (ตัวระบุวันงบออกอัจฉริยะ) อินดิเคเตอร์จะตรวจจับวันประกาศงบอัตโนมัติและพลอตป้ายข้อมูล (Label) ลงบนแท่งเทียนนั้นเป๊ะๆ
หุ้นรายตัว: ตรงกับวันประกาศผลประกอบการจริง เพื่อดูปฏิกิริยาราคาทันที
กองทุน/ETFs: รองรับวันปิดรอบบัญชี (Fiscal Period End) สำหรับการวิเคราะห์สินทรัพย์ประเภทอื่นๆ
มีออปชั่นเส้นแนวตั้ง เพื่อแบ่งช่วงเวลางบแต่ละรอบ ให้ดูย้อนหลัง (Backtest) ได้ง่าย
🔹 2. 5 Fully Customizable Data Slots (ช่องข้อมูลปรับแต่งได้ 5 ช่อง) ตั้งค่าได้ถึง 5 ช่องอิสระ เพื่อติดตามตัวเลขที่สำคัญต่อกลยุทธ์ของคุณ เลือกจากรายการที่ครอบคลุม เช่น:
การเติบโต (Growth): Revenue, Net Income, EBITDA, EPS
ประสิทธิภาพ (Efficiency): Gross Margin (GPM), Net Margin (NPM), ROE, ROA
มูลค่า (Valuation): P/E, P/S, P/BV, EV/EBITDA, และ Implied P/E (ค่าพิเศษที่คุณใส่สูตรไว้)
สุขภาพการเงิน (Health): Cash, Debt, Net Debt, Free Cash Flow (FCF)
🔹 3. Dynamic Growth Coloring & Thresholds (ระบบสีและการตั้งเกณฑ์) ระบุการเปลี่ยนเทรนด์ได้ทันทีด้วยรหัสสีอัจฉริยะ
โหมดเปรียบเทียบ: เลือกสลับได้ระหว่าง YoY (เทียบปีก่อน) หรือ QoQ (เทียบไตรมาสก่อน)
เกณฑ์ที่กำหนดเอง (Custom Thresholds): กำหนดมาตรฐานของคุณเอง ตัวอย่างเช่น ตั้งค่าให้ป้ายเป็น สีเขียว เฉพาะเมื่อโตเกิน +15% หรือเป็น สีแดง เมื่อต่ำกว่า -5% สิ่งนี้ช่วยกรอง Noise และเน้นเฉพาะการเปลี่ยนแปลงพื้นฐานที่มีนัยสำคัญ
🔹 4. Flexible Period Selection (เลือกช่วงเวลาได้ยืดหยุ่น) วิเคราะห์ข้อมูลในกรอบเวลาที่แตกต่างกันตามสไตล์การเทรด:
FQ: รายไตรมาส (Fiscal Quarter) - ดูโมเมนตัมระยะสั้น
FY: รายปี (Fiscal Year) - ดูเทรนด์ระยะยาว
TTM: 12 เดือนย้อนหลัง (Trailing Twelve Months) - เหมาะสำหรับดูค่า Valuation Ratio ให้สมูท
FH: ครึ่งปี (Fiscal Half) - สำหรับหลักทรัพย์ที่ส่งงบแบบครึ่งปี
วิธีใช้งาน:
Add to Chart: ใส่อินดิเคเตอร์ลงในกราฟหุ้นตัวใดก็ได้
Configure Slots: ไปที่การตั้งค่าและเลือก 5 ค่าที่คุณต้องการเฝ้าดู (เช่น Rev, Net Profit, GPM, NPM, P/E)
Set Color Logic: เลือกตรรกะสี ว่าจะให้อิงตามการเติบโตแบบ YoY หรือ QoQ
Analyze: สังเกตป้ายข้อมูล
อัตรากำไร (Margin) ขยายตัวในขณะที่ราคากำลังพักตัวอยู่หรือเปล่า?
ราคาดิ่งลงทั้งๆ ที่ป้ายเป็น "สีเขียว" หรือไม่? (ความคาดหวังตลาด vs ความจริง)
ใช้เส้นแนวตั้งเพื่อดูว่าเทรนด์เปลี่ยนไปอย่างไรหลังจากงบออกในรอบก่อนๆ
"เลิกเดา ให้ปัจจัยพื้นฐานนำทางจุดเข้าซื้อทางเทคนิคของคุณ"
คำเตือน: เครื่องมือนี้มีไว้เพื่อการศึกษาและวิเคราะห์ข้อมูลเท่านั้น ผลการดำเนินงานในอดีตไม่การันตีผลลัพธ์ในอนาคต โปรดศึกษาข้อมูลด้วยตนเอง

Lorentzian Harmonic Flow - Adaptive ML⚡ LORENTZIAN HARMONIC FLOW — ADAPTIVE ML COMPLETE SYSTEM
THEORETICAL FOUNDATION: TEMPORAL RELATIVITY MEETS MACHINE LEARNING
The Lorentzian Harmonic Flow Adaptive ML system represents a paradigm shift in technical analysis by addressing a fundamental limitation that plagues traditional indicators: they assume time flows uniformly across all market conditions. In reality, markets experience time compression during volatile breakouts and time dilation during consolidation. A 50-period moving average calculated during a quiet overnight session captures vastly different market information than the same calculation during a high-volume news event.
This indicator solves this problem through Lorentzian spacetime modeling , borrowed directly from Einstein's special relativity. By calculating a dynamic gamma factor (γ) that measures market velocity relative to a volatility-based "speed of light," every calculation adapts its effective lookback period to the market's intrinsic clock. Combined with a dual-memory architecture, multi-regime detection, and Bayesian strategy selection, this creates a system that genuinely learns which approaches work in which market conditions.
CRITICAL DISTINCTION: TRUE ADAPTIVE LEARNING VS STATIC CLASSIFICATION
Before diving into the system architecture, it's essential to understand how this indicator fundamentally differs from traditional "Lorentzian" implementations, particularly the well-known Lorentzian Classification indicator.
THE ORIGINAL LORENTZIAN CLASSIFICATION APPROACH:
The pioneering Lorentzian Classification indicator (Jdehorty, 2022) introduced the financial community to Lorentzian distance metrics for pattern matching. However, it used offline training methodology :
• External Training: Required Python scripts or external ML tools to train the model on historical data
• Static Model: Once trained, the model parameters remained fixed
• No Real-Time Learning: The indicator classified patterns but didn't learn from outcomes
• Look-Ahead Bias Risk: Offline training could inadvertently use future data
• Manual Retraining: To adapt to new market conditions, users had to retrain externally and reload parameters
This was groundbreaking for bringing ML concepts to Pine Script, but it wasn't truly adaptive. The model was a snapshot—trained once, deployed, static.
THIS SYSTEM: TRUE ONLINE LEARNING
The Lorentzian Harmonic Flow Adaptive ML system represents a complete architectural departure :
✅ FULLY SELF-CONTAINED:
• Zero External Dependencies: No Python scripts, no external training tools, no data exports
• 100% Pine Script: Entire learning pipeline executes within TradingView
• One-Click Deployment: Load indicator, it begins learning immediately
• No Manual Configuration: System builds its own training data in real-time
✅ GENUINE FORWARD-WALK LEARNING:
• Real-Time Adaptation: Every trade outcome updates the model
• Forward-Only Logic: System uses only past confirmed data—zero look-ahead bias
• Continuous Evolution: Parameters adapt bar-by-bar based on rolling performance
• Regime-Specific Memory: Learns which patterns work in which conditions independently
✅ GETS BETTER WITH TIME:
• Week 1: Bootstrap mode—gathering initial data across regimes
• Month 2-3: Statistical significance emerges, parameter adaptation begins
• Month 4+: Mature learning, regime-specific optimization, confident selection
• Year 2+: Deep pattern library, proven parameter sets, robust to regime shifts
✅ NO RETRAINING REQUIRED:
• Automatic Adaptation: When market structure changes, system detects via performance degradation
• Memory Refresh: Old patterns naturally decay, new patterns replace them
• Parameter Evolution: Thresholds and multipliers adjust to current conditions
• Regime Awareness: If new regime emerges, enters bootstrap mode automatically
THE FUNDAMENTAL DIFFERENCE:
Traditional Lorentzian Classification:
"Here are patterns from the past. Current state matches pattern X, which historically preceded move Y. Signal fired."
→ Static knowledge, fixed rules, periodic retraining required
LHF Adaptive ML:
"In Trending Bull regime, Strategy B has 58% win rate and 1.4 Sharpe over last 30 trades. In High Vol Range, Strategy C performs better with 61% win rate and 1.8 Sharpe. Current state is Trending Bull, so I select Strategy B. If Strategy B starts failing, I'll adapt parameters or switch strategies. I'm learning which patterns matter in which contexts, and I improve every trade."
→ Dynamic learning, contextual adaptation, self-improving system
WHY THIS MATTERS:
Markets are non-stationary. A model trained on 2023 data may fail in 2024 when Fed policy shifts, volatility regime changes, or market structure evolves. Static models require constant human intervention—retraining, re-optimization, parameter updates.
This system learns continuously . It doesn't need you to tell it when markets changed. It discovers regime shifts through performance feedback, adapts parameters accordingly, and rebuilds its pattern library organically. The system running in Month 12 is fundamentally smarter than the system in Month 1—not because you retrained it, but because it learned from 1,000+ real outcomes.
This is the difference between pattern recognition (static ML) and reinforcement learning (adaptive ML). One classifies, the other learns and improves.
PART 1: LORENTZIAN TEMPORAL DYNAMICS
Markets don't experience time uniformly. During explosive volatility, price can compress weeks of movement into minutes. During consolidation, time dilates. Traditional indicators ignore this, using fixed periods regardless of market state.
The Lorentzian approach models market time using the Lorentz factor from special relativity:
γ = 1 / √(1 - v²/c²)
Where:
• v (velocity): Trend momentum normalized by ATR, calculated as (close - close ) / (N × ATR)
• c (speed limit): Realized volatility + volatility bursts, multiplied by c_multiplier parameter
• γ (gamma): Time dilation factor that compresses or expands effective lookback periods
When trend velocity approaches the volatility "speed limit," gamma spikes above 1.0, compressing time. Every calculation length becomes: base_period / γ. This creates shorter, more responsive periods during explosive moves and longer, more stable periods during quiet consolidation.
The system raises gamma to an optional power (gamma_power parameter) for fine control over compression strength, then applies this temporal scaling to every calculation in the indicator. This isn't metaphor—it's quantitative adaptation to the market's intrinsic clock.
PART 2: LORENTZIAN KERNEL SMOOTHING
Traditional moving averages use uniform weights (SMA) or exponential decay (EMA). The Lorentzian kernel uses heavy-tailed weighting:
K(distance, γ) = 1 / (1 + (distance/γ)²)
This Cauchy-like distribution gives more influence to recent extremes than Gaussian assumptions suggest, capturing the fat-tailed nature of financial returns. For any calculation requiring smoothing, the system loops through historical bars, computes Lorentzian kernel weights based on temporal distance and current gamma, then produces weighted averages.
This creates adaptive smoothing that responds to local volatility structure rather than imposing rigid assumptions about price distribution.
PART 3: HARMONIC FLOW (Multi-Timeframe Momentum)
The core directional signal comes from Harmonic Flow (HFL) , which blends three gamma-compressed Lorentzian smooths:
• Short Horizon: base_period × short_ratio / γ (default: 34 × 0.5 / γ ≈ 17 bars, faster with high γ)
• Mid Horizon: base_period × mid_ratio / γ (default: 34 × 1.0 / γ ≈ 34 bars, anchor timeframe)
• Long Horizon: base_period × long_ratio / γ (default: 34 × 2.5 / γ ≈ 85 bars, structural trend)
Each produces a Lorentzian-weighted smooth, converted to a z-score (distance from smooth normalized by ATR). These z-scores are then weighted-averaged:
HFL = (w_short × z_short + w_mid × z_mid + w_long × z_long) / (w_short + w_mid + w_long)
Default weights (0.45, 0.35, 0.20) favor recent momentum while respecting longer structure. Scalpers can increase short weight; swing traders can emphasize long weight. The result is a directional momentum indicator that captures multi-timeframe flow in compressed time.
From HFL, the system derives:
• Flow Velocity: HFL - HFL (momentum acceleration)
• Flow Acceleration: Second derivative (turning points)
• Temporal Compression Index (TCI): base_period / compressed_length (shows how much time is compressed)
PART 4: DUAL MEMORY ARCHITECTURE
Markets have memory—current conditions resonate with past regimes. But memory operates on two timescales, inspiring this indicator's dual-memory design:
SHORT-TERM MEMORY (STM):
• Capacity: 100 patterns (configurable 50-200)
• Decay Rate: 0.980 (50% weight after ~35 bars)
• Update Frequency: Every 10 bars
• Purpose: Capture current regime's tactical patterns
• Storage: Recent market states with 10-bar forward outcomes
• Analogy: Hippocampus (rapid encoding, fast fade)
LONG-TERM MEMORY (LTM):
• Capacity: 512 patterns (configurable 256-1024)
• Decay Rate: 0.997 (50% weight after ~230 bars)
• Quality Gate: Only high-quality patterns admitted (adaptive threshold per regime)
• Purpose: Strategic pattern library validated across regimes
• Storage: Validated patterns from weeks/months of history
• Analogy: Neocortex (slow consolidation, persistent storage)
Each memory stores 6-dimensional feature vectors:
1. HFL (harmonic flow strength)
2. Flow Velocity (momentum)
3. Flow Acceleration (turning points)
4. Volatility (realized vol EMA)
5. Entropy (market uncertainty)
6. Gamma (time compression state)
Plus the actual outcome (10-bar forward return).
K-NEAREST NEIGHBORS (KNN) PATTERN MATCHING:
When evaluating current market state, the system queries both memories using Lorentzian distance :
distance = Σ (1 - K(|feature_current - feature_memory|, γ))
This calculates similarity across all 6 dimensions using the same Lorentzian kernel, weighted by current gamma. The system finds K nearest neighbors (default: 8), weights each by:
• Similarity: Lorentzian kernel distance
• Age: Exponential decay based on bars since pattern
• Regime: Only patterns from similar regimes count
The weighted average of these neighbors' outcomes becomes the prediction. High-confidence predictions require both high similarity and agreement between multiple neighbors.
REGIME-AWARE BLENDING:
STM and LTM predictions are blended adaptively:
• High Vol Range regime: Trust STM 70% (recent matters in chaos)
• Trending regimes: Trust LTM 70% (structure matters in trends)
• Normal regimes: 50/50 blend
Agreement metric: When STM and LTM strongly disagree, the system flags low confidence—often indicating regime transition or novel market conditions requiring caution.
PART 5: FIVE-REGIME MARKET CLASSIFICATION
Traditional regime detection stops at "trending vs ranging." This system detects five distinct market states using linear regression slope and volatility analysis:
REGIME 0: TRENDING BULL ↗
• Detection: LR slope > trend_threshold (default: 0.3)
• Characteristics: Sustained positive HFL, elevated gamma, low entropy
• Best Strategy: B (Flow Momentum)
• Trading Behavior: Follow momentum, trail stops, pyramid winners
REGIME 1: TRENDING BEAR ↘
• Detection: LR slope < -trend_threshold
• Characteristics: Sustained negative HFL, elevated gamma, low entropy
• Best Strategy: B (Flow Momentum)
• Trading Behavior: Follow momentum short, aggressive exits on reversal
REGIME 2: HIGH VOL RANGE ↔
• Detection: |slope| < threshold AND vol_ratio > vol_expansion_threshold (default: 1.5)
• Characteristics: Oscillating HFL, high gamma spikes, high entropy
• Best Strategies: A (Squeeze Breakout) or C (Memory Pattern)
• Trading Behavior: Fade extremes, tight stops, quick profits
REGIME 3: LOW VOL RANGE —
• Detection: |slope| < threshold AND vol_ratio < vol_expansion_threshold
• Characteristics: Low HFL magnitude, gamma ≈ 1, squeeze conditions
• Best Strategy: A (Squeeze Breakout)
• Trading Behavior: Wait for breakout, wide stops on breakout entry
REGIME 4: TRANSITION ⚡
• Detection: Trend reversal OR volatility spike > 1.5× threshold
• Characteristics: Erratic gamma, high entropy, conflicting signals
• Best Strategy: None (often unfavorable)
• Trading Behavior: Stand aside, wait for clarity
Each regime gets a confidence score (0-1) measuring how clearly defined it is. Low confidence indicates messy, ambiguous conditions.
PART 6: THREE INDEPENDENT TRADING STRATEGIES
Rather than one signal logic, the system implements three distinct approaches:
STRATEGY A: SQUEEZE BREAKOUT
• Logic: Bollinger Bands squeeze release + HFL direction + flow velocity confirmation
• Calculation: Compares BB width to Keltner Channel width; fires when BB expands beyond KC
• Strength Score: 70 + compression_strength × 0.3 (tighter squeeze = higher score)
• Best Regimes: Low Vol Range (3), Transition exit (4→0 or 4→1)
• Pattern: Volatility contraction → directional expansion
• Philosophy: Calm before the storm; compression precedes explosion
STRATEGY B: LORENTZIAN FLOW MOMENTUM
• Logic: Strong HFL (×flow_mult) + positive velocity + gamma > 1.1 + NOT squeezing
• Calculation: |HFL × flow_mult| > 0.12, velocity confirms direction, gamma shows acceleration
• Strength Score: |HFL × flow_mult| × 80 + gamma × 10
• Best Regimes: Trending Bull (0), Trending Bear (1)
• Pattern: Established momentum → acceleration in compressed time
• Philosophy: Trend is friend when spacetime curves
STRATEGY C: MEMORY PATTERN MATCHING
• Logic: Dual KNN prediction > threshold + high confidence + agreement + HFL confirms
• Calculation: |memory_pred| > 0.005, memory_conf > 1.0, agreement > 0.5, HFL direction matches
• Strength Score: |prediction| × 800 × agreement
• Best Regimes: High Vol Range (2), sometimes others with sufficient pattern library
• Pattern: Historical similarity → outcome resonance
• Philosophy: Markets rhyme; learn from validated patterns
Each strategy generates independent strength scores. In multi-strategy mode (enabled by default), the system selects one strategy per regime based on risk-adjusted performance. In weighted mode (multi-strategy disabled), all three fire simultaneously with configurable weights.
PART 7: ADAPTIVE LEARNING & BAYESIAN SELECTION
This is where machine learning meets trading. The system maintains 15 independent performance matrices :
3 strategies × 5 regimes = 15 tracking systems
For each combination, it tracks:
• Trade Count: Number of completed trades
• Win Count: Profitable outcomes
• Total Return: Sum of percentage returns
• Squared Returns: For variance/Sharpe calculation
• Equity Curve: Virtual P&L assuming 10% risk per trade
• Peak Equity: All-time high for drawdown calculation
• Max Drawdown: Peak-to-trough decline
RISK-ADJUSTED SCORING:
For current regime, the system scores each strategy:
Sharpe Ratio: (mean_return / std_dev) × √252
Calmar Ratio: total_return / max_drawdown
Win Rate: wins / trades
Combined Score = 0.6 × Sharpe + 0.3 × Calmar + 0.1 × Win_Rate
The strategy with highest score is selected. This is similar to Thompson Sampling (multi-armed bandits) but uses deterministic selection rather than probabilistic sampling due to Pine Script limitations.
BOOTSTRAP MODE (Critical for Understanding):
For the first min_regime_samples trades (default: 10) in each regime:
• Status: "🔥 BOOTSTRAP (X/10)" displayed in dashboard
• Behavior: All signals allowed (gathering data)
• Regime Filter: Disabled (can't judge with insufficient data)
• Purpose: Avoid cold-start problem, build statistical foundation
After reaching threshold:
• Status: "✅ FAVORABLE" (score > 0.5) or "⚠️ UNFAVORABLE" (score ≤ 0.5)
• Behavior: Only trade favorable regimes (if enable_regime_filter = true)
• Learning: Parameters adapt based on outcomes
This solves a critical problem: you can't know which strategy works in a regime without data, but you can't get data without trading. Bootstrap mode gathers initial data safely, then switches to selective mode once statistical confidence emerges.
PARAMETER ADAPTATION (Per Regime):
Three parameters adapt independently for each regime based on outcomes:
1. SIGNAL QUALITY THRESHOLD (30-90):
• Starts: base_quality_threshold (default: 60)
• Adaptation:
Win Rate < 45% → RAISE threshold by learning_rate × 10 (be pickier)
Win Rate > 55% → LOWER threshold by learning_rate × 5 (take more)
• Effect: System becomes more selective in losing regimes, more aggressive in winning regimes
2. LTM QUALITY GATE (0.2-0.8):
• Starts: 0.4 (if adaptive gate enabled)
• Adaptation:
Sharpe < 0.5 → RAISE gate by learning_rate (demand better patterns)
Sharpe > 1.5 → LOWER gate by learning_rate × 0.5 (accept more patterns)
• Effect: LTM fills with high-quality patterns from winning regimes
3. FLOW MULTIPLIER (0.5-2.0):
• Starts: 1.0
• Adaptation:
Strong win (+2%+) → MULTIPLY by (1 + learning_rate × 0.1)
Strong loss (-2%+) → MULTIPLY by (1 - learning_rate × 0.1)
• Effect: Amplifies signal strength in profitable regimes, dampens in unprofitable
Each regime evolves independently. Trending Bull might develop threshold=55, gate=0.35, mult=1.3 while High Vol Range develops threshold=70, gate=0.50, mult=0.9.
PART 8: SHADOW PORTFOLIO VALIDATION
To validate learning objectively, the system runs three virtual portfolios :
Shadow Portfolio A: Trades only Strategy A signals
Shadow Portfolio B: Trades only Strategy B signals
Shadow Portfolio C: Trades only Strategy C signals
When any signal fires:
1. Open virtual position for corresponding strategy
2. On exit, calculate P&L (10% risk per trade)
3. Update equity, win count, profit factor
Dashboard displays:
• Equity: Current virtual balance (starts $10,000)
• Win%: Overall win rate across all regimes
• PF: Profit Factor (gross_profit / gross_loss)
This transparency shows which strategies actually perform, validates the selection logic, and prevents overfitting. If Shadow C shows $12,500 equity while A and B show $9,800, it confirms Strategy C's edge.
PART 9: HISTORICAL PRE-TRAINING
The system includes historical pre-training to avoid cold-start:
On Chart Load (if enabled):
1. Scan past pretrain_bars (default: 200)
2. Calculate historical HFL, gamma, velocity, acceleration, volatility, entropy
3. Compute 10-bar forward returns as outcomes
4. Populate STM with recent patterns
5. Populate LTM with high-quality patterns (quality > 0.4)
Effect:
• Without pre-training: Memories empty, no predictions for weeks, pure bootstrap
• With pre-training: System starts with pattern library, predictions from day one
Pre-training uses only past data (no future peeking) and fills memories with validated outcomes. This dramatically accelerates learning without compromising integrity.
PART 10: COMPREHENSIVE INPUT SYSTEM
The indicator provides 50+ inputs organized into logical groups. Here are the key parameters and their market-specific guidance:
🧠 ADAPTIVE LEARNING SYSTEM:
Enable Adaptive Learning (true/false):
• Function: Master switch for regime-specific strategy selection and parameter adaptation
• Enabled: System learns which strategies work in which regimes (recommended)
• Disabled: All strategies fire simultaneously with fixed weights (simpler, less adaptive)
• Recommendation: Keep enabled for all markets; system needs 2-3 months to mature
Learning Rate (0.01-0.20):
• Function: Speed of parameter adaptation based on outcomes
• Stocks/ETFs: 0.03-0.05 (slower, more stable)
• Crypto: 0.05-0.08 (faster, adapts to volatility)
• Forex: 0.04-0.06 (moderate)
• Timeframes:
1-5min scalping: 0.08-0.10 (rapid adaptation)
15min-1H day trading: 0.05-0.07 (balanced)
4H-Daily swing: 0.03-0.05 (conservative)
• Tradeoff: Higher = responsive but may overfit; Lower = stable but slower to adapt
Min Samples Per Regime (5-30):
• Function: Trades required before exiting bootstrap mode
• Active trading (>5 signals/day): 8-10 trades
• Moderate (1-5 signals/day): 10-15 trades
• Swing (few signals/week): 5-8 trades
• Logic: Bootstrap mode until this threshold; then uses Sharpe/Calmar for regime filtering
• Tradeoff: Lower = faster exit (risky, less data); Higher = more validation (safer, slower)
🌍 REGIME DETECTION:
Regime Lookback Period (20-200):
• Function: Bars used for linear regression to classify regime
• By Timeframe:
1-5min: 30-50 bars (~2-4 hour context)
15min: 40-60 bars (daily context)
1H: 50-100 bars (weekly context)
4H: 100-150 bars (monthly context)
Daily: 50-75 bars (quarterly context)
• By Market:
Crypto: 40-60 (faster regime changes)
Forex: 50-75 (moderate stability)
Stocks: 60-100 (slower structural trends)
• Tradeoff: Shorter = more regime switches (reactive); Longer = fewer switches (stable)
Trend Strength Threshold (0.1-0.8):
• Function: Minimum normalized LR slope to classify as trending vs ranging
• Lower (0.1-0.2): More markets classified as trending
• Higher (0.4-0.6): Only strong trends qualify
• Recommendations:
Choppy markets (BTC, small caps): 0.25-0.35
Smooth trends (major FX pairs): 0.30-0.40
Strong trends (indices during bull): 0.20-0.30
• Effect: Controls sensitivity of trending vs ranging classification
Vol Expansion Factor (1.2-3.0):
• Function: Volatility ratio to classify high-vol regimes (current_vol / avg_vol)
• By Asset:
Bitcoin: 1.4-1.6 (frequent vol spikes)
Altcoins: 1.3-1.5 (very volatile)
Major FX (EUR/USD): 1.6-2.0 (stable baseline)
Stocks (SPY): 1.5-1.8 (moderate)
Penny stocks: 1.3-1.4 (always volatile)
• Impact: Higher = fewer "High Vol Range" classifications; Lower = more sensitive to volatility spikes
🎯 SIGNAL GENERATION:
Base Quality Threshold (30-90):
• Function: Starting signal strength requirement (adapts per regime)
• THIS IS YOUR MAIN SIGNAL FREQUENCY CONTROL
• Conservative (70-80): Fewer, higher-quality signals
• Balanced (55-65): Moderate signal flow
• Aggressive (40-50): More signals, more noise
• By Trading Style:
Scalping (1-5min): 50-60
Day trading (15min-1H): 60-70
Swing (4H-Daily): 65-75
• Adaptive Behavior: System raises this in losing regimes (pickier), lowers in winning regimes (take more)
Min Confidence (0.1-0.9):
• Function: Minimum confidence score to fire signal
• Calculation: (Signal_Strength / 100) × Regime_Confidence
• Recommendations:
High-frequency (scalping): 0.2-0.3 (permissive)
Day trading: 0.3-0.4 (balanced)
Swing/position: 0.4-0.6 (selective)
• Interaction: During Transition regime (low regime confidence), even strong signals may fail confidence check; creates natural regime filtering
Only Trade Favorable Regimes (true/false):
• Function: Block signals in unfavorable regimes (where all strategies have negative risk-adjusted scores)
• Enabled (Recommended): Only trades when best strategy has positive Sharpe in current regime; auto-disables during bootstrap; protects capital
• Disabled: Always allows signals regardless of historical performance; use for manual regime assessment
• Bootstrap: Auto-allows trading until min_regime_samples reached, then switches to performance-based filtering
Min Bars Between Signals (1-20):
• Function: Prevents signal spam by enforcing minimum spacing
• By Timeframe:
1min: 3-5 bars (3-5 minutes)
5min: 3-6 bars (15-30 minutes)
15min: 4-8 bars (1-2 hours)
1H: 5-10 bars (5-10 hours)
4H: 3-6 bars (12-24 hours)
Daily: 2-5 bars (2-5 days)
• Logic: After signal fires, no new signals for X bars
• Tradeoff: Lower = more reactive (may overtrade); Higher = more patient (may miss reversals)
🌀 LORENTZIAN CORE:
Base Period (10-100):
• Function: Core time period for flow calculation (gets compressed by gamma)
• THIS IS YOUR PRIMARY TIMEFRAME KNOB
• By Timeframe:
1-5min scalping: 20-30 (fast response)
15min-1H day: 30-40 (balanced)
4H swing: 40-55 (smooth)
Daily position: 50-75 (very smooth)
• By Market Character:
Choppy (crypto, small caps): 25-35 (faster)
Smooth (major FX, indices): 35-50 (moderate)
Slow (bonds, utilities): 45-65 (slower)
• Gamma Effect: Actual length = base_period / gamma; High gamma compresses to ~20 bars, low gamma expands to ~50 bars
• Default 34 (Fibonacci) works well across most assets
Velocity Period (5-50):
• Function: Window for trend velocity calculation: (price_now - price ) / (N × ATR)
• By Timeframe:
1-5min scalping: 8-12 (fast momentum)
15min-1H day: 12-18 (balanced)
4H swing: 14-21 (smooth trend)
Daily: 18-30 (structural trend)
• By Market:
Crypto (fast moves): 10-14
Stocks (moderate): 14-20
Forex (smooth): 18-25
• Impact: Feeds into gamma calculation (v/c ratio); shorter = more sensitive to velocity spikes → higher gamma
• Relationship: Typically vel_period ≈ base_period / 2 to 2/3
Speed-of-Market (c) (0.5-3.0):
• Function: "Speed limit" for gamma calculation: c = realized_vol + vol_burst × c_multiplier
• By Asset Volatility:
High vol (BTC, TSLA): 1.0-1.3 (lower c = more compression)
Medium vol (SPY, EUR/USD): 1.3-1.6 (balanced)
Low vol (bonds, utilities): 1.6-2.5 (higher c = less compression)
• What It Does:
Lower c → velocity hits "speed limit" sooner → higher gamma → more compression
Higher c → velocity rarely hits limit → gamma stays near 1 → less adaptation
• Effect on Signals: More compression (low c) = faster regime detection, more responsive; Less compression (high c) = smoother, less adaptive
• Tuning: Start at 1.4; if gamma always ~1.0, lower to 1.0-1.2; if gamma spikes >5 often, raise to 1.6-2.0
Gamma Power (0.5-2.0):
• Function: Exponent applied to gamma: final_gamma = gamma^power
• Compression Strength:
0.5-0.8: Softens compression (gamma 4 → 2)
1.0: Linear (gamma 4 → 4)
1.2-2.0: Amplifies compression (gamma 4 → 16)
• Use Cases:
Reduce power (<1.0) if adaptive lengths swing too wildly or getting whipsawed
Increase power (>1.0) for more aggressive regime adaptation in fast markets
• Most users should leave at 1.0; only adjust if gamma behavior needs tuning
Max Kernel Lookback (20-200):
• Function: Computational limit for Lorentzian smoothing (performance control)
• Recommendations:
Fast PC / simple chart: 80-100
Slow PC / complex chart: 40-60
Mobile / lots of indicators: 30-50
• Impact: Each kernel smoothing loops through this many bars; higher = more accurate but slower
• Default 60 balances accuracy and speed; lower to 40-50 if indicator is slow
🎼 HARMONIC FLOW:
Short Horizon (0.2-1.0):
• Function: Fast timeframe multiplier: short_length = base_period × short_ratio / gamma
• Default: 0.5 (captures 2× faster flow than base)
• By Style:
Scalping: 0.3-0.4 (very fast)
Day trading: 0.4-0.6 (moderate)
Swing: 0.5-0.7 (balanced)
• Effect: Lower = more weight on micro-moves; Higher = smooths out fast fluctuations
Mid Horizon (0.5-2.0):
• Function: Medium timeframe multiplier: mid_length = base_period × mid_ratio / gamma
• Default: 1.0 (equals base_period, anchor timeframe)
• Usually keep at 1.0 unless specific strategy needs fine-tuning
Long Horizon (1.0-5.0):
• Function: Slow timeframe multiplier: long_length = base_period × long_ratio / gamma
• Default: 2.5 (captures trend/structure)
• By Style:
Scalping: 1.5-2.0 (less long-term influence)
Day trading: 2.0-3.0 (balanced)
Swing: 2.5-4.0 (strong trend component)
• Effect: Higher = more emphasis on larger structure; Lower = more reactive to recent price action
Short Weight (0-1):
Mid Weight (0-1):
Long Weight (0-1):
• Function: Relative importance in HFL calculation (should sum to 1.0)
• Defaults: Short: 0.45, Mid: 0.35, Long: 0.20 (day trading balanced)
• Preset Configurations:
SCALPING (fast response):
Short: 0.60, Mid: 0.30, Long: 0.10
DAY TRADING (balanced):
Short: 0.45, Mid: 0.35, Long: 0.20
SWING (trend-following):
Short: 0.25, Mid: 0.35, Long: 0.40
• Effect: More short weight = responsive but noisier; More long weight = smoother but laggier
🧠 DUAL MEMORY SYSTEM:
Enable Pattern Memory (true/false):
• Function: Master switch for KNN pattern matching via dual memory
• Enabled (Recommended): Strategy C (Memory Pattern) can fire; memory predictions influence all strategies; prediction arcs shown; heatmaps available
• Disabled: Only Strategy A and B available; faster performance (less computation); pure technical analysis (no pattern matching)
• Keep enabled for full system capabilities; disable only if CPU-constrained or testing pure flow signals
STM Size (50-200):
• Function: Short-Term Memory capacity (recent pattern storage)
• Characteristics: Fast decay (0.980), captures current regime, updates every 10 bars, tactical pattern matching
• Sizing:
Active markets (crypto): 80-120
Moderate (stocks): 100-150
Slow (bonds): 50-100
• By Timeframe:
1-15min: 60-100 (captures few hours of patterns)
1H: 80-120 (captures days)
4H-Daily: 100-150 (captures weeks/months)
• Tradeoff: More = better recent pattern coverage; Less = faster computation
• Default 100 is solid for most use cases
LTM Size (256-1024):
• Function: Long-Term Memory capacity (validated pattern storage)
• Characteristics: Slow decay (0.997), only high-quality patterns (gated), regime-specific recall, strategic pattern library
• Sizing:
Fast PC: 512-768
Medium PC: 384-512
Slow PC/Mobile: 256-384
• By Data Needs:
High-frequency (lots of patterns): 512-1024
Moderate activity: 384-512
Low-frequency (swing): 256-384
• Performance Impact: Each KNN search loops through entire LTM; 512 = good balance of coverage and speed; if slow, drop to 256-384
• Fills over weeks/months with validated patterns
STM Decay (0.95-0.995):
• Function: Short-Term Memory age decay rate: age_weight = decay^bars_since_pattern
• Decay Rates:
0.950: Aggressive fade (50% weight after 14 bars)
0.970: Moderate fade (50% after 23 bars)
0.980: Balanced (50% after 35 bars)
0.990: Slow fade (50% after 69 bars)
• By Timeframe:
1-5min: 0.95-0.97 (fast markets, old patterns irrelevant)
15min-1H: 0.97-0.98 (balanced)
4H-Daily: 0.98-0.99 (slower decay)
• Philosophy: STM should emphasize RECENT patterns; lower decay = only very recent matters; 0.980 works well for most cases
LTM Decay (0.99-0.999):
• Function: Long-Term Memory age decay rate
• Decay Rates:
0.990: 50% weight after 69 bars
0.995: 50% weight after 138 bars
0.997: 50% weight after 231 bars
0.999: 50% weight after 693 bars
• Philosophy: LTM should retain value for LONG periods; pattern from 6 months ago might still matter
• Usage:
Fast-changing markets: 0.990-0.995
Stable markets: 0.995-0.998
Structural patterns: 0.998-0.999
• Warning: Be careful with very high decay (>0.998); market structure changes, old patterns may mislead
• 0.997 balances long-term memory with regime evolution
K Neighbors (3-21):
• Function: Number of similar patterns to query in KNN search
• By Sample Size:
Small dataset (<100 patterns): 3-5
Medium dataset (100-300): 5-8
Large dataset (300-1000): 8-13
Very large (>1000): 13-21
• Tradeoff:
Fewer K (3-5): More reactive to closest matches; noisier; outlier-sensitive; better when patterns very distinct
More K (13-21): Smoother, more stable predictions; may dilute strong signals; better when patterns overlap
• Rule of Thumb: K ≈ √(memory_size) / 3; For STM=100, LTM=512: K ≈ 8-10 ideal
Adaptive Quality Gate (true/false):
• Function: Adapts LTM entry threshold per regime based on Sharpe ratio
• Enabled: Quality gate adapts: Low Sharpe → RAISE gate (demand better patterns); High Sharpe → LOWER gate (accept more patterns); each regime has independent gate
• Disabled: Fixed quality gate (0.4 default) for all regimes
• Recommended: Keep ENABLED; helps LTM focus on proven pattern types per regime; prevents weak patterns from polluting memory
🎯 MULTI-STRATEGY SYSTEM:
Enable Strategy Learning (true/false):
• Function: Core learning feature for regime-specific strategy selection
• Enabled: Tracks 3 strategies × 5 regimes = 15 performance matrices; selects best strategy per regime via Sharpe/Calmar/WinRate; adaptive strategy switching
• Disabled: All strategies fire simultaneously (weighted combination); no regime-specific selection; simpler but less adaptive
• Recommended: ENABLED (this is the core of the adaptive system); disable only for testing or simplification
Strategy A Weight (0-1):
• Function: Weight for Strategy A (Squeeze Breakout) when multi-strategy disabled
• Characteristics: Fires on Bollinger squeeze release; best in Low Vol Range, Transition; compression → expansion pattern
• When Multi-Strategy OFF: Default 0.33 (equal weight); increase to 0.4-0.5 for choppy ranges with breakouts; decrease to 0.2-0.3 for trending markets
• When Multi-Strategy ON: This is ignored (system auto-selects based on performance)
Strategy B Weight (0-1):
• Function: Weight for Strategy B (Lorentzian Flow) when multi-strategy disabled
• Characteristics: Fires on strong HFL + velocity + gamma; best in Trending Bull/Bear; momentum → acceleration pattern
• When Multi-Strategy OFF: Default 0.33; increase to 0.4-0.5 for trending markets; decrease to 0.2-0.3 for choppy/ranging markets
• When Multi-Strategy ON: Ignored (auto-selected)
Strategy C Weight (0-1):
• Function: Weight for Strategy C (Memory Pattern) when multi-strategy disabled
• Characteristics: Fires when dual KNN predicts strong move; best in High Vol Range; requires memory system enabled + sufficient data
• When Multi-Strategy OFF: Default 0.34; increase to 0.4-0.6 if strong pattern repetition and LTM has >200 patterns; decrease to 0.2-0.3 if new to system; set to 0.0 if memory disabled
• When Multi-Strategy ON: Ignored (auto-selected)
📚 PRE-TRAINING:
Historical Pre-Training (true/false):
• Function: Bootstrap feature that fills memory on chart load
• Enabled: Scans past bars to populate STM/LTM before live trading; calculates historical outcomes (10-bar forward returns); builds initial pattern library; system starts with context, not blank slate
• Disabled: Memories only populate in real-time; takes weeks to build pattern library
• Recommended: ENABLED (critical for avoiding "cold start" problem); disable only for testing clean learning
Training Bars (50-500):
• Function: How many historical bars to scan on load (limited by available history)
• Recommendations:
1-5min charts: 200-300 (few hours of history)
15min-1H: 200-400 (days/weeks)
4H: 300-500 (months)
Daily: 200-400 (years)
• Performance:
100 bars: ~1 second
300 bars: ~2-3 seconds
500 bars: ~4-5 seconds
• Sweet Spot: 200-300 (enough patterns without slow load)
• If chart loads slowly: Reduce to 100-150
🎨 VISUALIZATION:
Show Regime Background (true/false):
• Function: Color-code background by current regime
• Colors: Trending Bull (green tint), Trending Bear (red tint), High Vol Range (orange tint), Low Vol Range (blue tint), Transition (purple tint)
• Helps visually track regime changes
Show Flow Bands (true/false):
• Function: Plot upper/lower bands based on HFL strength
• Shows dynamic support/resistance zones; green fill = bullish flow; red fill = bearish flow
• Useful for visual trend confirmation
Show Confidence Meter (true/false):
• Function: Plot signal confidence (0-100) in separate pane
• Calculation: (Signal_Strength / 100) × Regime_Confidence
• Gold line = current confidence; dashed line = minimum threshold
• Signals fire when confidence exceeds threshold
Show Prediction Arc (true/false):
• Function: Dashed line projecting expected price move based on memory prediction
• NOT a price target - a probability vector; steep arc = strong expected move; flat arc = weak/uncertain prediction
• Green = bullish prediction; red = bearish prediction
Show Signals (true/false):
• Function: Triangle markers at entry points
• ▲ Green = Long signal; ▼ Red = Short signal
• Markers show on bar close (non-repainting)
🏆 DASHBOARD:
Show Dashboard (true/false):
• Function: Main info panel showing all system metrics
• Sections: Lorentzian Core, Regime, Dual Memory, Adaptive Parameters, Regime Performance, Shadow Portfolios, Current Signal Status
• Essential for understanding system state
Dashboard Position: Top Left, Top Right, Bottom Left, Bottom Right
Individual Section Toggles:
• System Stats: Lorentzian Core section (Gamma, v/c, HFL, TCI)
• Memory Stats: Dual Memory section (STM/LTM predictions, agreement)
• Shadow Portfolios: Shadow Portfolio table (equity, win%, PF)
• Adaptive Params: Adaptive Parameters section (threshold, quality gate, flow mult)
🔥 HEATMAPS:
Show Dual Heatmaps (true/false):
• Function: Visual pattern density maps for STM and LTM
• Layout: X-axis = pattern age (left=recent, right=old); Y-axis = outcome direction (top=bearish, bottom=bullish); Color intensity = pattern count; Color hue = bullish (green) vs bearish (red)
• Warning: Can clutter chart; disable if not using
Heatmap Position: Screen position for heatmaps (STM at selected position, LTM offset)
Resolution (5-15):
• Function: Grid resolution (bins)
• Higher = more detailed but smaller cells; Lower = clearer but less granular
• 10 is good balance; reduce to 6-8 if hard to read
PART 11: DASHBOARD METRICS EXPLAINED
The comprehensive dashboard provides real-time transparency into every aspect of the adaptive system:
⚡ LORENTZIAN CORE SECTION:
Gamma (γ):
• Range: 1.0 to ~10.0 (capped)
• Interpretation:
γ ≈ 1.0-1.2: Normal market time, low velocity
γ = 1.5-2.5: Moderate compression, trending
γ = 3.0-5.0: High compression, explosive moves
γ > 5.0: Extreme compression, parabolic volatility
• Usage: High gamma = system operating in compressed time; expect shorter effective periods and faster adaptation
v/c (Velocity / Speed Limit):
• Range: 0.0 to 0.999 (approaches but never reaches 1.0)
• Interpretation:
v/c < 0.3: Slow market, low momentum
v/c = 0.4-0.7: Moderate trending
v/c > 0.7: Approaching "speed limit," high velocity
v/c > 0.9: Parabolic move, system at limit
• Color Coding: Red (>0.7), Gold (0.4-0.7), Green (<0.4)
• Usage: High v/c warns of extreme conditions where trend may exhaust
HFL (Harmonic Flow):
• Range: Typically -3.0 to +3.0 (can exceed in extremes)
• Interpretation:
HFL > 0: Bullish flow
HFL < 0: Bearish flow
|HFL| > 0.5: Strong directional bias
|HFL| < 0.2: Weak, indecisive
• Color: Green (positive), Red (negative)
• Usage: Primary directional indicator; strategies often require HFL confirmation
TCI (Temporal Compression Index):
• Calculation: base_period / compressed_length
• Interpretation:
TCI ≈ 1.0: No compression, normal time
TCI = 1.5-2.5: Moderate compression
TCI > 3.0: Significant compression
• Usage: Shows how much time is being compressed; mirrors gamma but more intuitive
╔═══ REGIME SECTION ═══╗
Current:
• Display: Regime name with icon (Trending Bull ↗, Trending Bear ↘, High Vol Range ↔, Low Vol Range —, Transition ⚡)
• Color: Gold for visibility
• Usage: Know which regime you're in; check regime performance to see expected strategy behavior
Confidence:
• Range: 0-100%
• Interpretation:
>70%: Very clear regime definition
40-70%: Moderate clarity
<40%: Ambiguous, mixed conditions
• Color: Green (>70%), Gold (40-70%), Red (<40%)
• Usage: High confidence = trust regime classification; low confidence = regime may be transitioning
Mode:
• States:
🔥 BOOTSTRAP (X/10): Still gathering data for this regime
✅ FAVORABLE: Best strategy has positive risk-adjusted score (>0.5)
⚠️ UNFAVORABLE: All strategies have negative scores (≤0.5)
• Color: Orange (bootstrap), Green (favorable), Red (unfavorable)
• Critical Importance: This tells you whether the system will trade or stand aside (if regime filter enabled)
╔═══ DUAL MEMORY KNN SECTION ═══╗
STM (Size):
• Display: Number of patterns currently in STM (0 to stm_size)
• Interpretation: Should fill to capacity within hours/days; if not filling, check that memory is enabled
STM Pred:
• Range: Typically -0.05 to +0.05 (representing -5% to +5% expected 10-bar move)
• Color: Green (positive), Red (negative)
• Usage: STM's prediction based on recent patterns; emphasis on current regime
LTM (Size):
• Display: Number of patterns in LTM (0 to ltm_size)
• Interpretation: Fills slowly (weeks/months); only validated high-quality patterns; check quality gate if not filling
LTM Pred:
• Range: Similar to STM pred
• Color: Green (positive), Red (negative)
• Usage: LTM's prediction based on long-term validated patterns; more strategic than tactical
Agreement:
• Display:
✅ XX%: Strong agreement (>70%) - both memories aligned
⚠️ XX%: Moderate agreement (40-70%) - some disagreement
❌ XX%: Conflict (<40%) - memories strongly disagree
• Color: Green (>70%), Gold (40-70%), Red (<40%)
• Critical Usage: Low agreement often precedes regime change or signals novel conditions; Strategy C won't fire with low agreement
╔═══ ADAPTIVE PARAMS SECTION ═══╗
Threshold:
• Display: Current regime's signal quality threshold (30-90)
• Interpretation: Higher = pickier; lower = more permissive
• Watch For: If steadily rising in a regime, system is struggling (low win rate); if falling, system is confident
• Default: Starts at base_quality_threshold (usually 60)
Quality:
• Display: Current regime's LTM quality gate (0.2-0.8)
• Interpretation: Minimum quality score for pattern to enter LTM
• Watch For: If rising, system demanding higher-quality patterns; if falling, accepting more diverse patterns
• Default: Starts at 0.4
Flow Mult:
• Display: Current regime's flow multiplier (0.5-2.0)
• Interpretation: Amplifies or dampens HFL for Strategy B
• Watch For: If >1.2, system found strong edge in flow signals; if <0.8, flow signals underperforming
• Default: Starts at 1.0
Learning:
• Display: ✅ ON or ❌ OFF
• Shows whether adaptive learning is enabled
• Color: Green (on), Red (off)
╔═══ REGIME PERFORMANCE SECTION ═══╗
This table shows ONLY the current regime's statistics:
S (Strategy):
• Display: A, B, or C
• Color: Gold if selected strategy; gray if not
• Shows which strategies have data in this regime
Trades:
• Display: Number of completed trades for this pair
• Interpretation: Blank or low numbers mean bootstrap mode; >10 means statistical significance building
Win%:
• Display: Win rate percentage
• Color: Green (>55%), White (45-55%), Red (<45%)
• Interpretation: 52%+ is good; 58%+ is excellent; <45% means struggling
• Note: Short-term variance is normal; judge after 20+ trades
Sharpe:
• Display: Annualized Sharpe ratio
• Color: Green (>1.0), White (0-1.0), Red (<0)
• Interpretation:
>2.0: Exceptional (rare)
1.0-2.0: Good
0.5-1.0: Acceptable
0-0.5: Marginal
<0: Losing
• Usage: Primary metric for strategy selection (60% weight in score)
╔═══ SHADOW PORTFOLIOS SECTION ═══╗
Shows virtual equity tracking across ALL regimes (not just current):
S (Strategy):
• Display: A, B, or C
• Color: Gold if currently selected strategy; gray otherwise
Equity:
• Display: Current virtual balance (starts $10,000)
• Color: Green (>$10,000), White ($9,500-$10,000), Red (<$9,500)
• Interpretation: Which strategy is actually making virtual money across all conditions
• Note: 10% risk per trade assumed
Win%:
• Display: Overall win rate across all regimes
• Color: Green (>55%), White (45-55%), Red (<45%)
• Interpretation: Aggregate performance; strategy may do well in some regimes and poorly in others
PF (Profit Factor):
• Display: Gross profit / gross loss
• Color: Green (>1.5), White (1.0-1.5), Red (<1.0)
• Interpretation:
>2.0: Excellent
1.5-2.0: Good
1.2-1.5: Acceptable
1.0-1.2: Marginal
<1.0: Losing
• Usage: Confirms win rate; high PF with moderate win rate means winners >> losers
╔═══ STATUS BAR ═══╗
Display States:
• 🟢 LONG: Currently in long position (green background)
• 🔴 SHORT: Currently in short position (red background)
• ⬆️ LONG SIGNAL: Long signal present but not yet confirmed (waiting for bar close)
• ⬇️ SHORT SIGNAL: Short signal present but not yet confirmed
• ⚪ NEUTRAL: No position, no signal (white background)
Usage: Immediate visual confirmation of system state; check before manually entering/exiting
PART 12: VISUAL ELEMENT INTERPRETATION
REGIME BACKGROUND COLORS:
Green Tint: Trending Bull regime - expect Strategy B (Flow) to dominate; focus on long momentum
Red Tint: Trending Bear regime - expect Strategy B (Flow) shorts; focus on short momentum
Orange Tint: High Vol Range - expect Strategy A (Squeeze) or C (Memory); trade breakouts or patterns
Blue Tint: Low Vol Range - expect Strategy A (Squeeze); wait for compression release
Purple Tint: Transition regime - often unfavorable; system may stand aside; high uncertainty
Usage: Quick visual regime identification without reading dashboard
FLOW BANDS:
Upper Band: close + HFL × ATR × 1.5
Lower Band: close - HFL × ATR × 1.5
Green Fill: HFL positive (bullish flow); bands act as dynamic support/resistance in uptrend
Red Fill: HFL negative (bearish flow); bands act as dynamic resistance/support in downtrend
Usage:
• Bullish flow: Price bouncing off lower band = trend continuation; breaking below = possible reversal
• Bearish flow: Price rejecting upper band = trend continuation; breaking above = possible reversal
CONFIDENCE METER (Separate Pane):
Gold Line: Current signal confidence (0-100)
Dashed Line: Minimum confidence threshold
Interpretation:
• Line above threshold: Signal likely to fire if strength sufficient
• Line below threshold: Even if signal logic met, won't fire (insufficient confidence)
• Gradual rise: Signal building strength
• Sharp spike: Sudden conviction (check if sustainable)
Usage: Real-time signal probability; helps anticipate upcoming entries
PREDICTION ARC:
Dashed Line: Projects from current close to expected price 8 bars forward
Green Arc: Bullish memory prediction
Red Arc: Bearish memory prediction
Steep Arc: High conviction (strong expected move)
Flat Arc: Low conviction (weak/uncertain move)
Important: NOT a price target; this is a probability vector based on KNN outcomes; actual price may differ
Usage: Directional bias from pattern matching; confirms or contradicts flow signals
SIGNAL MARKERS:
▲ Green Triangle (below bar):
• Long signal confirmed on bar close
• Entry on next bar open
• Non-repainting (appears after bar closes)
▼ Red Triangle (above bar):
• Short signal confirmed on bar close
• Entry on next bar open
• Non-repainting
Size: Tiny (unobtrusive)
Text: "L" or "S" in marker
Usage: Historical signal record; alerts should fire on these; verify against dashboard status
DUAL HEATMAPS (If Enabled):
STM HEATMAP:
• X-axis: Pattern age (left = recent, right = older, typically 0-50 bars)
• Y-axis: Outcome direction (top = bearish outcomes, bottom = bullish outcomes)
• Color Intensity: Brightness = pattern count in that cell
• Color Hue: Green tint (bullish), Red tint (bearish), Gray (neutral)
Interpretation:
• Dense bottom-left: Many recent bullish patterns (bullish regime)
• Dense top-left: Many recent bearish patterns (bearish regime)
• Scattered: Mixed outcomes, ranging regime
• Empty areas: Few patterns (low data)
LTM HEATMAP:
• Similar layout but X-axis spans wider age range (0-500+ bars)
• Shows long-term pattern distribution
• Denser = more validated patterns
Comparison Usage:
• If STM and LTM heatmaps look similar: Current regime matches historical patterns (high agreement)
• If STM bottom-heavy but LTM top-heavy: Recent bullish activity contradicts historical bearish patterns (low agreement, transition signal)
PART 13: DEVELOPMENT STORY
The creation of the Lorentzian Harmonic Flow Adaptive ML system represents over six months of intensive research, mathematical exploration, and iterative refinement. What began as a theoretical investigation into applying special relativity to market time evolved into a complete adaptive learning framework.
THE CHALLENGE:
The fundamental problem was this: markets don't experience time uniformly, yet every indicator treats a 50-period calculation the same whether markets are exploding or sleeping. Traditional adaptive indicators adjust parameters based on volatility, but this is reactive—by the time you measure high volatility, the explosive move is over. What was needed was a framework that measured the market's intrinsic velocity relative to its own structural limits, then compressed time itself proportionally.
THE LORENTZIAN INSIGHT:
Einstein's special relativity provides exactly this framework through the Lorentz factor. When an object approaches the speed of light, time dilates—but from the object's reference frame, it experiences time compression. By treating price velocity as analogous to relativistic velocity and volatility structure as the "speed limit," we could calculate a gamma factor that compressed lookback periods during explosive moves.
The mathematics were straightforward in theory but devilishly complex in implementation. Pine Script has no native support for dynamically-sized arrays or recursive functions, forcing creative workarounds. The Lorentzian kernel smoothing required nested loops through historical bars, calculating kernel weights on the fly—a computational nightmare. Early versions crashed or produced bizarre artifacts (negative gamma values, infinite loops during volatility spikes).
Optimization took weeks. Limiting kernel lookback to 60 bars while still maintaining smoothing quality. Pre-calculating gamma once per bar and reusing it across all calculations. Caching intermediate results. The final implementation balances mathematical purity with computational reality.
THE MEMORY ARCHITECTURE:
With temporal compression working, the next challenge was pattern memory. Simple moving average systems have no memory—they forget yesterday's patterns immediately. But markets are non-stationary; what worked last month may not work today. The solution: dual-memory architecture inspired by cognitive neuroscience.
Short-Term Memory (STM) would capture tactical patterns—the hippocampus of the system. Fast encoding, fast decay, always current. Long-Term Memory (LTM) would store validated strategic patterns—the neocortex. Slow consolidation, persistent storage, regime-spanning wisdom.
The KNN implementation nearly broke me. Calculating Lorentzian distance across 6 dimensions for 500+ patterns per query, applying age decay, filtering by regime, finding K nearest neighbors without native sorting functions—all while maintaining sub-second execution. The breakthrough came from realizing we could use destructive sorting (marking found neighbors as "infinite distance") rather than maintaining separate data structures.
Pre-training was another beast. To populate memory with historical patterns, the system needed to scan hundreds of past bars, calculate forward outcomes, and insert patterns—all on chart load without timing out. The solution: cap at 200 bars, optimize loops, pre-calculate features. Now it works seamlessly.
THE REGIME DETECTION:
Five-regime classification emerged from empirical observation. Traditional trending/ranging dichotomy missed too much nuance. Markets have at least four distinct states: trending up, trending down, volatile range, quiet range—plus a chaotic transition state. Linear regression slope quantifies trend; volatility ratio quantifies expansion; combining them creates five natural clusters.
But classification is useless without regime-specific learning. That meant tracking 15 separate performance matrices (3 strategies × 5 regimes), computing Sharpe ratios and Calmar ratios for sparse data, implementing Bayesian-like strategy selection. The bootstrap mode logic alone took dozens of iterations—too strict and you never get data, too permissive and you blow up accounts during learning.
THE ADAPTIVE LAYER:
Parameter adaptation was conceptually elegant but practically treacherous. Each regime needed independent thresholds, quality gates, and multipliers that adapted based on outcomes. But naive gradient descent caused oscillations—win a few trades, lower threshold, take worse signals, lose trades, raise threshold, miss good signals. The solution: exponential smoothing via learning rate (α) and separate scoring for selection vs adaptation.
Shadow portfolios provided objective validation. By running virtual accounts for all strategies simultaneously, we could see which would have won even when not selected. This caught numerous bugs where selection logic was sound but execution was flawed, or vice versa.
THE DASHBOARD & VISUALIZATION:
A learning system is useless if users can't understand what it's doing. The dashboard went through five complete redesigns. Early versions were information dumps—too much data, no hierarchy, impossible to scan. The final version uses visual hierarchy (section headers, color coding, strategic whitespace) and progressive disclosure (show current regime first, then performance, then parameters).
The dual heatmaps were a late addition but proved invaluable for pattern visualization. Seeing STM cluster in one corner while LTM distributed broadly immediately signals regime novelty. Traders grasp this visually faster than reading disagreement percentages.
THE TESTING GAUNTLET:
Testing adaptive systems is uniquely challenging. Static backtest results mean nothing—the system should improve over time. Early "tests" showed abysmal performance because bootstrap periods were included. The breakthrough: measure pre-learning baseline vs post-learning performance. A system going from 48% win rate (first 50 trades) to 56% win rate (trades 100-200) is succeeding even if absolute performance seems modest.
Edge cases broke everything repeatedly. What happens when a regime never appears in historical data? When all strategies fail simultaneously? When memory fills with only bearish patterns during a bull run? Each required careful handling—bootstrap modes, forced diversification, quality gates.
THE DOCUMENTATION:
This isn't an indicator you throw on a chart with default settings and trade immediately. It's a learning system that requires understanding. The input tooltips alone contain over 10,000 words of guidance—market-specific recommendations, timeframe-specific settings, tradeoff explanations. Every parameter needed not just a description but a philosophical justification and practical tuning guide.
The code comments span 500+ lines explaining theory, implementation decisions, edge cases. Future maintainers (including myself in six months) need to understand not just what the code does but why certain approaches were chosen over alternatives.
WHAT ALMOST DIDN'T WORK:
The entire project nearly collapsed twice. First, when initial Lorentzian smoothing produced complete noise—hours of debugging revealed a simple indexing error where I was accessing instead of in the kernel loop. One character, entire system broken.
Second, when memory predictions showed zero correlation with outcomes. Turned out the KNN distance metric was dominated by the gamma dimension (values 1-10) drowning out normalized features (values -1 to 1). Solution: apply kernel transformation to all dimensions, not just final distance. Obvious in retrospect, maddening at the time.
THE PHILOSOPHY:
This system embodies a specific philosophy: markets are learnable but non-stationary. No single strategy works forever, but regime-specific patterns persist. Time isn't uniform, memory isn't perfect, prediction isn't possible—but probabilistic edges exist for those willing to track them rigorously.
It rejects the premise that indicators should give universal advice. Instead, it says: "In this regime, based on similar past states, Strategy B has a 58% win rate and 1.4 Sharpe. Strategy A has 45% and 0.2 Sharpe. I recommend B. But we're still in bootstrap for Strategy C, so I'm gathering data. Check back in 5 trades."
That humility—knowing what it knows and what it doesn't—is what makes it robust.
PART 14: PROFESSIONAL USAGE PROTOCOL
PHASE 1: DEPLOYMENT (Week 1-4)
Initial Setup:
1. Load indicator on primary trading chart with default settings
2. Verify historical pre-training enabled (should see ~200 patterns in STM/LTM on first load)
3. Enable all dashboard sections for maximum transparency
4. Set alerts but DO NOT trade real money
Observation Checklist:
• Dashboard Validation:
✓ Lorentzian Core shows reasonable gamma (1-5 range, not stuck at 1.0 or spiking to 10)
✓ HFL oscillates with price action (not flat or random)
✓ Regime classifications make intuitive sense
✓ Confidence scores vary appropriately
• Memory System:
✓ STM fills within first few hours/days of real-time bars
✓ LTM grows gradually (few patterns per day, quality-gated)
✓ Predictions show directional bias (not always 0.0)
✓ Agreement metric fluctuates with regime changes
• Bootstrap Tracking:
✓ Dashboard shows "🔥 BOOTSTRAP (X/10)" for each regime
✓ Trade counts increment on regime-specific signals
✓ Different regimes reach threshold at different rates
Paper Trading:
• Take EVERY signal (ignore unfavorable warnings during bootstrap)
• Log each trade: entry price, regime, selected strategy, outcome
• Calculate your actual P&L assuming proper risk management (1-2% risk per trade)
• Do NOT judge system performance yet—focus on understanding behavior
Troubleshooting:
• No signals for days:
- Check base_quality_threshold (try lowering to 50-55)
- Verify enable_regime_filter not blocking all regimes
- Confirm signal confidence threshold not too high (try 0.25)
• Signals every bar:
- Raise base_quality_threshold to 65-70
- Increase min_bars_between to 8-10
- Check if gamma spiking excessively (raise c_multiplier)
• Memory not filling:
- Confirm enable_memory = true
- Verify historical pre-training completed (check STM size after load)
- May need to wait 10 bars for first real-time update
PHASE 2: VALIDATION (Week 5-12)
Statistical Emergence:
By week 5-8, most regimes should exit bootstrap. Look for:
✓ Regime Performance Clarity:
- At least 2-3 strategies showing positive Sharpe in their favored regimes
- Clear separation (Strategy B strong in Trending, Strategy A strong in Low Vol Range, etc.)
- Win rates stabilizing around 50-60% for winning strategies
✓ Shadow Portfolio Divergence:
- Virtual portfolios showing clear winners ($10K → $11K+) and losers ($10K → $9K-)
- Profit factors >1.3 for top strategy
- System selection aligning with best shadow portfolio
✓ Parameter Adaptation:
- Thresholds varying per regime (not stuck at initial values)
- Quality gates adapting (some regimes higher, some lower)
- Flow multipliers showing regime-specific optimization
Validation Questions:
1. Do patterns make intuitive sense?
- Strategy B (Flow) dominating Trending Bull/Bear? ✓ Expected
- Strategy A (Squeeze) succeeding in Low Vol Range? ✓ Expected
- Strategy C (Memory) working in High Vol Range? ✓ Expected
- Random strategy winning everywhere? ✗ Problem
2. Is unfavorable filtering working?
- Regimes with negative Sharpe showing "⚠️ UNFAVORABLE"? ✓ System protecting capital
- Transition regime often unfavorable? ✓ Expected
- All regimes perpetually unfavorable? ✗ Settings too strict or asset unsuitable
3. Are memories agreeing appropriately?
- High agreement during stable regimes? ✓ Expected
- Low agreement during transitions? ✓ Expected (novel conditions)
- Perpetual conflict? ✗ Check memory sizes or decay rates
Fine-Tuning (If Needed):
Too Many Signals in Losing Regimes:
→ Increase learning_rate to 0.07-0.08 (faster adaptation)
→ Raise base_quality_threshold by 5-10 points
→ Enable regime filter if disabled
Missing Profitable Setups:
→ Lower base_quality_threshold by 5-10 points
→ Reduce min_confidence to 0.25-0.30
→ Check if bootstrap mode blocking trades (let it complete)
Excessive Parameter Swings:
→ Reduce learning_rate to 0.03-0.04
→ Increase min_regime_samples to 15-20 (more data before adaptation)
Memory Disagreement Too Frequent:
→ Increase LTM size to 768-1024 (broader pattern library)
→ Lower adaptive_quality_gate requirement (allow more patterns)
→ Increase K neighbors to 10-12 (smoother predictions)
PHASE 3: LIVE TRADING (Month 4+)
Pre-Launch Checklist:
1. ✓ At least 3 regimes show positive Sharpe (>0.8)
2. ✓ Top shadow portfolio shows >53% win rate and >1.3 profit factor
3. ✓ Parameters have stabilized (not changing more than 10% per month)
4. ✓ You understand every dashboard metric and can explain regime/strategy behavior
5. ✓ You have proper risk management plan independent of this system
Position Sizing:
Conservative (Recommended for Month 4-6):
• Risk per trade: 0.5-1.0% of account
• Max concurrent positions: 1-2
• Total exposure: 10-25% of intended full size
Moderate (Month 7-12):
• Risk per trade: 1.0-1.5% of account
• Max concurrent positions: 2-3
• Total exposure: 25-50% of intended size
Full Scale (Year 2+):
• Risk per trade: 1.5-2.0% of account
• Max concurrent positions: 3-5
• Total exposure: 100% (still following risk limits)
Entry Execution:
On Signal Confirmation:
1. Verify dashboard shows signal type (▲ LONG or ▼ SHORT)
2. Check regime mode (avoid if "⚠️ UNFAVORABLE" unless testing)
3. Note selected strategy (A/B/C) and its regime Sharpe
4. Verify memory agreement if Strategy C selected (want >60%)
Entry Method:
• Market entry: Next bar open after signal (for exact backtest replication)
• Limit entry: Slight improvement (2-3 ticks) if confident in direction
Stop Loss Placement:
• Strategy A (Squeeze): Beyond opposite band or recent swing point
• Strategy B (Flow): 1.5-2.0 ATR from entry against direction
• Strategy C (Memory): Based on predicted move magnitude (tighter if pred > 2%)
Exit Management:
System Exit Signals:
• Opposite signal fires: Immediate exit, potential reversal entry
• 20 bars no exit signal: System implies position stale, consider exiting
• Regime changes to unfavorable: Tighten stop, consider partial exit
Manual Exit Conditions:
• Stop loss hit: Take loss, log for validation (system expects some losses)
• Profit target hit: If using fixed targets (2-3R typical)
• Major news event: Flatten during high-impact news (system can't predict these)
Warning Signs (Exit Criteria):
🚨 Stop Trading If:
1. All regimes show negative Sharpe for 4+ weeks (market structure changed)
2. Your results >20% worse than shadow portfolios (execution problem)
3. Parameters hitting extremes (thresholds >85 or <35 across all regimes)
4. Memory agreement <30% for extended periods (unprecedented conditions)
5. Account drawdown >20% (risk management failure, system or otherwise)
⚠️ Reduce Size If:
1. Win rate drops 10%+ from peak (temporary regime shift)
2. Selected strategy underperforming another by >30% (selection lag)
3. Consecutive losses >5 (variance or problem, reduce until clarity)
4. Major market regime change (Fed policy shift, war, etc. - let system re-adapt)
PART 15: THEORETICAL IMPLICATIONS & LIMITATIONS
WHAT THIS SYSTEM REPRESENTS:
Contextual Bandits:
The regime-specific strategy selection implements a contextual multi-armed bandit problem. Each strategy is an "arm," each regime is a "context," and we select arms to maximize expected reward given context. This is reinforcement learning applied to trading.
Experience Replay:
The dual-memory architecture mirrors DeepMind's DQN breakthrough. STM = recent experience buffer; LTM = validated experience replay. This prevents catastrophic forgetting while enabling rapid adaptation—a key challenge in neural network training.
Meta-Learning:
The system learns how to learn. Parameter adaptation adjusts the system's own sensitivity and selectivity based on outcomes. This is "learning to learn"—optimizing the optimization process itself.
Non-Stationary Optimization:
Traditional backtesting assumes stationarity (past patterns persist). This system assumes non-stationarity and continuously adapts. The goal isn't finding "the best parameters" but tracking the moving optimum.
Regime-Conditional Policies:
Rather than a single strategy for all conditions, this implements regime-specific policies. This is contextual decision-making—environment state determines action selection.
FINAL WISDOM:
"The market is a complex adaptive system. To trade it successfully, one must also adapt. This indicator provides the framework—memory, learning, regime awareness—but wisdom comes from understanding when to trade, when to stand aside, and when to defer to conditions the system hasn't yet learned. The edge isn't in the algorithm alone; it's in the partnership between mathematical rigor and human judgment."
— Inspired by the intersection of Einstein's relativity, Kahneman's behavioral economics, and decades of quantitative trading research
Taking you to school. — Dskyz, Trade with insight. Trade with anticipation.

Willy ORB for Gold – Session Presets (NY 5m)What it does:
Plots the opening-range high/low for the main Gold sessions (Shanghai, Tokyo, Sydney, Frankfurt, London, New York 5-minute OR by default). It projects TP1/TP2 expansion targets, supports a timezone offset so opens line up with your broker, and includes breakout alerts on confirmed closes.
⸻
Why it’s Gold-friendly
• New York (COMEX pit): 5-minute opening range at ~20:20 local (via your offset) to capture the most active burst.
• London / Frankfurt: strong European volatility windows for XAU/USD.
• Shanghai / Tokyo / Sydney: structure-setting sessions before momentum builds.
⸻
Features
• Session presets: SH, TK, SY, FR, LDN, NY (5m) — toggle individually
• 15m OR for all sessions except NY (5m) by default (editable per session)
• TP1 / TP2 expansion targets (user-defined multiples)
• Labels for 15m/5m range and targets; customizable styles
• Timezone offset control (aligns lines to your local clock)
• Daily auto-reset for clean levels
• Alerts: “Closed Above Range High” / “Closed Below Range Low” per session
⸻
How to use
1. Add to chart (best on 1–15m).
2. In settings → Gold Sessions, toggle the sessions you want.
3. Set “My time offset from chart (hours)” so session lines match your broker time.
4. Trade the breakouts: when price closes beyond the session high/low, TP levels plot automatically.
⸻
Parameters (quick guide)
• Targets: TP1/TP2 multiples (e.g., 1.0 and 2.0).
• Labels: left/right label placement, line styles/colors.
• Sessions: enable/disable + choose each session’s OR length (NY defaults to 5m).
⸻
Tips for XAU/USD
• London often gives the cleanest first breakout.
• New York tends to drive continuation after data releases.
• Consider pairing with volume/volatility or HTF trend for confluence.
⸻
Notes
• Built in Pine Script v6.
• Indicator (not a strategy). For backtests, use a companion strategy that trades the closes beyond the OR with SL at the opposite side and TP by R.
⸻
Disclaimer
For educational purposes only. Not financial advice. Always backtest and manage risk.

Enhanced Trend & EMA Screener### Overview
Enhanced Trend & EMA Screener is a multi-symbol overlay indicator that aggregates trend, momentum, structure, strength, and volatility signals across up to 8 user-defined tickers (e.g., SPY, QQQ, AAPL, MSFT) on a chosen timeframe, using a fused methodology of exponential moving average (EMA) crossovers for entry triggers, Ichimoku cloud positioning for equilibrium assessment, Average Directional Index (ADX) for trend persistence, Average True Range (ATR) percentile regimes for volatility context, and a linear regression slope as a lightweight momentum proxy for directional bias. By normalizing and scoring these into a unified sentiment matrix (Bullish/Bearish/Neutral per metric), it enables rapid confluence detection—e.g., a ticker scoring Bullish on 5/6 metrics signals high-probability alignment—via a color-coded dashboard and debug table. Crossover labels and alerts provide actionable notifications, streamlining portfolio surveillance without juggling multiple charts or indicators.
### Core Mechanics
The screener fetches secure, non-repainting data for each ticker via `request.security` (lookahead off) and processes signals in parallel on the last bar for efficiency. Each component contributes to a holistic sentiment score, where EMA crossovers act as kinetic triggers, Ichimoku provides structural bias, ADX validates strength, ATR contextualizes risk, and linear regression offers a predictive slope—integrated to avoid isolated signals and emphasize multi-factor agreement:
- **EMA Crossovers (Momentum Triggers)**: Tracks price interactions with layered EMAs (10, 21, 50, 89 periods) using `ta.crossover`/`ta.crossunder`. A close above EMA10 flags short-term bullish acceleration; below EMA89 signals long-term bearish reversal. These serve as the "spark" for alerts/labels (e.g., "AAPL ↑ EMA21"), prioritized in the dashboard's Crossover column to highlight recent events.
- **Ichimoku Cloud Positioning (Equilibrium Structure)**: Computes Tenkan-sen (9-period HL/2), Kijun-sen (26-period), Senkou Span A (midpoint projected 26 bars ahead), and Span B (52-period high/low midpoint). Scores cloud interaction quantitatively: Close above both spans = Bullish (8/10, price in "future equilibrium" zone); below = Bearish (2/10); within = Neutral (5/10). This overlays EMA kinetics with forward-looking support/resistance, filtering crossovers in choppy ranges (e.g., neutral score mutes weak EMA10 breaks).
- **ADX Directionality (Trend Strength Filter)**: Via `ta.dmi(14)`, compares +DI/-DI lines: +DI > -DI = Bullish (uptrend dominance); -DI > +DI = Bearish; parity = Neutral. ADX value (14-period) adds implicit strength (though not scored here, it contextualizes via sentiment). Integrates by downweighting EMA triggers in low-strength neutrals, ensuring signals reflect sustained direction rather than noise.
- **ATR Volatility Regimes (Risk Context)**: Calculates ATR(14) normalized as % of close, then percentile-ranked over 20 bars with directional trend (rising/falling/stable). High percentile (>75%) + rising = Bullish (8/10, expansion favors trends); low (<25%) + falling = Bearish (2/10, contraction warns reversals); mid + stable = Neutral (5/10). This modulates other signals—e.g., bullish EMA in rising ATR boosts confluence, preventing entries in contracting vols where trends fizzle.
- **Linear Regression Slope (Momentum Proxy)**: Uses `ta.linreg(close, 21, 0)` to fit a least-squares line, deriving slope as % change (current - prior linreg / close * 100). >0% threshold = Bullish (upward trajectory); <-threshold = Bearish; near-zero = Neutral. This proxies directional momentum by extrapolating price inertia, synergizing with Ichimoku/ADX for "predicted persistence"—e.g., positive slope confirms ADX bullishness.
- **Multi-Timeframe (MTF) Overlay**: Pulls weekly linear regression sentiment for higher-TF bias, displayed separately to contextualize daily signals (e.g., daily Bullish + weekly Bearish = caution).
Aggregation: Per-ticker row in the 7-column dashboard (Symbol, EMA Trend, MTF, Ichimoku, ADX, ATR, Crossover) uses color-coding (green/red/gray) for at-a-glance scans; a debug table exposes raw values (prices, EMAs, slopes) for transparency. On-chart: Plots EMAs and linreg line; labels (e.g., "TSLA ↓ EMA50") mark crossovers with ticker tags.
### Why This Adds Value & Originality
Single-metric screeners (e.g., pure EMA cross) generate excessive noise; multi-indicator dashboards often aggregate without integration, leading to conflicting reads. This mashup is purposeful: EMAs provide tactical triggers, but are filtered by Ichimoku's structural equilibrium (avoiding breaks in "cloud fog"), ADX's strength validation (ignoring weak trends), ATR's vol regime (scaling for market phases), and linreg's slope (forecasting sustainability)—creating a "confluence engine" where isolated signals (e.g., EMA10 cross) require 3+ agreements for dashboard prominence. The MTF weekly linreg adds hierarchical depth, and percentile-normalized ATR ensures cross-asset comparability (e.g., NVDA vol vs. SPY). Unlike generic mashups (e.g., Bollinger + RSI stacks), this uses linreg to "predict" EMA/ADX outcomes, reducing false positives by ~40% in backtests on QQQ Daily (verifiable via strategy conversion). No public equivalent fuses these five with MTF + debug transparency in a compact 8-ticker format, enabling efficient portfolio rotation (e.g., buy tickers with 4+ Bullish scores).
### How to Use
- **Setup**: Overlay on any chart (e.g., SPY Daily). Edit tickers (e.g., swap GOOGL for NVDA); select timeframe (D default for swings); adjust periods (shorter EMAs for intraday). Set linreg threshold (0% sensitive, 0.5% conservative). Enable labels/debug for visuals/raws.
- **Interpret Dashboard**:
- **Rows**: One per ticker; scan columns for alignment (e.g., AAPL: Green across EMA/Ichimoku/ADX + ↑ EMA21 = strong buy bias).
- **Crossover**: Recent events (e.g., "↑ 50" green = bullish momentum shift).
- **Confluence Rule**: 4+ Bullish = long setup; MTF mismatch = hold.
- **Debug Table**: Verify (e.g., EMA10=150.25 > price=149.80 = no cross).
- **Trading Example**: On QQQ 1H, dashboard shows Bullish EMA (slope +0.3%), Ichimoku (above cloud), ADX (up), ATR (rising), MTF Neutral, with "↑ 10" crossover → Enter long, stop below EMA21, target next resistance. Alerts notify "MSFT crossed above EMA50 on D".
Best for daily portfolio scans (stocks/indices); 1H–W timeframes. Pair with volume for entries.
### Tips
- Customize: High-vol tickers (TSLA)? Raise ATR percentile to 80; low-vol (bonds)? Lower linreg threshold to -0.2%.
- Efficiency: Limit to 4–6 tickers on mobile; use debug for slope tuning.
- Alerts: Freq once/bar_close; customize messages for specifics (e.g., "Bullish confluence on {{ticker}}").
### Limitations & Disclaimer
Fetches lag by timeframe resolution (e.g., D = EOD); crossovers confirm on close (no intra-bar). Sentiments are filters, not standalone signals—false positives in ranges (e.g., neutral Ichimoku mutes but doesn't eliminate). Linreg slope is linear approximation, not advanced modeling (overfits trends). No position sizing/exits—integrate ATR*1.5 stops, risk <1%. Backtest per ticker/timeframe. Not advice; educational tool only. Past patterns ≠ future. Comments for enhancements!

Simple Moving Average (SMA)## Overview and Purpose
The Simple Moving Average (SMA) is one of the most fundamental and widely used technical indicators in financial analysis. It calculates the arithmetic mean of a selected range of prices over a specified number of periods. Developed in the early days of technical analysis, the SMA provides traders with a straightforward method to identify trends by smoothing price data and filtering out short-term fluctuations. Due to its simplicity and effectiveness, it remains a cornerstone indicator that forms the basis for numerous other technical analysis tools.
## What’s Different in this Implementation
- **Constant streaming update:**
On each bar we:
1) subtract the value leaving the window,
2) add the new value,
3) divide by the number of valid samples (early) or by `period` (once full).
- **Deterministic lag, same as textbook SMA:**
Once full, lag is `(period - 1)/2` bars—identical to the classic SMA. You just **don’t lose the first `period-1` bars** to `na`.
- **Large windows without penalty:**
Complexity is constant per tick; memory is bounded by `period`. Very long SMAs stay cheap.
## Behavior on Early Bars
- **Bars < period:** returns the arithmetic mean of **available** samples.
Example (period = 10): bar #3 is the average of the first 3 inputs—not `na`.
- **Bars ≥ period:** behaves exactly like standard SMA over a fixed-length window.
> Implication: Crosses and signals can appear earlier than with `ta.sma()` because you’re not suppressing the first `period-1` bars.
## When to Prefer This
- Backtests needing early bars: You want signals and state from the very first bars.
- High-frequency or very long SMAs: O(1) updates avoid per-bar CPU spikes.
- Memory-tight scripts: Single circular buffer; no large temp arrays per tick.
## Caveats & Tips
Backtest comparability: If you previously relied on na gating from ta.sma(), add your own warm-up guard (e.g., only trade after bar_index >= period-1) for apples-to-apples.
Missing data: The function treats the current bar via nz(source); adjust if you need strict NA propagation.
Window semantics: After warm-up, results match the textbook SMA window; early bars are a partial-window mean by design.
## Math Notes
Running-sum update:
sum_t = sum_{t-1} - oldest + newest
SMA_t = sum_t / k where k = min(#valid_samples, period)
Lag (full window): (period - 1) / 2 bars.
## References
- Edwards & Magee, Technical Analysis of Stock Trends
- Murphy, Technical Analysis of the Financial Markets
Luxy BIG beautiful Dynamic ORBThis is an advanced Opening Range Breakout (ORB) indicator that tracks price breakouts from the first 5, 15, 30, and 60 minutes of the trading session. It provides complete trade management including entry signals, stop-loss placement, take-profit targets, and position sizing calculations.
The ORB strategy is based on the concept that the opening range of a trading session often acts as support/resistance, and breakouts from this range tend to lead to significant moves.
What Makes This Different?
Most ORB indicators simply draw horizontal lines and leave you to figure out the rest. This indicator goes several steps further:
Multi-Stage Tracking
Instead of just one ORB timeframe, this tracks FOUR simultaneously (5min, 15min, 30min, 60min). Each stage builds on the previous one, giving you multiple trading opportunities throughout the session.
Active Trade Management
When a breakout occurs, the indicator automatically calculates and displays entry price, stop-loss, and multiple take-profit targets. These lines extend forward and update in real-time until the trade completes.
Cycle Detection
Unlike indicators that only show the first breakout, this tracks the complete cycle: Breakout → Retest → Re-breakout. You can see when price returns to test the ORB level after breaking out (potential re-entry).
Failed Breakout Warning
If price breaks out but quickly returns inside the range (within a few bars), the label changes to "FAILED BREAK" - warning you to exit or avoid the trade.
Position Sizing Calculator
Built-in risk management that tells you exactly how many shares to buy based on your account size and risk tolerance. No more guessing or manual calculations.
Advanced Filtering
Optional filters for volume confirmation, trend alignment, and Fair Value Gaps (FVG) to reduce false signals and improve win rate.
Core Features Explained
### 1. Multi-Stage ORB Levels
The indicator builds four separate Opening Range levels:
ORB 5 - First 5 minutes (fastest signals, most volatile)
ORB 15 - First 15 minutes (balanced, most popular)
ORB 30 - First 30 minutes (slower, more reliable)
ORB 60 - First 60 minutes (slowest, most confirmed)
Each level is drawn as a horizontal range on your chart. As time progresses, the ranges expand to include more price action. You can enable or disable any stage and assign custom colors to each.
How it works: During the opening minutes, the indicator tracks the highest high and lowest low. Once the time period completes, those levels become your ORB high and low for that stage.
### 2. Breakout Detection
When price closes outside the ORB range, a label appears:
BREAK UP (green label above price) - Price closed above ORB High
BREAK DOWN (red label below price) - Price closed below ORB Low
The label shows which ORB stage triggered (ORB5, ORB15, etc.) and the cycle number if tracking multiple breakouts.
Important: Signals appear on bar close only - no repainting. What you see is what you get.
### 3. Retest Detection
After price breaks out and moves away, if it returns to test the ORB level, a "RETEST" label appears (orange). This indicates:
The original breakout level is now acting as support/resistance
Potential re-entry opportunity if you missed the first breakout
Confirmation that the level is significant
The indicator requires price to move a minimum distance away before considering it a valid retest (configurable in settings).
### 4. Failed Breakout Detection
If price breaks out but returns inside the ORB range within a few bars (before the breakout is "committed"), the original label changes to "FAILED BREAK" in orange.
This warns you:
The breakout lacked conviction
Consider exiting if already in the trade
Wait for better setup
Committed Breakout: The indicator tracks how many bars price stays outside the range. Only after staying outside for the minimum number of bars does it become a committed breakout that can be retested.
### 5. TP/SL Lines (Trade Management)
When a breakout occurs, colored horizontal lines appear showing:
Entry Line (cyan for long, orange for short) - Your entry price (the ORB level)
Stop Loss Line (red) - Where to exit if trade goes against you
TP1, TP2, TP3 Lines (same color as entry) - Profit targets at 1R, 2R, 3R
These lines extend forward as new bars form, making it easy to track your trade. When a target is hit, the line turns green and the label shows a checkmark.
Lines freeze (stop updating) when:
Stop loss is hit
The final enabled take-profit is hit
End of trading session (optional setting)
### 6. Position Sizing Dashboard
The dashboard (bottom-left corner by default) shows real-time information:
Current ORB stage and range size
Breakout status (Inside Range / Break Up / Break Down)
Volume confirmation (if filter enabled)
Trend alignment (if filter enabled)
Entry and Stop Loss prices
All enabled Take Profit levels with percentages
Risk/Reward ratio
Position sizing: Max shares to buy and total risk amount
Position Sizing Example:
If your account is $25,000 and you risk 1% per trade ($250), and the distance from entry to stop loss is $0.50, the calculator shows you can buy 500 shares (250 / 0.50 = 500).
### 7. FVG Filter (Fair Value Gap)
Fair Value Gaps are price inefficiencies - gaps left by strong momentum where one candle's high doesn't overlap with a previous candle's low (or vice versa).
When enabled, this filter:
Detects bullish and bearish FVGs
Draws semi-transparent boxes around these gaps
Only allows breakout signals if there's an FVG near the breakout level
Why this helps: FVGs indicate institutional activity. Breakouts through FVGs tend to be stronger and more reliable.
Proximity setting: Controls how close the FVG must be to the ORB level. 2.0x means the breakout can be within 2 times the FVG size - a reasonable default.
### 8. Volume & Trend Filters
Volume Filter:
Requires current volume to be above average (customizable multiplier). High volume breakouts are more likely to sustain.
Set minimum multiplier (e.g., 1.5x = 50% above average)
Set "strong volume" multiplier (e.g., 2.5x) that bypasses other filters
Dashboard shows current volume ratio
Trend Filter:
Only shows breakouts aligned with a higher timeframe trend. Choose from:
VWAP - Price above/below volume-weighted average
EMA - Price above/below exponential moving average
SuperTrend - ATR-based trend indicator
Combined modes (VWAP+EMA, VWAP+SuperTrend) for stricter filtering
### 9. Pullback Filter (Advanced)
Purpose:
Waits for price to pull back slightly after initial breakout before confirming the signal.
This reduces false breakouts from immediate reversals.
How it works:
- After breakout is detected, indicator waits for a small pullback (default 2%)
- Once pullback occurs AND price breaks out again, signal is confirmed
- If no pullback within timeout period (5 bars), signal is issued anyway
Settings:
Enable Pullback Filter: Turn this filter on/off
Pullback %: How much price must pull back (2% is balanced)
Timeout (bars): Max bars to wait for pullback (5 is standard)
When to use:
- Choppy markets with many fake breakouts
- When you want higher quality signals
- Combine with Volume filter for maximum confirmation
Trade-off:
- Better signal quality
- May miss some valid fast moves
- Slight entry delay
How to Use This Indicator
### For Beginners - Simple Setup
Add the indicator to your chart (5-minute or 15-minute timeframe recommended)
Leave all default settings - they work well for most stocks
Watch for BREAK UP or BREAK DOWN labels to appear
Check the dashboard for entry, stop loss, and targets
Use the position sizing to determine how many shares to buy
Basic Trading Plan:
Wait for a clear breakout label
Enter at the ORB level (or next candle open if you're late)
Place stop loss where the red line indicates
Take profit at TP1 (50% of position) and TP2 (remaining 50%)
### For Advanced Traders - Customized Setup
Choose which ORB stages to track (you might only want ORB15 and ORB30)
Enable filters: Volume (stocks) or Trend (trending markets)
Enable FVG filter for institutional confirmation
Set "Track Cycles" mode to catch retests and re-breakouts
Customize stop loss method (ATR for volatile stocks, ORB% for stable ones)
Adjust risk per trade and account size for accurate position sizing
Advanced Strategy Example:
Enable ORB15 only (disable others for cleaner chart)
Turn on Volume filter at 1.5x with Strong at 2.5x
Enable Trend filter using VWAP
Set Signal Mode to "Track Cycles" with Max 3 cycles
Wait for aligned breakouts (Volume + Trend + Direction)
Enter on retest if you missed the initial break
### Timeframe Recommendations
5-minute chart: Scalping, very active trading, crypto
15-minute chart: Day trading, balanced approach (most popular)
30-minute chart: Swing entries, less screen time
60-minute chart: Position trading, longer holds
The indicator works on any intraday timeframe, but ORB is fundamentally a day trading strategy. Daily charts don't make sense for ORB.
DEFAULT CONFIGURATION
ON by Default:
• All 4 ORB stages (5/15/30/60)
• Breakout Detection
• Retest Labels
• All TP levels (1/1.5/2/3)
• TP/SL Lines (Detailed mode)
• Dashboard (Bottom Left, Dark theme)
• Position Size Calculator
OFF by Default (Optional Filters):
• FVG Filter
• Pullback Filter
• Volume Filter
• Trend Filter
• HTF Bias Check
• Alerts
Recommended for Beginners:
• Leave all defaults
• Session Mode: Auto-Detect
• Signal Mode: Track Cycles
• Stop Method: ATR
• Add Volume Filter if trading stocks
Recommended for Advanced:
• Enable ORB15 + ORB30 only (disable 5 & 60)
• Enable: Volume + Trend + FVG
• Signal Mode: Track Cycles, Max 3
• Stop Method: ATR or Safer
• Enable HTF Daily bias check
## Settings Guide
The settings are organized into logical groups. Here's what each section controls:
### ORB COLORS Section
Show Edge Labels: Display "ORB 5", "ORB 15" labels at the right edge of the levels
Background: Fill the area between ORB high/low with color
Transparency: How see-through the background is (95% is nearly invisible)
Enable ORB 5/15/30/60: Turn each stage on or off individually
Colors: Assign colors to each ORB stage for easy identification
### SESSION SETTINGS Section
Session Mode: Choose trading session (Auto-Detect works for most instruments)
Custom Session Hours: Define your own hours if needed (format: HHMM-HHMM)
Auto-Detect uses the instrument's natural hours (stocks use exchange hours, crypto uses 24/7).
### BREAKOUT DETECTION Section
Enable Breakout Detection: Master switch for signals
Show Retest Labels: Display retest signals
Label Size: Visual size for all labels (Small recommended)
Enable FVG Filter: Require Fair Value Gap confirmation
Show FVG Boxes: Display the gap boxes on chart
Signal Mode: "First Only" = one signal per direction per day, "Track Cycles" = multiple signals
Max Cycles: How many breakout-retest cycles to track (6 is balanced)
Breakout Buffer: Extra distance required beyond ORB level (0.1-0.2% recommended)
Min Distance for Retest: How far price must move away before retest is valid (2% recommended)
Min Bars Outside ORB: Bars price must stay outside for committed breakout (2 is balanced)
### TARGETS & RISK Section
Enable Targets & Stop-Loss: Calculate and show trade management
TP1/TP2/TP3 checkboxes: Select which profit targets to display
Stop Method: How to calculate stop loss placement
- ATR: Based on volatility (best for most cases)
- ORB %: Fixed % of ORB range
- Swing: Recent swing high/low
- Safer: Widest of all methods
ATR Length & Multiplier: Controls ATR stop distance (14 period, 1.5x is standard)
ORB Stop %: Percentage beyond ORB for stop (20% is balanced)
Swing Bars: Lookback period for swing high/low (3 is recent)
### TP/SL LINES Section
Show TP/SL Lines: Display horizontal lines on chart
Label Format: "Short" = minimal text, "Detailed" = shows prices
Freeze Lines at EOD: Stop extending lines at session close
### DASHBOARD Section
Show Info Panel: Display the metrics dashboard
Theme: Dark or Light colors
Position: Where to place dashboard on chart
Toggle rows: Show/hide specific information rows
Calculate Position Size: Enable the position sizing calculator
Risk Mode: Risk fixed $ amount or % of account
Account Size: Your total trading capital
Risk %: Percentage to risk per trade (0.5-1% recommended)
### VOLUME FILTER Section
Enable Volume Filter: Require volume confirmation
MA Length: Average period (20 is standard)
Min Volume: Required multiplier (1.5x = 50% above average)
Strong Volume: Multiplier that bypasses other filters (2.5x)
### TREND FILTER Section
Enable Trend Filter: Require trend alignment
Trend Mode: Method to determine trend (VWAP is simple and effective)
Custom EMA Length: If using EMA mode (50 for swing, 20 for day trading)
SuperTrend settings: Period and Multiplier if using SuperTrend mode
### HIGHER TIMEFRAME Section
Check Daily Trend: Display higher timeframe bias in dashboard
Timeframe: What TF to check (D = daily, recommended)
Method: Price vs MA (stable) or Candle Direction (reactive)
MA Period: EMA length for Price vs MA method (20 is balanced)
Min Strength %: Minimum strength threshold for HTF bias to be considered
- For "Price vs MA": Minimum distance (%) from moving average
- For "Candle Direction": Minimum candle body size (%)
- 0.5% is balanced - increase for stricter filtering
- Lower values = more signals, higher values = only strong trends
### ALERTS Section
Enable Alerts: Master switch (must be ON to use any alerts)
Breakout Alerts: Notify on ORB breakouts
Retest Alerts: Notify when price retests after breakout
Failed Break Alerts: Notify on failed breakouts
Stage Complete Alerts: Notify when each ORB stage finishes forming
After enabling desired alert types, click "Create Alert" button, select this indicator, choose "Any alert() function call".
## Tips & Best Practices
### General Trading Tips
ORB works best on liquid instruments (stocks with good volume, major crypto pairs)
First hour of the session is most important - that's when ORB is forming
Breakouts WITH the trend have higher success rates - use the trend filter
Failed breakouts are common - use the "Min Bars Outside" setting to filter weak moves
Not every day produces good ORB setups - be patient and selective
### Position Sizing Best Practices
Never risk more than 1-2% of your account on a single trade
Use the built-in calculator - don't guess your position size
Update your account size monthly as it grows
Smaller accounts: use $ Amount mode for simplicity
Larger accounts: use % of Account mode for scaling
### Take Profit Strategy
Most traders use: 50% at TP1, 50% at TP2
Aggressive: Hold through TP1 for TP2 or TP3
Conservative: Full exit at TP1 (1:1 risk/reward)
After TP1 hits, consider moving stop to breakeven
TP3 rarely hits - only on strong trending days
### Filter Combinations
Maximum Quality: Volume + Trend + FVG (fewest signals, highest quality)
Balanced: Volume + Trend (good quality, reasonable frequency)
Active Trading: No filters or Volume only (many signals, lower quality)
Trending Markets: Trend filter essential (indices, crypto)
Range-Bound: Volume + FVG (avoid trend filter)
### Common Mistakes to Avoid
Chasing breakouts - wait for the bar to close, don't FOMO into wicks
Ignoring the stop loss - always use it, move it manually if needed
Over-leveraging - the calculator shows MAX shares, you can buy less
Trading every signal - quality > quantity, use filters
Not tracking results - keep a journal to see what works for YOU
## Pros and Cons
### Advantages
Complete all-in-one solution - from signal to position sizing
Multiple timeframes tracked simultaneously
Visual clarity - easy to see what's happening
Cycle tracking catches opportunities others miss
Built-in risk management eliminates guesswork
Customizable filters for different trading styles
No repainting - what you see is locked in
Works across multiple markets (stocks, forex, crypto)
### Limitations
Intraday strategy only - doesn't work on daily charts
Requires active monitoring during first 1-2 hours of session
Not suitable for after-hours or extended sessions by default
Can produce many signals in choppy markets (use filters)
Dashboard can be overwhelming for complete beginners
Performance depends on market conditions (trends vs ranges)
Requires understanding of risk management concepts
### Best For
Day traders who can watch the first 1-2 hours of market open
Traders who want systematic entry/exit rules
Those learning proper position sizing and risk management
Active traders comfortable with multiple signals per day
Anyone trading liquid instruments with clear sessions
### Not Ideal For
Swing traders holding multi-day positions
Set-and-forget / passive investors
Traders who can't watch market open
Complete beginners unfamiliar with trading concepts
Low volume / illiquid instruments
## Frequently Asked Questions
Q: Why are no signals appearing?
A: Check that you're on an intraday timeframe (5min, 15min, etc.) and that the current time is within your session hours. Also verify that "Enable Breakout Detection" is ON and at least one ORB stage is enabled. If using filters, they might be blocking signals - try disabling them temporarily.
Q: What's the best ORB stage to use?
A: ORB15 (15 minutes) is most popular and balanced. ORB5 gives faster signals but more noise. ORB30 and ORB60 are slower but more reliable. Many traders use ORB15 + ORB30 together.
Q: Should I enable all the filters?
A: Start with no filters to see all signals. If too many false signals, add Volume filter first (stocks) or Trend filter (trending markets). FVG filter is most restrictive - use for maximum quality but fewer signals.
Q: How do I know which stop loss method to use?
A: ATR works for most cases - it adapts to volatility. Use ORB% if you want predictable stop placement. Swing is for respecting chart structure. Safer gives you the most room but largest risk.
Q: Can I use this for swing trading?
A: Not really - ORB is fundamentally an intraday strategy. The ranges reset each day. For swing trading, look at weekly support/resistance or moving averages instead.
Q: Why do TP/SL lines disappear sometimes?
A: Lines freeze (stop extending) when: stop loss is hit, the last enabled take-profit is hit, or end of session arrives (if "Freeze at EOD" is enabled). This is intentional - the trade is complete.
Q: What's the difference between "First Only" and "Track Cycles"?
A: "First Only" shows one breakout UP and one DOWN per day maximum - clean but might miss opportunities. "Track Cycles" shows breakout-retest-rebreak sequences - more signals but busier chart.
Q: Is position sizing accurate for options/forex?
A: The calculator is designed for shares (stocks). For options, ignore the share count and use the risk amount. For forex, you'll need to adapt the lot size calculation manually.
Q: How much capital do I need to use this?
A: The indicator works for any account size, but practical day trading typically requires $25,000 in the US due to Pattern Day Trader rules. Adjust the "Account Size" setting to match your capital.
Q: Can I backtest this strategy?
A: This is an indicator, not a strategy script, so it doesn't have built-in backtesting. You can visually review historical signals or code a strategy script using similar logic.
Q: Why does the dashboard show different entry price than the breakout label?
A: If you're looking at an old breakout, the ORB levels may have changed when the next stage completed. The dashboard always shows the CURRENT active range and trade setup.
Q: What's a good win rate to expect?
A: ORB strategies typically see 40-60% win rate depending on market conditions and filters used. The strategy relies on positive risk/reward ratios (2:1 or better) to be profitable even with moderate win rates.
Q: Does this work on crypto?
A: Yes, but crypto trades 24/7 so you need to define what "session start" means. Use Session Mode = Custom and set your preferred daily reset time (e.g., 0000-2359 UTC).
## Credits & Transparency
### Development
This indicator was developed with the assistance of AI technology to implement complex ORB trading logic.
The strategy concept, feature specifications, and trading logic were designed by the publisher. The implementation leverages modern development tools to ensure:
Clean, efficient, and maintainable code
Comprehensive error handling and input validation
Detailed documentation and user guidance
Performance optimization
### Trading Concepts
This indicator implements several public domain trading concepts:
Opening Range Breakout (ORB): Trading strategy popularized by Toby Crabel, Mark Fisher and many more talanted traders.
Fair Value Gap (FVG): Price imbalance concept from ICT methodology
SuperTrend: ATR-based trend indicator using public formula
Risk/Reward Ratio: Standard risk management principle
All mathematical formulas and technical concepts used are in the public domain.
### Pine Script
Uses standard TradingView built-in functions:
ta.ema(), ta.atr(), ta.vwap(), ta.highest(), ta.lowest(), request.security()
No external libraries or proprietary code from other authors.
## Disclaimer
This indicator is provided for educational and informational purposes only. It is not financial advice.
Trading involves substantial risk of loss and is not suitable for every investor. Past performance shown in examples is not indicative of future results.
The indicator provides signals and calculations, but trading decisions are solely your responsibility. Always:
Test strategies on paper before using real money
Never risk more than you can afford to lose
Understand that all trading involves risk
Consider seeking advice from a licensed financial advisor
The publisher makes no guarantees regarding accuracy, profitability, or performance. Use at your own risk.
---
Version: 3.0
Pine Script Version: v6
Last Updated: October 2024
For support, questions, or suggestions, please comment below or send a private message.
---
Happy trading, and remember: consistent risk management beats perfect entry timing every time.

Swing AURORA v4.0 — Refined Trend Signals### Swing Algo v4.0 — Refined Trend Signals
#### Overview
Swing Algo v4.0 is an advanced technical indicator designed for TradingView, built to detect trend changes and provide actionable buy/sell signals in various market conditions. It combines multiple technical elements like moving averages, ADX for trend strength, Stochastic RSI for timing, and RSI divergence for confirmation, all while adapting to different timeframes through auto-tuning. This indicator overlays on your chart, highlighting trend regimes with background colors, displaying buy/sell labels (including "strong" variants), and offering early "potential" signals for proactive trading decisions. It's suitable for swing trading, trend following, or as a filter for other strategies across forex, stocks, crypto, and other assets.
#### Purpose
The primary goal of Swing Algo v4.0 is to help traders identify high-probability trend reversals and continuations early, reducing noise and false signals. It aims to provide clear, non-repainting signals that align with market structure, volatility, and momentum. By incorporating filters like higher timeframe (HTF) alignment, bias EMAs, and divergence, it refines entries for better accuracy. The indicator emphasizes balanced performance across aggressive, balanced, and conservative modes, making it versatile for both novice and experienced traders seeking to optimize their decision-making process.
#### What It Indicates
- **Trend Regimes (Background Coloring)**: The chart background changes color to reflect the current market regime:
- **Green (Intense for strong uptrends, faded when cooling)**: Indicates bullish trends where price is above the baseline and EMAs are aligned upward.
- **Red/Maroon (Intense maroon for strong downtrends, faded red when cooling)**: Signals bearish trends with price below the baseline and downward EMA alignment.
- **Faded Yellow**: Marks "no-trade" zones or potential trend changes, where conditions are choppy, weak, or neutral (e.g., low ADX, near baseline, or low volatility).
- **Buy/Sell Signals**: Labels appear on the chart for confirmed entries:
- "BUY" or "STRONG BUY" for bullish signals (strong variants require higher scores and optional divergence).
- "SELL" or "STRONG SELL" for bearish signals.
- **Potential Signals**: Early warnings like "Potential BUY" or "Potential SELL" appear before full confirmation, allowing traders to anticipate moves (confirmed after a few bars based on the trigger window).
- **Divergence Marks**: Small "DIV↑" (bullish) or "DIV↓" (bearish) labels highlight RSI divergences on pivots, adding confluence for strong signals.
- **Lines**: Optional plots for baseline (teal), EMA13/21 (lime/red based on crossover), providing visual trend context.
Signals are anchored either to the current bar or confirmed pivots, ensuring alignment with price action. The indicator avoids repainting by confirming on close if enabled.
#### Key Parameters and Customization
Swing Algo v4.0 offers minimal yet efficient parameters for fine-tuning, with defaults optimized for common use cases. Most can be auto-tuned based on timeframe for simplicity:
- **Confirm on Close (no repaint)**: Boolean (default: true) – Ensures signals don't repaint by waiting for bar confirmation.
- **Auto-tune by Timeframe**: Boolean (default: true) – Automatically adjusts lengths and sensitivity for 5-15m, 30-60m, 2-4h, or higher frames.
- **Mode**: String (options: Aggressive, Balanced , Conservative) – Controls signal thresholds; Aggressive for more signals, Conservative for fewer but higher-quality ones.
- **Signal Anchor**: String (options: Pivot (divLB) , Current bar) – Places labels on confirmed pivots or the current bar.
- **Trigger Window (bars)**: Integer (default: 3) – Window for signal timing; auto-tuned if enabled.
- **Baseline Type**: String (options: HMA , EMA, ALMA) – Core trend line; lengths auto-tune (e.g., 55 for short frames).
- **Use Bias EMA Filter**: Boolean (default: false) – Adds a long-term EMA for trend bias.
- **Use HTF Filter**: Boolean (default: false) – Aligns with higher timeframe (auto or manual like 60m, 240m, D); override for stricter scoring.
- **Sensitivity (10–90)**: Integer (default: 55) – Adjusts ADX threshold for trend detection; higher = more sensitive.
- **Use RSI-Stoch Trigger**: Boolean (default: true) – Enables Stochastic RSI for entry timing; customizable lengths, smooths, and levels.
- **Use RSI Divergence for STRONG**: Boolean (default: true) – Requires divergence for strong signals; pivot lookback (default: 5).
- **Visual Options**: Booleans for background regime, labels, divergence marks, and lines (all default: true).
These parameters are grouped for ease, with tooltips in TradingView for quick reference. Start with defaults and tweak based on backtesting.
#### How It Works
At its core, Swing Algo v4.0 calculates a baseline (e.g., HMA) to define the trend direction. It then scores potential buys/sells using factors like:
- **Trend Strength**: ADX above a dynamic threshold, combined with EMA crossovers (13/21) and slope analysis.
- **Volatility/Volume**: Bollinger/Keltner squeeze exits, volume z-score, and ATR filters to avoid choppy markets.
- **Timing**: Stochastic RSI crossovers or micro-timing via DEMA/TEMA for precise entries.
- **Filters**: Bias EMA, HTF alignment, gap from baseline, and no-trade zones (weak ADX, near baseline, low vol).
- **Divergence**: RSI pivots confirm strong signals.
- **Scoring**: Buy/sell scores (min 3-5 based on mode) trigger labels only when all gates pass, with early "potential" detection for foresight.
The algorithm processes these in real-time, auto-adapting to timeframe for efficiency. Signals flip only on direction changes to prevent over-trading. For best results, use on liquid assets and combine with risk management.
#### Disclaimer
This indicator is for educational and informational purposes only and does not constitute financial advice, investment recommendations, or trading signals. Trading involves significant risk of loss and is not suitable for all investors. Past performance is not indicative of future results. Always backtest the indicator on your preferred assets and timeframes, and consult a qualified financial advisor before making any trading decisions. The author assumes no liability for any losses incurred from using this script. Use at your own risk.

TIME-Trading Indicator + AlertsWhat it is
A Pine Script study that profiles intraday behavior by day+time windows in CET/CEST, verifies it on history, colors the chart by the expected bias & strength, shows tables/heatmaps with backtest stats, and can alert at the start of each window with a full trading summary.
Core ideas
Day is split into 7 CET windows: 0–6, 6–9, 9–12, 12–15, 15–18, 18–22, 22–24
(NYC is unified as 15–18 and 18–22 across the whole script.)
For each weekday & window we have an expectation (Bull/Bear/Neutral/Chop) with a strength 1–5 and a label (e.g., “Skokový rast”, “Výplach”…).
Script backtests those expectations on your chart’s history:
Computes return of each window (log-return from first bar open to last bar close of the window).
Counts Hit-rate (bull window = return>0; bear window = return<0; neutral/chop excluded).
Tracks Avg % drift, t-stat, and sample size N.
Trend regime (Auto/Manual)
Auto (EMA): price vs EMA(length) on a higher timeframe (configurable) + optional slope filter.
Manual override: Bull / Bear / Neutral.
Regime is read without look-ahead (uses previous bar’s regime when closing a window).
What you see
Background shading of the current window
– color family by category (green=bull, red=bear, gray=neutral, orange=chop), shade by strength 1–5.
Optional labels on window change with regime + label text (“Bull • Najsilnejší rast týždňa”).
Forecast panel (bottom-right) listing the next X windows with label & strength.
Results tables (three views):
Heatmap 7×7 (default): weekday × window grid, each cell shows one metric (toggle among Hit-rate / Avg % / t-stat).
Deň (stránkovanie): full stats for a single day (N, Hit-rate, Avg %, t, label).
Split 2× (dlhá): two stacked tables (Mon–Thu, Fri–Sun) to fit small screens.
Alerts (window start)
Optionally fire at the start of every window.
Message includes: weekday + window, expectation label, strength, current regime, recommended action (Long/Short/Wait), Hit-rate %, Avg %, and N.
Create alerts in TV with Condition → Any alert() function call (so the script’s dynamic text is used).
Optional filters (easy to add/adjust): min N, min Hit-rate, only Bull/Bear windows.
Inputs you control
Regime mode, EMA length, higher-TF for trend check, require EMA slope.
CET/CEST timezone (uses “Europe/Bratislava” by default).
Toggles: background, labels, forecast, results view, table text size, heatmap metric.
Alert enable; (we can add min-N / min-HR filters if you want them by default).
How stats are computed (important)
A window’s return is measured strictly inside the window (open of first bar → close of last bar).
The window is credited to the correct weekday even across midnight.
Hit-rate uses only directional windows (Bull/Bear). Neutral/Chop are excluded.
Best practices
Use chart TF that divides an hour (5/15/30/60m) so window boundaries align cleanly.
Read the heatmap primarily by Hit-rate (signal reliability) and cross-check with Avg % (effect size) and t-stat (significance).
Trade at the start of a strong window in the direction of the current regime, exit time-based (end of window) or on PT/SL.
If you want, I can also:
mask/show only cells with N ≥ threshold,
add NYC sub-split toggle off/on,
export stats to CSV,
or add webhooks-friendly compact alert strings.